ppl corporation poised for growth. investing in our future. · ppl corporation poised for growth....
TRANSCRIPT

© PPL Corporation 2016
PPL CORPORATION
Poised for growth.
Investing in our future.
EEI Financial Conference • November 6-9, 2016 • Phoenix, AZ
© PPL Corporation 2016
Cautionary statements and factors
that may affect future results
1
Any statements made in this presentation about future
operating results or other future events are forward-looking
statements under the Safe Harbor Provisions of the Private
Securities Litigation Reform Act of 1995. Actual results may
differ materially from such forward-looking statements. A
discussion of factors that could cause actual results or events
to vary is contained in the Appendix to this presentation and in
the Company’s SEC filings.
© PPL Corporation 2016
Investment proposition
2
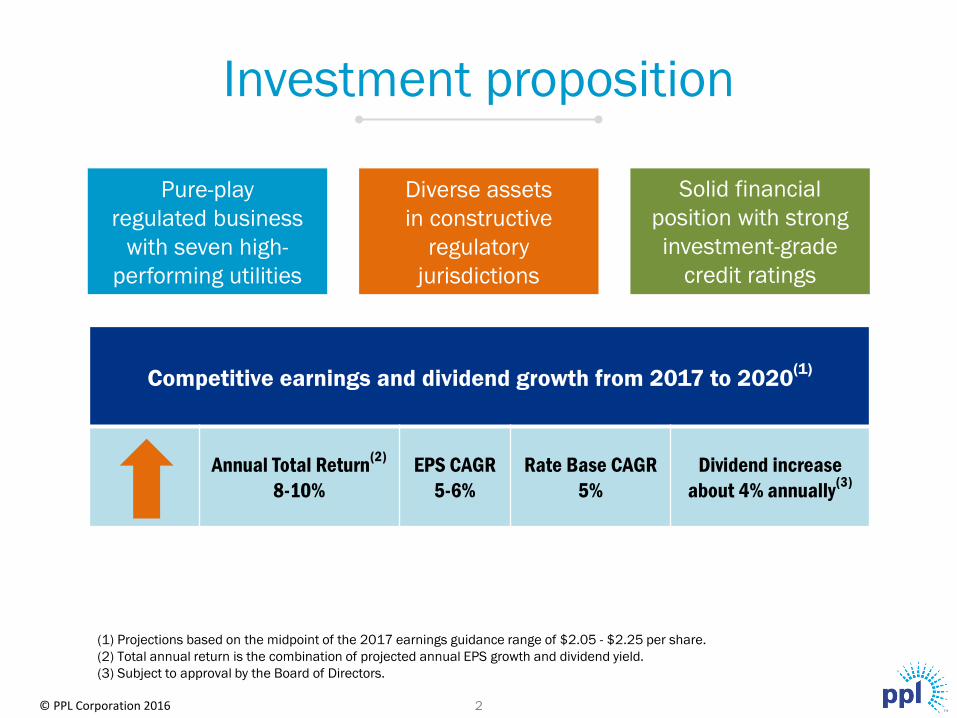
(1) Projections based on the midpoint of the 2017 earnings guidance range of $2.05 - $2.25 per share.
(2) Total annual return is the combination of projected annual EPS growth and dividend yield.
(3) Subject to approval by the Board of Directors.
Pure-play
regulated business
with seven high-
performing utilities
Diverse assets
in constructive
regulatory
jurisdictions
Solid financial
position with strong
investment-grade
credit ratings
Competitive earnings and dividend growth from 2017 to 2020(1)
Annual Total Return(2)
8-10%
EPS CAGR
5-6%
Rate Base CAGR
5%
Dividend increase
about 4% annually(3)

© PPL Corporation 2016
PPL offers leading energy delivery
platform with scale and diversity
3
PENNSYLVANIA KENTUCKY UNITED KINGDOM
Customers 1.4M 1.2M (0.9M electric; 0.3M gas) 7.8M
Return on Equity No stated ROE for
D base rates; 11.68% for T
No stated ROE for base rates;
10% and 9.8% for ECR(1)
Average expected earned
ROE of 12-14%(2)
Rate Base as of 12/31/16 $6.0B $9.1B $8.8B
2017-2020 Rate Base CAGR 10% T; 3.2% D 3.2% 5.4%
Generation None 8GW (regulated capacity) None
% of EPS(3) 23% 28% 54%
D = Distribution T = Transmission ECR = Environmental Cost Recovery
(1) The existing Environmental Cost Recovery Mechanism and Gas Line Tracker were awarded a 10% ROE. The $1 billion environmental plan approved in August 2016 was
awarded a 9.8% ROE.
(2) Based on 2017-2020 Segment earnings projections. Capital structure adjusted to include debt of $750 million allocated for Segment reporting purposes.
(3) Based on $2.15 midpoint of 2017 earnings forecast. Corporate and Other, not shown, accounts for -5% of 2017 EPS forecast.

© PPL Corporation 2016
U.K. a premium regulatory jurisdiction
• Base revenues set for 8 years; commencing April 2015 through March
2023
• Offers real-time returns and provides certainty and visibility
• Revenues adjusted for inflation
• Incentives available for strong performance and innovation, with WPD a
consistent top performer
• Fast-track incentive adds $35 million annually in revenue
• As the only fast-tracked DNOs, WPD companies able to retain 70% of cost
efficiencies
• Regulation requires funding to support investment-grade credit ratings
• No equity needed from PPL to fund U.K. operations
4

© PPL Corporation 2016
PPL strategy focuses on
sustainable, competitive growth
• Operate high-performing utilities in
premium jurisdictions
• Deliver industry-leading customer
service and reliability
• Invest responsibly in the future
• Effectively manage O&M
• Earn ROEs near authorized levels
and recover investments in a
timely manner
• Maintain strong financial metrics
5

© PPL Corporation 2016
Delivering strong performance in 2016
Well-positioned
to deliver on 2016
EPS forecast
On pace to execute
over $3 billion in
infrastructure investment
On track to achieve
2016/17 incentive targets
in the U.K.
Recipients of three
new J.D. Power awards
for customer satisfaction
$471 million smart meter
replacement project
set to begin in PA
$1 billion Environmental
Cost Recovery plan
approved by KY PSC
6

© PPL Corporation 2016
1.05 1.01 1.00 1.01 1.06
0.40 0.35 0.44 0.40 0.35
0.55 0.59 0.55 0.58 0.67
0.70 0.69 0.66 0.60 0.63
0.46 0.43 0.39 0.39
0.39
$0.00
$0.50
$1.00
$1.50
$2.00
$2.50
$3.00
$3.50
2016E 2017E 2018E 2019E 2020E
WPD LKE ECR LKE base PA Transmission PA Distribution
$3.16 $3.07 $3.04 $2.98 $3.10
(1) (2)
$15 billion in capital expenditures
planned
7
(1) Based on assumed exchange rate of $1.37/£ for 2016 and $1.30/£ for 2017-2020.
(2) Expect between 80% and 90% to receive timely returns via ECR mechanism based on historical experience and future projections.
($ in
Bill
ion
s)
© PPL Corporation 2016
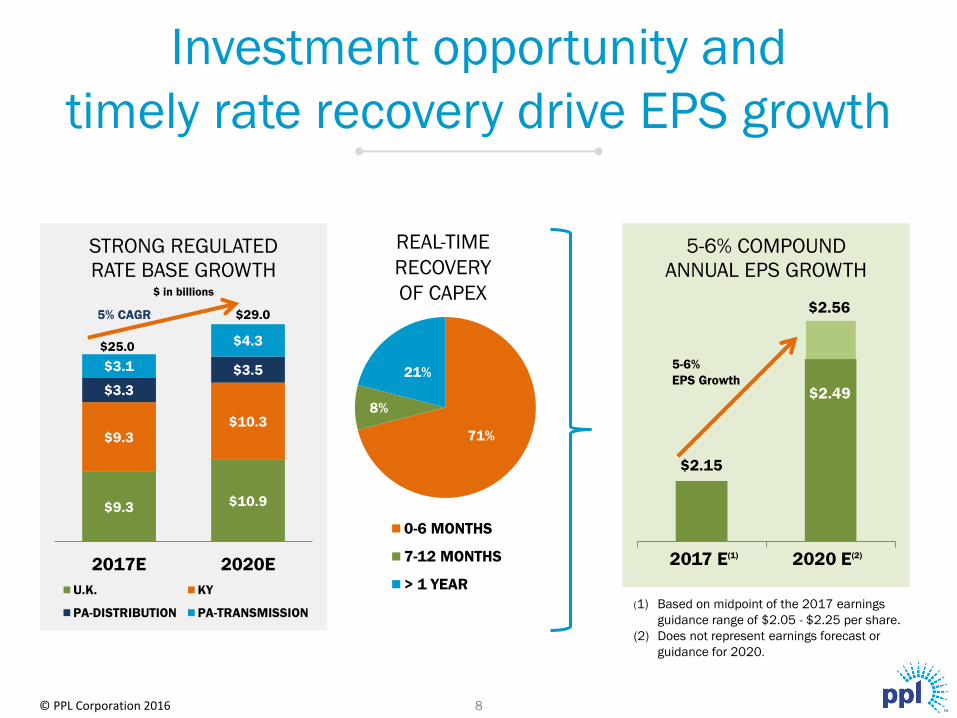
$2.15
$2.56
5-6% COMPOUND
ANNUAL EPS GROWTH
Investment opportunity and
timely rate recovery drive EPS growth
(1) Based on midpoint of the 2017 earnings
guidance range of $2.05 - $2.25 per share.
(2) Does not represent earnings forecast or
guidance for 2020.
$2.49
$9.3 $10.9
$9.3 $10.3
$3.3
$3.5 $3.1
$4.3
2017E 2020E
STRONG REGULATED
RATE BASE GROWTH
U.K. KY
PA-DISTRIBUTION PA-TRANSMISSION
5% CAGR
5-6%
EPS Growth
71%
8%
21%
0-6 MONTHS
7-12 MONTHS
> 1 YEAR
REAL-TIME
RECOVERY
OF CAPEX
8
2017 E(1) 2020 E(2)
$25.0
$29.0
$ in billions
© PPL Corporation 2016
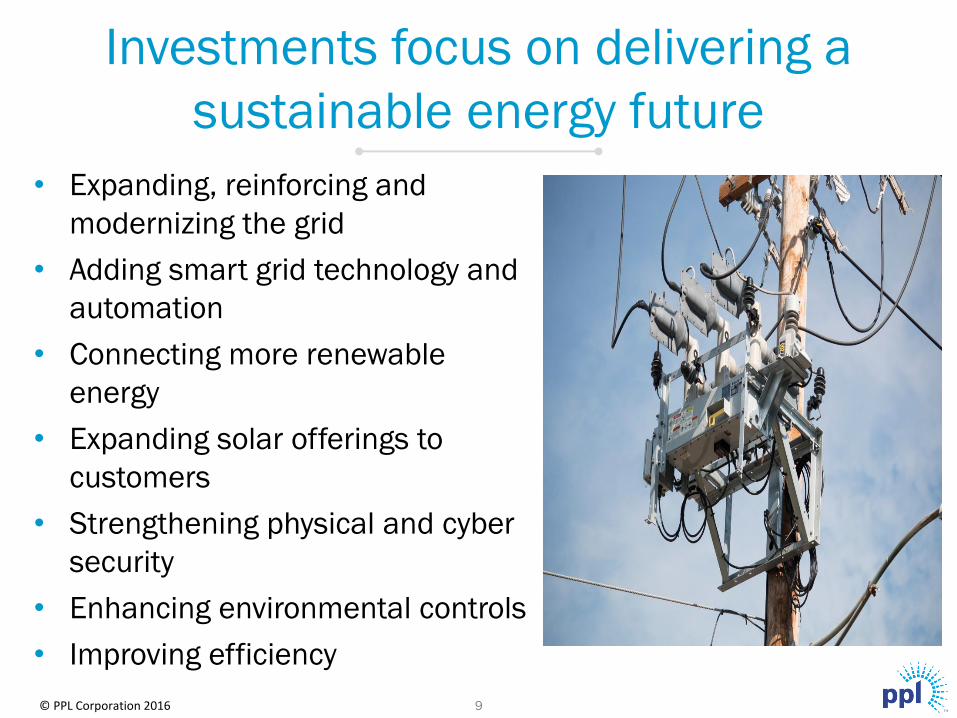
Investments focus on delivering a
sustainable energy future
9
• Expanding, reinforcing and
modernizing the grid
• Adding smart grid technology and
automation
• Connecting more renewable
energy
• Expanding solar offerings to
customers
• Strengthening physical and cyber
security
• Enhancing environmental controls
• Improving efficiency

© PPL Corporation 2016
“Leading the way” in the U.K.
10
• Connected or offered to connect
20 GW of renewable energy
• Connected approximately
200,000 private solar
installations
• Offering innovative demand-side
response solutions
• Conducting the world’s largest
electric vehicle trial
• Adapting to role as a more active
network operator
© PPL Corporation 2016
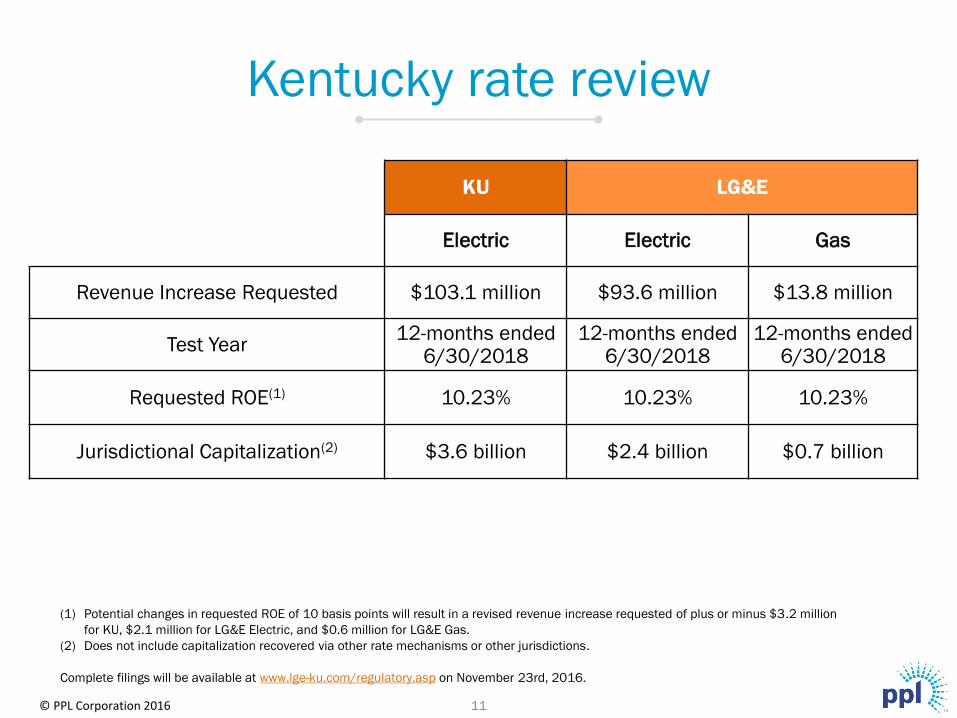
Kentucky rate review
11
KU LG&E
Electric Electric Gas
Revenue Increase Requested $103.1 million $93.6 million $13.8 million
Test Year 12-months ended
6/30/2018 12-months ended
6/30/2018 12-months ended
6/30/2018
Requested ROE(1) 10.23% 10.23% 10.23%
Jurisdictional Capitalization(2) $3.6 billion $2.4 billion $0.7 billion
(1) Potential changes in requested ROE of 10 basis points will result in a revised revenue increase requested of plus or minus $3.2 million
for KU, $2.1 million for LG&E Electric, and $0.6 million for LG&E Gas.
(2) Does not include capitalization recovered via other rate mechanisms or other jurisdictions.
Complete filings will be available at www.lge-ku.com/regulatory.asp on November 23rd, 2016.

© PPL Corporation 2016
Summary
12
• Growing, pure-play regulated business operating
in premium jurisdictions
• 5-6% projected earnings growth from 2017 - 2020, with
above-average dividend yield
• Strong dividend growth potential
• Targeting 8 - 10% total annual returns(1)
• Investing in the future and improving efficiency
• Confident in our ability to deliver on commitments to
shareowners and customers
(1) Total annual return is the combination of annual EPS growth and dividend yield.

© PPL Corporation 2016
APPENDIX
13

© PPL Corporation 2016
CORPORATE DATA
Ticker symbol and stock exchange PPL-NYSE
At October 31, 2016
Average daily trading volume (3 mos.) 4.66 million shares
Closing price $34.34
52-week price range $32.08 – $39.92
Annualized dividend per share $1.52 ($0.38/qtr)
Enterprise value ~$42.0 billion
Market cap ~$23.3 billion
At September 30, 2016
2016 Estimated earnings from ongoing
operations per share (Non-GAAP)-Midpoint(1)
$2.38 per share
Total assets $38.0 billion
Common shares O/S 679.268 million
Book value per share(2) $14.69
Capitalization: ($ millions)
Total debt $19,148 66%
Common equity $ 9,975 34%
Total Capitalization $29,123 100%
Employees ~12,800
Long-term debt $18,512 million
Short-term debt $636 million
Letters of Credit and Commercial paper $486 million
ANALYST CONTACT:
Investor Relations
Joe Bergstein – Vice President-Investor
Relations & Treasurer
610-774-5609
Lisa Pammer – Investor Relations Manager
610-774-3316
WEB SITE: www.pplweb.com
Download our IR APP:
PPL Corporation Investor Relations
(1) See Appendix for the reconciliation of reported earnings (loss) to earnings from ongoing
operations.
(2) Based on 679.268 million shares of common stock outstanding.
PPL fact sheet
14

Learn more about
PPL’s Sustainability Efforts
Visit www.pplsustainability.com
15 © PPL Corporation 2016

© PPL Corporation 2016
$0.00
$1.00
$2.00
$3.00
2015A Previous 2016E Revised 2016E 2017E
$/S
ha
re
$2.21
Note: See Appendix for the reconciliation of reported earnings (loss) to earnings from ongoing operations.
(1) Excludes any earnings from the former Supply segment, which was part of PPL Corporation’s consolidated reported earnings for the
first five months of 2015.
(2) Forecast assumes $1.30/£ exchange rate on remaining unhedged earnings for 2016 through 2019. See slide 8 for further details.
Segment
2015A
Earnings from
Ongoing
Operations
Previous 2016E
Earnings from
Ongoing
Operations
(Midpoint)
Revised 2016E
Earnings from
Ongoing
Operations
(Midpoint)
2017E
Earnings
(Midpoint)
U.K. Regulated $1.44 $1.41 $1.41 $1.17
Kentucky Regulated 0.51 0.57 0.58 0.59
PA Regulated 0.37 0.47 0.49 0.49
Corporate and Other (0.11) (0.10) (0.10) (0.10)
Total $2.21 $2.35 $2.38 $2.15
$2.45
$2.25
(2)
$2.25
$2.05
(1)
(2) (2)
$2.45
$2.30
5-6% Compound Annual EPS Growth
from 2017 to 2020
Targeting annual dividend growth of
about 4% in 2017 through 2020
Increasing 2016 earnings forecast
16

© PPL Corporation 2016
$0.06 $0.01 $0.02 $0.00 ($0.06)
$1.41 $1.41
$0.57 $0.58
$0.47 $0.49
($0.10) ($0.10)
$(0.20)
$0.20
$0.60
$1.00
$1.40
$1.80
$2.20
$2.60
2016 Previous
Midpoint
U.K.
Regulated
KY
Regulated
PA
Regulated
Corp &
Other
Other 2016 Revised
Midpoint
$/S
ha
re
U.K. Regulated KY Regulated PA Regulated Corp & Other
$2.38
Margins. $.02
O&M: $.03
Interest: $.01
Taxes: $.02
Currency: ($.02)
Margins: ($.02)
O&M: $.02
Depreciation: $.01
Margins: $.01
O&M: ($.01)
Interest: $.02
FX Restrikes: ($.06)
2016 prior guidance
to current forecast walk
$2.35
17
Note: See Appendix for the reconciliation of reported earnings (loss) to earnings from ongoing operations and definition of Non-GAAP financial
measures.

© PPL Corporation 2016
Summary of drivers to achieve 5-6% EPS
growth from 2017 through 2020
Key Earnings Growth Assumptions: • Updated in June for foreign currency, interest rates, RPI and lower discount rates
• Dividend secure with targeted growth of about 4% through 2020(1)
6 - 8% Domestic Utilities Earnings Growth: • Domestic rate base growth of ~5% from 2017 through 2020
• Minimal load growth
• PA Transmission Cap Ex of $1.9 billion at 11.68% base ROE
• KY Environmental investment of $1.2 billion at ~10% ROE
4 - 6% U.K. Regulated Earnings Growth: • No volumetric risk
• $1.30/£ foreign currency rate assumed for all unhedged positions
• Expected RAV growth of 5.4% from 2017 through 2020
• Average expected segment ROE’s of 12 – 14%(2)
• Incentive revenue assumptions: 2017: $85M; 2018: $80M - $100M; and 2019 - 2020: $95M - $115M
• RPI (inflation rate) – 2.9% for 2017; 3.1% for 2018 - 2019; and 3.2% for 2020
• Effective tax rate of approximately 17%
(1) Subject to approval by the Board of Directors.
(2) Based on 2017-2020 Segment earnings projections. Capital structure adjusted to include debt of $750 million that is allocated
for Segment reporting purposes.
18
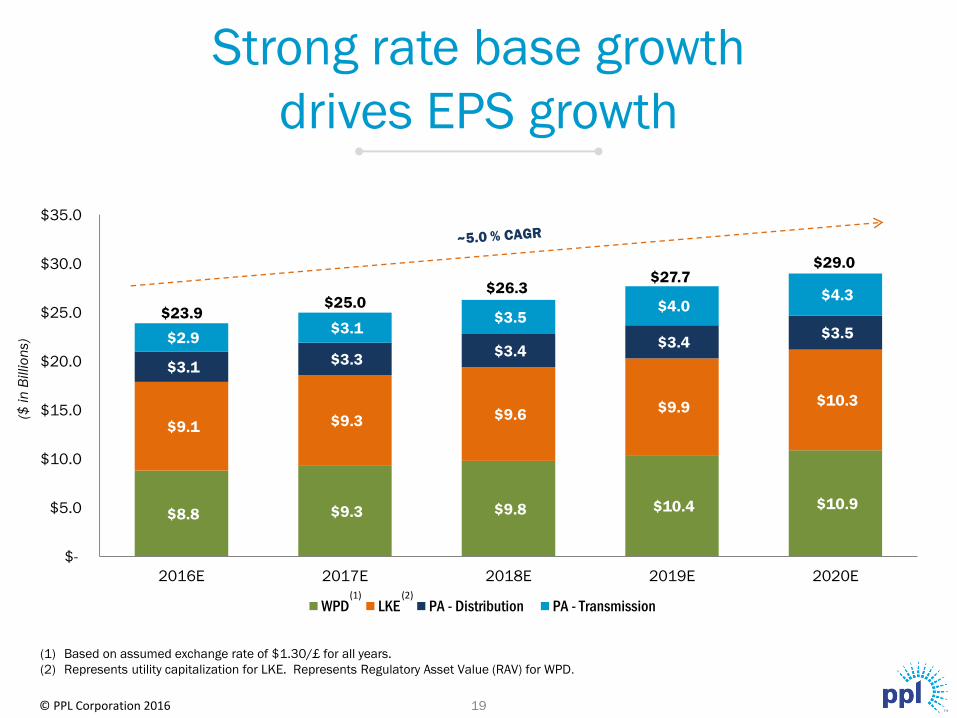
$8.8 $9.3 $9.8 $10.4 $10.9
$9.1 $9.3 $9.6 $9.9 $10.3
$3.1 $3.3
$3.4 $3.4
$3.5 $2.9 $3.1
$3.5 $4.0
$4.3
$-
$5.0
$10.0
$15.0
$20.0
$25.0
$30.0
$35.0
2016E 2017E 2018E 2019E 2020E
WPD LKE PA - Distribution PA - Transmission
($ in
Billio
ns)
(1) Based on assumed exchange rate of $1.30/£ for all years.
(2) Represents utility capitalization for LKE. Represents Regulatory Asset Value (RAV) for WPD.
Strong rate base growth
drives EPS growth
19
(2)
$23.9 $25.0
$26.3 $27.7
$29.0
(1)
19 © PPL Corporation 2016
© PPL Corporation 2016
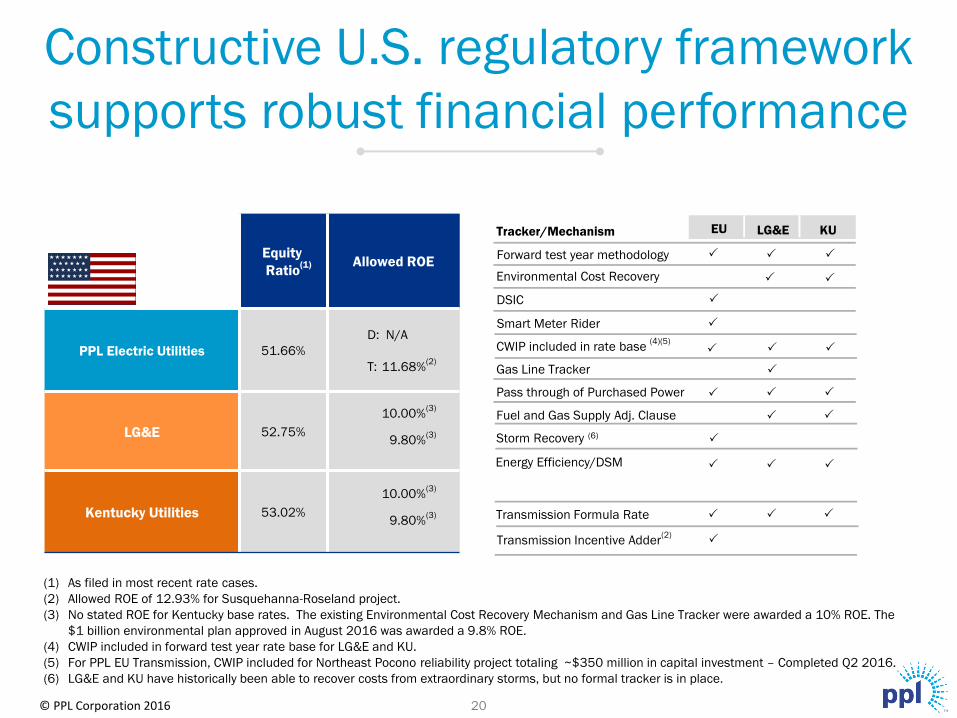
Equity
Ratio(1) Allowed ROE
PPL Electric Utilities 51.66%
D: N/A
T: 11.68%(2)
LG&E 52.75%
10.00%(3)
9.80%(3)
Kentucky Utilities 53.02%
10.00%(3)
9.80%(3)
EU LG&E KU
Environmental Cost Recovery
DSIC P
P P
Forward test year methodology P
CWIP included in rate base (4)(5)
P P
Gas Line Tracker P
Pass through of Purchased Power
Fuel and Gas Supply Adj. Clause
Storm Recovery (6)
P P
P
P
P
Smart Meter Rider P
Tracker/Mechanism
Transmission Formula Rate
Transmission Incentive Adder(2)
P
P
P
P P
P P
Energy Efficiency/DSM P P P
P
(1) As filed in most recent rate cases.
(2) Allowed ROE of 12.93% for Susquehanna-Roseland project.
(3) No stated ROE for Kentucky base rates. The existing Environmental Cost Recovery Mechanism and Gas Line Tracker were awarded a 10% ROE. The
$1 billion environmental plan approved in August 2016 was awarded a 9.8% ROE.
(4) CWIP included in forward test year rate base for LG&E and KU.
(5) For PPL EU Transmission, CWIP included for Northeast Pocono reliability project totaling ~$350 million in capital investment – Completed Q2 2016.
(6) LG&E and KU have historically been able to recover costs from extraordinary storms, but no formal tracker is in place.
Constructive U.S. regulatory framework
supports robust financial performance
20
© PPL Corporation 2016
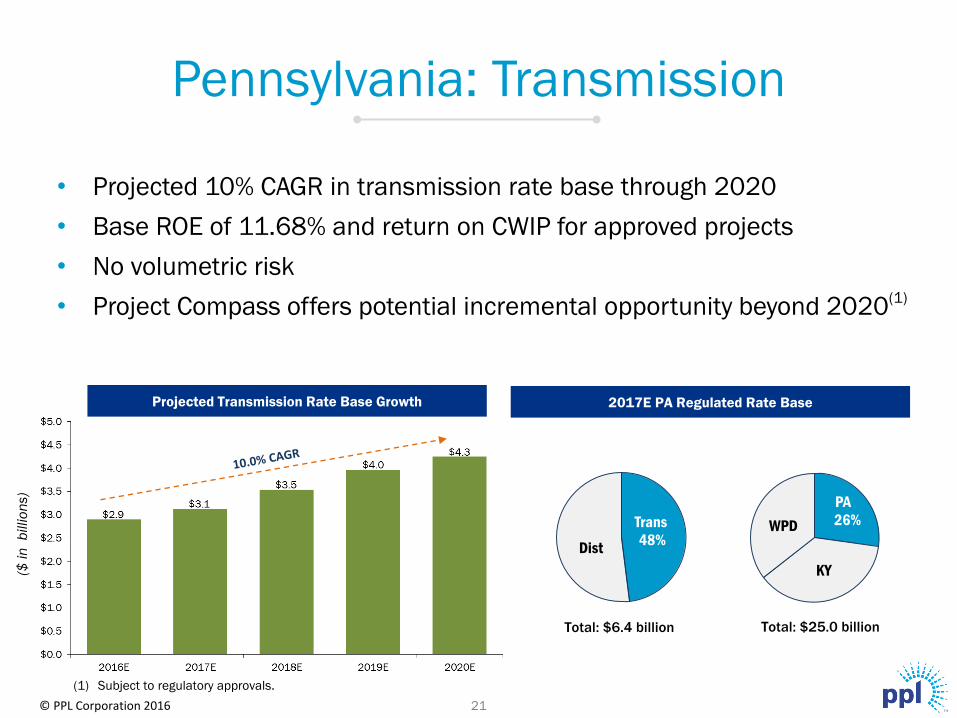
Projected Transmission Rate Base Growth
• Projected 10% CAGR in transmission rate base through 2020
• Base ROE of 11.68% and return on CWIP for approved projects
• No volumetric risk
• Project Compass offers potential incremental opportunity beyond 2020(1)
PA 26%
Total: $25.0 billion Total: $6.4 billion
(1) Subject to regulatory approvals.
($ in
b
illio
ns)
Pennsylvania: Transmission
Trans
48% Dist
PA
26%
KY
WPD
21
2017E PA Regulated Rate Base

Transmission strategy overview
Provide top-quartile reliable, resilient, safe, cost-effective service to customers while
delivering sustainable growth and investment for stakeholders
22 © PPL Corporation 2016
257 138 124 114 162
122 213
171 87
90
320 343 364
397 379
System Total 2005 2010 2015 2020
Total System Line Mileage 5,007 5,019 5,171 5,179
Rebuilt/New Line Mileage N/A 36 279 1,467
Average System Age (yrs) 45 49 51 40
Line Miles >75 Years 856 (17%) 927 (19%) 902 (17%) 254 (5%)
Line Miles >50 Years 1,694 (34%) 1,861 (37%) 1,936 (37%) 969 (19%)
Line Miles >25 Years 4,344 (87%) 4,534 (90%) 4,486 (87%) 3,227 (62%)
Wood/Total Structures 57% 55% 47% 29%
Steel/Total Structures 43% 45% 53% 71%
Transmission Reliability
5 Year Historical Average 2016 Forecast
IEEE SAIFI - Transmission 0.35 0.07
IEEE MAIFI - Transmission 0.83 0.51
Four Focus Areas:
• Compliance with NERC and PJM Criteria
• Security Improvements
• Increase System Reliability
• Sustainability and Survivability
Total of $3.28 billion
$700 $694 $660 $599 $630
($ in
mill
ions
)
Rebuild and Reinforce the 69kV & 138kV System
New Facilities & Bulk Electric System Enhancements
Substation Rebuilds

© PPL Corporation 2016
• Susquehanna – Roseland
— Approximately $650 million project with 12.93% ROE
— 150 miles from PA to NJ, including through the National Park Service
— Partnership with neighboring NJ utility
— Cooperation with multiple agencies
— Stronger reliability for millions
— Economic development; 2,200 jobs
• Northeast Pocono Reliability Project
— Approximately $350 million project completed one year ahead of schedule
— 58 miles of transmission lines and substations
• Additional reliability projects to strengthen transmission system
― About $2 billion invested over the last three years
Proven track record
of transmission capability
23

© PPL Corporation 2016
Proposed First Segment:
• 95-mile initial segment from Blakely, PA to Ramapo, NY
— Interconnection request filed with NYISO in October 2015
— Estimated cost of $400 - $500 million
— Estimated in-service date in 2023
• Benefits as proposed include:
— Substantial annual savings for NY customers
— Economic development benefits
— Grid reliability
— Increase renewable market
Full Project Current Plan:
• 475-mile transmission line from Western PA to Southeastern NY
• Estimated cost of $3 – $4 billion
Project Compass summary
24

© PPL Corporation 2016
Project Compass
25

© PPL Corporation 2016
PA
26%
KY
WPD
• Projected 3.2% CAGR in distribution rate base through 2020
• Constructive jurisdiction reduces regulatory lag; should extend rate case
cycles
— DSIC and Smart Meter mechanisms (<6 months lag on qualifying investments)
— No projected base rate cases through 2020
— ~60% of distribution gross margin subject to minimal or no volumetric risk
Projected Distribution Rate Base Growth
Total: $25.0 billion Total: $6.4 billion
2017E PA Regulated Rate Base
Dist 52
($ in
b
illio
ns)
Trans Dist
52%
Pennsylvania: Distribution
26
© PPL Corporation 2016
PA
KY
37%
WPD
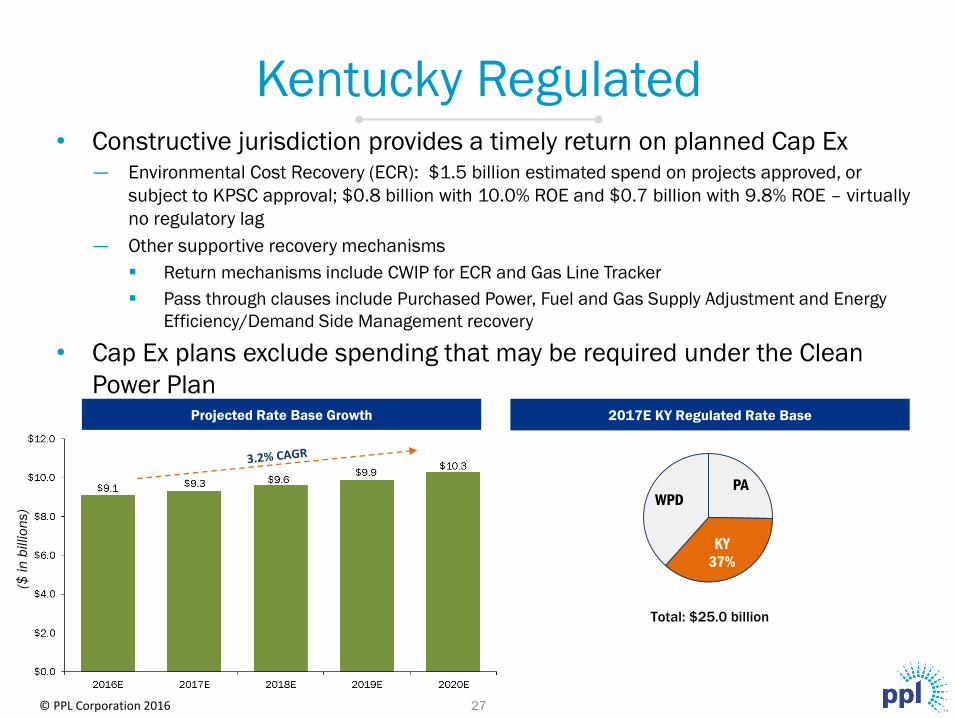
• Constructive jurisdiction provides a timely return on planned Cap Ex — Environmental Cost Recovery (ECR): $1.5 billion estimated spend on projects approved, or
subject to KPSC approval; $0.8 billion with 10.0% ROE and $0.7 billion with 9.8% ROE – virtually
no regulatory lag
— Other supportive recovery mechanisms
Return mechanisms include CWIP for ECR and Gas Line Tracker
Pass through clauses include Purchased Power, Fuel and Gas Supply Adjustment and Energy
Efficiency/Demand Side Management recovery
• Cap Ex plans exclude spending that may be required under the Clean
Power Plan Projected Rate Base Growth
Total: $25.0 billion
KY 36 %
($ in
billio
ns)
Kentucky Regulated
27
2017E KY Regulated Rate Base

© PPL Corporation 2016
Low Nox
BurnersSCR/SNCR Scrubbers
Closed Cycle
Cooling Tower
Dry Handling/ Disposal/
Beneficial UseBaghouses
Mw of
CapacityNOx NOx SO2 Water Intake Coal Combustion Residuals (CCRs)
Particulates and
Hg (with PAC injection)
Unit 1 370 (2)
(1)
Unit 2 549 (2)
(1)
Unit 1 474 (4)
Unit 2 493 (3) (4)
Unit 3 485 (4)
Unit 4 465 (4)
Unit 1 106 (3) (1) (3)
Unit 2 166 (3) (1) (3)
Unit 3 409 (1)
Unit 1 300 (3) (5) (6)
Unit 2 297 (3) (6)
Unit 3 391 (6)
Unit 4 477 (6)
Control Device
Addresses
Tri
mb
le
Co
un
tyG
he
nt
Bro
wn
Mil
l C
ree
k
Kentucky environmental controls
28
(1) CCR Dry Handling/Disposal construction is approved by KPSC at Trimble and Brown.
CCR Dry Handling is permitted, commenced construction and operations are pending at Trimble and Brown.
Disposal permitted and commenced construction at Brown; permitting and construction are pending at Trimble.
(2) Ratings represent LKE’s 75% ownership of Trimble Units 1 & 2.
(3) Standard(s) are based on station wide or company wide limit(s). LG&E and KU comply without Control Device
(4) Portions of Ghent CCR systems are operational at this time; other CCR system construction activity continues.
(5) Performing required data gathering (2015-2016) to assess compliance options under the new standards. Scheduled to submit a plan to Kentucky Division
of Water in 2017.
(6) Dry fly ash is in service. Bottom Ash handling project to convert from wet sluice to dry handling is being developed.
= Installed

The U.K.: a premium
regulatory jurisdiction The U.K. Ofgem’s RIIO framework (Revenue = Incentives + Innovation + Outputs) allows Distribution
Network Operators (DNOs) to earn premium returns for strong performance and innovation
WPD Investment Advantage
Regulatory cycle
Fast track incentive
Benefit sharing
Inflation – adjusted
revenues
• Base revenues set for 8 year period, commencing
April 2015 through March 2023
• No volumetric risk in amount of electricity delivered
• Ability to collect additional annual revenue equivalent
to 2.5% of total annual expenditures
• Ability to retain 50% - 70% of cost efficiencies; with
benefits shared with customers
• Retail Price Index (RPI) Indexation of allowed
revenues and Regulatory Asset Value (RAV)
• Provides certainty and visibility
• Ofgem accepted business plan spend over 8 years drives
RAV growth
• WPD only 4 DNOs awarded fast-track status
• Estimated $35 million of annual fast-track revenue
• Fast-track status allows WPD to retain 70% of cost
efficiencies (O&M and Capital savings), compared to only
53% to 58% for the slow track DNOs
• RPI plan assumptions – 2.4% for 2016/17; 3.1% for
2017/18 & 2018/19 (20 year historical average for RPI is
~3%)
Funding & leverage
• Regulation requires funding to support investment
grade credit ratings
• Debt leverage set at 65% of Debt/RAV at the DNO
level
• U.K. is a self-funding operation; does not require any equity
from PPL
• Holding company structure provides for higher earned
ROEs
• Target WPD consolidated Debt/RAV below 85% to
maintain investment grade credit ratings
• Annually repatriate $100 - $200 million of cash back to the
U.S. in a tax efficient manner
Incentive regulation
• WPD has a proven track record of outperformance
• Additional opportunity to improve earned ROEs; 12-14%
earned ROEs(1)
expected from 2017 through 2020
9
• Incentive revenues available for exceeding customer
service and reliability targets
RIIO-ED1 Framework
(1) Based on 2017-2020 Segment earnings projections. Capital structure is adjusted to include the debt of $750 million that is allocated for Segment reporting.
29 © PPL Corporation 2016
© PPL Corporation 2016
2017E U.K. Regulated Rate Base
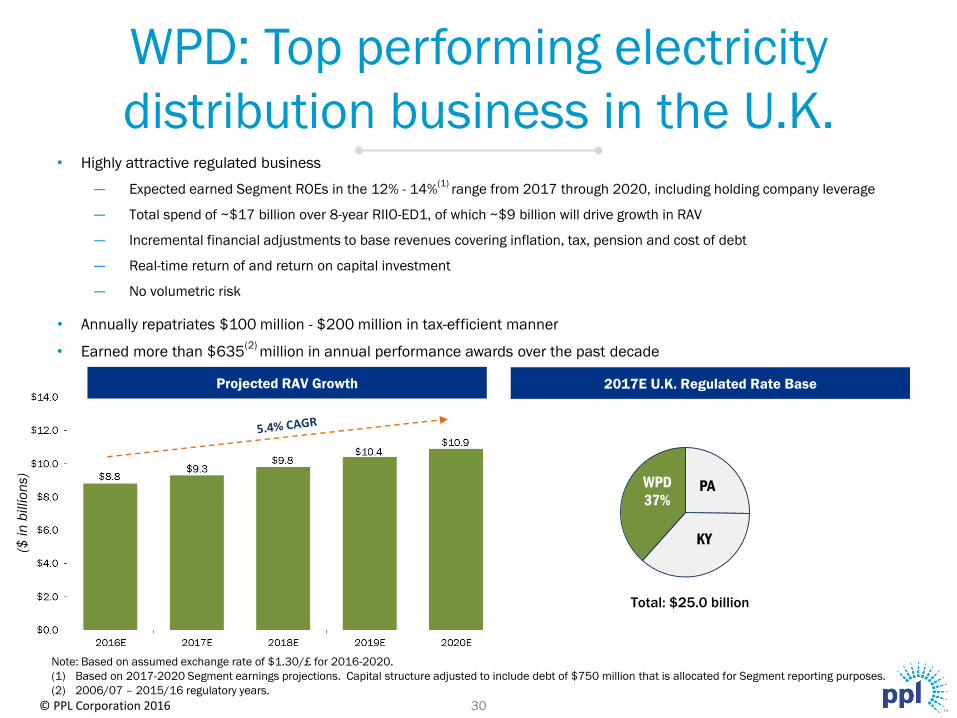
• Highly attractive regulated business
— Expected earned Segment ROEs in the 12% - 14%(1)
range from 2017 through 2020, including holding company leverage
— Total spend of ~$17 billion over 8-year RIIO-ED1, of which ~$9 billion will drive growth in RAV
— Incremental financial adjustments to base revenues covering inflation, tax, pension and cost of debt
— Real-time return of and return on capital investment
— No volumetric risk
• Annually repatriates $100 million - $200 million in tax-efficient manner
• Earned more than $635(2)
million in annual performance awards over the past decade
Projected RAV Growth
($ in
billio
ns)
WPD: Top performing electricity
distribution business in the U.K.
PA
KY
WPD
37%
Total: $25.0 billion
30
Note: Based on assumed exchange rate of $1.30/£ for 2016-2020.
(1) Based on 2017-2020 Segment earnings projections. Capital structure adjusted to include debt of $750 million that is allocated for Segment reporting purposes.
(2) 2006/07 – 2015/16 regulatory years.

© PPL Corporation 2016
Brexit vote impacts
• U.K. business operations and regulatory environment
unchanged
― Base revenues set (in GBP) for seven more years
― Revenues adjusted for inflation and volume changes on
two-year lag
― No changes to capital investment in GBP
• The GBP/USD exchange rate impacts the value of translated
USD earnings and USD amount of cash distributions back to
the U.S.
31

© PPL Corporation 2016
PPL acted decisively after Brexit vote
Locked in hedge value driven by post-Brexit declines in GBP/USD
exchange rate and realized $310 million in cash
Re-established a baseline of earnings and future growth using $1.30/£
currency exchange rate
Set a longer-term EPS projection: 5-6% CAGR from 2017 to 2020(1)
Solidified PPL’s dividend growth strategy of about 4% per year
beginning in 2017 through 2020(2)
32
(1) Based on midpoint of the 2017 earnings guidance range of $2.05 - $2.25 per share.
(2) Subject to approval by the Board of Directors.

© PPL Corporation 2016
Current Hedge Status
GBP Foreign Currency 2016 2017 2018 1.20 1.15
Percentage Hedged 91% 94% 93% 100% 73%
Hedged Rate (GBP/USD) 1.29 1.25 1.42 1.30 1.30
Budgeted Rate on Open Position (GBP/USD) 1.30 1.30 1.30 1.30 1.30
Market Rate EPS Sensitivity on Open Position EPS Sensitivity on
(GBP/USD) 2016 2017 2018
1.45 - $0.01 $0.04 - $0.04
1.40 - $0.01 $0.04 - $0.03
1.35 - - $0.02 - $0.01
1.25 - - - - ($0.01)
1.20 - ($0.01) ($0.01) - ($0.03)
1.15 - ($0.01) ($0.01) - ($0.04)
2019 Hedge Attainment
Market Rate (GBP/USD)
2019 Open Position
Foreign currency hedging status
Note: FX hedging status as of 10/21/2016.
(1) 2018 hedges are a combination of average-rate forwards and zero-cost collars. Average hedge rates based on the average forward rate and the
average floor in the collars.
Have ability to utilize about 12 cents of 2018 hedge gains to hedge 2019 exposure
(1)
33

© PPL Corporation 2016
• 3-year forward hedging program to manage PPL’s GBP vs. USD
earnings translation risk
• The program consists of declining hedge percentage ratios on a
“rolling” 36-month basis allocated into 12-month periods
• Hedge bands provide flexibility for management decisions
• Defined minimum hedge percentages require disciplined
hedging
• Program reduces volatility and results in a more predictable USD
earnings stream that meets investor expectations
Foreign currency risk management
34
© PPL Corporation 2016
• Revenue:
— In November 2015, tariffs for 2016/2017 and 2017/2018 were set using
the forecasted RPI for the next two regulatory years
— In November 2016 and going forward, one additional year of tariffs will be
set. Therefore 2018/2019 tariffs will be set using the November 2016
forecasted RPI for that period.
— In addition, the 2017/2018 revenues will include a true-up for the actual
vs. forecasted RPI for the 2015/2016 regulatory year
• O&M impacted primarily by RPI adjustments to wages, including
contract labor with a compounding effect realized in future periods
• Approximately 10% of total U.K. debt is RPI index-linked debt. The lower
the RPI, the lower the interest expense and vice versa.
RPI affects 3 primary financial drivers for WPD:
Revenues, O&M and Interest Expense
Retail Price Index - RPI
35

© PPL Corporation 2016
RPI update and sensitivity
(1) Represents October 2016 forecast. Source: U.K. HM Treasury RPI forecast: https://www.gov.uk/government/collections/data-forecasts
(2) Sensitivities include the net effect on revenue, O&M and interest expense on index-linked debt.
36
RPI (Regulatory Year) 2016/17 2017/18 2018/19
Forecast RPI assumption 2.4% 3.1% 3.1%
Current RPI forecast (1)
2.3% 2.9% 3.0%
RPI (Calendar Year) 2016 2017 2018
Forecast RPI assumption 2.0% 2.9% 3.1%
Current RPI forecast (1)
1.9% 2.7% 3.0%
Increase in 2016/2017 RPI (forecast assumption 2.0%) (2)
0.5% $0.00 $0.00 $0.02
EPS Sensitivity

© PPL Corporation 2016
U.K. incentive revenues
• Annual performance above or below the Ofgem targets for Customer
Minutes Lost (CML), Customer Interruptions (CI) and the Broad
Measure of Customer Satisfaction Survey is rewarded or penalized
on a 2-year lag
• WPD projects to receive incentive revenues as follows at $1.30/£:
2016(1)
2017 2018
Current Estimate $120M $ 85M $80M - $100M
• The following slides provide WPD’s current and projected
performance for the 2016/2017 regulatory year for quality of service
and customer satisfaction incentive mechanisms
(1) 2016 estimate at average hedged rate of $1.46/£.
37
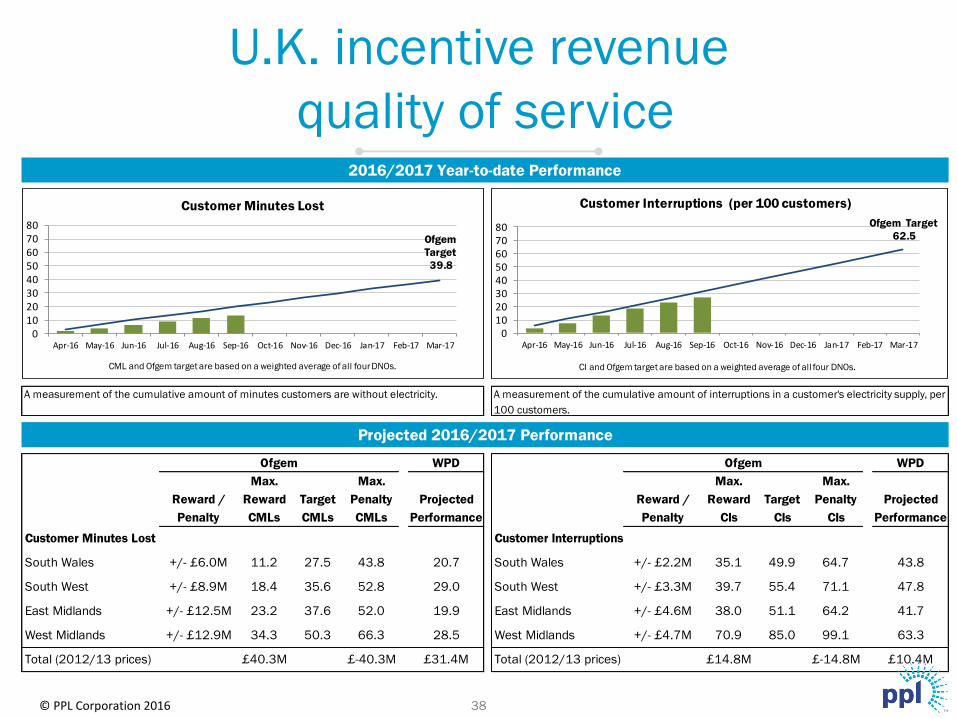
U.K. incentive revenue
quality of service
38
2016/2017 Year-to-date Performance
Projected 2016/2017 Performance
Ofgem WPD Ofgem WPD
Max. Max. Max. Max.
Reward / Reward Target Penalty Projected Reward / Reward Target Penalty Projected
Penalty CMLs CMLs CMLs Performance Penalty CIs CIs CIs Performance
Customer Minutes Lost Customer Interruptions
South Wales +/- £6.0M 11.2 27.5 43.8 20.7 South Wales +/- £2.2M 35.1 49.9 64.7 43.8
South West +/- £8.9M 18.4 35.6 52.8 29.0 South West +/- £3.3M 39.7 55.4 71.1 47.8
East Midlands +/- £12.5M 23.2 37.6 52.0 19.9 East Midlands +/- £4.6M 38.0 51.1 64.2 41.7
West Midlands +/- £12.9M 34.3 50.3 66.3 28.5 West Midlands +/- £4.7M 70.9 85.0 99.1 63.3
Total (2012/13 prices) £40.3M £-40.3M £31.4M Total (2012/13 prices) £14.8M £-14.8M £10.4M
A measurement of the cumulative amount of minutes customers are without electricity. A measurement of the cumulative amount of interruptions in a customer's electricity supply, per
100 customers.
Ofgem Target
62.5
01020304050607080
Apr-16 May-16 Jun-16 Jul-16 Aug-16 Sep-16 Oct-16 Nov-16 Dec-16 Jan-17 Feb-17 Mar-17
Customer Interruptions (per 100 customers)
Ofgem
Target
39.8
01020304050607080
Apr-16 May-16 Jun-16 Jul-16 Aug-16 Sep-16 Oct-16 Nov-16 Dec-16 Jan-17 Feb-17 Mar-17
Customer Minutes Lost
CML and Ofgem target are based on a weighted average of all four DNOs. CI and Ofgem target are based on a weighted average of all four DNOs.
© PPL Corporation 2016

© PPL Corporation 2016
U.K. incentive revenue
customer satisfaction
• The Broad Measure of Customer Satisfaction Survey rewards or penalizes DNOs for the
levels of customer satisfaction
• Through September 2016, WPD performance is near or at the max reward levels. WPD
projects 2016/2017 performance of £11.3M (in 2012/2013 prices).
South West South Wales East Midlands West Midlands Total
Max reward/penalty +/-£2.8 +/-£1.9 +/-£4.0 +/-£4.0 +/-£12.7
Max Reward
Breakeven
Max Penalty
39
© PPL Corporation 2016
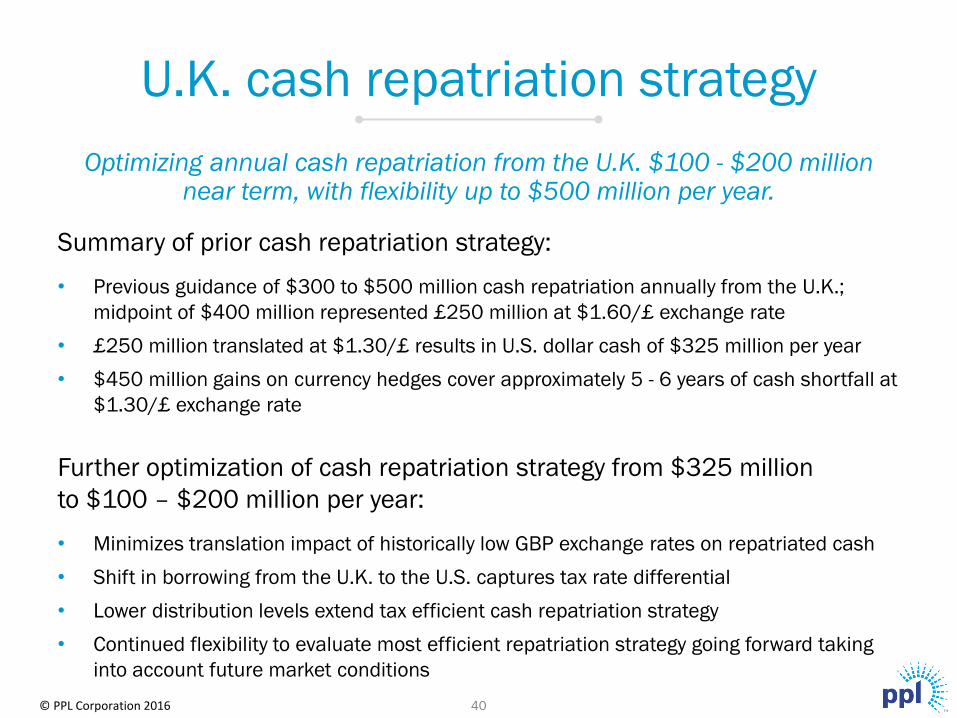
Summary of prior cash repatriation strategy:
• Previous guidance of $300 to $500 million cash repatriation annually from the U.K.;
midpoint of $400 million represented £250 million at $1.60/£ exchange rate
• £250 million translated at $1.30/£ results in U.S. dollar cash of $325 million per year
• $450 million gains on currency hedges cover approximately 5 - 6 years of cash shortfall at
$1.30/£ exchange rate
Further optimization of cash repatriation strategy from $325 million
to $100 – $200 million per year:
• Minimizes translation impact of historically low GBP exchange rates on repatriated cash
• Shift in borrowing from the U.K. to the U.S. captures tax rate differential
• Lower distribution levels extend tax efficient cash repatriation strategy
• Continued flexibility to evaluate most efficient repatriation strategy going forward taking
into account future market conditions
Optimizing annual cash repatriation from the U.K. $100 - $200 million near term, with flexibility up to $500 million per year.
U.K. cash repatriation strategy
40
© PPL Corporation 2016
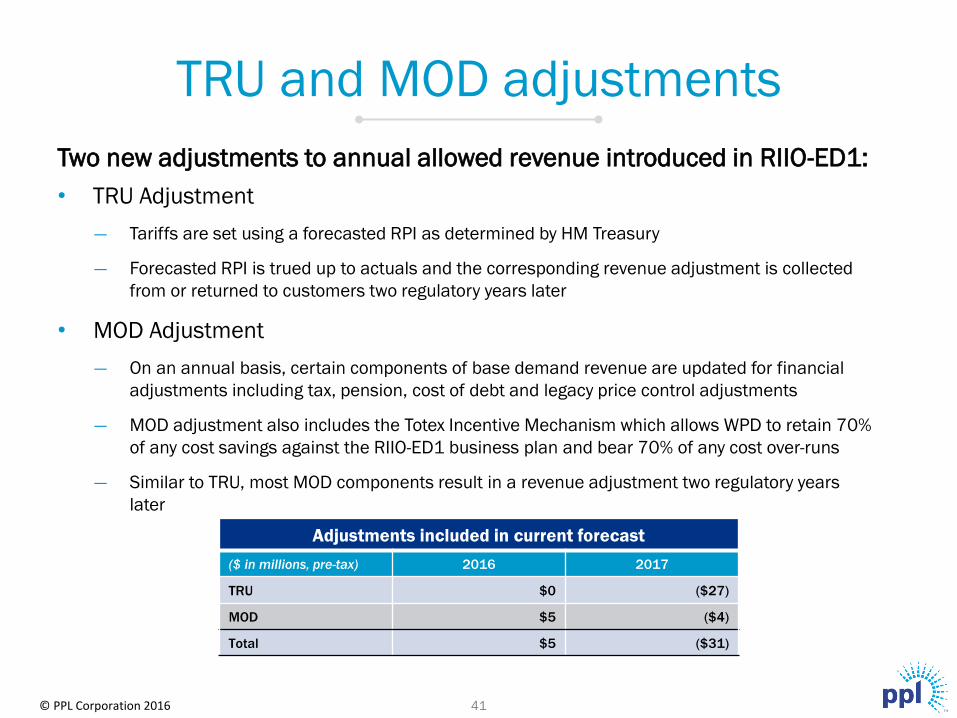
Two new adjustments to annual allowed revenue introduced in RIIO-ED1:
• TRU Adjustment
― Tariffs are set using a forecasted RPI as determined by HM Treasury
― Forecasted RPI is trued up to actuals and the corresponding revenue adjustment is collected
from or returned to customers two regulatory years later
• MOD Adjustment
― On an annual basis, certain components of base demand revenue are updated for financial
adjustments including tax, pension, cost of debt and legacy price control adjustments
― MOD adjustment also includes the Totex Incentive Mechanism which allows WPD to retain 70%
of any cost savings against the RIIO-ED1 business plan and bear 70% of any cost over-runs
― Similar to TRU, most MOD components result in a revenue adjustment two regulatory years
later
Adjustments included in current forecast
($ in millions, pre-tax) 2016 2017
TRU $0 ($27)
MOD $5 ($4)
Total $5 ($31)
TRU and MOD adjustments
41
© PPL Corporation 2016
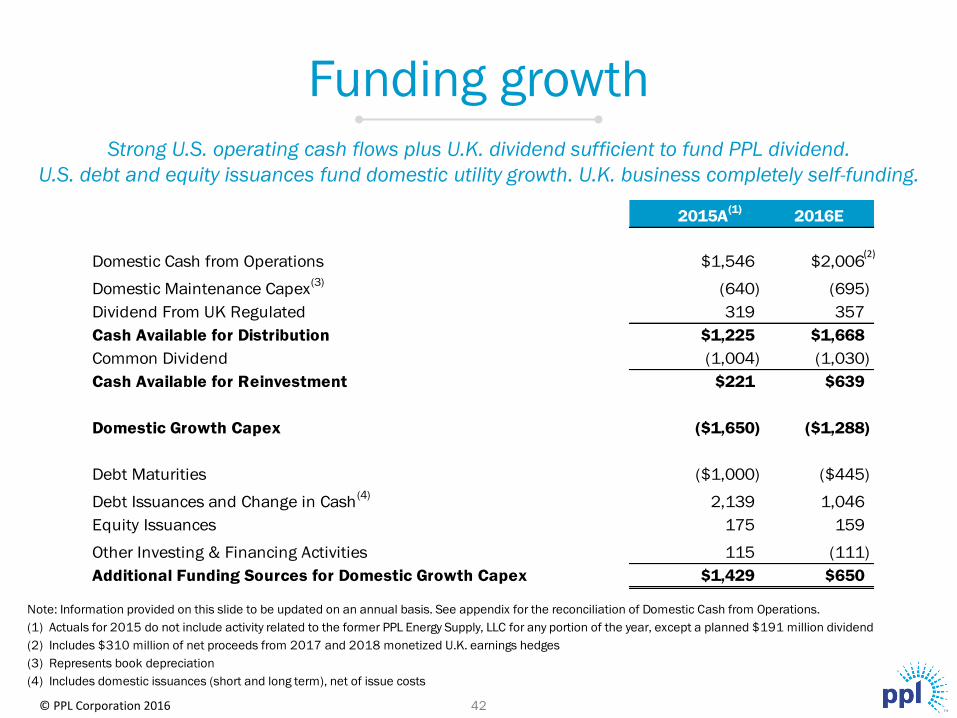
2015A(1)
2016E
Domestic Cash from Operations $1,546 $2,006
Domestic Maintenance Capex(3)
(640) (695)
Dividend From UK Regulated 319 357
Cash Available for Distribution $1,225 $1,668
Common Dividend (1,004) (1,030)
Cash Available for Reinvestment $221 $639
Domestic Growth Capex ($1,650) ($1,288)
Debt Maturities ($1,000) ($445)
Debt Issuances and Change in Cash(4)
2,139 1,046
Equity Issuances 175 159
Other Investing & Financing Activities 115 (111)
Additional Funding Sources for Domestic Growth Capex $1,429 $650
Strong U.S. operating cash flows plus U.K. dividend sufficient to fund PPL dividend.
U.S. debt and equity issuances fund domestic utility growth. U.K. business completely self-funding.
(2)
Funding growth
42
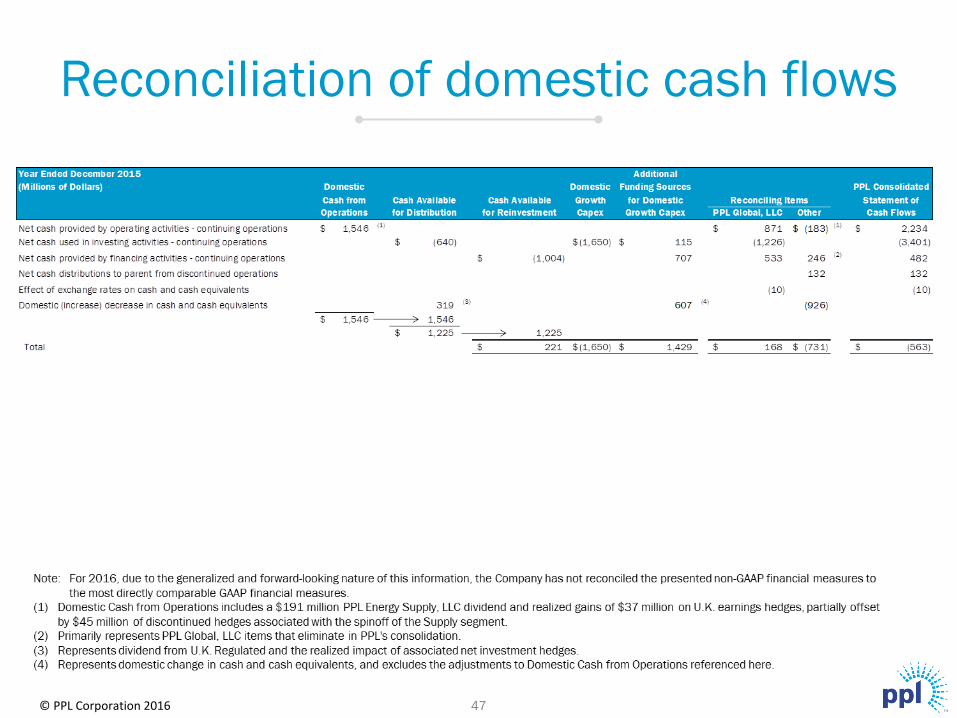
Note: Information provided on this slide to be updated on an annual basis. See appendix for the reconciliation of Domestic Cash from Operations.
(1) Actuals for 2015 do not include activity related to the former PPL Energy Supply, LLC for any portion of the year, except a planned $191 million dividend
(2) Includes $310 million of net proceeds from 2017 and 2018 monetized U.K. earnings hedges
(3) Represents book depreciation
(4) Includes domestic issuances (short and long term), net of issue costs

WPD Holding Company LKE Holding Company
PPL Electric Utilities LKE Operating Companies
PPL Capital Funding
Credit Rating
Secured
Unsecured
Long-term Issuer
Outlook
S&P
NR
BBB+
A-
Stable
Moody’s
NR
Baa2
NR
Stable
Credit Rating
Secured
Unsecured
Long-term Issuer
Outlook
S&P
NR
BBB+
A-
Stable
Moody’s
NR
Baa3
Baa3
Stable
WPD Operating Companies
Credit Rating
Secured
Unsecured
Long-term Issuer
Outlook
S&P
NR
A-
A-
Stable
Moody’s
NR
Baa1
Baa1
Stable
Credit Rating
Secured
Unsecured
Long-term Issuer
Outlook
S&P
A
NR
A-
Stable
Moody’s
A1
NR
A3
Stable
Credit Rating
Secured
Unsecured
Long-term Issuer
Outlook
S&P
NR
BBB+
A-
Stable
Moody’s
NR
Baa1
Baa1
Stable
Credit Rating
Secured
Unsecured
Long-term Issuer
Outlook
S&P
A
NR
A-
Stable
PPL Corporation
Credit Rating
Secured
Unsecured
Long-term Issuer
Outlook
S&P
NR
NR
A-
Stable
Moody’s
NR
NR
Baa2
Stable
Strong credit profile at our utilities, holding companies and PPL Corporation.
Moody’s
A1
NR
A3
Stable
Strong credit ratings
43 © PPL Corporation 2016

© PPL Corporation 2016
Manageable maturity schedule and strong liquidity profile provide financial flexibility.
Liquidity Profile as of
September 30, 2016
Debt Maturity Distribution 2016 - 2020
as of September 30, 2016
Note: GBP debt maturities and credit facilities converted at GBP/USD rate of $1.30/£.
Strong financial foundation
44
($ in
millio
ns)
($ in
millio
ns)

© PPL Corporation 2016
Reconciliation of forecasted reported earnings
(loss) to earnings from ongoing operations
45
© PPL Corporation 2016
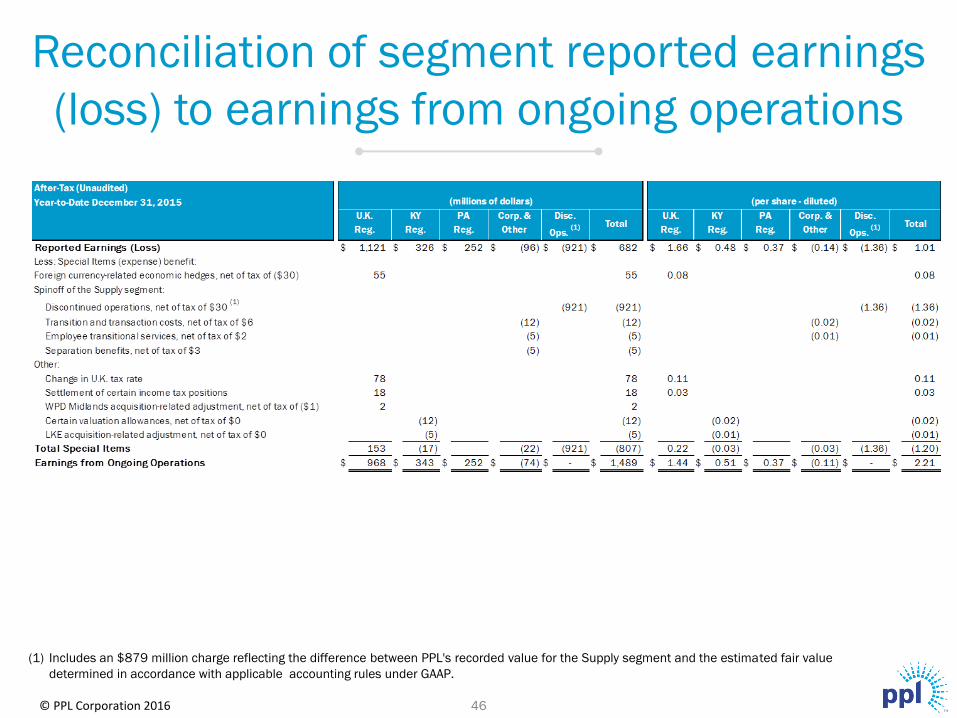
Reconciliation of segment reported earnings
(loss) to earnings from ongoing operations
(1) Includes an $879 million charge reflecting the difference between PPL's recorded value for the Supply segment and the estimated fair value
determined in accordance with applicable accounting rules under GAAP.
46
© PPL Corporation 2016
Reconciliation of domestic cash flows
47
© PPL Corporation 2016
Statements contained in this presentation, including statements with respect to future earnings, cash flows, dividends, financing, regulation
and corporate strategy are "forward-looking statements" within the meaning of the federal securities laws. Although PPL Corporation
believes that the expectations and assumptions reflected in these forward-looking statements are reasonable, these statements are subject
to a number of risks and uncertainties, and actual results may differ materially from the results discussed in the statements. The following
are among the important factors that could cause actual results to differ materially from the forward-looking statements: market demand for
energy in our service territories, weather conditions affecting customer energy usage and operating costs; the effect of any business or
industry restructuring, including the ability of PPL Corporation to realize all or a significant portion of the anticipated cost savings from the
corporate restructuring following the Supply business spinoff; the profitability and liquidity of PPL Corporation and its subsidiaries; new
accounting requirements or new interpretations or applications of existing requirements; operating performance of our facilities; the length
of scheduled and unscheduled outages at our generating plants; environmental conditions and requirements and the related costs of
compliance; system conditions and operating costs; development of new projects, markets and technologies; performance of new ventures;
asset or business acquisitions and dispositions; any impact of hurricanes or other severe weather on our business; receipt of necessary
government permits, approvals, rate relief and regulatory cost recovery; capital market conditions and decisions regarding capital structure;
the impact of state, federal or foreign investigations applicable to PPL Corporation and its subsidiaries; the outcome of litigation against PPL
Corporation and its subsidiaries; stock price performance; the market prices of equity securities and the impact on pension income and
resultant cash funding requirements for defined benefit pension plans; the securities and credit ratings of PPL Corporation and its
subsidiaries; political, regulatory or economic conditions in states, regions or countries where PPL Corporation or its subsidiaries conduct
business, including any potential effects of threatened or actual terrorism or war or other hostilities; British pound sterling to U.S. dollar
exchange rates; new state, federal or foreign legislation, including new tax legislation; and the commitments and liabilities of PPL
Corporation and its subsidiaries. Any such forward-looking statements should be considered in light of such important factors and in
conjunction with PPL Corporation's Form 10-K and other reports on file with the Securities and Exchange Commission.
Forward-looking information statement
48

© PPL Corporation 2016
Definitions of
non-GAAP financial measures
49
Management utilizes "Earnings from Ongoing Operations" as a non-GAAP financial measure that should not be considered as an
alternative to reported earnings, or net income, an indicator of operating performance determined in accordance with GAAP. PPL
believes that Earnings from Ongoing Operations is useful and meaningful to investors because it provides management's view of PPL's
earnings performance as another criterion in making investment decisions. In addition, PPL's management uses Earnings from
Ongoing Operations in measuring achievement of certain corporate performance goals, including targets for certain executive incentive
compensation. Other companies may use different measures to present financial performance.
Earnings from Ongoing Operations is adjusted for the impact of special items. Special items are presented in the financial tables on an
after-tax basis with the related income taxes on special items separately disclosed. Income taxes on special items, when applicable,
are calculated based on the effective tax rate of the entity where the activity is recorded. Special items include:
• Unrealized gains or losses on foreign currency-related economic hedges (as discussed below).
• Supply segment discontinued operations.
• Gains and losses on sales of assets not in the ordinary course of business.
• Impairment charges.
• Workforce reduction and other restructuring effects.
• Acquisition and divestiture-related adjustments.
• Other charges or credits that are, in management's view, non-recurring or otherwise not reflective of the company's ongoing
operations.
Unrealized gains or losses on foreign currency economic hedges include the changes in fair value of foreign currency contracts used to
hedge British-Pound-Sterling-denominated anticipated earnings. The changes in fair value of these contracts are recognized
immediately within GAAP earnings. Management believes that excluding these amounts from Earnings from Ongoing Operations until
settlement of the contracts provides a better matching of the financial impacts of those contracts with the economic value of PPL's
underlying hedged earnings.

© PPL Corporation 2016
Definitions of
non-GAAP financial measures
50
Management also utilizes the following non-GAAP financial measures as indicators of performance for its businesses.
"U.K. Gross Margins" is a single financial performance measure of the electricity distribution operations of the U.K. Regulated segment. In calculating this
measure, direct costs such as connection charges from National Grid, who owns and manages the electricity transmission network in England and Wales,
and Ofgem license fees (recorded in "Other operation and maintenance" on the Statements of Income) are deducted from operating revenues, as they are
costs passed through to customers. As a result, this measure represents the net revenues from the delivery of electricity across WPD's distribution network in
the U.K. and directly related activities.
"Kentucky Gross Margins" is a single financial performance measure of the electricity generation, transmission and distribution operations of the Kentucky
Regulated segment, LKE, LG&E and KU, as well as the Kentucky Regulated segment's, LKE's and LG&E's distribution and sale of natural gas. In calculating
this measure, fuel, energy purchases and certain variable costs of production (recorded in "Other operation and maintenance" on the Statements of Income)
are deducted from revenues. In addition, certain other expenses, recorded in "Other operation and maintenance", "Depreciation" and "Taxes, other than
income" on the Statements of Income, associated with approved cost recovery mechanisms are offset against the recovery of those expenses, which are
included in revenues. These mechanisms allow for direct recovery of these expenses and, in some cases, returns on capital investments and performance
incentives. As a result, this measure represents the net revenues from electricity and gas operations.
"Pennsylvania Gross Delivery Margins" is a single financial performance measure of the electricity transmission and distribution delivery operations of the
Pennsylvania Regulated segment and PPL Electric. In calculating this measure, utility revenues and expenses associated with approved recovery
mechanisms, including energy provided as a PLR, are offset with minimal impact on earnings. Costs associated with these mechanisms are recorded in
"Energy purchases," "Other operation and maintenance," (which are primarily Act 129 and Universal Service program costs), and "Taxes, other than income,"
which is primarily gross receipts tax. This performance measure includes PLR energy purchases by PPL Electric from PPL EnergyPlus, which are reflected in
"Energy purchases from affiliate" in the reconciliation tables. As a result of the June 2015 spinoff of PPL Energy Supply and the formation of Talen Energy,
PPL EnergyPlus (renamed Talen Energy Marketing) is no longer an affiliate of PPL Electric. PPL Electric's purchases from Talen Energy Marketing subsequent
to May 31, 2015 are reflected in "Energy Purchases" in the reconciliation tables. This measure represents the net revenues from the Pennsylvania Regulated
segment's and PPL Electric's electricity delivery operations.
These measures are not intended to replace "Operating Income," which is determined in accordance with GAAP, as an indicator of overall operating
performance. Other companies may use different measures to analyze and report their results of operations. Management believes these measures provide
additional useful criteria to make investment decisions. These performance measures are used, in conjunction with other information, by senior
management and PPL's Board of Directors to manage operations and analyze actual results compared with budget.
Reconciliations of margins for future periods are not provided as certain items excluded from Operating Income are inherently subject to change and are not
significant.