pne11 cruise report - aoml.noaa.gov · 4 the northeastern and north central tropical atlantic is a...
TRANSCRIPT

PIRATA Northeast Extension 2011 / AEROSE-VII Cruise Report NOAA Ship Ronald H. Brown
RB-11-01 21 July – 21 August 2011
Charleston, SC to Cape Town, South Africa
Rick Lumpkin, chief scientist NOAA/Atlantic Oceanographic and Meteorological Laboratory/Physical
Oceanography Division Miami, FL USA

2
PIRATA Northeast Extension 2011 Scientific Party: Oceanographic Observations: Rick Lumpkin, Grant Rawson, Verena Hormann (NOAA/AOML); Shelby LaBuhn (Lake Superior State Univ.) ATLAS and T-FLEX Moorings: Dave Zimmerman, Korey Martin and Jacob Wenegrat (NOAA/PMEL) VENTS Hydrophone Moorings: Russell Pate (NOAA/PMEL) M-AERI: Malgorzata Szczodrak (Univ. Miami) AEROSE: Nick Nalli (NESDIS/STAR); Ebony Roper (Lincoln Univ.); Chris Spells (Hampton Univ.); Mayra Oyola, Justin Perry (Howard Univ.) OVERVIEW: The 2011 PIRATA Northeast Extension Cruise RB-11-01 and 7th NOAA Aerosols and Ocean Science Expedition was designed to collect a suite of oceanographic and meteorological observations in the northeast Tropical Atlantic, to service the northeast extension of the PIRATA array, to repair PIRATA backbone moorings at 0º, 23ºW and 10S, 10W, to collect CTD casts at each of the mooring sites, to deploy four VENTS hydrophone moorings, and to collect a suite of opportunistic oceanographic and meteorological observations. The cruise track passes through the climatologically significant Tropical North Atlantic region, including the southeast corner of the subtropical North Atlantic (a region of subduction for the subtropical cell circulation); the Guinea Dome and oxygen minimum shadow zone where the subtropical and tropical gyres meet, and the Tropical Atlantic current system and equatorial waveguide. All scientific goals of RB-11-01 were achieved. We thank the crew and officers of the Ronald H. Brown for their work and input before and during the cruise. A week before the scheduled cruise start, three engineers unexpectedly departed; the start was delayed by three days, and the science party was accommodated aboard the ship starting the night of the original departure date. This greatly reduced stress on the science party. Frank Dunlop and his engineering team worked tirelessly to prepare for the cruise, while simultaneously training three last-minute replacements: their efforts deserve commendation. This work included repairing and rewiring the AEROSE van prior to departure. The ship ran at 740+ rpms during several long transits, and the CO Mark

3
Pickett and Chief Bosun Bruce Cowden were willing to conduct nighttime mooring operations when conditions allowed; these won time for us to successfully conduct all operations despite an extremely tight cruise plan. The FOO, James Brinkley, communicated very well with the scientific party and kept operations running smoothly and successfully. Our very sincere thanks go to the deck crew, led by Bruce Cowden. Their efficiency and expertise with ATLAS mooring operations was evident. We thank Chief Survey Technician Jonathan Shannahof for his assistance and advice in many operations, and Electronics Technician Jeff Hill for endless patience and hours of assistance with equipment ranging from computers to broken antennae. We also thank all the rest of the crew who supported the effort, including the impressive results of Chief Steward Michael Smith and his cooks’ efforts. Introduction 1. PIRATA Northeast Extension (PNE) The Pilot Research Moored Array in the Tropical Atlantic (PIRATA) is a three-party project involving Brazil, France and the United States that seeks to monitor the upper ocean and near surface atmosphere of the Tropical Atlantic via the deployment and maintenance of an array of moored buoys and automatic meteorological stations. The array consists of a backbone of ten moorings that run along the equator and extend southward along 10ºW to 10ºS, and northward along 38ºW to 15ºN.
Fig. 1: Cruise track of PNE2011 (black), Charleston, SC to Cape Town, South Africa, and the Tropical Atlantic PIRATA array: backbone (red squares), Brazilian southwest extension (yellow circles), and the US Northeast Extension (blue stars).

4
The northeastern and north central Tropical Atlantic is a region of strong climate variations from intraseasonal to decadal scales, with impacts upon rainfall rates and storm strikes for the surrounding regions of Africa and the Americas. The northeastern Tropical Atlantic includes the southern edge of the North Atlantic subtropical gyre, defined by the westward North Equatorial Current (NEC), and the northern edge of the clockwise tropical/equatorial gyre defined by the North Equatorial Countercurrent (NECC). This area is the location of the North Atlantic’s oxygen minimum zone at a depth of 400—600m. The size and intensity of this zone is a potential integrator of long-term North Atlantic circulation changes, and the extremely low oxygen values have significant impacts on the biota of the region. The cyclonic Guinea Dome is centered near 10ºN, 24ºW, between the NECC and NEC in the eastern Tropical Atlantic. It is driven by trade wind-driven upwelling, and may play an active role in modulating air-sea fluxes in this region. The Tropical North Atlantic is the Main Development Region (MDR) of tropical cyclones. Many major hurricanes that ultimately threaten the eastern United States begin as atmospheric easterly waves that propagate off the African continent. Once over the MDR in the band 10-20ºN, these waves are exposed to convective instability driven by the upper ocean’s heat content. The resulting infusion of energy can result in closed cyclonic circulation and development from tropical depression to tropical storm and hurricane. These hurricanes are known as Cape Verde-type hurricanes, to distinguish them from storms forming further west, and they are often the most powerful storms to strike the US east coast. Prominent examples include Andrew (1992), Floyd (1999) and Ivan (2004). An average season has two Cape Verde hurricanes, but some years have up to five while others have none. There is profound uncertainty regarding the specific atmospheric/oceanic conditions that determine which of the atmospheric waves will develop into tropical cyclones and then hurricanes (on average, one of ten). Specifically, the quantitative effects of the Saharan Aerosol Layer (SAL), anomalous sea surface temperatures (SST), upper layer oceanic heat content and atmospheric wind shear on the formation of tropical cyclones are poorly known. Seasonal tropical storm and hurricane forecasts are generated annually and based primarily on statistical analyses of historical data and the formulation of empirical predictors (e.g., ENSO index, Atlantic SST, Sahel rainfall, etc.). Recent empirical studies have demonstrated that tropical storm and hurricane activity in the Atlantic Ocean varies on decadal and multi-decadal time-scales and that this variability is correlated with SST anomalies in the MDR. The SST signal in the MDR has been correlated with the North Atlantic Oscillation (NAO) on decadal time scales. The multi-decadal signal indicates that an extended period of increased hurricane activity is to be expected. Other historical studies have also demonstrated spatial variability in storm formation areas and landfall locations on longer timescales. Despite the climate and weather significance of the Tropical North Atlantic region, it was not sampled by the PIRATA backbone array apart from the 38W-line of moorings extending north to 15N (Fig. 1). In 2005, a formal Northeast Extension of PIRATA was proposed as a joint project between NOAA/AOML and PMEL (Rick Lumpkin, Mike McPhaden and Bob Molinari, co-principal investigators). This PIRATA Northeast Extension (PNE) was proposed to consist of four moorings, three creating a northward arm up 23W (building upon the equatorial backbone mooring there), and a fourth extending the 38W arm to 20N. In June 2006, the first two moorings of this extension were deployed during RB-06-05a. The mooring at 11.5N, 23W was deployed on June 7, and the mooring at 4N, 23W was deployed on June 11. Both moorings were replaced in May 2007, during RB-07-03, and two more

5
moorings were added at 20.5°N, 23°W and 20°N, 38°W. The four buoys were planned for servicing in the April 2008 cruise RB-08-03. Due to the cancellation of this cruise, the buoys failed and a data gap was created in mid to late 2008. All four sites were subsequently serviced in November 2008 by NOAA charter of the French R/V Antea. In 2009, the moorings were serviced during RB-09-04, 11 July—11 August. In 2010, the moorings were serviced during RB-10-03, 26 April—22 May. All four were serviced during this cruise and are currently successfully reporting meteorological and oceanographic data onto the Global Telecommunications System for weather and climate forecasting. In the Memorandum of Understanding from the PIRATA-12 meeting (November 2006), the United States agreed that
[I]t is recognized that the Parties are dependent upon year-to-year funding allocations from their governments, and thus commitments for future funding and logistical support can not be guaranteed. Given this proviso, the Parties affirm that PIRATA is a high priority for Brazil, France, and the United States, and that the institutions are making plans for continued support … NOAA will provide ship time for maintenance of four moorings in the North East Extension.
The Ronald H. Brown cruise RB-11-01 served to honor this commitment for the year 2011. 2. Aerosols and Ocean Science Expedition (AEROSE) Large uncertainties remain in our understanding of the impact of mineral dust and biomass burning aerosols on weather and climate. The African continent is one of the world’s major source regions of mineral dust and biomass burning smoke aerosols. These aerosols are transported within prevailing easterly winds as large-scale outflow plumes over the tropical Atlantic, impacting phenomena ranging from cloud-seeding and precipitation, ocean fertilization, downstream air quality and ecosystem impacts in the Caribbean and U.S. eastern seaboard, tropical cyclone development, net surface heat flux, tropospheric ozone and other trace gases, and NOAA infrared satellite data products. Red tides, increasing rates of asthma, and precipitation variability in the eastern Atlantic and Caribbean have been linked to increases in the quantities of Saharan dust transported across the Atlantic. The contribution of the Saharan air layer (SAL) to the development of the West African Monsoon (WAM) and its role in tropical cyclogenesis are just beginning to be understood. The interplay between thermodynamics, microphysics, and aerosol chemistry are currently unknown. Understanding of the mobilization, transport, and impacts of aerosols originating from natural and anthropogenic processes in Africa on the meteorology and climate of the tropical Atlantic is therefore a high priority. With these considerations in mind, the NOAA Aerosols and Ocean Science Expeditions (AEROSE) attempt to achieve a comprehensive measurement-based approach for gaining understanding of the impacts of long-range transport of mineral dust and smoke aerosols over the tropical Atlantic (Morris et al., 2006; Nalli et al., 2011). The project hinges on multi-year, trans-Atlantic field campaigns conducted in collaboration with PNE project over the tropical Atlantic. AEROSE is supported through collaborative efforts with NOAA’s National Environmental Satellite Data and Information Service, Center for Satellite Applications and Research (NESDIS/STAR) and the National Weather Service (NWS), as well as NASA and several academic institutions linked through the NOAA Center for Atmospheric Sciences at Howard University. The AEROSE trans-Atlantic campaigns (to date, comprised of eight, 4-week Project legs) have thus acquired a set of in situ measurements to characterize the impacts and microphysical evolution of continental African aerosol outflows (including both Saharan dust and sub-Saharan
6
and biomass burning) across the Atlantic Ocean (Nalli et al., 2011). Beginning with the first campaign in 2004, AEROSE has sought to address three central scientific questions (Morris et al., 2006):
1. How does Saharan dust, biomass burning aerosol, and/or the SAL affect atmospheric and oceanographic parameters during trans-Atlantic transport?
2. How do the Saharan dust aerosol distributions evolve physically and chemically during transport?
3. What is the capability of satellite remote sensing and numerical models for resolving and studying the above processes?
Order of operations:
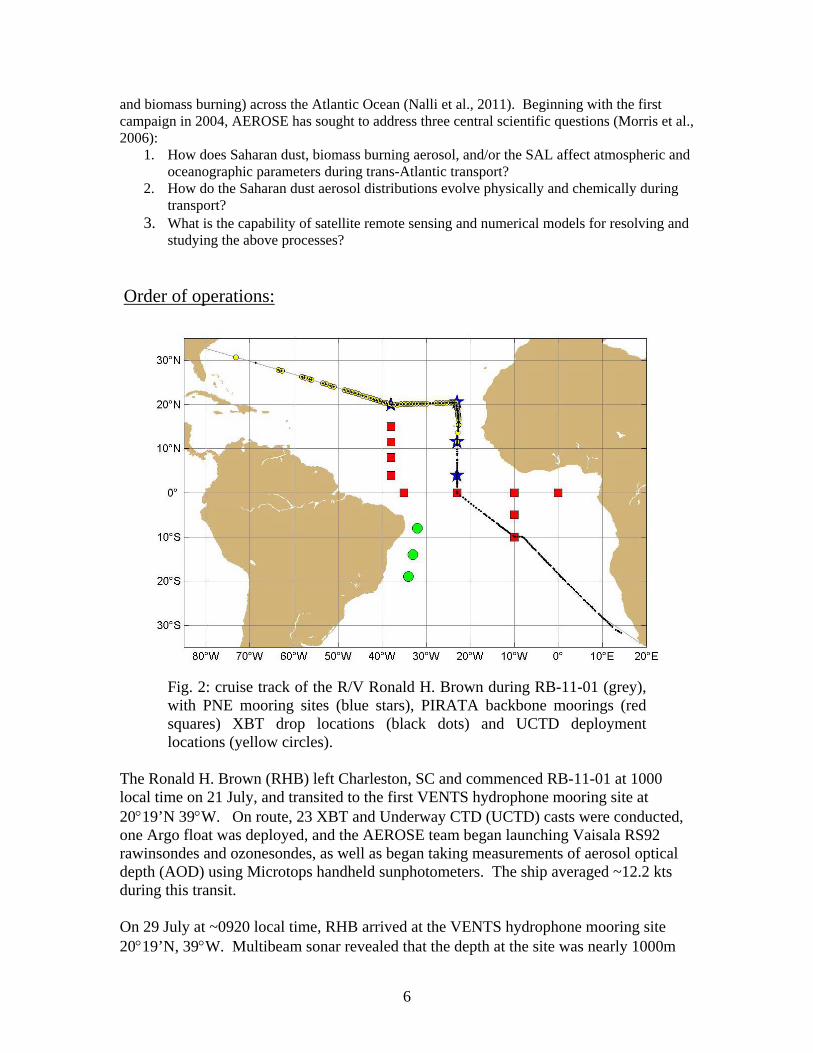
Fig. 2: cruise track of the R/V Ronald H. Brown during RB-11-01 (grey), with PNE mooring sites (blue stars), PIRATA backbone moorings (red squares) XBT drop locations (black dots) and UCTD deployment locations (yellow circles).
The Ronald H. Brown (RHB) left Charleston, SC and commenced RB-11-01 at 1000 local time on 21 July, and transited to the first VENTS hydrophone mooring site at 2019’N 39W. On route, 23 XBT and Underway CTD (UCTD) casts were conducted, one Argo float was deployed, and the AEROSE team began launching Vaisala RS92 rawinsondes and ozonesondes, as well as began taking measurements of aerosol optical depth (AOD) using Microtops handheld sunphotometers. The ship averaged ~12.2 kts during this transit. On 29 July at ~0920 local time, RHB arrived at the VENTS hydrophone mooring site 2019’N, 39W. Multibeam sonar revealed that the depth at the site was nearly 1000m

7
deeper than inferred from Smith and Sandwell bathymetry and used for the mooring design, and on the flank of a shallower bathymetric feature with a peak to the north of the site. A relatively flat site near the target depth was identified a few miles to the north, and the mooring was successfully deployed at 1407—1536 UTC. Initial attempts to communicate with the deployed mooring were unsuccessful, but switching deck units and repositioning the ship resolved the problem and a successful deployment was verified by 1700 UTC. RHB then proceeded to the PNE site 20N 38W, arriving at dusk on 29 July (~2100 UTC). The existing ATLAS mooring was released and the work boat was launched shortly after the end of nautical twilight. On the evening of 29 July, the mooring was recovered. The first CTD cast was conducted from 0226 to 0341 UTC on 30 July, to a depth of 1500 dbar, without problems. A concurrent XBT deployment was conducted. After finishing the CTD cast, two UCTD casts were conducted with the maximum (600m) wire while the ship moved at 1 kt. See UCTD section of this report for details. Through the rest of the night, a multibeam survey was conducted from 2001.4’N 3753.8’W (two miles WNW of the ATLAS site) to 1959.8’N 3742.0’W (five miles ESE of the T-FLEX site). On the morning of 30 July, the T-FLEX mooring was successfully deployed (1129—1437 UTC). On the afternoon through early evening (1730—2020 UTC), the ATLAS mooring was successfully deployed. RHB concluded operations at this site at 2100 UTC on 30 July and proceeded to the PNE site at 2030’N 23W. RHB arrived at 2030’N 23W at 0900 UTC on 3 August. Recovery of the existing ATLAS mooring commenced at 0930 UTC and required three hours. The CTD cast was conducted at 1249—1404 UTC. For this cast, both UCTD probes were strapped to the CTD package for direct comparison of their profiles to the CTD, and an XBT drop was conducted while the CTD package was descending. During the early afternoon (1434—1645 UTC), the new ATLAS mooring was deployed. After the anchor was dropped and while in-situ sensor performance was being evaluated, the chief scientist was informed that Cape Verde EEZ clearance had been granted. By 1750 UTC, the mooring had settled and was determined to be functioning properly, and RHB proceeded south along 23W; a drifter pair was deployed upon leaving the 2030’N site at 1745 UTC. On the evening of 4 August, the UCTD clutch, drum and motor assembly failed and the system became inoperable. Recovery of the deployed probe required slowing the ship to ~8 knots, then under 1 knot for over an hour. See UCTD section of this cruise report for details on the UCTD. No subsequent underway casts were conducted with the UCTD. RHB arrived at 1130’N 23W shortly before 1300 UTC on 5 August. The existing mooring was released at 1305 UTC and recovered from 1400—1644 UTC. The CTD cast was conducted at 1647—1807 UTC, with UCTD probe S/N 70200059 strapped to the package; a concurrent XBT drop was conducted at 1718 UTC. The deployment of the new ATLAS mooring was then conducted from 1900—2203 UTC, with the subsequent flyby determining that the mooring was functioning correctly.
8
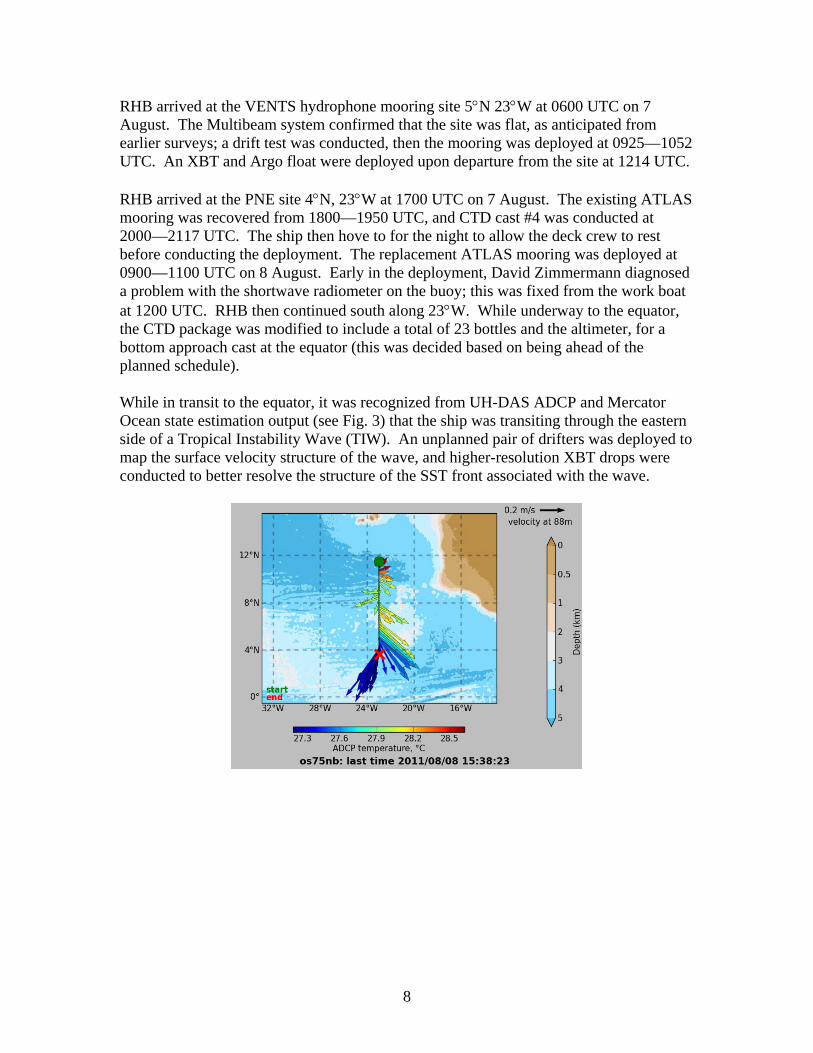
RHB arrived at the VENTS hydrophone mooring site 5N 23W at 0600 UTC on 7 August. The Multibeam system confirmed that the site was flat, as anticipated from earlier surveys; a drift test was conducted, then the mooring was deployed at 0925—1052 UTC. An XBT and Argo float were deployed upon departure from the site at 1214 UTC. RHB arrived at the PNE site 4N, 23W at 1700 UTC on 7 August. The existing ATLAS mooring was recovered from 1800—1950 UTC, and CTD cast #4 was conducted at 2000—2117 UTC. The ship then hove to for the night to allow the deck crew to rest before conducting the deployment. The replacement ATLAS mooring was deployed at 0900—1100 UTC on 8 August. Early in the deployment, David Zimmermann diagnosed a problem with the shortwave radiometer on the buoy; this was fixed from the work boat at 1200 UTC. RHB then continued south along 23W. While underway to the equator, the CTD package was modified to include a total of 23 bottles and the altimeter, for a bottom approach cast at the equator (this was decided based on being ahead of the planned schedule). While in transit to the equator, it was recognized from UH-DAS ADCP and Mercator Ocean state estimation output (see Fig. 3) that the ship was transiting through the eastern side of a Tropical Instability Wave (TIW). An unplanned pair of drifters was deployed to map the surface velocity structure of the wave, and higher-resolution XBT drops were conducted to better resolve the structure of the SST front associated with the wave.

9
Fig. 3: Top: UH-DAS ADCP output on 8 August (ship location indicated by “x”), showing the strong alternating eastward/westward and uniformly southward currents associated with a TIW. Bottom: visualization of SST from Mercator Ocean state estimation, indicating the TIW (cusp-like disturbance in SST centered at ~25W, between the equator and 4N).
RHB arrived at the equator at ~0900 UTC on 9 August, where small boat operations were conducted to repair the wind sensor on the French backbone PIRATA mooring. An initial anemometer swap confirmed that the compass located in the mooring tube needed to be replaced; this was done with a second boat launch, concluded by 1040 UTC. CTD cast #5 was then conducted from 1111—1402 UTC, which reached a depth of 3972 dbar (3930 m wire out) with the altimeter reading ~10m above the bottom. After sampling was concluded for CTD cast #5, four drifters were launched simultaneously in a cluster to measure near-equatorial dispersion and surface divergence. RHB was in transit to the third hydrophone mooring site on 10 August, while “pollywog” to “shellback” conversion operations were conducted on the bow and fantail. RHB arrived at the VENTS hydrophone mooring site 5S 16.5W at 0900 UTC on 11 August and conducted a multibeam survey of the site, revealing a relatively flat area close to the target depth of the mooring. The mooring was deployed at 1132—1256 UTC. After allowing the mooring to settle for an hour, the release was interrogated to confirm that the mooring was stationary at its target location and depth. RHB arrived at the final PIRATA site 10S 10W at 0900 UTC on 13 August and brought the moored buoy aboard for tub repairs (conducted 1048—1320 UTC). These repairs returned to service the near-surface downward looking ADCP on the mooring. CTD cast #6 was conducted to 1500 dbar at 1352—1500 UTC, and RHB then proceeded to the final VENTS hydrophone mooring site at 10S 8W. The survey for the site commenced at 0018 UTC on 14 August, and a flat region at the target depth was quickly identified west of the planned location. The survey was completed at 0056 UTC, and the

10
ship set up for the deployment which commended by 0130 UTC. The anchor was deployed at 0316 UTC, and within an hour the anchor was verified to have settled via echolocation of the release. Having completed all mooring operations, RHB then proceeded for Cape Town. Salinity samples were processed by Shelby LaBuhn on 16—17 August, using the RHB Autosal “Dallas”. Results indicated major discrepancies with sensor values, ultimately diagnosed as a failure of the Autosal (see section on “CTD”, below). RHB arrived at Cape Town, South Africa on the morning of 21 August, one day ahead of schedule thanks to the long transits at >11 kts and the two night operations. Problems identified during the cruise Failure of the autosalinometer “Dallas” As described in more detail in the “CTD” section of this report, large differences were found between the CTD sensor salinities (which agreed with each other very closely) and the calibrated values from the RHB primary Autosalometer “Dallas”. Homogeneous water from the flow-through thermosalinograph system was run through the Autosal, which indicated a spurious freshening trend consistent with the results of the Niskin-sampled water and proving that the Autosal was not functioning properly. UCTD system unreliable As documented in this cruise report the UCTD system rented from Oceanscience was plagued by a number of different problems, with the most significant (and unrepairable) one being the clutch failure that prevented the probe from being deployed while underway. We were pleased that Oceanscience chose not to charge us the rental fee for the system, and are communicating the problems we experienced to them in hopes of improving future versions of the product. Oceanscience has agreed to loan a new system to AOML at no cost for an upcoming cruise. Unannounced garbage incineration On a few occasions, garbage incineration was conducted without first alerting the AEROSE team; this can adversely affect their trace gas measurements. This problem was communicated to the Operations Officer, and subsequent incinerations were announced. Multibeam depths not matching echosounder depths The new Kongsberg EM122 Multibeam system generated seafloor maps that were highly detailed and qualitatively consistent with prior surveys and with changes in depth from the Bathy2010 system, with a swath about 15km wide at a depth of 5000m. However, the absolute depths from the Multibeam system and from the ship’s single-beam, 3.5 kHz sounder didn’t agree, with the Multibeam depths always greater by 50—200m despite the same sound speed (1500 m/s) being used in both. This difference was generally largest in deep water, where discrepancies of 150—200m were common. While it was understood
11
that the Multibeam “depth” value was a swath average of the most vertical beam, it was unclear why this should always be greater than the 3.5 kHz value (which matched earlier surveys and also the total depth at 0, 23W measured by the CTD package with altimeter). The Multibeam system will be more valuable for mooring deployments if this discrepancy is better understood. Inability to use VPN The Cisco Virtual Private Network (VPN) client onboard RHB was disabled in response to updated NOAA IT security policy. Cisco VPN was installed on Nick Nalli’s US Dept of Commerce-issued laptop to secure-connect with the NOAA/NESDIS/STAR network. Nalli had expected to be able to do this while at sea onboard a NOAA vessel (and had done so on past cruises). His purpose would have been to use SSH (a secure shell) and WinSCP (a secure FTP) to access NESDIS/STAR servers in order to carry out basic job tasks expected of him (e.g., moving/uploading/copying documents, running codes, etc.). Suspect thermosalinograph (TSG) values Salinities from the intake TSG initially matched those calculated from conductivity in the pCO2 system, but the difference between these measurements exhibited two jumps during the cruise, resulting in a difference of ~0.1 psu (see section “TSG” of this cruise report for figure). More data, such as the CTD data to be collected during the subsequent CLIVAR cruise, are necessary to determine which of the two is closer to being correct for the 5—6 m deep intake of the underway TSG system. Problems with radiosonde telemetry and ozonesonde batteries Problems with radiosonde telemetry and GPS occurred at the beginning of the cruise due to incorrect cable and antenna setup. Problems in telemetry and GPS reoccurred later in the cruise likely due to a faulty cable connector located outside (perhaps as a result of sea salt). Ozonesondes had problems with battery life under extreme cold conditions (as in the upper troposphere). This problem was worse this year as a result of the first-time usage of dry cells (as opposed to the wet cells used in the past), which have been documented to suffer from this problem (as opposed to overheating as with wet cells). This problem was mitigated through the use of ad-hoc insulating material in the battery compartment on the ozonesonde. Problems with ozonesonde launches while underway In an effort not to interfere with cruising speed, ozonesonde launches were first attempted with minimal ship maneuvering, other than simple slow-downs (without changes in heading). However, a crane blocked access to the starboard quarter and stern (the underway-CTD equipment, something new this year, also presented an obstacle), thereby restricting launches to the port stern. An ozonesonde (a package costing over $1K) was subsequently lost as a result of cross winds off the port bow. To avoid a repeat occurrence, a request was then made on the next launch to change heading and maintain cruising speed to bring relative winds as close to zero as possible. This maneuver ended up taking the ship well off course, so the CO requested an alternative solution, whereby the crane was moved to reestablish access of the starboard stern (but still requiring

12
maneuvering around the underway-CTD setup). Future launches off the stern would then only require a slow-down along with minor heading changes (assuming winds off the bow). So long as the bridge was cooperative, this approach appeared to work well for the remainder of launches. Oceanographic and atmospheric data collected on this cruise:
1. Recovery and redeployment of standard ATLAS moorings at 20°N, 38W; 20.5°N, 23W; 11.5°N, 23W; and 4°N, 23W
2. Deployment of T-FLEX mooring at 20N, 38W 3. Deployment of four VENTS hydrophone moorings 4. Repair of PIRATA backbone moorings at 0, 23W and 10S, 10W. 5. CTD profiles to 1500m depth at all four PNE sites and at 10S, 10W 6. CTD profile to the bottom (3970 dbar) at 0, 23W 7. Salinity of the water samples collected with Niskin bottles 8. Dissolved oxygen concentration of the water samples collected with Niskin bottles 9. Underway CTD casts collected opportunistically along the cruise track 10. Launching of ~200 XBTs 11. Deployment of 10 profiling Argo floats 12. Deployment of 20 surface drifting buoys of the Global Drifter Program 13. Continuous recording of shipboard ADCP data. 14. Heading data from both the MAHRS gyro system and the POS MV for comparison of
heading quality for the MAHRS 15. Continuous recording of Thermosalinograph (TSG) data 16. Weatherpak meteorological sensors (Univ. Miami) 17. Microwave radiometer (Univ. Miami) 18. Marine Atmospheric Emitted Radiance Interferometer (M-AERI) (an infrared Fourier
transform spectrometer (FTS)) to measure uplooking and downlooking spectral radiances, marine boundary layer profiles of temperature and water vapor, and skin SST (Univ. Miami)
19. Microtops handheld sun photometers (HUPAS) 20. Tropospheric profiles of pressure, temperature, humidity and wind from launching of 107
Vaisala RS92 radiosondes during MetOp IASI and Aqua AIRS overpasses (NESDIS/STAR, HUPAS)
21. Ozone profiles from launching of 26 ozonesondes (HUPAS, NESDIS/STAR) 22. Laser particle counters (HUPAS) 23. Broadband pyranometer to measure solar radiation (HUPAS) 24. Broadband pyrgeometers to measure downwelling infrared radiation (HUPAS) 25. Trace gas monitors (Ozone, NOx, CO, VOC, and SO2) (HUPAS) 26. Sequential aerosol sampler (HUPAS) 27. Multi-stage aerosol impactors (HUPAS) 28. NOAA-unique IASI granules (L1C radiances and L2 profile retrievals and cloud-cleared
radiances) matched to the radiosonde launch locations/times (NESDIS/STAR)
13
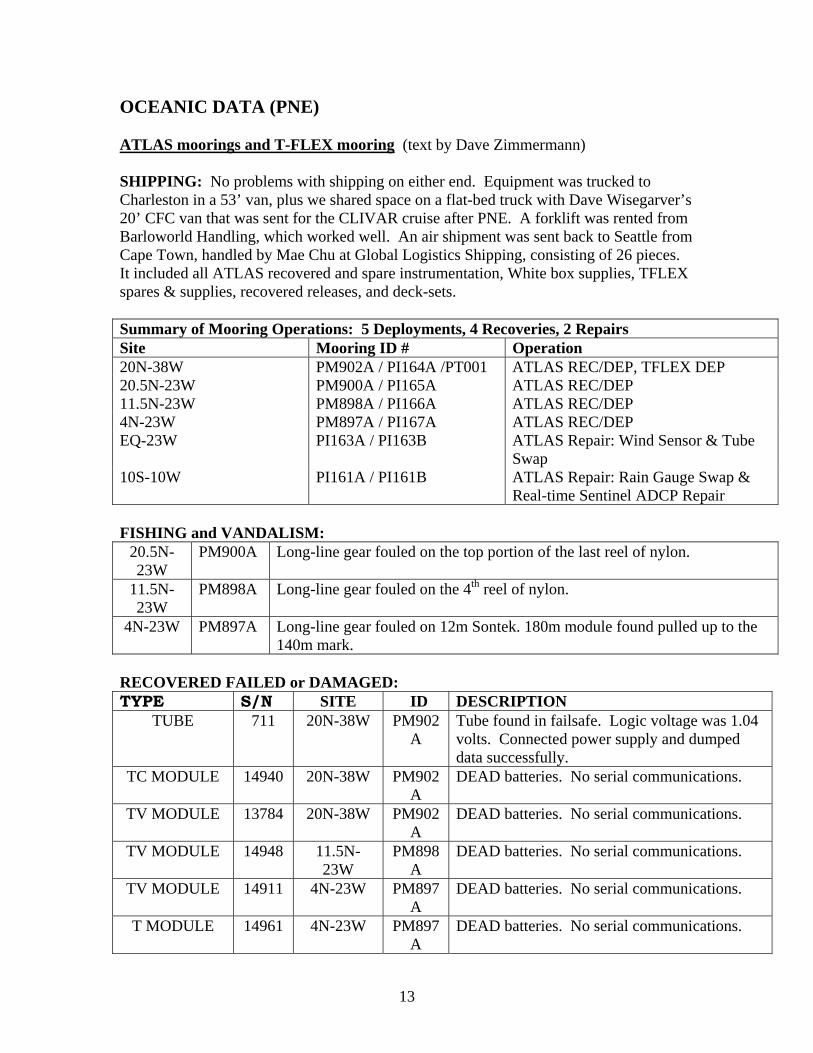
OCEANIC DATA (PNE) ATLAS moorings and T-FLEX mooring (text by Dave Zimmermann) SHIPPING: No problems with shipping on either end. Equipment was trucked to Charleston in a 53’ van, plus we shared space on a flat-bed truck with Dave Wisegarver’s 20’ CFC van that was sent for the CLIVAR cruise after PNE. A forklift was rented from Barloworld Handling, which worked well. An air shipment was sent back to Seattle from Cape Town, handled by Mae Chu at Global Logistics Shipping, consisting of 26 pieces. It included all ATLAS recovered and spare instrumentation, White box supplies, TFLEX spares & supplies, recovered releases, and deck-sets. Summary of Mooring Operations: 5 Deployments, 4 Recoveries, 2 Repairs Site Mooring ID # Operation 20N-38W PM902A / PI164A /PT001 ATLAS REC/DEP, TFLEX DEP 20.5N-23W PM900A / PI165A ATLAS REC/DEP 11.5N-23W PM898A / PI166A ATLAS REC/DEP 4N-23W PM897A / PI167A ATLAS REC/DEP EQ-23W PI163A / PI163B ATLAS Repair: Wind Sensor & Tube
Swap 10S-10W PI161A / PI161B ATLAS Repair: Rain Gauge Swap &
Real-time Sentinel ADCP Repair FISHING and VANDALISM:
20.5N-23W
PM900A Long-line gear fouled on the top portion of the last reel of nylon.
11.5N-23W
PM898A Long-line gear fouled on the 4th reel of nylon.
4N-23W PM897A Long-line gear fouled on 12m Sontek. 180m module found pulled up to the 140m mark.
RECOVERED FAILED or DAMAGED: TYPE S/N SITE ID DESCRIPTION
TUBE 711 20N-38W PM902A
Tube found in failsafe. Logic voltage was 1.04 volts. Connected power supply and dumped data successfully.
TC MODULE 14940 20N-38W PM902A
DEAD batteries. No serial communications.
TV MODULE 13784 20N-38W PM902A
DEAD batteries. No serial communications.
TV MODULE 14948 11.5N-23W
PM898A
DEAD batteries. No serial communications.
TV MODULE 14911 4N-23W PM897A
DEAD batteries. No serial communications.
T MODULE 14961 4N-23W PM897A
DEAD batteries. No serial communications.
14
TUBE 673 0-23W PI163A Compass BAD, fixed output at 254 counts and does not change when tube rotated.
RAIN GAUGE 1094 10S-10W PI161A FAILED? Swapped out during repair. INDIVIDUAL SENSORS LOST AT SEA:
TYPE S/N SITE ID T MODULE 14963 20N-
38W PM902
A TC MODULE 14934 20.5N-
23W PM900
A TP MODULE 13481 20.5N-
23W PM900
A TC MODULE 14948 11.5N-
23W PM898
A TC MODULE 14936 4N-23W PM897
A TC MODULE 14937 4N-23W PM897
A TC MODULE 14938 4N-23W PM897
A PI1-10 PRE-DEPLOYMENT FAILURES & PROBLEMS:
TYPE S/N DESCRIPTION T MODULE 15523 Failed, no inductive communications, reading 0E. Found batteries dead.
TC MODULE
14879 Failed, no inductive communications, reading 0E. Reset, then back out on test. Worked when temperature was below 31 deg C, but then inductive data was 0E for 3 days, so replaced with spare.
SW RAD 31612 Broken outer glass dome. Tube box got knocked over from wave hitting ship at night.
SW RAD 32394 Broken outer glass dome. Tube box got knocked over from wave hitting ship at night.
ATRH 133408 Not calibrated. Sensor sent for the cruise by mistake. Noteworthy details of ATLAS mooring operations T-FLEX Deployment at 20N-38W: A T-FLEX test mooring was deployed 4.2nm east of the Atlas mooring at 20N-38W. Tower sensors included long wave radiation and a barometer. Note that anti-theft clevis hardware was used to secure the T-FLEX electronics and external battery cases into the buoy well tubes, which requires a special tool. German Oxygen Data Loggers: Oxygen Sensors were recovered and deployed at 300m and 500m on the 4N & 11.5N, 23W moorings. They were provided by a German Institute, IFM-GEOMAR, at the University of Kiel. They shipped the new sensors directly to Charleston and shipped the recovered ones out of Cape Town.

15
Unscheduled Tube Swap at 0-23W: A wind swap was scheduled for the PI163A mooring to fix the winds, but the new wind sensor did not fix it. Transmitted data indicated that the compass data were reading 254 counts. During the buoy ride, it was noticed that the compass data was not changing while the tube was in the wind test mode. The compass data was fixed at 254 counts, indicating that the compass had failed. This necessitated a tube swap with PMEL’s spare tube to fix it, which was successful. Real-time Sentinel ADCP Repair (and Rain Gauge Swap) at 10S-10W, PI161: A special Real-time Sentinel ADCP system was deployed by the French (and Patrick Berk) during the PI2-11-SU cruise in May. Firmware problems caused the battery pack to be depleted, so the buoy was pulled up on deck and the battery pack was replaced. The ADCP data were downloaded and the recorder was erased, because only a 16MByte recorder was used and had filled up with data by the end of June. Both systems were restarted and successfully repaired. A failed rain gauge was also swapped and the tube data dumped. The ship did an excellent job holding station while recovering and redeploying the buoy while the mooring was still anchored. Module Address Mapping at 10S-10W, PI161: As part of the repair at this mooring, we dumped the tube data and then had to restart the tube. David Zimmerman noticed that the module addresses were configured incorrectly. This mooring had a total of 9 conductivity measurements, the SSC and 8 TC modules. The French had all 8 of the TC modules mapped as TC modules in the tube sensor configuration (address mapping), which is not normally done. There are only 7 Argos buffer slots for realtime conductivity measurements. Any TC module whose conductivity data will not be transmitted realtime should be configured in the tube as a T not a TC module. If it is, like the French did, then the conductivity data may not work, which is what happened for this mooring. When it was deployed, C7 did not work. By reconfiguring the non-realtime conductivity TC modules as T modules, the C7 data started working again. It is surprising that this was not seen while the tube was testing on deck (or at PMEL, unless the French changed the configuration). The French should be alerted to this idiosyncrasy of the tube setup and be sent data maps. There was also some confusion as to which TC modules were supposed to be the realtime conductivities. When David Zimmerman went online, the TAO internal design page showed the 100m conductivity was not supposed to be realtime, but the calibration file showed that it was. David Zimmerman decided not to call and wake-up someone at 5am for this, since he figured the calibration file setup had to be correct, which is what was used. As it turned out, it was not. The calibration file was indeed in error. Vents hydrophone moorings (text by Bob Dziak and Russell Pate) An autonomous hydrophone array along the East Pacific Rise (EPR) was first deployed in May 1996 through a cooperative effort by NOAA/PMEL Tropical Atmosphere and Ocean project (TAO) and Vents Program personnel. The EPR earthquake dataset derived

16
from the hydrophones represents a unique time series of acoustic data from a fast-spreading ridge, providing a view of the seismicity over a wide range of magnitudes and reducing the earthquake magnitude of completeness to 2.5-3.0 mb from 4.5 mb of the land seismic networks. This hydrophone earthquake dataset was used to predict (retrospectively) earthquakes of magnitude 5.4 or greater seafloor transform faults on the EPR. In March 2001, an intense swarm of small earthquakes detected by the hydrophones was used to direct a research vessel to the location of a previously unknown hydrothermal vent site along the EPR ridge crest. These discoveries would not have been made if not for the TAO-Vents collaboration that lead to the EPR hydrophone experiment. A similar experiment was also undertaken in the Atlantic Ocean with deployment of autonomous hydrophones moored on the flanks of the Mid-Atlantic Ridge (MAR). In February 1999, a consortium of U.S. investigators (NSF and NOAA) deployed a 6-element hydrophone array for long-term monitoring of (MAR) seismicity south of the Azores between 15—35N. The array was recovered in 2005. In May 2002, an international collaboration of French, Portuguese, and U.S. researchers deployed a 6-element hydrophone array north of the Azores Plateau from 40—50N, led by Dr. Jean Goslin in IUEM at the University of Brest, France. The North Azores array was recovered in September 2003. The improved detection capability of the hydrophones allowed for a better view of the overall spatio-temporal patterns in MAR earthquakes. From February 1999 to July 2002, a total of 9,376 earthquakes were located along the MAR using hydrophone data; by comparison only 626 earthquakes were located along the MAR during this time by land-based seismic networks. We recorded in near real-time, and for the first time, a volcanic eruption at the axis of the MAR just south of the Azores. In many ways the patterns in seismicity we recorded along the ridge axis changed the way people think about how slow-spreading ridges works and the different contributions between magmatic diking and faulting in seafloor spreading. Based on these successes, there is an expressed interest by both NOAA/PMEL and French-IUEM hydroacoustic researchers in expanding the MAR hydrophone array south toward the equatorial Atlantic. The main goal of the Atlantic hydrophone moorings is to collect seafloor earthquake information to test earthquake prediction hypotheses previously posed for fault activity observed in the Pacific. The PIRATA array locations are optimally situated to observe seismic activity from a noted seafloor fault, referred to as the Romanche Fracture Zone (RFZ). The RFZ is one of the largest transform faults on Earth and routinely generates large magnitude (M>4) earthquakes. The RFZ trends roughly west-east between 0°-25°W and 0°-15°W, and therefore, hydrophone moorings deployed near the PIRATA sites will allow near perfect coverage of earthquake acoustic waves emanating from the fault. The juxtaposition of the PIRATA array and RFZ will allow investigation of earthquake prediction models at a slow-spreading ridge and thus, under very different ocean crust and plate motion conditions than have previously been studied in the fast-spread Pacific Ocean crust. Deploying hydrophones at the PIRATA mooring locations also allows monitoring the entire South Atlantic which has never before been achieved with a long-term hydrophone

17
array. As an example, during 2002-2003 our hydrophone array in the North Atlantic detected a massive seafloor volcanic eruption from along the Walvis Ridge, a large seafloor edifice that extends from the Island of Tristan da Cunha to beneath continental Africa. The source of the volcanic signals could not be precisely located using the past configuration of hydrophones in the North Atlantic. Adding these equatorial hydrophones should make it possible to localize the source of this volcanic activity, and to understand better the eruption’s environmental impacts. All hydrophone data will be made available online (both the digital data as well as processed earthquake locations) once the data are recovered and transferred to PMEL (http://www.pmel.noaa.gov/Vents/acoustics/seismicity/seismicity.html). Vents PIs have been studying how to apply the hydrophone data for various climate research topics (estimates of wind speed, wave heights, etc) so in the future the PIRATA community might have a significant interest in the hydrophone data. Summary of Vents hydrophone mooring deployments conducted during cruise: # Deployment date, time Lat Lon Depth EA1 July 29 1535 UTC 20 19.844' N 038 57.924' W 4780 meters EA2 Aug 7 1052 UTC 04 59.446' N 022 59.588' W 4194 meters EA3 Aug 11 1257 UTC. 05 00.425' S 016 30.723' W 4070 meters EA4 Aug 14 0316 UTC 09 59.937' S 008 03.012' W 4470 meters Conductivity-Temperature-Depth (CTD) casts AOML’s CTD package was set up with 18 Niskin bottles, 12 to be fired at various depths to collect water samples for sensor calibration, and six as spares. For the full-depth cast at 0, 23W, 23 bottles were set up and fired at unique depths. This configuration was retained for the final cast #6, with two bottles fired at 11 depths and the final bottle at the surface. The following sensors were used on all casts (numbers indicate serial numbers):
Temperature: 2958 (primary), calibrated 16 February 2011. 4799 (secondary), calibrated 12 March 2010.
Conductivity: 3860 (primary), calibrated 25 February 2011. 3338 (secondary), calibrated 15 February 2011.
Oxygen: 2083 (primary), calibrated 16 March 2011. 1329 (secondary), calibrated 26 February 2011.
The CTD casts were conducted by Rick Lumpkin, Grant Rawson, Verena Hormann and Shelby LaBuhn with the assistance of Survey Technician Jonathan Shannahoff. Oxygen was sampled by Rawson and LaBuhn, while salinity was sampled by Lumpkin and Hormann. CTD processing was performed using Seabird software. Salinity samples were calibrated by Shelby LaBuhn using the Autosal “Dallas” on 16—17 August. Oxygen samples were

18
preserved, to be titrated by George Berberian during the subsequent CLIVAR cruise on RHB. CTD casts are tabulated in Table 1, and preliminary cast data are shown in Fig. 4.
Cast # Date Start Time Bottom Time End Time Lat Lon1 30-Jul 2:24 2:56 3:41 20o01.446'N 037o50.959'W
2 3-Aug 12:38 13:19 14:04 20o26.683'N 023o07.843'W
3 5-Aug 16:47 17:23 18:07 11o28.536'N 023o00.671'W
4 7-Aug 19:50 20:32 21:16 04o01.057'N 022o59.167'W
5 9-Aug 11:10 12:22 14:01 00o01.505'N 023o01.022'W
6 13-Aug 13:51 14:22 15:00 09o54.150'S 009o59.545'W Table 1: locations, dates and times (UTC) of CTD casts.
The Temperature-Salinity structure from the CTD casts is shown in Fig. 4 (bottom right). The nearly linear T-S relationship at intermediate densities is the signature of Central Water, with the one of northern hemisphere origin saltier than the southern hemisphere type (casts #1 & 2 vs. #3 – 6). The lowest salinity measurements indicate the presence of Antarctic Intermediate Water, with local minima in surface salinity associated with the Intertropical Convergence Zone (ITCZ). Maximum salinity measurements were seen in the near-surface, associated with salinity maximum water created in the subduction region of the subtropical North Atlantic. Salinity values from the primary and secondary sensors agreed very closely, with mean offsets never exceeding 4.810-4 psu in any cast, and rms differences of O(0.003—0.004 psu). However, salinity values from the two Autosal runs indicated large differences by the end of each run, of O(0.15—0.2 psu). To verify that the problem was with the Autosal and not with the CTD sensors, approximately homogeneous water was run through the Autosal as follows: at ~1800 UTC on 19 August, Jonathan Shannahoff and Rick Lumpkin filled a 24-bottle case in random order from the TSG flow-through water and allowed the case to rest in the Autosal room overnight; the case was run in sequence through the Autosal by Shelby LaBuhn on the afternoon of 20 August. The freshening trend was quickly apparent, confirming a problem with the Autosal. The underlying causality of the Autosal problem was investigated by Jeff Hill and Jonathan Shannahoff, who determined that the cooling unit had failed. This problem was communicated to the scientific party of the subsquent cruise CLIVAR A10, chief scientist Molly Baringer, as they will be heavily relying on the Autosal for their trans-basin hydrographic section. On Baringer’s request, the alternate Autosal, “Joysey”, was set up to be the new primary Autosal for the CLIVAR cruise. Fortuitously, at the request of CLIVAR investigators, water samples from the final cast (#6) had not been dumped from the Niskin bottles. Before departing Cape Town, water samples were resampled by Rick Lumpkin and Grant Rawson and stored in the Autosal room to equilibrate. On 11 September, Kyle Seaton ran these samples through the

19
Autosal “Joysey” and obtained calibrated values. The results indicated that the sensors were too fresh by ~0.021 psu, with residuals indicating some functionality with respect to temperature and/or pressure. To evaluate this offset, the deep T/S relationship from PNE2011 was compared to the relationship from earlier years. It was clear especially at Eq-23W and 4N 23W that the T/S relationship from the raw sensor values were a much better match (effectively identical, within observed variability) to the relationship in earlier years for intermediate to deep water, while the 0.021 psu offset shifted the T/S relationship to be significantly saltier for these water masses. It was concluded that the salinity of the samples was contaminated by sitting in the Niskin bottles for several days, and the raw sensor values were ultimately used. Postcalibration results from the sensors indicate maximum errors of O(3—410-3 psu).
Fig. 4a: CTD data from secondary sensors, casts #1—6. Only cast #5 (0, 23W) extended below 1500 dbar.

20
Underway Conductivity-Temperature-Depth (UCTD) (text by Rick Lumpkin, Grant Rawson, Verena Hormann, Gustavo Goni and Marlos Goes In an effort to start measuring the upper ocean with new technology, the Physical Oceanography Division at NOAA/AOML has initiated testing the UCTD system (http://www.oceanscience.com/uctd.html) to assess its value for climate-related studies. The UCTD system is capable of collecting temperature and salinity profiles of the upper ocean at underway speeds, to depths of up to 500m. AOML tested one UCTD system with two CTD probes during the PIRATA Northeast Extension cruise (“PNE”) aboard the NOAA ship Ronald H Brown (hereafter RHB), conducted in the tropical and South Atlantic Ocean on 21 July—21 August 2011. This data report summarizes our recommendations to the manufacturer, describes UCTD experiences on PNE 2011, and discusses the resulting data collected from the system. AOML appreciates the many hours that Oceanscience personnel spent helping us during the PNE cruise, and hopes that Oceanscience will be able to address the concerns described herein. The system has promise for extremely valuable observations, but is not in its current state robust enough to warrant deployment. Summary of Upgrade Requirements requested to Oceanscience The following list summarized the major problems that Oceanscience must address with the system for it to be operations-ready in our judgement. As Oceanscience diagnoses these problems, we would appreciate being informed of them and how Oceanscience will address them in the future. In addition to these problems, we recommend that the data output include better internal documentation (e.g., adding a header line to the raw data files stating the ordering of the parameters, coefficients, etc.). PROBLEM 1: The motor in the winch assembly was not robust. RECOMMENDED SOLUTION: a more robust motor must be installed in the winch assembly. Oceanscience will need to diagnose this problem from the equipment shipped after the cruise. This was the most significant problem with the system. PROBLEM 2: Various components of the system had screws when loosened during operation. This included the metal screw which holds the tailspool eye to the tailspool. RECOMMENDED SOLUTION: tighten screws and add loctite to spares kit. PROBLEM 3: Nylon screw in the tailspool broke under normal usage and allowed the adaptor plate to be installed in the wrong configuration.

21
RECOMMENDED SOLUTION: Additional spares or installation of denser nylon screw PROBLEM 4: Winder control panel ceased responding to “enter” button. RECOMMENDED SOLUTION: depends on Oceanscience’s evaluation for the cause of this problem. PROBLEM 5: Rewinder counter stopped counting. RECOMMENDED SOLUTION: increase resolution/frequency of digital counter. PROBLEM 6: Reel not unspooling smoothly, likely related to ultimate winch failure. RECOMMENDED SOLUTION: see PROBLEM 1. PROBLEM 7: Winding motor slowed down and varied in speed for recovery on August 4; fixed by power cycling the rewinder assembly. RECOMMENDED SOLUTION: uncertain if Oceanscience can replicate this problem; solution depends on this. PROBLEM 8: Communications with probe S/N 70200054 ceased on 4 August. RECOMMENDED SOLUTION: Possible failure of Bluetooth transmitter. Solution depends on Oceanscience diagnosis. PROBLEM 9: Communications with probe S/N 70200059 ceased. RECOMMENDED SOLUTION: more firmly secure lithium battery inside probe, as it had disconnected from its solder tabs. PROBLEM 10: Probe S/N 70200059 was 0.2 psu too salty for all drops, from beginning of cruise. RECOMMENDED SOLUTION: pre-cruise calibration may have been faulty, or the sensor may have been cracked during shipment to AOML. UCTD Experience on PNE 2011 Setup of the system was done on the morning of 22 July and a short test cast with a dummy probe was successfully completed before the training by Mr. Grant Rawson began. All components of the system were provided by Oceanscience except the pedestal, loaned by Sean Whelan (Woods Hole Oceanographic Institution). Initial training casts with the system were performed on 22 July at 1045-1100 local time, with a “dummy” probe that did not collect data. On the first cast, the winch motor failed to activate and retrieve the probe; the system was power cycled and the motor then worked. Each of the hydrography team then conducted two deployments and recoveries to an average depth of ~200m. On the RHB, the deck bolts are set aft from the stern by several feet, reducing the distance that the boom can extend over the stern rail. As a consequence, a major challenge was retrieving the probe without striking it against the stern. This was rectified by creating a drogue from a washcloth tie-wrapped around a

22
lead weight at the end of a ~20’ line, which was tied to the UCTD line and deployed immediately before retrieving the probe. On the afternoon (1949 UTC) of 22 July, a sensor-bearing probe was deployed from the UCTD while underway at 13 kts, reaching a pressure of 265 dbar. Again the motor failed to activate when retrieval was attempted, and repeated power cycling did not rectify the situation. The probe was slowly brought in by hand with a wrench over a period of 10—20 minutes, but the enormous resistance at 13 kts made for extremely slow progress. To assist in retrieval, the ship was slowed to 11 kts but with little gain. After another attempt at power cycling, the hand-wrenching continued but the clutch was not set to “full”, allowing it to slip. All prior progress was lost, as was the wrench that was yanked out of Chief Survey Technician Jonathan Shannahof’s hand and flung overboard. After ~20m of line was subsequently recovered by hand, another attempt at power cycling was successful and the winch motor worked. The probe was recovered and the data were successfully downloaded. As a result of this experience, the motor was tested before every subsequent cast to insure it was engaging. Grant Rawson tightened all power connections inside the UCTD, finding one not fully tightened (but not obviously loose). Loose screws in various locations of the UCTD system were a recurring issue during the cruise, as many were found during normal usage of the UCTD. The first loose screw was noticed when we attempted to place the probe in its PVC bath following a successful cast. A loose screw in the body of the probe prevented the probe from sliding fully into the PVC. The probe was brought inside and the screw tightened. At that point we examined all the screws, finding most in the body to be loose, though not to the extent of the first one that brought our attention to the problem. The most notable and most crucial screw we found loose was the screw that holds the tailspool eye to the tailspool. This eye is responsible for connecting the line to the tailspool, which holds the sensor. If this screw had backed completely out, the entire sensor would be lost. We theorized that the action of the probe being pulled along the surface an under constant twisting and bouncing caused the screws to back out. From that point on we check the tightness of the screws at the beginning and end of every UCTD shift and had no further issues. For future UCTD deployments we would recommend issuing a bottle of Loctite 242 to be applied to the external screws to prevent any lose of data or equipment due to loose screws. Later in the cruise another screw related issue arose with the nylon screw in the tailspool, though this one was not a loosening. The nylon screw in the tailspool prevents the tailspool from being rotated but was installed on the probe adaptor plate in the wrong alignment. The nylon screw thus bent and broke, allowing the tailpool to be installed incorrectly. We noticed this prior to deployment and were able to disconnect the tailspool by pushing the springloaded pin in through the small hole in the tailspool base. The nylon screw was replaced with a spare that was included in the UCTD kit, and using a denser nylon screw in the future would prevent this from recurring. RHB proceeded to the first PNE mooring site, 20°N 38°W, arriving at dusk on 29 July (~2100 UTC). A CTD cast was conducted from 0226 to 0341 UTC on 30 July, to a depth of 1500 dbar. A concurrent XBT deployment was conducted. After finishing the CTD

23
cast, two UCTD casts were conducted with the maximum (600m) wire wound onto the probe while the ship moved at 1 kt. The first drop was aborted prematurely, while the second (UCTD cast #27) was allowed to proceed for a full 250 seconds and reached a depth of 576 dbar. While underway to the second PNE site, the UCTD cast with probe S/N 70200059 was compared to the concurrent CTD cast at 20°N 38°W and found to be too salty by ~0.19 psu. This result was consistent with a comparison between the UCTD salinity and climatological salinity. On 1 August at 1630 UTC, the alternate UCTD probe S/N 70200054 was used for the first time, replacing S/N 70200059. At 2123 UTC on 1 August, the UCTD stopped responding to the “enter” button on the winder control panel, preventing the winder from spooling line onto the probe. Grant Rawson opened the case for the winder and found a loose screw that may have shorted out the controller; after e-mail exchanges with Oceanscience it was suggested that we solder pin 39 and 40 together on the control panel, the theory being that we would then use the down arrow instead of the enter key to move through the commands for the rewinder control. This fixed the problem, but not in the way expected. The enter key resumed functionality and the down arrow did not register as an enter. There were no further issues from the rewinder control, and UCTD casts were continued at ~0730 UTC on 2 August. RHB arrived at the PNE mooring site 20°30’N, 23°W at 0900 UTC on 3 August. A CTD cast to 1500 dbar was conducted at 1249—1404 UTC. For this cast, both UCTD probes were strapped to the CTD package for direct comparison of their profiles to the CTD, and an XBT drop was conducted while the CTD package was descending. While continuing sampling along the 23°W line, we noticed that the rewinder line counter stopped counting. The small wheel would spin but the numbers would not increase. This issue arose because the counter used was of very low quality and not up to the stress of the tension put on it by the high test spectra line. Upon relaying this development to Oceanscience, we were told that the counter was a temporary solution while they improved the accuracy of the digital counter readout on the rewinder control panel. For all subsequent casts the digital readout was used to approximate the amount of line wound onto the tailspool. Given the quality of the counter used initially this method was probably just as accurate. On 4 August, while heading south to 11°30’N along 23°W, an additional number of UCTD problems developed. First, the reel began to demonstrate significant resistance to unspooling. During a cast conducted at 0900 UTC, over 500m of line was wound onto the probe which was allowed to drop for 110 seconds, but the reel did not initially unspool from the deck side without assistance by hand. The subsequent profile was only to 300m depth. Second, the winding motor appeared to slow down and vary in speed, thus not properly winding the line on the probe. Power cycling the winding motor appeared to fix this problem. Third, due to user error (winch motor switched to “fast” while the probe was on the winder), the line was jerked tight and the rollers on the winder were bent; these were subsequently unbent to allow them to function properly during winding. Fourth, the probe S/N 70200054 became unresponsive, perhaps due to a failure

24
of the Bluetooth transmitter in the probe, and we were unable to communicate with it for the remainder of the cruise. Probe S/N 7020059 also became unresponsive around this time, with what looked to be a very similar problem to S/N 7020054. Upon opening the probe and examining the internals, it became obvious what the problem was: one of the lithium rechargeable batteries had disconnected from its solder tabs. Attempts to solder the tab back to the battery were unsuccessful so electrical tape was employed. This fixed the problem for the remainder of the deployments. The problem with probe S/N 70200054 was never resolved at sea: although bluetooth discovery was eventually recovered, a serial port could never be opened. We are awaiting Oceanscience to get back to us regarding this issue once they receive the equipment and diagnose the problem. Our final and most serious issue was a culmination of the motor and winch issues from 4 August. The combination of clutch, drum, and motor issues we were experiencing, would not allow a probe to deploy past 30m, due to the fact that is was extremely difficult to pull line off the drum. On the advice of Oceanscience we opened the winch housing and cleaned the clutch with brake cleaner and compressed air, the thinking behind this being that the clutch was sticking and thus preventing the drum from spinning. We thoroughly cleaned the clutch using brake cleaner and compressed air, removing all the copper colored dust that had built up through normal use. Following this the drum moved more freely, not as effortlessly as originally but noticeably improved. At this point we decided to test the winch assembly, deploying and recovering just the line without a probe attached. We had been doing this periodically throughout the cruise to remove any twists that developed in the line during deployment and recovery. After getting enough line trailing in the water to provide drag, it came off the drum almost as effortlessly as when new. After deploying roughly 300m of line, the brake was applied, the clutch was engaged, and the motor recovered the line without incident. At this point we decided to do a cast with the real probe. We wound roughly 400m of line onto the tailspool and deployed the instrument. After allowing the probe to fall for the requisite amount of time we engaged the clutch and began retrieving with the motor. After retrieving about 50m of line the motor shut down and there was a strong smell of burning from inside the winch housing. We retrieved a fire extinguisher as a precaution, but thankfully did not need to use it. Hand recovery of the line began using the ¾ inch recovery bolt in the side of the winch housing. This is an extremely slow method to recover the line, but we did make some progress, recovering roughly 30m over 30 minutes. Once we were able to located a drill that would accept the ½” socket we attempted to recover using the drill instead of the hand wrench. The resistance of the line in the water and the added resistance of clutch issue was too much for the drill to overcome and initiate recovery. The ship was slowed to ~8 kts which eased the resistance enough so that we were able to begin recovery using the drill. The drill was just about as slow as recovery by hand, but a little easier. Slowing the ship to just 1 kt was enough to increase the speed of recovery, but only slightly. After recovering by hand and drill for over an hour and only recovering roughly 100m of line the decision was made to try the motor once more. The motor successfully started and began recovering at a greatly reduced rate, though still a little faster than both hand and drill recovery. At this point the ship was still making minimum headway, roughly 1 kt, and

25
the line and probe were successfully recovered after another 30 minutes of motor recovery. With the probe onboard, we attempted to pull line off the drum to place the tailspool in the rewinder assembly. The drum was completely seized and no line could be removed from the drum. After this incident it was decided to cease all further deployments of the UCTD. The next morning we examined the winch housing to try to deduce the cause of the problems, but due to the extensive damage it was hard to tell what caused the problems and which were side effects. It was found that the burning smell, noticed during the motor failure, was due to the sheathing on the power leads for the motor having melted. This was obviously caused by the motor overheating, which caused it to cease working. What is unclear is whether the overheating was caused by the clutch issue or simply that the motor is not robust enough for this type of usage. We are awaiting word from Oceanscience as to what the final issue was with the winch assembly that caused this catastrophic failure. UCTD data Only downcast values were used, as upcast values were generally much noisier (presumably because water does not directly enter the openings for the sensors when the probe is pulled backward through the water during the upcast). UCTD salinity was calculated from temperature and conductivity values, with a one-record (1/16 sec) delay for temperature and pressure compared to conductivity. Calculations by Verena Hormann confirmed that this delay was the optimum value to maximize the correlation for high-frequency signals in temperature and conductivity. UCTD temperature and salinity values were compared to concurrent (uncalibrated) CTD salinity for validation and calibration. These calibration casts were: UCTD cast # Probe S/N CTD cast # Notes
27 70200059 1 drop to ~600dbar after CTD 46 70200054 2 UCTD probe strapped to CTD 47 70200059 2 UCTD probe strapped to CTD 60 70200059 3 UCTD probe strapped to CTD 61 70200059 4 UCTD probe strapped to CTD
Probe S/N 70200054 was not able to be communicated with between CTD casts #2 and 3, and was thus not deployed on casts #3 and 4. Probe S/N 70200059 was also deployed during CTD cast #4 (strapped to the CTD package), but the magnet was not removed prior to deployment and thus no data were collected. For both UCTD probes, temperature matched well with CTD temperatures, with standard deviations of 0.02°C and mean offsets of O(0.01°C). UCTD probe S/N 70200054 matched uncalibrated CTD salinities, with a standard deviation of 0.02 psu and a mean offset of 0.01 psu. UCTD probe S/N 70200059 had an obvious offset from the CTD sensors, reading approximately 0.2 psu too salty, with a standard deviation of 0.03 psu; this bias was also apparent from comparison to climatological salinity. Differences with CTD salinity also suggested a relationship with temperature. Salinity from this probe was corrected as:
Scorr=Sraw + (a + b*T),

26
where T is the in-situ UCTD temperature, a=-0.2017 psu and b=7.4968e-4 psu/C. Temperature and salinity sections for the corrected UCTD data are shown in Fig. 4b.
Fig. 4b: temperature (top) and salinity (bottom) sections collected by the UCTD, with salinity values corrected to match CTD sensor values. Left: sections for the transit from Charleston to 20.5N 23W. Right: sections for the transit south along 23W.
Recommendations for future UCTD deployments
The following materials are recommended to have aboard the ship on future use of the UCTD system. Drogue and line – During recovery, the probe can swing and strike against the stern of the ship. This problem was ameliorated during PNE11 by constructing a drogue from a washcloth and the metal release for an Argo float (the metal piece that holds the yellow straps prior to deployment). This assembly was tie-wrapped together and tied to the end of thin line ~20’ long. Immediately prior to recovery, when the probe was trailing just aft of the stern, the line was attached via a bowline knot, the drogue was tossed to the side of the probe, and recovered after the probe. This served to pull the probe aft and away from the stern during recovery, preventing it from swinging into the stern of the ship.

27
Loctite 242 – This is the lower strength loctite, which is a threadlocker compound to prevent screws from loosening. It is strong enough to prevent loosening under normal conditions but not the full strength one that would make removing the screws extremely difficult. This would help in preventing the loose screw issues we saw and provide peace of mind. The screws should still be checked once a day to ensure none are loose. Cover – A cover that encompasses either the entire setup including the stand or two smaller covers that cover the winch housing and rewinder assembly would be helpful in keeping the gear clean and preventing the intrusion of water into either housing. During PNE2011, two old raincoats worked well as covers. Red vinyl tape – This is basically red electrical tape that would be used to cover the important parts of the probes while in transit and storage. When not in use it is a good idea to cover the inlet and outlet holes for the sensor to prevent any contamination as well as taping the magnet in place to prevent it falling out and draining the battery. Vinyl tape is good, because it won’t leave a residue on the sensor housing and red is good because it is highly visible and won’t be easily forgotten on the first deployment. Handheld GPS – A handheld GPS would be very efficient for recording time and position of deployments. The current method of recording the bridge position is less accurate and more time consuming and these can be acquired for little money. Drill Adapters – Adapters to fit a 3/8” or ½” socket to a drill would be very handy in case it is necessary to use the emergency recovery procedure during a motor failure. Almost every ship that these would be deployed on would have a drill, but not all have the ability to use sockets on that drill. Adding these $2 adapters would make emergency recovering much quicker and more efficient. Satellite-tracked Surface Drifters and Argo Floats Twenty satellite-tracked drifters and ten profiling Argo floats were deployed during the cruise, as shown in Fig. 5 and compiled in Table 2. The drifters are mini-Surface Velocity Program types, drogued at 15m to follow mixed layer currents; all included a thermistor on the surface buoy for SST. Their data are transmitted in real time via the Argos system. Most of the drifters were launched in pairs, one immediately after the other, with initial separation of a few meters, to permit studies of ocean dispersion. Very shortly after crossing the equator, a cluster of four drifters was deployed within a meter of each other. All drifters were deployed from the port side fantail of the RHB. The floats were WHOI-manufactured Argo floats, all activated during loading in Charleston prior to the cruise. Floats were launched either port side fantail, or port side beside the hangar where the CTD package is normally deployed.
ID Date Time (UTC) LAT LON drifter 1 106548 29-Jul 20:35 20º 6.135' N 038º 9.987' Wdrifter 2 106541 29-Jul 20:35 20º 6.135' N 038º 9.987' W

28
drifter 3 106542 1-Aug 0:44 20º 10.202' N 032º 45.384' Wdrifter 4 106539 1-Aug 10:11 20º 13.227' N 031º 00.312' Wdrifter 5 106540 2-Aug 3:01 20º 18.483' N 027º 57.805' Wdrifter 6 106555 2-Aug 3:01 20º 18.483' N 027º 57.805' Wdrifter 7 106553 3-Aug 17:45 20º 26.531' N 023º 7.344' Wdrifter 8 106554 3-Aug 17:45 20º 26.531' N 023º 7.344' Wdrifter 9 92982 8-Aug 16:11 3º 21.37' N 022º 59.197' Wdrifter 10 106556 8-Aug 16:11 3º 21.37' N 022º 59.197' Wdrifter 11 106525 9-Aug 14:51 0º 3.525' S 022º 54.863' Wdrifter 12 106526 9-Aug 14:51 0º 3.525' S 022º 54.863' Wdrifter 13 106527 9-Aug 14:51 0º 3.525' S 022º 54.863' Wdrifter 14 106528 9-Aug 14:51 0º 3.525' S 022º 54.863' Wdrifter 15 106524 13-Aug 15:11 9º 54.168' S 09º 59.339' Wdrifter 16 106521 13-Aug 15:11 9º 54.168' S 09º 59.339' Wdrifter 17 106519 15-Aug 14:52 14º 55.033' S 03º 18.926' Wdrifter 18 106520 15-Aug 14:52 14º 55.033' S 03º 18.926' Wdrifter 19 106522 17-Aug 1:29 20º 00.517' S 01º 39.000' E drifter 20 106523 17-Aug 1:29 20º 00.517' S 01º 39.000' E float 1 1054/70890 24-Jul 6:58 28º 23.663' N 065º 8.442' Wfloat 2 1059/77480 28-Jul 4:34 22º 16.492' N 045º 11.418' Wfloat 3 1062/73510 2-Aug 9:10 20º 20.498' N 026º 47.156' Wfloat 4 1063/24680 5-Aug 7:14 12º 37.527' N 022º 54.199' Wfloat 5 1064/76480 6-Aug 15:11 8º 5.947' N 023º 00.195' Wfloat 6 1065/77600 7-Aug 12:14 4º 57.287' N 022º 59.95' Wfloat 7 1061/00990 10-Aug 11:22 2º 26.75' S 019º 49.117' Wfloat 8 1077/104008 11-Aug 16:26 5º 14.199' S 016º 11.241' Wfloat 9 1081/104012 12-Aug 9:44 7º 11.437' S 013º 35.881' Wfloat 10 1055/79500 13-Aug 15:17 9º 54.112' S 09º 58.662' W
Table 2: drifter and float deployment log. Locations and times are repeated for second drifter in pair deployments.

29
Fig. 5: deployment locations for drifters (black stars, circles indicate more than one at a location) and floats (red squares).
Expendable Bathythermograph (XBT) casts A total of 207 XBTs were deployed and successfully collected data during the cruise (Fig. 2). The XBTs were Deep Blue, with the following manufacture information: Date of Man. Case #s Serial #s 10/30/09 1573 1106962—1106973 11/14/09 2063 1112842—1112853 11/14/09 2065—2071 1112886—1112949 11/17/09 2075 1112986—112997
11/17/09 2078—2080 1113022—1113057 8/24/10 2560 1152166—1152177 8/24/10 2564 1152214—1152225 8/24/10 2566—2567 1152238—1152261
All XBTs were launched from the stern of the ship, using the hand launcher and the WinMk21 software for data acquisition. The resulting data were ftp’d to AOML and put on the Global Telecommunications System in near-real time for ocean state estimation and other efforts utilizing the GTS data stream. Temperature sections from these data are shown in Fig. 6.

30
Fig. 6: temperature sections (C) collected by XBTs. Top: eastward transit from Charleston to 20.5N 23W. Bottom: southward transit along 23W to the equator, then to 10S 10W and on to Cape Town. The shallow XBT at ~16N struck bottom on the Cape Verde plateau.
Shipboard Acoustic Doppler Current Profiler (ADCP) Current profiles were collected continuously throughout the cruise by the 75 kHz Ocean Surveyor ADCP and visualized using the UHDAS acquisition, processing, monitoring and data access system (Erik Firing and Jules Hummon). This preprocessed system also provides Matlab-ready data sets for further visualization. Fig. 7a shows the near-surface currents along the ship track from the ADCP. Fig. 7b shows zonal and meridional velocity sections along 23W from these data, revealing the alternating eastward/westward and uniformly southward currents from 5—2N associated with the eastern side of a Tropical Instability Wave, and a deep and strong Equatorial Undercurrent from the equator to 2N.

31
Fig. 7a: ~40m depth currents along the ship track from the ADCP, colored
according to TSG SST.

32
Fig. 7b: zonal (top) and meridional (bottom) currents along 23W from the shipboard ADCP. Preprocessed data provided by the UHDAS system.
Shipboard Thermosalinograph (TSG) TSG data (Fig. 8) revealed the salinity maximum region of the subtopical North Atlantic and the salinity minimum of the ITCZ. Temperatures from the TSG are shown in Fig. 7a. TSG data were examined from both the intake TSG and the TSG at the pCO2 sensor in the hydro lab. Fig. 8 shows time series of salinity from these sensors, indicating that while they agreed very closely to lowest order, there was a steplike increase in pCO2 salinity relative to intake TSG salinity on two occasions during the cruise. Comparison to CTD (lower panels of Fig. 8) suggests that the changes may have occurred in the
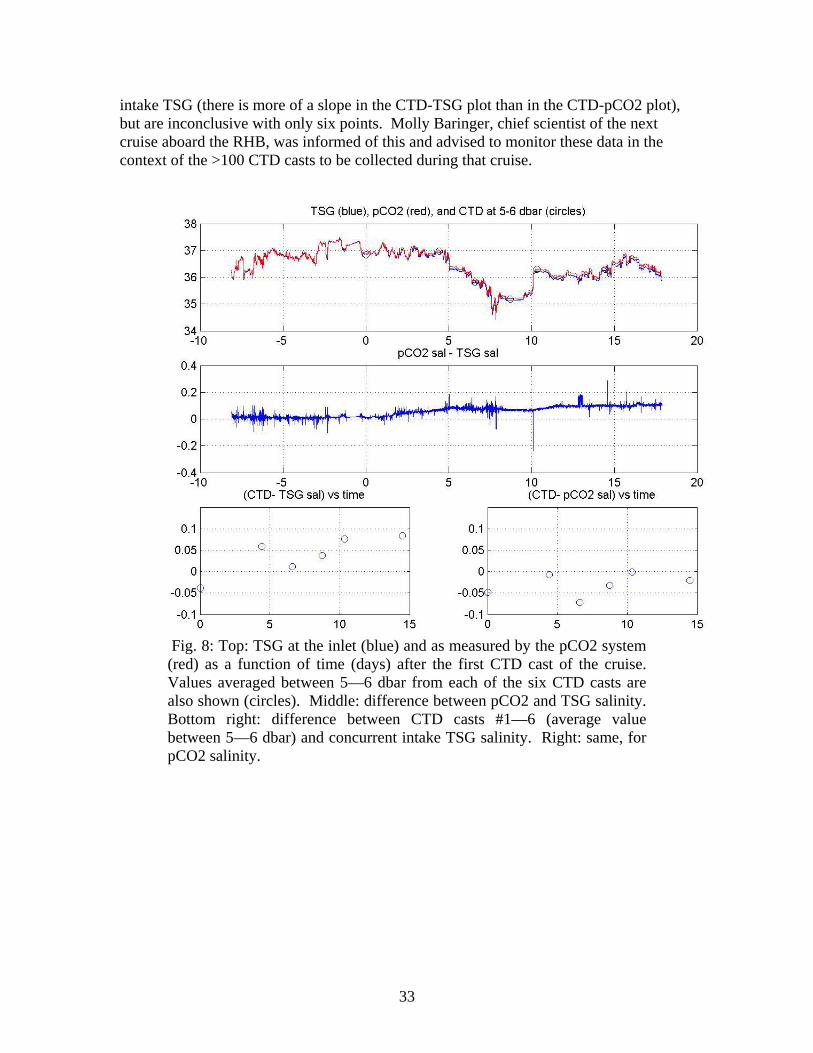
33
intake TSG (there is more of a slope in the CTD-TSG plot than in the CTD-pCO2 plot), but are inconclusive with only six points. Molly Baringer, chief scientist of the next cruise aboard the RHB, was informed of this and advised to monitor these data in the context of the >100 CTD casts to be collected during that cruise.
Fig. 8: Top: TSG at the inlet (blue) and as measured by the pCO2 system (red) as a function of time (days) after the first CTD cast of the cruise. Values averaged between 5—6 dbar from each of the six CTD casts are also shown (circles). Middle: difference between pCO2 and TSG salinity. Bottom right: difference between CTD casts #1—6 (average value between 5—6 dbar) and concurrent intake TSG salinity. Right: same, for pCO2 salinity.

34
Atmospheric Data (AEROSE) (text by Nick Nalli) Radiosonde Observations (RAOBs)
A total of 107 Vaisala RS92 rawinsondes, measuring pressure, temperature, humidity (PTU) and winds, were launched; 5 were lost due to various factors, including inclement weather (cross winds without sufficient ship slow-down or heading change) and telemetry problems, leaving a total of 102 partial or complete soundings (see Figures 9-10). Most of the soundings were launched timed with MetOp IASI and A-Train (Aqua AIRS) overpasses, although some overpasses were missed due to sounding system problems discussed elsewhere in the report, along with the IASI sensor going down for two intervals 18-19 August, and the LaRC satellite overpass predictor going down on two occasions.
Sounding data were sent back to NOAA/NESDIS/STAR on an approximate weekly basis. These were used to obtain IASI matchups for pre-launch cal/val efforts on the NPP CrIMSS sounder EDRs.
Fig. 9: AEROSE Vaisala RS92 sonde launch locations and times

35
Fig. 10: AEROSE Vaisala RS92 soundings, (left) temperature and dew point, and (right) relative humidity (RH).
Ozonesondes A total of 26 EN-SCI ECC ozonesonde packages were interfaced with the RS92
sondes, this providing a sounding of the ozone partial pressure in addition to the PTU measurements (see Figures 11 and 12); this number of launches was 7 more than any previous AEROSE campaign, although the data from 2-3 of the ozone soundings are unusable due to various difficulties with batteries and telemetry (see Figure 12).
The 2011 PNE/AEROSE launches have also now put AEROSE at a total of 115 ozone soundings over the tropical Atlantic. Perhaps more importantly, the majority of the 2011 ozonesondes were launched in the southern hemisphere, yielding by far the best sampling of ozone profiles in the South Atlantic from any AEROSE campaign.
Initial Preps (IPs) and Day of Flights (DOFs) for ozonesondes were carried out on a daily basis with no major issues.

36
Fig. 11: AEROSE ozonesonde launch locations and times.
Fig. 12: AEROSE ozonesonde profiles (partial pressure in red, ambient temperature in black).

37
Microtops Sunphotometer Handheld Microtops sunphotometer measurements of multichannel aerosol optical
depths (AOD) were performed on a daily basis (Figure 13, top), except for periods where excessive cloud cover have prevented taking measurements.
The Microtops multichannel measurements allow for calculation of the Angstrom exponent (Figure 13, bottom), a parameter that is generally inversely correlated with particle size (larger Angstrom exponent indicates smaller particle sizes).
The raw Microtops measurements plotted in Figure 13 reveal that the ship passed through a number of different aerosol outflow regimes, most notably background marine aerosols, Saharan dust, mixed dust-smoke, smoke, background, possibly light dust (non-Saharan in origin), before resuming again to background just before the conclusion of data taking.
Fig. 13: AEROSE Microtops sunphotometer raw measurements (i.e., without QA and MAN processing); (top) AOD, and (bottom) derived Angstrom exponents. (Figure provided by Mayra Oyola)
Downwelling Broadband Surface Fluxes Pyranometers and pyrgeometers measured downwelling shortwave and longwave
radiative fluxes, respectively. Figure 14 shows the raw broadband flux data measured by the AEROSE sensors.
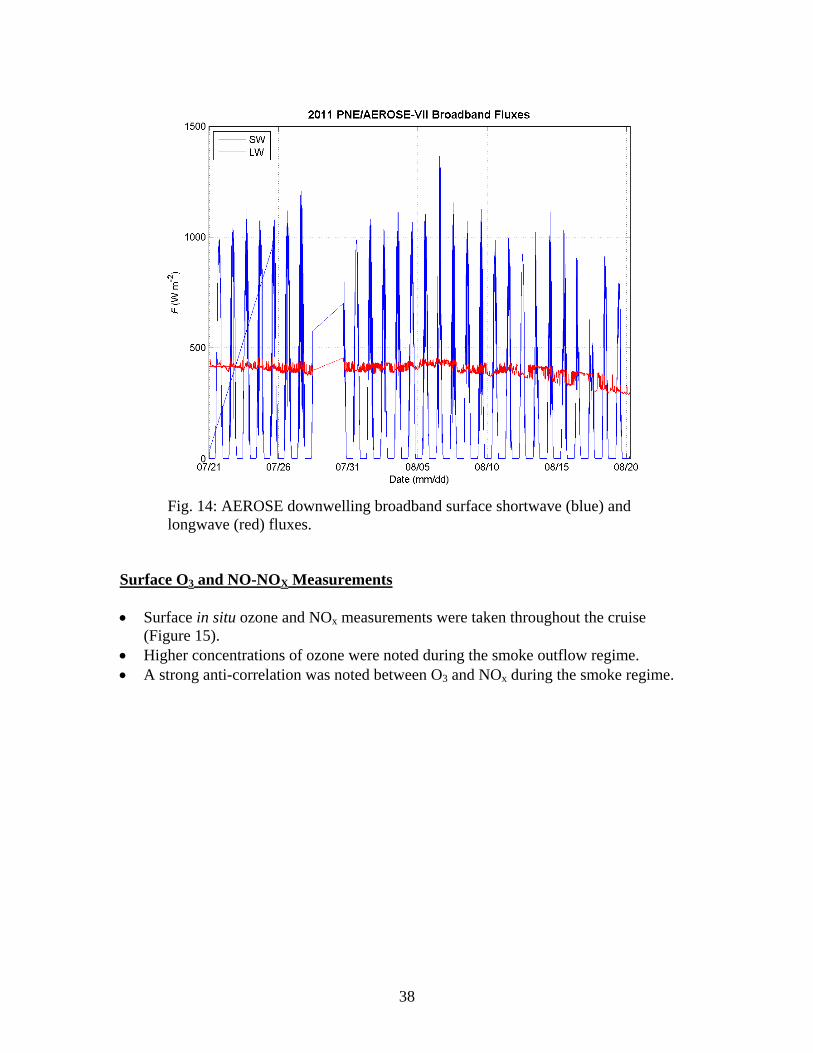
38
Fig. 14: AEROSE downwelling broadband surface shortwave (blue) and longwave (red) fluxes.
Surface O3 and NO-NOX Measurements Surface in situ ozone and NOx measurements were taken throughout the cruise
(Figure 15). Higher concentrations of ozone were noted during the smoke outflow regime. A strong anti-correlation was noted between O3 and NOx during the smoke regime.

39
Fig. 15: AEROSE ozone and NOx surface concentrations (preliminary). Estimated boundaries for the various aerosol regimes are indicated with different colored backgrounds. (Figure provided by Ebony Roper)
Biological and Chemical Sampling Fifteen biological samples were collected during AEROSE-VII. There was some indication of dust at the surface from a biological sample collected
on 4 August as a very faint reddish brown deposit was observed. There was also evidence of dust at the surface on biological sample 7, collected on 5 August 2011. What is believed to be smoke from biomass burning also appeared on biological samples beginning 8-9 August 2011.
What appears to be smoke was first evident on the cellulose filter located on the 6th (bottom) stage on 9-10 August (Figure 16).
Two independent laser particle counters (LPCs) ran nearly continuously during the cruise, although one of these had difficulties with a warning light coming on requiring frequent power-downs to reset. Data collected from the LPCs appeared to be largely consistent with the aerosol regimes and other datasets described elsewhere.

40
Fig. 16: AEROSE PARTISOL 12-hour sample from 10-11 August showing what is believed to be biomass burning smoke at the surface. (Figure provided by Chris Spells)
Fig. 17: AEROSE laser particle counter (LPC) measurements. The top plot shows data from LPC #2, which was more reliable, and the bottom shows data from LPC #1, which had warning light difficulties that required frequent resets. (Figure provided by Justin Perry)