observations of eastward propagation of atmospheric intraseasonal...
TRANSCRIPT
Observations of eastward propagation of atmosphericintraseasonal oscillations from the Pacific to the Atlantic
Wei Yu,1 Weiqing Han,2 Eric D. Maloney,3 David Gochis,1 and Shang‐Ping Xie4
Received 19 April 2010; revised 20 September 2010; accepted 29 September 2010; published 19 January 2011.
[1] Significant 40–60 day intraseasonal variability in surface winds, sea level, andthermocline depth were observed in the tropical Atlantic during the Atlantic Niño year of2002. Satellite‐derived QuikSCAT winds and NOAA Outgoing Longwave Radiation(OLR) measurements for the period of 2000–2006, together with reanalysis of winds froma longer record, are analyzed to understand the sources of this 40–60‐day wind variabilityand the global propagation of the Madden‐Julian Oscillation (MJO) surface signatures.The results demonstrate that the MJO propagated eastward from the Indo‐Pacific Ocean tothe Atlantic during winter and spring of 2002, causing 40–60 day wind variations in theequatorial Atlantic. The Isthmus of Panama appears to be a dominant pathway for thesesurface wind anomalies to propagate into the Atlantic, where they can produceimportant climate impacts. This result is consistent with previous work that hasdemonstrated a strong MJO influence on the North American Monsoon (NAM) region,and complements other work demonstrating the propagation of intraseasonal windanomalies and accompanying sea level pressure signals associated with dry equatorialKelvin waves that reach the Caribbean through the Panama gap. The MJO is alsoshown to have a large influence on the subtropical Atlantic Ocean. Seasonality of theMJO impact on Atlantic surface winds is investigated using data from an extendedrecord, and the most direct influence is found to be during boreal winter and spring,with a delayed influence during summer and fall.
Citation: Yu, W., W. Han, E. D. Maloney, D. Gochis, and S.‐P. Xie (2011), Observations of eastward propagation ofatmospheric intraseasonal oscillations from the Pacific to the Atlantic, J. Geophys. Res., 116, D02101,doi:10.1029/2010JD014336.
1. Introduction
[2] The Madden‐Julian Oscillation (MJO) [Madden andJulian, 1971] is the most prominent mode of tropicalatmospheric intraseasonal variability. It is well known tohave a global eastward propagating signal, with a propa-gation speed of approximately 5 m/s in the Indian andwestern Pacific Oceans. The MJO is climatically importantbecause it can have significant impacts on the El Niño–Southern Oscillation (ENSO) [e.g., Moore and Kleeman,1999; McPhaden, 1999; Takayabu et al., 1999; Kesslerand Kleeman, 2000], the Asian‐Australian monsoon[Sikka and Gadgil, 1980; Yasunari, 1981; Krishnamurti andSubramanyam, 1982; Webster, 1983; Wang and Xie, 1997;
Lawrence and Webster, 2001; Lau and Waliser, 2005], theIndian Ocean Dipole [e.g., Rao and Yamagata, 2004; Hanet al., 2006], and tropical cyclones [e.g., Maloney andShaman, 2008].[3] Many previous studies have revealed the global in-
fluences of the MJO. Strong MJO signals have beenobserved in the North American Monsoon (NAM) [e.g.Higgins and Shi, 2001; Barlow and Salstein, 2006; Lorenzand Hartmann, 2006], where positive zonal wind anoma-lies in the eastern tropical Pacific are followed by anomalousprecipitation in Mexico and the southwest United Statesseveral days later. Foltz and McPhaden [2004] showed thatintraseasonal surface wind variability is prominent in thesubtropical and midlatitude Atlantic Ocean, where surfacewinds are significantly correlated with MJO signals in theIndo‐Pacific Ocean. Jones and Schemm [2000] demon-strated that the South Atlantic Convergence Zone (SACZ)exhibits a wide range of intraseasonal variability, and that30–70 day variations are directly related to the MJO.Maloney and Hartmann [2000] showed that the MJO canaffect the Atlantic, and demonstrated a link between the MJOand hurricane activity in the Gulf of Mexico and the Carib-bean Sea. Given that the cold sea surface temperatures (SSTs)in the eastern Pacific cold tongue region inhibit convection,
1Research Applications Laboratory, National Center for AtmosphericResearch, Boulder, Colorado, USA.
2Department of Atmospheric and Oceanic Sciences, University ofColorado, Boulder, Colorado, USA.
3Department of Atmospheric Science, Colorado State University, FortCollins, Colorado, USA.
4International Pacific Research Center, University of Hawaii, Honolulu,Hawaii, USA.
Copyright 2011 by the American Geophysical Union.0148‐0227/11/2010JD014336
JOURNAL OF GEOPHYSICAL RESEARCH, VOL. 116, D02101, doi:10.1029/2010JD014336, 2011
D02101 1 of 15
the South American continent blocks continuous air‐seainteraction, and the Andes block eastward propagation, theactual mechanisms by which the MJO influences the tropicalAtlantic and the propagation of the MJO surface signaturesinto that basin are still not well characterized.[4] Interestingly, in the equatorial Atlantic Ocean, satellite
and in situ observations show significant spectral peaks at40–60 day periods in surface winds, sea level, and ther-mocline depth [Han et al., 2008]. Results from numericalmodel experiments demonstrate that this sea level andthermocline depth variability results mainly from the firstand second baroclinic modes of oceanic equatorial Kelvinwaves forced by 40–60 day equatorial zonal wind anoma-lies. The significant 40–60 day peaks in zonal and meridi-onal winds, which appeared in both the Quick Scatterometer(QuikSCAT) and Pilot Research Moored Array in the Trop-ical Atlantic (PIRATA) data, were found to be especiallystrong in 2002, a year when anomalously warm temperaturesor a so‐called “Atlantic Niño” event occurred [Fu et al.,2007]. Han et al. [2008] also found that 40–60 day zonalwind anomalies in the central‐western equatorial Atlanticbasin for the 2000–2006 period were significantly correlated
with sea level anomalies across the equatorial Atlantic basin,with simultaneous and lag correlation values ranging from0.62 to 0.74 (p ≤ 0.05). Han et al. [2008], however, did notexplain the origin of the strong 40–60 day wind anomalies.[5] Matthews [2000] suggested that sea level pressure
anomalies associated with a global dry equatorial Kelvinwave that travel at a speed of approximately 35 m/s canpropagate into the Atlantic through the gap at Panama. Suchintraseasonal Kelvin waves can be excited by MJO heatingin the Eastern Hemisphere [Matthews, 2000; Small et al.,2010]. Our study builds on this previous work. We willaddress the extent to which the MJO plays an important rolein causing strong 40–60 day timescale surface wind anoma-lies in the equatorial Atlantic. This will be first done during2002, and then, using a longer record, explore the seasonalityand propagation pathways by which surface wind and con-vection associated with the MJO affect the Atlantic Ocean.
2. Data and Method
[6] MJO propagation can be effectively diagnosed usingOutgoing Longwave Radiation (OLR) and winds [Arkin and
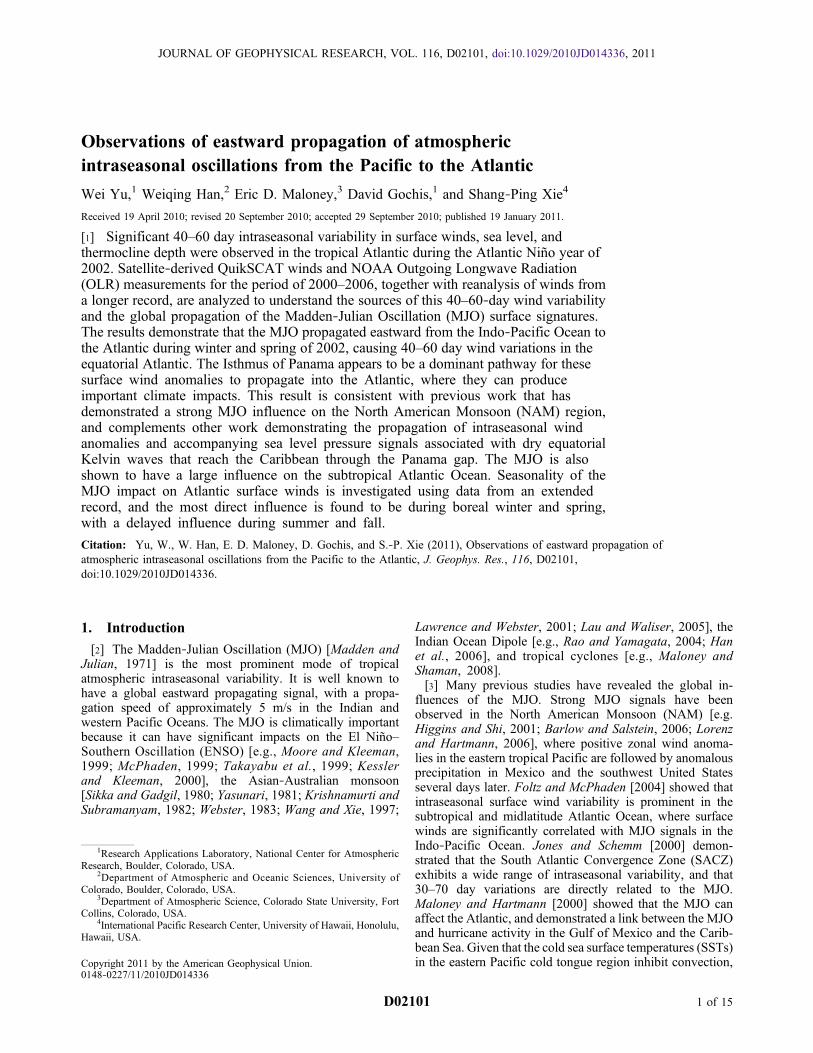
Figure 1. Variance spectra of surface wind (10 m) along the Atlantic equator (5°S–5°N averaged) basedon daily winds of 2002. (a) QuikSCAT zonal wind; (b) QuikSCAT meridional wind; (c) ERA‐Interimzonal wind; and (d) ERA‐Interim meridional wind.
YU ET AL.: EASTWARD PROPAGATION OF ISO D02101D02101
2 of 15
Ardanuy, 1989; Liebmann and Smith, 1996; Jones et al.,2004; Matthews, 2000]. Hence, 3 day mean QuikSCATocean surface wind vectors and NOAA interpolated OLRdata from 2000 to 2006 are used to diagnose intraseasonalvariability using 30–70 day band‐pass filtered fields[Duchon, 1979]. To minimize the influence of missing va-lues due to incomplete sampling and rain contamination, weaveraged the 0.25° × 0.25° resolution QuikSCAT windsonto 2.5° × 2.5° grids. To support inferences on convectiveactivity provided by the OLR in both the tropical and sub-tropical oceans, we also analyzed the 1° × 1° Global Pre-cipitation Climatology Project (GPCP) precipitation data,the 2.5° × 2.5° Climate Prediction Center (CPC) mergedanalysis of precipitation (CMAP) product, and 0.7° × 0.7°European Center for Medium‐Range Weather Forecasts(ECMWF) Reanalysis (ERA) Interim precipitation data[Simmons et al., 2007; Allan et al., 2010; Xie and Arkin,1997].
[7] To isolate the MJO signals, OLR data were filtered to30–70 day periods and eastward wave numbers 1–3, con-sistent with previous studies [Hendon and Salby, 1994;Jones and Schemm, 2000; Foltz and McPhaden, 2004]. Abroad 20–100 day filter with eastward wave numbers 1–6,following the suggestion of the U. S. Climate Variabilityand Predictability Research Program (CLIVAR) MJOworking group [CLIVAR MJO Working Group, 2009] andWheeler and Kiladis [1999], is also applied to compare withthe extracted 30–70 day MJO signals to ensure that thesignals examined here are not an artifact of the narrowresponse function used. Intraseasonal variance, spectralcoherence analysis, and correlation analysis were performedusing QuikSCAT winds to demonstrate the effects of theMJO on surface winds in the tropical Atlantic Ocean.Surface winds from ERA‐Interim data with 1.5° resolutionfrom 1990 to 2007 and the 40 year reanalysis (ERA40)with 2.5° resolution for 1960–2001 were also analyzed in
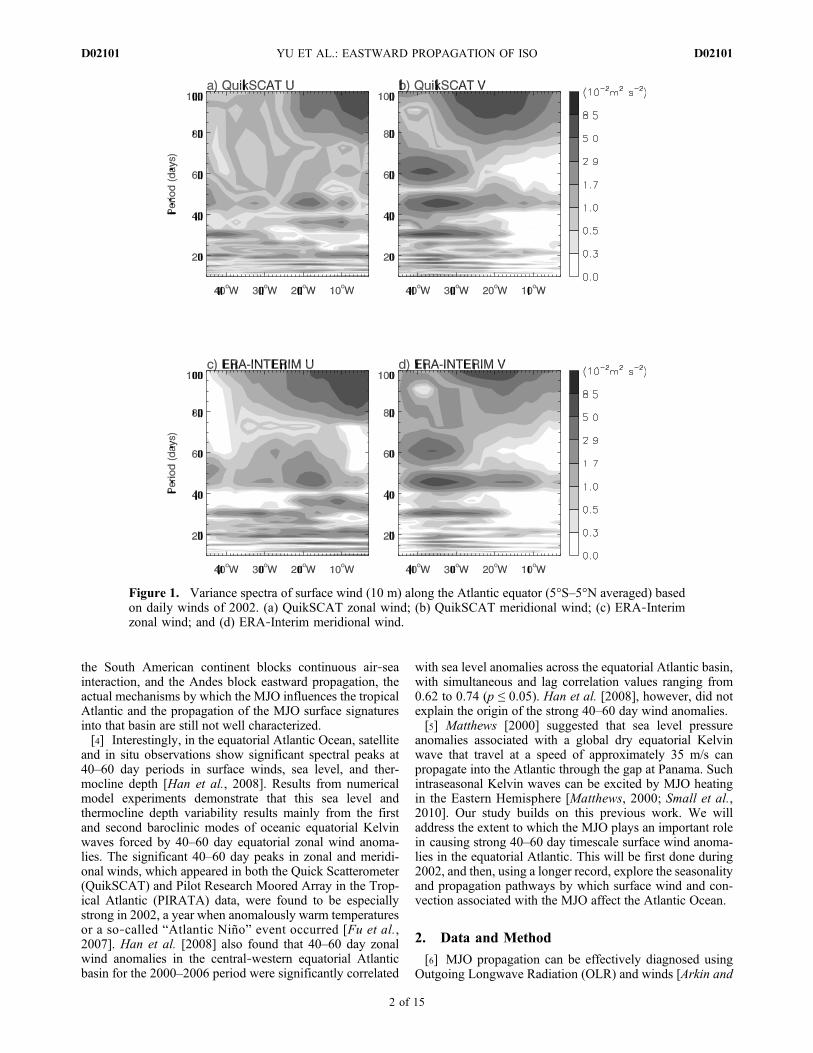
Figure 2. (a) Longitude‐time diagram of 30–70 day band‐pass filtered QuikSCAT 10 m zonal windaveraged from 15°S to 15°N during 2002; (b) same as Figure 2a, but for 30–70 day OLR data which havebeen restrictively filtered to eastward wave numbers 1–3. Two black phase curves are QuikSCAT (solidcurve) and OLR (dashed curve).
YU ET AL.: EASTWARD PROPAGATION OF ISO D02101D02101
3 of 15
order to assess the robustness of the results for longerperiods. Because QuikSCAT winds are not retrieved overland, we cannot use the spatial filter to extract the MJOsignals for QuikSCAT, and thus only filter QuikSCATwinds to 30–70 days.
3. Results
3.1. Observed Intraseasonal Variabilityin the Tropical Atlantic
[8] Figures 1a–1d show Atlantic variance spectra of sur-face winds along the equator during 2002 from QuikSCATand ERA‐Interim data. Both zonal and meridional windsexhibit strong spectral peaks at intraseasonal periods, amongwhich 40–60 day peaks are evident across most of theequatorial basin in both QuikSCAT and ERA‐Interim data,consistent with Han et al. [2008]. Strong spectral poweroccurs at periods greater than 80 days in the eastern andcentral Atlantic basin, which is associated with the strongseasonal (annual and semiannual) cycle.
3.2. Evidence of MJO Propagationinto the Atlantic During 2002
[9] Figure 2 shows longitude‐time diagrams of the 30–70day band‐pass filtered QuikSCAT surface zonal wind andOLR anomalies averaged from 15°S to 15°N during 2002.Note that the OLR field is further band‐pass filtered to zonalwave numbers 1–3. The large‐scale features and eastwardpropagation of the 30–70 day wind anomalies (Figure 2a)agree well with the MJO signals in OLR (Figure 2b) interms of a consistent phase relationship and amplitude,suggesting that the 30–70 day QuikSCAT wind anomaliesare largely associated with the MJO. During January–July,the maximum 30–70 day wind anomalies are observed inthe Indian and western Pacific oceans, and subsequentlypropagate into the Atlantic Ocean, although the Atlanticmanifestation of the wind anomalies is weaker relative to theIndo‐Pacific sector. Eastward propagating MJO eventsoccur with gradually increasing strength during borealwinter and spring of 2002, reaching a maximum in May andthen becoming weaker during summer. To ensure that thenarrow filtering we use does not too strongly constrain our
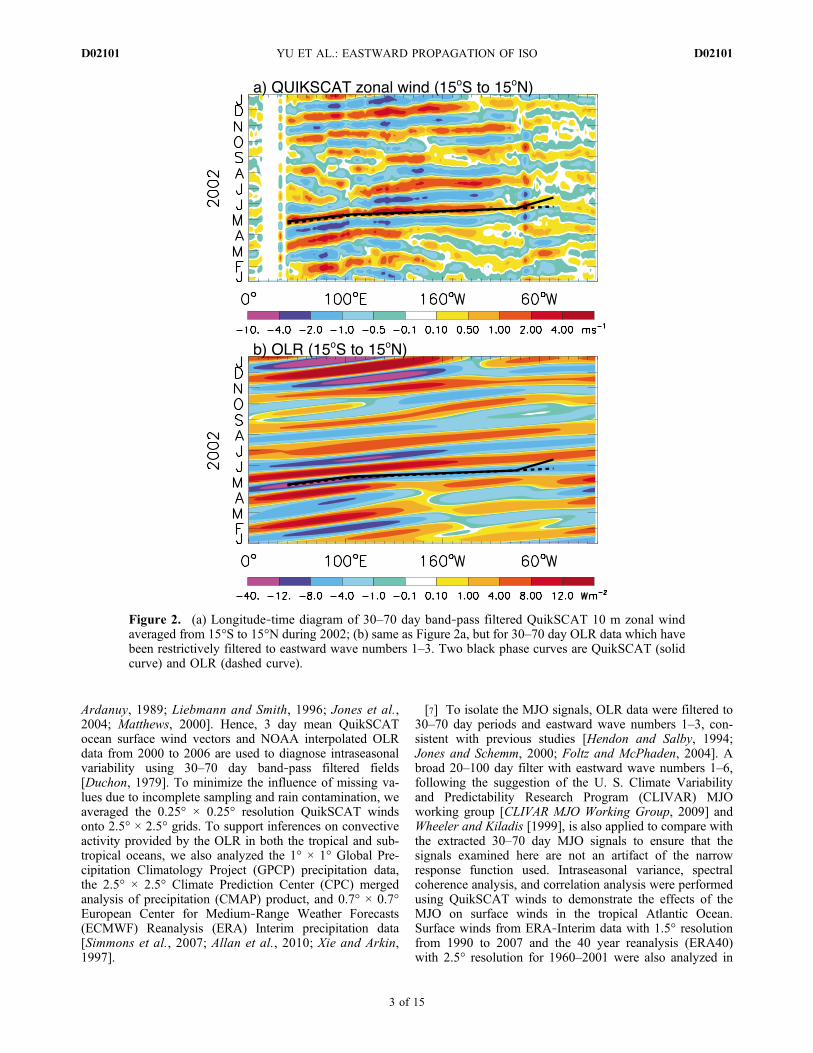
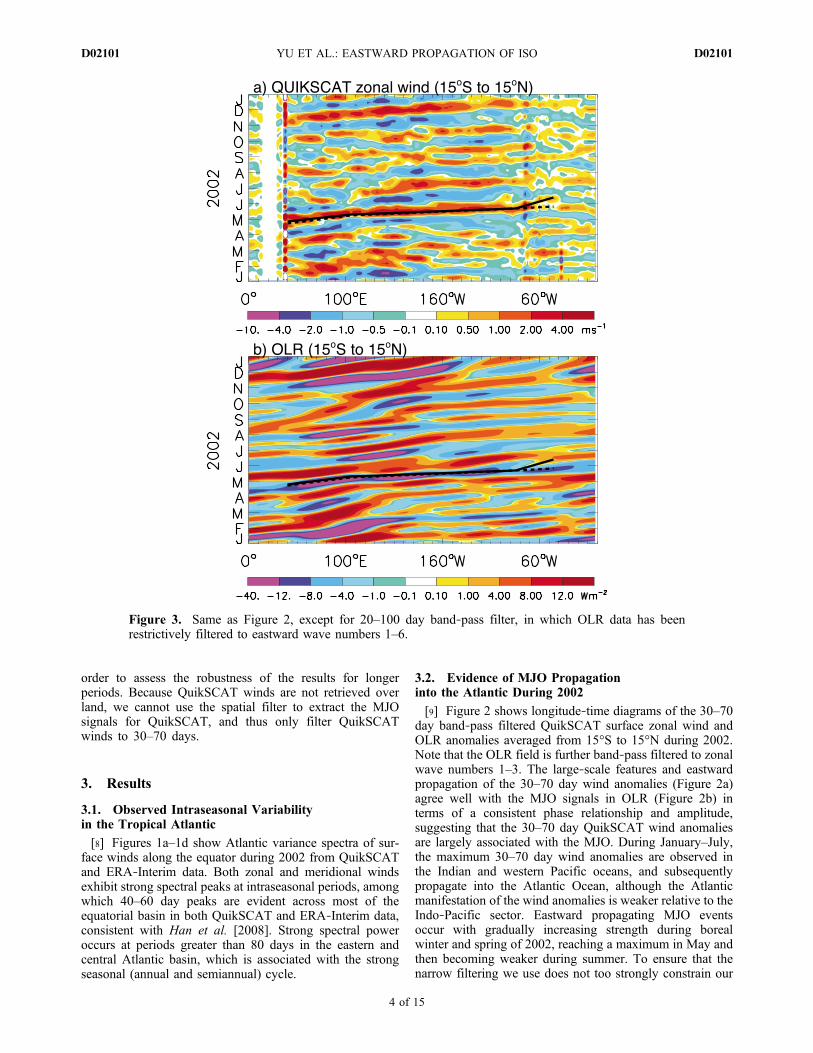
Figure 3. Same as Figure 2, except for 20–100 day band‐pass filter, in which OLR data has beenrestrictively filtered to eastward wave numbers 1–6.
YU ET AL.: EASTWARD PROPAGATION OF ISO D02101D02101
4 of 15
results, we also applied a wider 20–100 day filter as asensitivity test. Results are similar to those derived using anarrower filter, as shown in both QuikSCAT zonal wind andOLR anomalies, except that signals are higher amplitudeand noisier (Figure 3). MJO propagation from the IndianOcean to the Atlantic is very clear during April and May inboth Figure 2 and Figure 3, with propagation speeds ofapproximately 4.7 m/s from the Indian Ocean to the westernPacific and 14.5 m/s from the central Pacific to the Atlantic,as indicated by their phase lines. These values generallyagree with the well‐documented MJO propagation speed of∼5 m/s in convective regions across the Indian and westernPacific oceans, and 10–15 m/s in the Western Hemisphere[e.g., Hendon and Salby, 1994]. The basic propagationpatterns are consistent for both OLR and winds, with windsslightly lagging enhanced convection.[10] In contrast, during boreal summer and fall of 2002,
convection associated with the MJO is weaker in the west-ern Atlantic Ocean compared to winter and spring. In theeastern equatorial Atlantic basin (20°W to 0°E), however,impacts of the westward propagating signals are observedduring May–September (Figure 2a). The westward propa-gation of intraseasonal anomalies across the African mon-soon region into the Atlantic has been addressed in previousstudies [e.g., Matthews, 2004; Janicot et al., 2009]. In thispaper, we focus on examining eastward propagating MJOinfluences.[11] QuikSCAT winds cannot be retrieved over the South
American continent. The continuous eastward propagationof 30–70 day wind anomalies in Figures 2a and 3a across70°W is derived from comparatively fewer samplingpoints in the Caribbean Sea to the north of Colombia andVenezuela and near the Isthmus of Panama. This suggeststhat the MJO propagating signal is present in the surface
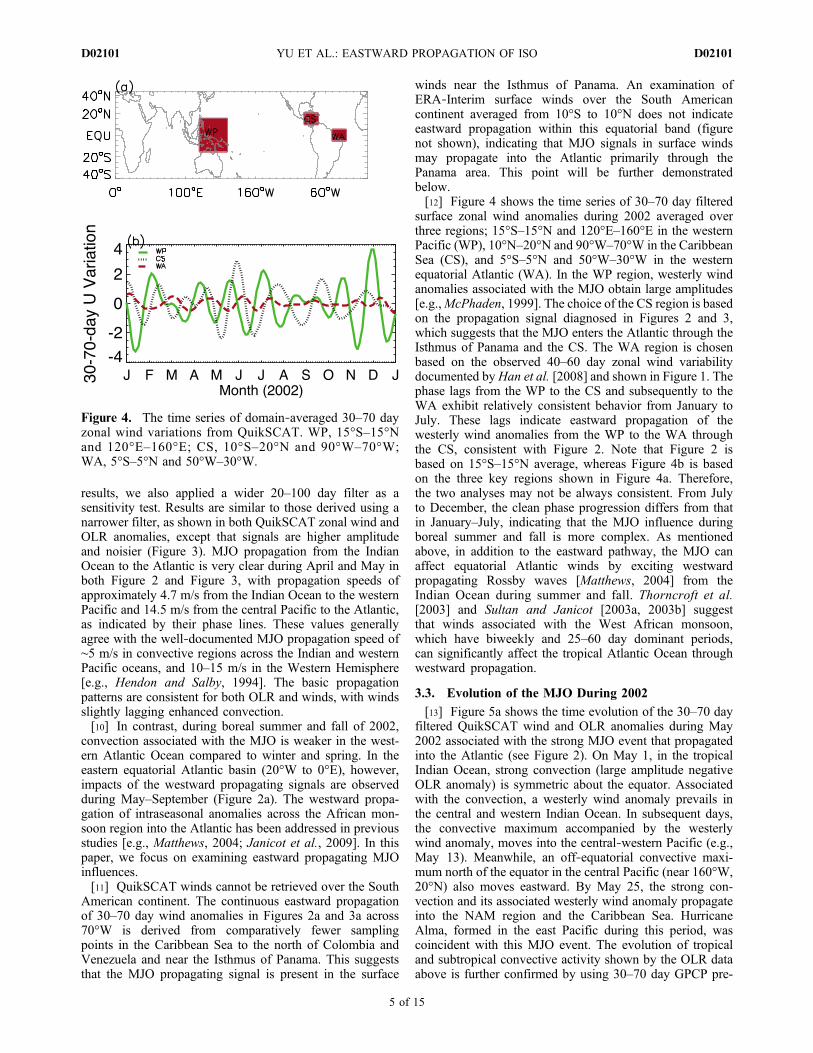
winds near the Isthmus of Panama. An examination ofERA‐Interim surface winds over the South Americancontinent averaged from 10°S to 10°N does not indicateeastward propagation within this equatorial band (figurenot shown), indicating that MJO signals in surface windsmay propagate into the Atlantic primarily through thePanama area. This point will be further demonstratedbelow.[12] Figure 4 shows the time series of 30–70 day filtered
surface zonal wind anomalies during 2002 averaged overthree regions; 15°S–15°N and 120°E–160°E in the westernPacific (WP), 10°N–20°N and 90°W–70°W in the CaribbeanSea (CS), and 5°S–5°N and 50°W–30°W in the westernequatorial Atlantic (WA). In the WP region, westerly windanomalies associated with the MJO obtain large amplitudes[e.g.,McPhaden, 1999]. The choice of the CS region is basedon the propagation signal diagnosed in Figures 2 and 3,which suggests that the MJO enters the Atlantic through theIsthmus of Panama and the CS. The WA region is chosenbased on the observed 40–60 day zonal wind variabilitydocumented byHan et al. [2008] and shown in Figure 1. Thephase lags from the WP to the CS and subsequently to theWA exhibit relatively consistent behavior from January toJuly. These lags indicate eastward propagation of thewesterly wind anomalies from the WP to the WA throughthe CS, consistent with Figure 2. Note that Figure 2 isbased on 15°S–15°N average, whereas Figure 4b is basedon the three key regions shown in Figure 4a. Therefore,the two analyses may not be always consistent. From Julyto December, the clean phase progression differs from thatin January–July, indicating that the MJO influence duringboreal summer and fall is more complex. As mentionedabove, in addition to the eastward pathway, the MJO canaffect equatorial Atlantic winds by exciting westwardpropagating Rossby waves [Matthews, 2004] from theIndian Ocean during summer and fall. Thorncroft et al.[2003] and Sultan and Janicot [2003a, 2003b] suggestthat winds associated with the West African monsoon,which have biweekly and 25–60 day dominant periods,can significantly affect the tropical Atlantic Ocean throughwestward propagation.
3.3. Evolution of the MJO During 2002
[13] Figure 5a shows the time evolution of the 30–70 dayfiltered QuikSCAT wind and OLR anomalies during May2002 associated with the strong MJO event that propagatedinto the Atlantic (see Figure 2). On May 1, in the tropicalIndian Ocean, strong convection (large amplitude negativeOLR anomaly) is symmetric about the equator. Associatedwith the convection, a westerly wind anomaly prevails inthe central and western Indian Ocean. In subsequent days,the convective maximum accompanied by the westerlywind anomaly, moves into the central‐western Pacific (e.g.,May 13). Meanwhile, an off‐equatorial convective maxi-mum north of the equator in the central Pacific (near 160°W,20°N) also moves eastward. By May 25, the strong con-vection and its associated westerly wind anomaly propagateinto the NAM region and the Caribbean Sea. HurricaneAlma, formed in the east Pacific during this period, wascoincident with this MJO event. The evolution of tropicaland subtropical convective activity shown by the OLR dataabove is further confirmed by using 30–70 day GPCP pre-
Figure 4. The time series of domain‐averaged 30–70 dayzonal wind variations from QuikSCAT. WP, 15°S–15°Nand 120°E–160°E; CS, 10°S–20°N and 90°W–70°W;WA, 5°S–5°N and 50°W–30°W.
YU ET AL.: EASTWARD PROPAGATION OF ISO D02101D02101
5 of 15
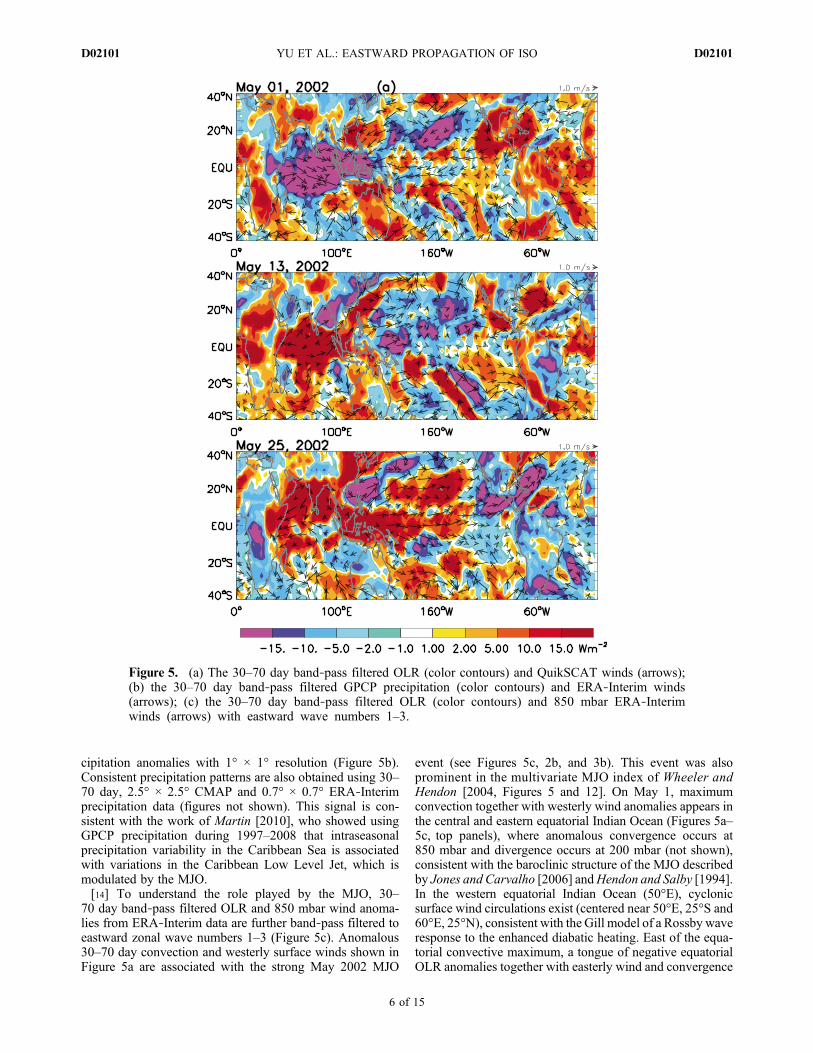
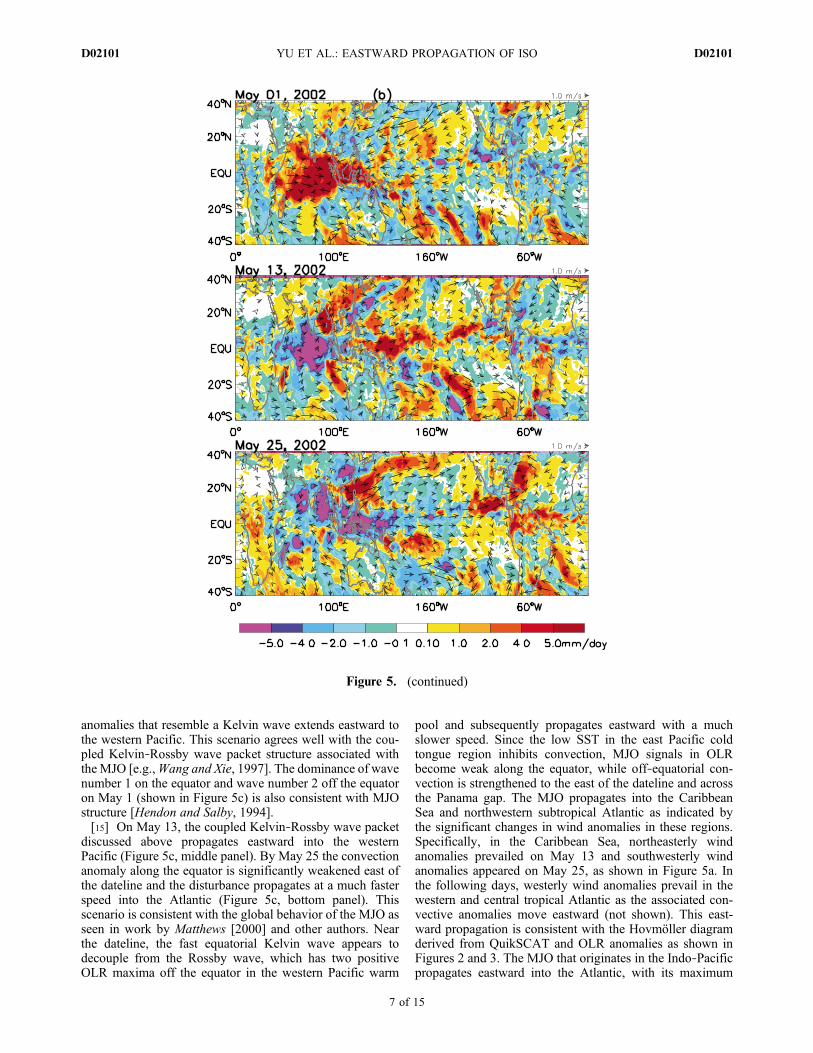
cipitation anomalies with 1° × 1° resolution (Figure 5b).Consistent precipitation patterns are also obtained using 30–70 day, 2.5° × 2.5° CMAP and 0.7° × 0.7° ERA‐Interimprecipitation data (figures not shown). This signal is con-sistent with the work of Martin [2010], who showed usingGPCP precipitation during 1997–2008 that intraseasonalprecipitation variability in the Caribbean Sea is associatedwith variations in the Caribbean Low Level Jet, which ismodulated by the MJO.[14] To understand the role played by the MJO, 30–
70 day band‐pass filtered OLR and 850 mbar wind anoma-lies from ERA‐Interim data are further band‐pass filtered toeastward zonal wave numbers 1–3 (Figure 5c). Anomalous30–70 day convection and westerly surface winds shown inFigure 5a are associated with the strong May 2002 MJO
event (see Figures 5c, 2b, and 3b). This event was alsoprominent in the multivariate MJO index of Wheeler andHendon [2004, Figures 5 and 12]. On May 1, maximumconvection together with westerly wind anomalies appears inthe central and eastern equatorial Indian Ocean (Figures 5a–5c, top panels), where anomalous convergence occurs at850 mbar and divergence occurs at 200 mbar (not shown),consistent with the baroclinic structure of the MJO describedby Jones and Carvalho [2006] andHendon and Salby [1994].In the western equatorial Indian Ocean (50°E), cyclonicsurface wind circulations exist (centered near 50°E, 25°S and60°E, 25°N), consistent with the Gill model of a Rossby waveresponse to the enhanced diabatic heating. East of the equa-torial convective maximum, a tongue of negative equatorialOLR anomalies together with easterly wind and convergence
Figure 5. (a) The 30–70 day band‐pass filtered OLR (color contours) and QuikSCAT winds (arrows);(b) the 30–70 day band‐pass filtered GPCP precipitation (color contours) and ERA‐Interim winds(arrows); (c) the 30–70 day band‐pass filtered OLR (color contours) and 850 mbar ERA‐Interimwinds (arrows) with eastward wave numbers 1–3.
YU ET AL.: EASTWARD PROPAGATION OF ISO D02101D02101
6 of 15
anomalies that resemble a Kelvin wave extends eastward tothe western Pacific. This scenario agrees well with the cou-pled Kelvin‐Rossby wave packet structure associated withthe MJO [e.g.,Wang and Xie, 1997]. The dominance of wavenumber 1 on the equator and wave number 2 off the equatoron May 1 (shown in Figure 5c) is also consistent with MJOstructure [Hendon and Salby, 1994].[15] On May 13, the coupled Kelvin‐Rossby wave packet
discussed above propagates eastward into the westernPacific (Figure 5c, middle panel). By May 25 the convectionanomaly along the equator is significantly weakened east ofthe dateline and the disturbance propagates at a much fasterspeed into the Atlantic (Figure 5c, bottom panel). Thisscenario is consistent with the global behavior of the MJO asseen in work by Matthews [2000] and other authors. Nearthe dateline, the fast equatorial Kelvin wave appears todecouple from the Rossby wave, which has two positiveOLR maxima off the equator in the western Pacific warm
pool and subsequently propagates eastward with a muchslower speed. Since the low SST in the east Pacific coldtongue region inhibits convection, MJO signals in OLRbecome weak along the equator, while off‐equatorial con-vection is strengthened to the east of the dateline and acrossthe Panama gap. The MJO propagates into the CaribbeanSea and northwestern subtropical Atlantic as indicated bythe significant changes in wind anomalies in these regions.Specifically, in the Caribbean Sea, northeasterly windanomalies prevailed on May 13 and southwesterly windanomalies appeared on May 25, as shown in Figure 5a. Inthe following days, westerly wind anomalies prevail in thewestern and central tropical Atlantic as the associated con-vective anomalies move eastward (not shown). This east-ward propagation is consistent with the Hovmöller diagramderived from QuikSCAT and OLR anomalies as shown inFigures 2 and 3. The MJO that originates in the Indo‐Pacificpropagates eastward into the Atlantic, with its maximum
Figure 5. (continued)
YU ET AL.: EASTWARD PROPAGATION OF ISO D02101D02101
7 of 15
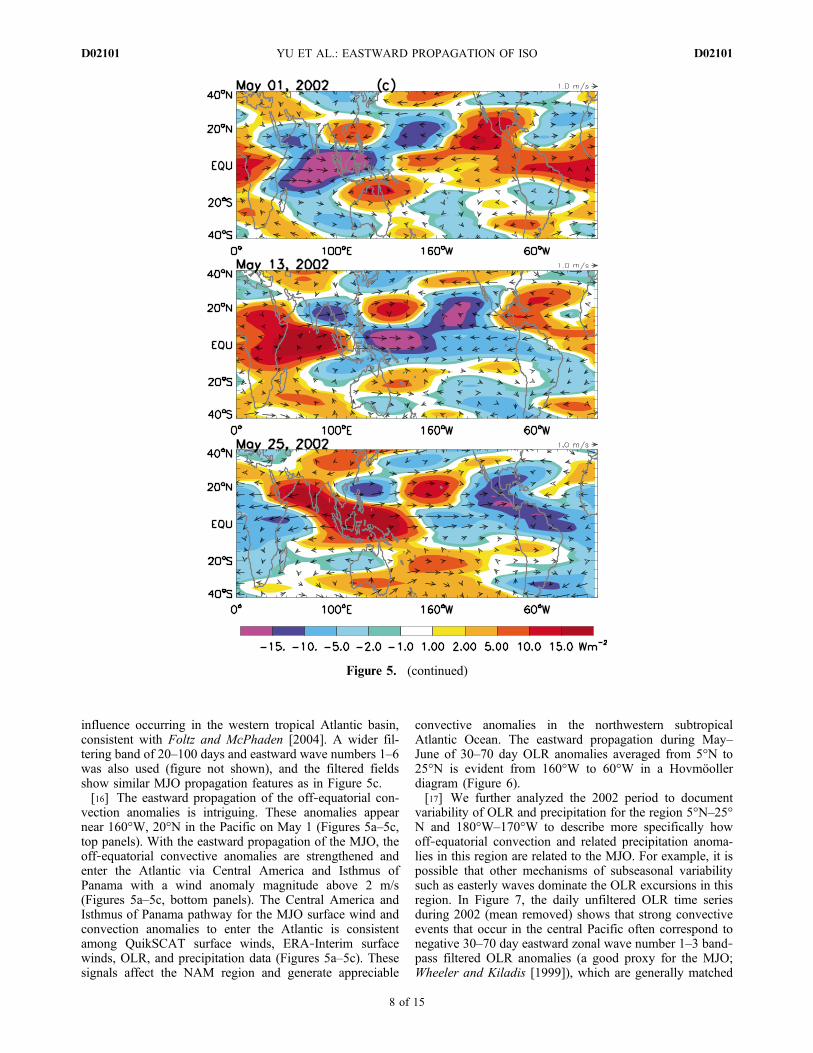
influence occurring in the western tropical Atlantic basin,consistent with Foltz and McPhaden [2004]. A wider fil-tering band of 20–100 days and eastward wave numbers 1–6was also used (figure not shown), and the filtered fieldsshow similar MJO propagation features as in Figure 5c.[16] The eastward propagation of the off‐equatorial con-
vection anomalies is intriguing. These anomalies appearnear 160°W, 20°N in the Pacific on May 1 (Figures 5a–5c,top panels). With the eastward propagation of the MJO, theoff‐equatorial convective anomalies are strengthened andenter the Atlantic via Central America and Isthmus ofPanama with a wind anomaly magnitude above 2 m/s(Figures 5a–5c, bottom panels). The Central America andIsthmus of Panama pathway for the MJO surface wind andconvection anomalies to enter the Atlantic is consistentamong QuikSCAT surface winds, ERA‐Interim surfacewinds, OLR, and precipitation data (Figures 5a–5c). Thesesignals affect the NAM region and generate appreciable
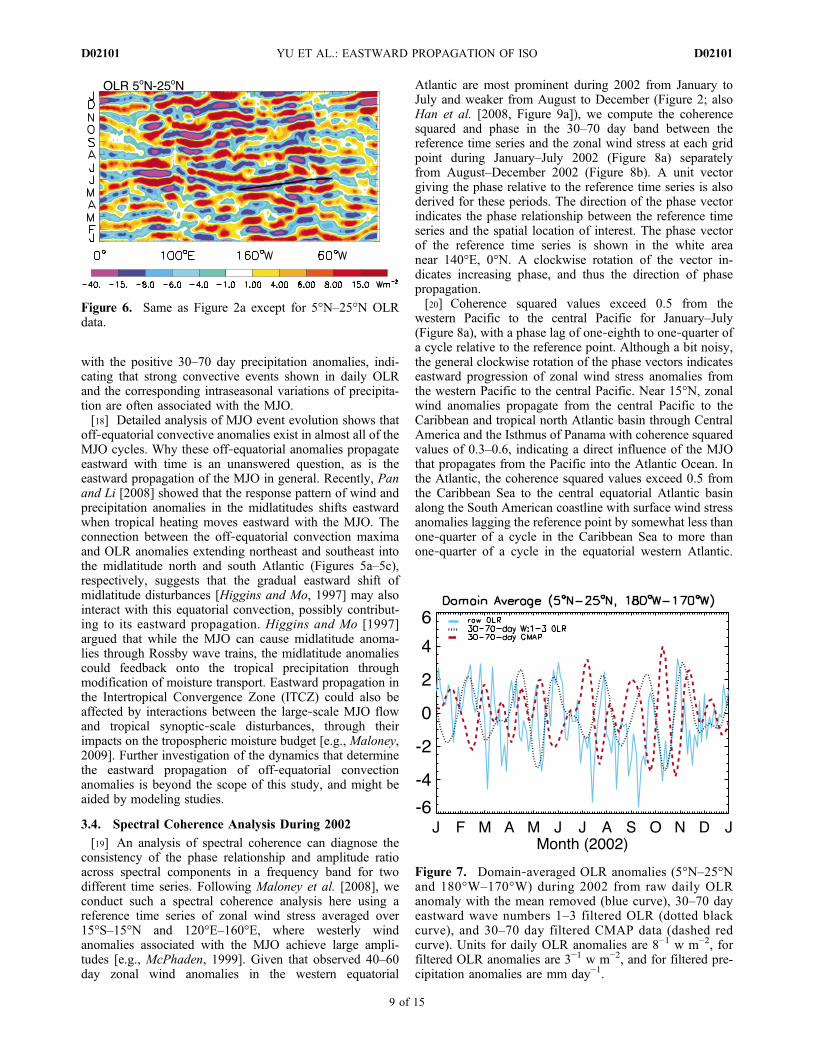
convective anomalies in the northwestern subtropicalAtlantic Ocean. The eastward propagation during May–June of 30–70 day OLR anomalies averaged from 5°N to25°N is evident from 160°W to 60°W in a Hovmöollerdiagram (Figure 6).[17] We further analyzed the 2002 period to document
variability of OLR and precipitation for the region 5°N–25°N and 180°W–170°W to describe more specifically howoff‐equatorial convection and related precipitation anoma-lies in this region are related to the MJO. For example, it ispossible that other mechanisms of subseasonal variabilitysuch as easterly waves dominate the OLR excursions in thisregion. In Figure 7, the daily unfiltered OLR time seriesduring 2002 (mean removed) shows that strong convectiveevents that occur in the central Pacific often correspond tonegative 30–70 day eastward zonal wave number 1–3 band‐pass filtered OLR anomalies (a good proxy for the MJO;Wheeler and Kiladis [1999]), which are generally matched
Figure 5. (continued)
YU ET AL.: EASTWARD PROPAGATION OF ISO D02101D02101
8 of 15
with the positive 30–70 day precipitation anomalies, indi-cating that strong convective events shown in daily OLRand the corresponding intraseasonal variations of precipita-tion are often associated with the MJO.[18] Detailed analysis of MJO event evolution shows that
off‐equatorial convective anomalies exist in almost all of theMJO cycles. Why these off‐equatorial anomalies propagateeastward with time is an unanswered question, as is theeastward propagation of the MJO in general. Recently, Panand Li [2008] showed that the response pattern of wind andprecipitation anomalies in the midlatitudes shifts eastwardwhen tropical heating moves eastward with the MJO. Theconnection between the off‐equatorial convection maximaand OLR anomalies extending northeast and southeast intothe midlatitude north and south Atlantic (Figures 5a–5c),respectively, suggests that the gradual eastward shift ofmidlatitude disturbances [Higgins and Mo, 1997] may alsointeract with this equatorial convection, possibly contribut-ing to its eastward propagation. Higgins and Mo [1997]argued that while the MJO can cause midlatitude anoma-lies through Rossby wave trains, the midlatitude anomaliescould feedback onto the tropical precipitation throughmodification of moisture transport. Eastward propagation inthe Intertropical Convergence Zone (ITCZ) could also beaffected by interactions between the large‐scale MJO flowand tropical synoptic‐scale disturbances, through theirimpacts on the tropospheric moisture budget [e.g., Maloney,2009]. Further investigation of the dynamics that determinethe eastward propagation of off‐equatorial convectionanomalies is beyond the scope of this study, and might beaided by modeling studies.
3.4. Spectral Coherence Analysis During 2002
[19] An analysis of spectral coherence can diagnose theconsistency of the phase relationship and amplitude ratioacross spectral components in a frequency band for twodifferent time series. Following Maloney et al. [2008], weconduct such a spectral coherence analysis here using areference time series of zonal wind stress averaged over15°S–15°N and 120°E–160°E, where westerly windanomalies associated with the MJO achieve large ampli-tudes [e.g., McPhaden, 1999]. Given that observed 40–60day zonal wind anomalies in the western equatorial
Atlantic are most prominent during 2002 from January toJuly and weaker from August to December (Figure 2; alsoHan et al. [2008, Figure 9a]), we compute the coherencesquared and phase in the 30–70 day band between thereference time series and the zonal wind stress at each gridpoint during January–July 2002 (Figure 8a) separatelyfrom August–December 2002 (Figure 8b). A unit vectorgiving the phase relative to the reference time series is alsoderived for these periods. The direction of the phase vectorindicates the phase relationship between the reference timeseries and the spatial location of interest. The phase vectorof the reference time series is shown in the white areanear 140°E, 0°N. A clockwise rotation of the vector in-dicates increasing phase, and thus the direction of phasepropagation.[20] Coherence squared values exceed 0.5 from the
western Pacific to the central Pacific for January–July(Figure 8a), with a phase lag of one‐eighth to one‐quarter ofa cycle relative to the reference point. Although a bit noisy,the general clockwise rotation of the phase vectors indicateseastward progression of zonal wind stress anomalies fromthe western Pacific to the central Pacific. Near 15°N, zonalwind anomalies propagate from the central Pacific to theCaribbean and tropical north Atlantic basin through CentralAmerica and the Isthmus of Panama with coherence squaredvalues of 0.3–0.6, indicating a direct influence of the MJOthat propagates from the Pacific into the Atlantic Ocean. Inthe Atlantic, the coherence squared values exceed 0.5 fromthe Caribbean Sea to the central equatorial Atlantic basinalong the South American coastline with surface wind stressanomalies lagging the reference point by somewhat less thanone‐quarter of a cycle in the Caribbean Sea to more thanone‐quarter of a cycle in the equatorial western Atlantic.
Figure 6. Same as Figure 2a except for 5°N–25°N OLRdata.
Figure 7. Domain‐averaged OLR anomalies (5°N–25°Nand 180°W–170°W) during 2002 from raw daily OLRanomaly with the mean removed (blue curve), 30–70 dayeastward wave numbers 1–3 filtered OLR (dotted blackcurve), and 30–70 day filtered CMAP data (dashed redcurve). Units for daily OLR anomalies are 8−1 w m−2, forfiltered OLR anomalies are 3−1 w m−2, and for filtered pre-cipitation anomalies are mm day−1.
YU ET AL.: EASTWARD PROPAGATION OF ISO D02101D02101
9 of 15
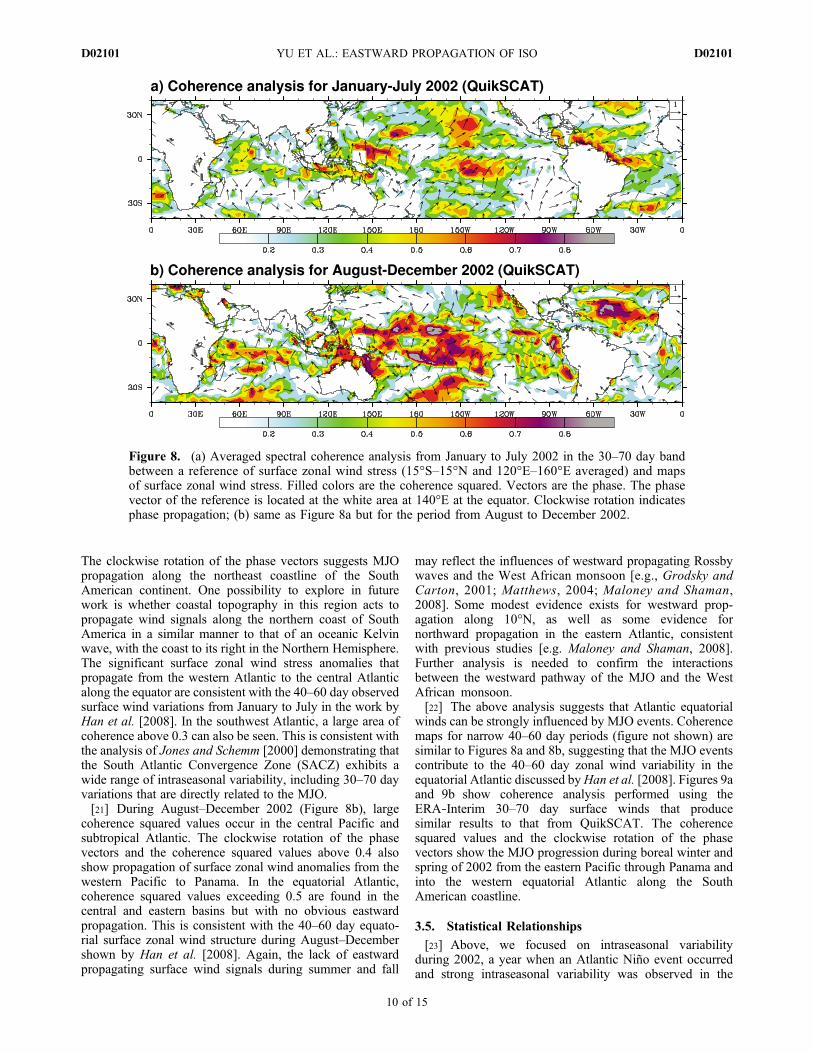
The clockwise rotation of the phase vectors suggests MJOpropagation along the northeast coastline of the SouthAmerican continent. One possibility to explore in futurework is whether coastal topography in this region acts topropagate wind signals along the northern coast of SouthAmerica in a similar manner to that of an oceanic Kelvinwave, with the coast to its right in the Northern Hemisphere.The significant surface zonal wind stress anomalies thatpropagate from the western Atlantic to the central Atlanticalong the equator are consistent with the 40–60 day observedsurface wind variations from January to July in the work byHan et al. [2008]. In the southwest Atlantic, a large area ofcoherence above 0.3 can also be seen. This is consistent withthe analysis of Jones and Schemm [2000] demonstrating thatthe South Atlantic Convergence Zone (SACZ) exhibits awide range of intraseasonal variability, including 30–70 dayvariations that are directly related to the MJO.[21] During August–December 2002 (Figure 8b), large
coherence squared values occur in the central Pacific andsubtropical Atlantic. The clockwise rotation of the phasevectors and the coherence squared values above 0.4 alsoshow propagation of surface zonal wind anomalies from thewestern Pacific to Panama. In the equatorial Atlantic,coherence squared values exceeding 0.5 are found in thecentral and eastern basins but with no obvious eastwardpropagation. This is consistent with the 40–60 day equato-rial surface zonal wind structure during August–Decembershown by Han et al. [2008]. Again, the lack of eastwardpropagating surface wind signals during summer and fall
may reflect the influences of westward propagating Rossbywaves and the West African monsoon [e.g., Grodsky andCarton, 2001; Matthews, 2004; Maloney and Shaman,2008]. Some modest evidence exists for westward prop-agation along 10°N, as well as some evidence fornorthward propagation in the eastern Atlantic, consistentwith previous studies [e.g. Maloney and Shaman, 2008].Further analysis is needed to confirm the interactionsbetween the westward pathway of the MJO and the WestAfrican monsoon.[22] The above analysis suggests that Atlantic equatorial
winds can be strongly influenced by MJO events. Coherencemaps for narrow 40–60 day periods (figure not shown) aresimilar to Figures 8a and 8b, suggesting that the MJO eventscontribute to the 40–60 day zonal wind variability in theequatorial Atlantic discussed byHan et al. [2008]. Figures 9aand 9b show coherence analysis performed using theERA‐Interim 30–70 day surface winds that producesimilar results to that from QuikSCAT. The coherencesquared values and the clockwise rotation of the phasevectors show the MJO progression during boreal winter andspring of 2002 from the eastern Pacific through Panama andinto the western equatorial Atlantic along the SouthAmerican coastline.
3.5. Statistical Relationships
[23] Above, we focused on intraseasonal variabilityduring 2002, a year when an Atlantic Niño event occurredand strong intraseasonal variability was observed in the
Figure 8. (a) Averaged spectral coherence analysis from January to July 2002 in the 30–70 day bandbetween a reference of surface zonal wind stress (15°S–15°N and 120°E–160°E averaged) and mapsof surface zonal wind stress. Filled colors are the coherence squared. Vectors are the phase. The phasevector of the reference is located at the white area at 140°E at the equator. Clockwise rotation indicatesphase propagation; (b) same as Figure 8a but for the period from August to December 2002.
YU ET AL.: EASTWARD PROPAGATION OF ISO D02101D02101
10 of 15
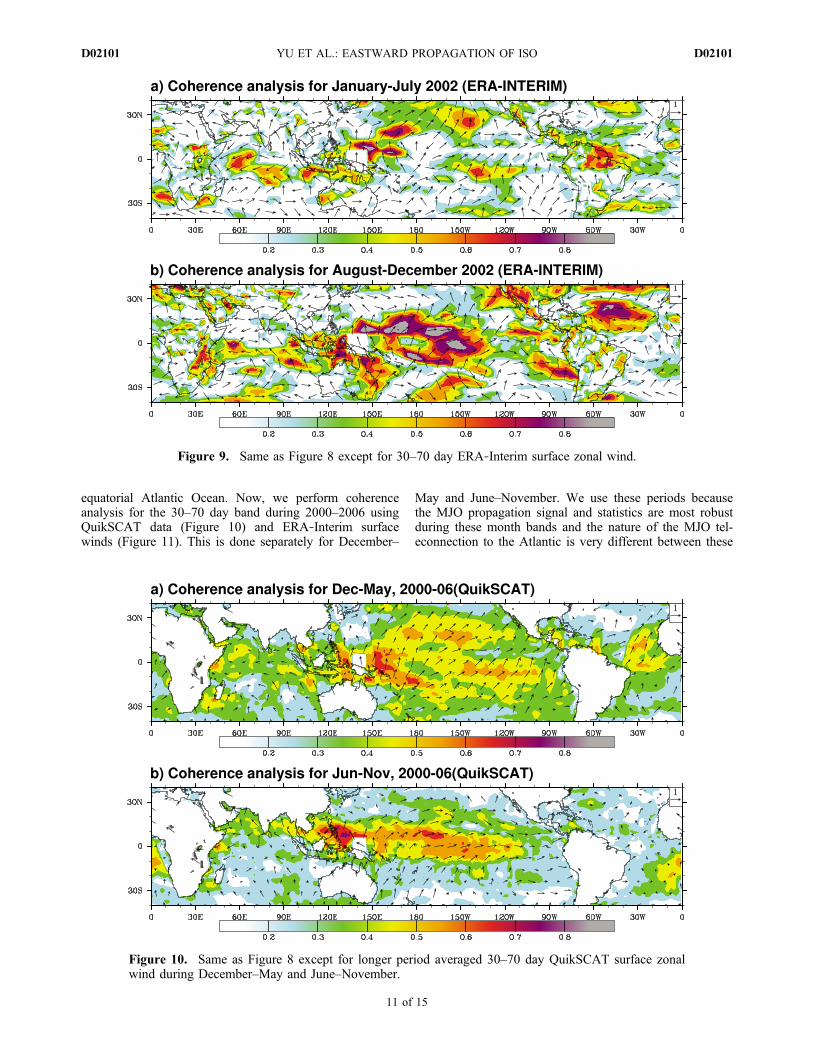
equatorial Atlantic Ocean. Now, we perform coherenceanalysis for the 30–70 day band during 2000–2006 usingQuikSCAT data (Figure 10) and ERA‐Interim surfacewinds (Figure 11). This is done separately for December–
May and June–November. We use these periods becausethe MJO propagation signal and statistics are most robustduring these month bands and the nature of the MJO tel-econnection to the Atlantic is very different between these
Figure 9. Same as Figure 8 except for 30–70 day ERA‐Interim surface zonal wind.
Figure 10. Same as Figure 8 except for longer period averaged 30–70 day QuikSCAT surface zonalwind during December–May and June–November.
YU ET AL.: EASTWARD PROPAGATION OF ISO D02101D02101
11 of 15
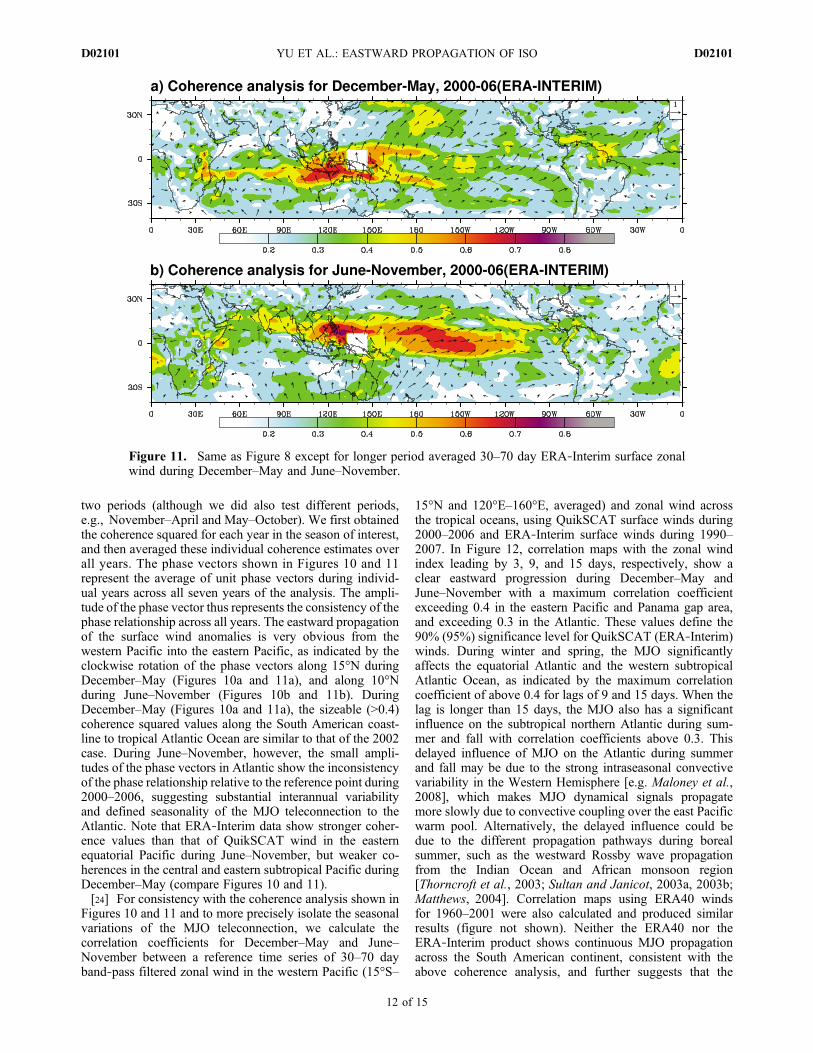
two periods (although we did also test different periods,e.g., November–April and May–October). We first obtainedthe coherence squared for each year in the season of interest,and then averaged these individual coherence estimates overall years. The phase vectors shown in Figures 10 and 11represent the average of unit phase vectors during individ-ual years across all seven years of the analysis. The ampli-tude of the phase vector thus represents the consistency of thephase relationship across all years. The eastward propagationof the surface wind anomalies is very obvious from thewestern Pacific into the eastern Pacific, as indicated by theclockwise rotation of the phase vectors along 15°N duringDecember–May (Figures 10a and 11a), and along 10°Nduring June–November (Figures 10b and 11b). DuringDecember–May (Figures 10a and 11a), the sizeable (>0.4)coherence squared values along the South American coast-line to tropical Atlantic Ocean are similar to that of the 2002case. During June–November, however, the small ampli-tudes of the phase vectors in Atlantic show the inconsistencyof the phase relationship relative to the reference point during2000–2006, suggesting substantial interannual variabilityand defined seasonality of the MJO teleconnection to theAtlantic. Note that ERA‐Interim data show stronger coher-ence values than that of QuikSCAT wind in the easternequatorial Pacific during June–November, but weaker co-herences in the central and eastern subtropical Pacific duringDecember–May (compare Figures 10 and 11).[24] For consistency with the coherence analysis shown in
Figures 10 and 11 and to more precisely isolate the seasonalvariations of the MJO teleconnection, we calculate thecorrelation coefficients for December–May and June–November between a reference time series of 30–70 dayband‐pass filtered zonal wind in the western Pacific (15°S–
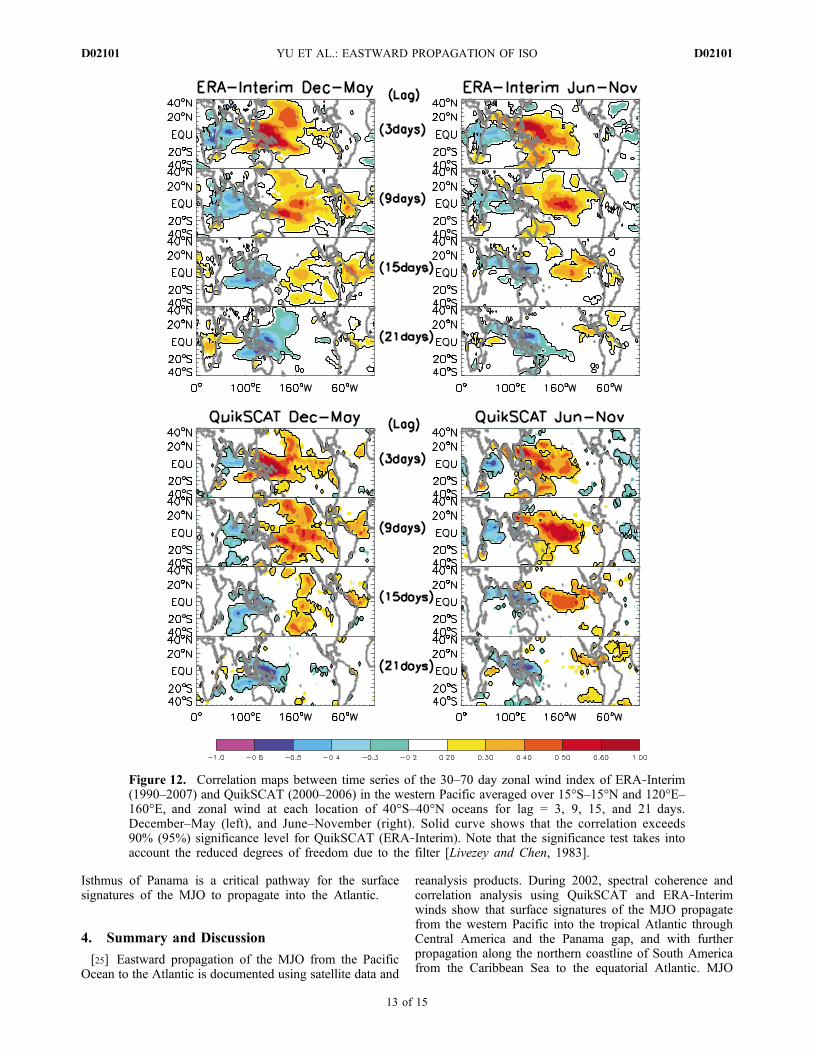
15°N and 120°E–160°E, averaged) and zonal wind acrossthe tropical oceans, using QuikSCAT surface winds during2000–2006 and ERA‐Interim surface winds during 1990–2007. In Figure 12, correlation maps with the zonal windindex leading by 3, 9, and 15 days, respectively, show aclear eastward progression during December–May andJune–November with a maximum correlation coefficientexceeding 0.4 in the eastern Pacific and Panama gap area,and exceeding 0.3 in the Atlantic. These values define the90% (95%) significance level for QuikSCAT (ERA‐Interim)winds. During winter and spring, the MJO significantlyaffects the equatorial Atlantic and the western subtropicalAtlantic Ocean, as indicated by the maximum correlationcoefficient of above 0.4 for lags of 9 and 15 days. When thelag is longer than 15 days, the MJO also has a significantinfluence on the subtropical northern Atlantic during sum-mer and fall with correlation coefficients above 0.3. Thisdelayed influence of MJO on the Atlantic during summerand fall may be due to the strong intraseasonal convectivevariability in the Western Hemisphere [e.g. Maloney et al.,2008], which makes MJO dynamical signals propagatemore slowly due to convective coupling over the east Pacificwarm pool. Alternatively, the delayed influence could bedue to the different propagation pathways during borealsummer, such as the westward Rossby wave propagationfrom the Indian Ocean and African monsoon region[Thorncroft et al., 2003; Sultan and Janicot, 2003a, 2003b;Matthews, 2004]. Correlation maps using ERA40 windsfor 1960–2001 were also calculated and produced similarresults (figure not shown). Neither the ERA40 nor theERA‐Interim product shows continuous MJO propagationacross the South American continent, consistent with theabove coherence analysis, and further suggests that the
Figure 11. Same as Figure 8 except for longer period averaged 30–70 day ERA‐Interim surface zonalwind during December–May and June–November.
YU ET AL.: EASTWARD PROPAGATION OF ISO D02101D02101
12 of 15
Isthmus of Panama is a critical pathway for the surfacesignatures of the MJO to propagate into the Atlantic.
4. Summary and Discussion
[25] Eastward propagation of the MJO from the PacificOcean to the Atlantic is documented using satellite data and
reanalysis products. During 2002, spectral coherence andcorrelation analysis using QuikSCAT and ERA‐Interimwinds show that surface signatures of the MJO propagatefrom the western Pacific into the tropical Atlantic throughCentral America and the Panama gap, and with furtherpropagation along the northern coastline of South Americafrom the Caribbean Sea to the equatorial Atlantic. MJO
Figure 12. Correlation maps between time series of the 30–70 day zonal wind index of ERA‐Interim(1990–2007) and QuikSCAT (2000–2006) in the western Pacific averaged over 15°S–15°N and 120°E–160°E, and zonal wind at each location of 40°S–40°N oceans for lag = 3, 9, 15, and 21 days.December–May (left), and June–November (right). Solid curve shows that the correlation exceeds90% (95%) significance level for QuikSCAT (ERA‐Interim). Note that the significance test takes intoaccount the reduced degrees of freedom due to the filter [Livezey and Chen, 1983].
YU ET AL.: EASTWARD PROPAGATION OF ISO D02101D02101
13 of 15
events thus appear to be the primary cause of the observed40–60 day band‐pass filtered zonal surface wind anomaliesin the equatorial Atlantic discussed by Han et al. [2008].[26] Strong convection and westerly wind anomalies
associated with the MJO first propagate eastward into thewestern Pacific at a speed of about 5 m/s as a Rossby‐Kelvin wave packet. Near the dateline, the Rossby andKelvin waves decouple, with the Kelvin wave propagatingeastward along the equator into the Atlantic at a much fasterspeed. The off‐equatorial convection maxima associatedwith the Rossby wave also propagates eastward, but at aslower rate. The eastward propagation associated with off‐equatorial features is accompanied by the eastward shift ofmidlatitude convective anomalies, with possible feedbacksonto tropical convection. Another possible mechanism forthe eastward propagation of OLR anomalies in the eastPacific ITCZ is the interaction of tropical eddies and thelarge‐scale MJO flow [Maloney, 2009]. These possibilitieswill be explored in future research.[27] Statistical calculations using QuikSCAT winds for
2000–2006 and ERA‐Interim surface data for 1990–2007show that Atlantic equatorial zonal surface winds are sig-nificantly correlated with the intraseasonal zonal winds inthe western equatorial Pacific Ocean, a region where west-erly wind anomalies associated with the MJO are strong.The maximum correlations exceed 0.4 (significant at the90% confidence level for QuikSCAT and the 95% confi-dence level for ERA‐Interim) in the equatorial Atlanticregion during boreal winter and spring, when the equatorialAtlantic winds lag the western Pacific winds by 9–15 days.The Isthmus of Panama and Central America appear to be animportant pathway for the MJO to propagate from thePacific into the Atlantic, consistent with the spectralcoherence analysis during 2002. The MJO impact onAtlantic surface winds during boreal summer and fall isdelayed relative to boreal winter and spring, with significantlag correlations apparent after 15 days, which suggests thatinteractions between the MJO and strong convective vari-ability in the Western Hemisphere may delay MJO impacts.These results are consistent with previous studies showingthat the character of the MJO has strong seasonality[Madden and Julian, 1994; Jones et al., 2004; Matthews,2000], and were also verified using a long record of ERA40reanalysis winds for 1960–2001. ERA products show scantevidence of MJO propagation across the South Americancontinent, which further suggests that surface winds associ-ated with the MJO likely propagate into the Caribbean Seaacross the Isthmus of Panama and Central America.[28] Results presented here support the notion that surface
wind and convection associated with the MJO can propagateinto the Atlantic, affecting the subtropical Atlantic andequatorial regions. The results also suggest pathways forhow the MJO can potentially affect the North Americanmonsoon region, in which significant MJO signals havebeen documented. In 2002, an Atlantic Niño event occurred[Fu et al., 2007], and large amplitude intraseasonal ther-mocline variability was observed in the equatorial Atlantic[Han et al., 2008]. Our results here show that the strongequatorial intraseasonal zonal wind variations of 2002 resultlargely from the MJO. One remaining question is whether ornot the MJO played a role in triggering the 2002 AtlanticNiño event. This question will be explored in future work.
[29] Acknowledgments. Three reviewers provided insightful com-ments that led to significant improvements in the paper. We thank ECMWFand NCAR for the ERA‐40 and ERA‐Interim fields. The daily OLR dataprovided by the NOAA/OAR/ESRL PSD, Boulder, Colorado from theirWeb site (http://www.cdc.noaa.gov/). The QuikSCAT winds are producedby Remote Sensing Systems and sponsored by the NASA Ocean VectorWinds Science Team (OVWST). Weiqing Han is supported by NASAOcean Vector Wind Science Team award 1283568 and NSF CAREERaward OCE 0847605. The National Center for Atmospheric Research issupported by NSF. EDM was supported by NSF Climate and Large‐ScaleDynamics Grant Numbers 0946911 and 0828531. EDM was also supportedunder Award# NA08OAR4320893 from NOAA. The statements, findings,conclusions, and recommendations do not necessarily reflect the views ofNSF, NOAA, or the Department of Commerce.
ReferencesAllan, R. P., B. J. Soden, V. O. John, W. Ingram, and P. Good (2010), Cur-rent changes in tropical precipitation, Environ. Res. Lett., 5, 025205,doi:10.1088/1748-9326/5/2/025205.
Arkin, P. A., and P. E. Ardanuy (1989), Estimating climatic‐scale precip-itation from space: A review, J. Clim., 2, 1229–1238.
Barlow, M., and D. Salstein (2006), Summertime influence of the Madden‐Julian oscillation on daily rainfall over Mexico and Central America,Geophys. Res. Lett., 33, L21708, doi:10.1029/2006GL027738.
CLIVAR Madden‐Julian Oscillation (MJO) Working Group (2009),MJO simulation diagnostics, J. Clim., 22, 3006–3030, doi:10.1175/2008JCLI2731.1.
Duchon, C. E. (1979), Lanczos filtering in one and two dimensions, J. Appl.Sci., 61, 1004–1023.
Foltz, G. R., and M. J. McPhaden (2004), The 30–70 day oscillations in thetropical Atlantic, Geophys. Res. Lett., 31, L15205, doi:10.1029/2004GL020023.
Fu, R., M. Young, H. Wang, and W. Han (2007), Investigate the influenceof the Amazon rainfall on westerly wind anomalies and the 2002 AtlanticNiño using QuikScat, Altimeter, and TRMM data, presented at jointNASA OVWST 2007 Meeting, 2007 EUMETSAT MeteorologicalSatellite Conference, and 15th Satellite Meteorological and Oceanogra-phy Conference, Am. Meteorol. Soc., Amsterdam, Neth.
Grodsky, S. A., and J. A. Carton (2001), Coupled land/atmosphereinteractions in the West African Monsoon, Geophys. Res. Lett.,28, 1503–1506, doi:10.1029/2000GL012601.
Han, W., P. J. Webster, J.‐L. Lin, W. T. Liu, R. Fu, D. Yuan, and A. Hu(2008), Dynamics of intraseasonal sea level and thermocline variabilityin the equatorial Atlantic during 2002–2003, J. Phys. Oceanogr., 38,945–967.
Han, W., T. Shinoda, L. Fu, and J. P. McCreary (2006), Impact of atmo-spheric intraseasonal oscillations on the Indian Ocean Dipole duringthe 1990s, J. Phys. Oceanogr., 36, 670–690.
Hendon, H. H., and M. L. Salby (1994), The life cycle of the Madden‐Julianoscillation, J. Atmos. Sci., 51, 2225–2237, doi:10.1175/1520-0469(1994)051<2225:TLCOTM>2.0.CO;2.
Higgins, R. W., and K. C. Mo (1997), Persistent North Pacific circula-tion anomalies and the tropical intraseasonal oscillation, J. Clim., 10,3028–3046.
Higgins, R. W., and W. Shi (2001), Intercomparison of the principal modesof interannual and intraseasonal variability of the North American mon-soon system, J. Clim., 14, 403–417.
Janicot, S., F. Mounier, N. M. J. Hall, S. Leroux, B. Sultan, and G. N.Kiladis (2009), Dynamics of the west African monsoon, Part IV:Analysis of 25–90 day variability of convection and the role of theIndian monsoon, J. Clim., 22, 1541–1565.
Jones, C., and J. E. Schemm (2000), The influence of intraseasonalvariations on medium to extended range weather forecasts over SouthAmerica, Mon. Weather Rev., 128, 486–494.
Jones, C., and M. V. Carvalho (2006), Changes in the activity of theMadden‐Julian Oscillation during 1958–2004, J. Clim., 19, 6353–6370.
Jones, C., M. V. Carvalho, R. W. Higgins, D. E. Waliser, and J. K. E.Schemm (2004), Climatology of tropical intraseasonal convectiveanomalies: 1979–2002, J. Clim., 17, 523–539.
Kessler, W. S., and R. Kleeman (2000), Rectification of the Madden‐Julianoscillation into the ENSO cycle, J. Clim., 13, 3560–3575.
Krishnamurti, T. N., and D. Subramanyam (1982), The 30–50 day mode at850 mb during MONEX, J. Atmos. Sci., 39, 2088–2095.
Lau, K. M., and D. E. Waliser (Eds) (2005), Intraseasonal Variability inthe Atmosphere‐Ocean Climate System, Praxis Publ., Chichester, U. K.
Lawrence, D. M., and P. J. Webster (2001), Interannual variations of theintraseasonal oscillation in the south Asian summer monsoon region,J. Clim., 14, 2910–2922.
YU ET AL.: EASTWARD PROPAGATION OF ISO D02101D02101
14 of 15
Liebmann, B., and C. A. Smith (1996), Description of a complete (inter-polated), outgoing longwave radiation dataset, Bull. Am. Meteorol.Soc., 77, 1275–1277.
Livezey, R. E., and W. Y. Chen (1983), Statistical field significance andits determination by Monte Carlo Techniques, Mon. Weather Rev.,111, 46–59.
Lorenz, D. J., and D. L. Hartmann (2006), The effect of the MJO on theNorth American monsoon, J. Clim., 19, 333–343, doi:10.1175/JCLI3684.1.
Madden, R. A., and P. R. Julian (1971), Detection of a 40–50 day oscilla-tion in the zonal wind in the tropical Pacific, J. Atmos. Sci., 28, 702–708.
Madden, R. A., and P. R. Julian (1994), Observations of the 40–50 daytropical oscillation: A review, Mon. Weather Rev., 122, 814–837.
Maloney, E. D. (2009), The moist static energy budget of a composite trop-ical intraseasonal oscillation in a climate model, J. Clim., 22, 711–729.
Maloney, E. D., and D. L. Hartmann (2000), Modulation of easternNorth Pacific hurricanes by the Madden‐Julian oscillation, J. Clim.,13, 1451–1460.
Maloney, E. D., and J. Shaman (2008), Intraseasonal variability of the WestAfrican monsoon and Atlantic ITCZ, J. Clim., 21, 2898–2918.
Maloney, E. D., D. B. Chelton, and S. K. Esbensen (2008), SubseasonalSST variability in the tropical eastern North Pacific during borealsummer, J. Clim., 21, 4149–4167.
Martin, E. (2010), Caribbean precipitation and the MJO, presented at 29thConference on Hurricanes and Tropical Meteorology, Am. Meteorol.Soc., Tucson, AZ.
Matthews, A. J. (2000), Propagation mechanisms for the Madden‐JulianOscillation, Q. J. R. Meteorol. Soc., 126, 2637–2651.
Matthews, A. J. (2004), Intraseasonal variability over tropical Africa duringnorthern summer, J. Clim., 17, 2427–2440.
McPhaden, M. J. (1999), Genesis and evolution of the 1997–98 El Niño,Science, 283, 950–954, doi:10.1126/science.283.5404.950.
Moore, A. M., and R. Kleeman (1999), Stochastic forcing of ENSO by theintraseasonal oscillation, J. Clim., 12, 1199–1200.
Pan, L. L., and T. Li (2008), Interactions between the tropical ISO and mid-latitude low‐frequency flow, Clim. Dyn., 31, 375–388.
Rao, S. A., and T. Yamagata (2004), Abrupt termination of Indian OceanDipole events in response to intraseasonal oscillations, Geophys. Res.Lett., 31, L19306, doi:10.1029/2004GL020842.
Salby, M. L., and H. H. Hendon (1994), Intraseasonal behavior of clouds,temperature, and motion in the tropics, J. Atmos. Sci., 51, 2207–2224.
Sikka, D. R., and S. Gadgil (1980), On the maximum cloud zone and theITCZ over Indian longitudes during southwest monsoon, Mon. WeatherRev., 108, 1840–1853.
Simmons, A., S. Uppala, D. Dee, and S. Kobayashi (2007), ERA‐Interim:New ECMWF reanalysis products from 1989 onwards, ECMWF Newsl.,110, 25–35.
Small, R. J., S.‐P. Xie, E. D. Maloney, S. P. de Szoeke, and T. Miyama(2010), Intraseasonal Variability in the far‐east Pacific: Investigation ofthe role of air‐sea coupling in a regional coupled model, Clim. Dyn.,34, 1–24, doi:10.1007/s00382-010-0786-2.
Sultan, B., and S. Janicot (2003a), The West African monsoon dynamics:Part I, documentation of intraseasonal variability, J. Clim., 16, 3389–3406.
Sultan, B., and S. Janicot (2003b), The West African monsoon dynamics:Part II, the “preonset” and “onset” of the summer monsoon, J. Clim., 16,3407–3427.
Takayabu, Y. N., T. Iguchi, M. Kachi, A. Shibata, and H. Kanzawa (1999),Abrupt termination of the 1997–98 El Niño in response to a Madden‐Julian oscillation, Nature, 402, 279–282, doi:10.1038/46254.
Thorncroft, C. D., et al. (2003), The JET2000 project, aircraft observa-tions of the African easterly jet and African easterly waves, Bull. Am.Meteorol. Soc., 79, 815–829.
Wang, B., and X. Xie (1997), A model for the boreal summer intraseasonaloscillation, J. Atmos. Sci., 54, 72–86.
Webster, P. J. (1983), Mechanisms of monsoon transition: Surfacehydrology effects, J. Atmos. Sci., 40, 2110–2124.
Wheeler, M., and G. N. Kiladis (1999), Convectively coupled equato-rial waves: Analysis of clouds and temperature in the wave number–frequency domain, J. Atmos. Sci., 56, 374–399.
Wheeler, M. C., and H. H. Hendon (2004), An all season real time multi-variate MJO index: Development of an index for monitoring and predic-tion, Mon. Weather Rev., 132, 1917–1932.
Xie, P., and P. A. Arkin (1997), Global precipitation: A 17 year monthlyanalysis based on gauge observations, satellite estimates, and numericalmodel outputs, Bull. Am. Meteorol. Soc., 78, 2539–2558.
Yasunari, T. (1981), Structure of an Indian summer monsoon system witharound 40 day period, J. Meteorol. Soc. Jpn., 59, 336–354.
D. Gochis and W. Yu, Research Applications Laboratory, National Centerfor Atmospheric Research, P.O. Box 3000, Boulder, CO 80307‐3000, USA.([email protected])W. Han, Department of Atmospheric and Oceanic Sciences, University
of Colorado, Boulder, CO 80309‐0311, USA.E. D. Maloney, Department of Atmospheric Science, Colorado State
University, 1371 Campus Delivery, Fort Collins, CO 80523‐1371, USA.S.‐P. Xie, International Pacific Research Center, University of Hawaii,
1680 East‐West Rd., Honolulu, HI 96822, USA.
YU ET AL.: EASTWARD PROPAGATION OF ISO D02101D02101
15 of 15