plug-in hybrid electric vehicle supervisory control
TRANSCRIPT
Plug-in Hybrid Electric Vehicle Supervisory Control Strategy
Considerations for Engine Exhaust Emissions and Fuel Use
Patrick M. Walsh
Thesis submitted to the faculty of the Virginia Polytechnic Institute and State University
in partial fulfillment of the requirements for the degree of
Master of Science
in
Mechanical Engineering
Douglas J. Nelson
Mehdi Ahmadian
Alan Kornhauser
May 4, 2011
Blacksburg, VA
Keywords: hybrid electric vehicle, environment, automobile, plug-in, EV, greenhouse
gases, petroleum, criteria emissions, pollution, PHEV, E-REV, fuel consumption
Copyright 2011, Patrick M. Walsh
Plug-in Hybrid Electric Vehicle Supervisory Control Strategy Considerations for
Engine Exhaust Emissions and Fuel Use
Patrick M. Walsh
ABSTRACT
Defining key parameters for a charge sustaining supervisory (torque split) control strategy as
well as an engine and catalyst warm-up strategy for a Split Parallel Architecture Extended-Range
Electric Vehicle (SPA E-REV) is accomplished through empirically and experimentally
measuring vehicle tailpipe emissions and energy consumption for two distinct control strategies.
The results of the experimental testing and analysis define how the vehicle reduces fuel
consumption, petroleum energy use and greenhouse gas emissions while maintaining low
tailpipe emissions. For a SPA E-REV operating in charge sustaining mode with the engine
providing net propulsive energy, simply operating the engine in regions of highest efficiency
does not equate to the most efficient operation of the vehicle as a system and can have adverse
effects on tailpipe emissions. Engine and catalyst warm-up during the transition from all-electric
charge depleting to engine-dominant charge sustaining modes is experimentally analyzed to
evaluate tailpipe emissions. The results presented are meant to define key parameters for a high-
level torque-split strategy and to provide an understanding of the tradeoffs between low energy
consumption and low tailpipe emissions.
The literature review gives a background of hybrid and plug-in hybrid vehicle control
publications including tailpipe emissions studies, but does not include experimental results and
comparisons of supervisory strategies designed for low fuel consumption and low tailpipe
emissions the SPA E-REV architecture. This paper details the high-level control strategy chosen
for balancing low energy consumption and low tailpipe emissions while the engine is operating.
Vehicle testing data from a chassis dynamometer is presented in support of the research.
iii
ACKNOWLEDGEMENTS
I would like to thank Dr. Doug Nelson for the continually passionate, supportive and dedicated
work he has put into serving as my advisor. Without Dr. Nelson, this paper would not have been
possible, and my knowledge of advanced technology vehicles would be an insignificant fraction
of what it is now. I would also like to acknowledge Jonathan King for his consistent and
impressive ability to make my ideas actually work in control code, Mark Meyer for his PSAT
modeling assistance, and Henning Lohse-Busch for his guidance, inspiration, and dedication to
the dynamometer testing event that allowed for the majority of the data collected for this work.
Finally, I would like to thank my committee for their support, and all students of the Hybrid
Electric Vehicle Team of Virginia Tech for their contributions to making this work possible.
iv
TABLE OF CONTENTS
Acknowledgements..…………………………………………………………………………..…iii
List of Multimedia Objects……………………………………………………………………….v
Tables……………………………………………………………………………………..v
Figures……………………………………………………………………………………v
Equations………………………………………………………………………………..vii
Abbreviations…………………………………………………………………………..viii
1. Introduction…………………………………………………………………………………...1
1.1 The Motivation for Designing Advanced Technology Vehicles……………………..1
1.2 Makeup of Typical HEV, PHEV and E-REV Architectures…………………………2
1.3 Objectives……………………………………………………………….…………….4
2. Literature Review………………………………………………………………….………….5
2.1 Boyd Paper on HEV Control Strategy Based on Power Losses……………………..5
2.2 Smith/Lohse-Busch Paper on Mitigating PHEV Tailpipe Emissions through
Supervisory Control………………………………………………………………….5
2.3 Yu Paper on Transient Emissions Characteristics during Engine Start/Stop………...7
2.4 Takagi Paper on Toyota THS-II PHEV Emissions Control Development…………..8
2.5 Li Paper on Engine Start/Stop Emissions……………………………………..……... 9
2.6 Muta Paper on 2nd
Generation Toyota Prius Development…………………………..9
2.7 Summary of Literature Review…………………………………………………......10
3. Split Parallel Architecture Extended-Range Electric Vehicle………………………………11
3.1 Introduction to the EcoCAR Competition…………………………………………...11
3.2 SPA E-REV Design Motivation and Process……………………………………….11
3.3 Baseline and Target Vehicle Technical Specifications………………………….......11
3.4 Vehicle Energy and Emissions Impact, and Fuel Selection……………………....…13
3.5 Component Sizing…………………………………………………………………...15
3.6 Design Considerations…………………………………………………………........17
3.7 Final Vehicle Technical Specifications……………………………………………...19
4. Hybrid Vehicle Supervisory Control Strategy and Vehicle Modes ………………………...21
4.1 Charge Depleting Mode……………………………………………………………..21
4.2 Charge Sustaining Modes………………………………………………………...…21
4.2.1 Engine Only…………………………………………………………......22
4.2.2 Engine Generate………………………………………………………....22
4.2.3 Engine Assist………………………………………………………...….23
4.2.4 Regenerative Braking………………………………………………...….23
4.2.5 Engine Idle Stop……………………………………………………...….23
4.2.6 Electric Launch…………………………………………………………..23
4.3 Meeting Driver Demand…………………………………………………………..…23
4.4 Efficient Vehicle Operation………………………………………………………….25
4.5 Limitations of Charge Sustaining Modes……………………………………….......26
5. Reduction of Criteria Tailpipe Emissions through Hybrid Supervisory Control……………27
5.1 Criteria Tailpipe Emissions from Automobiles……………………………………...27
5.1.1 Criteria Emissions………………………………………………………..27
5.1.2 Emissions Regulations and Test Cycles…………………………………27
5.2 Introduction to Catalytic Pollution Control for Automobiles………………………..28
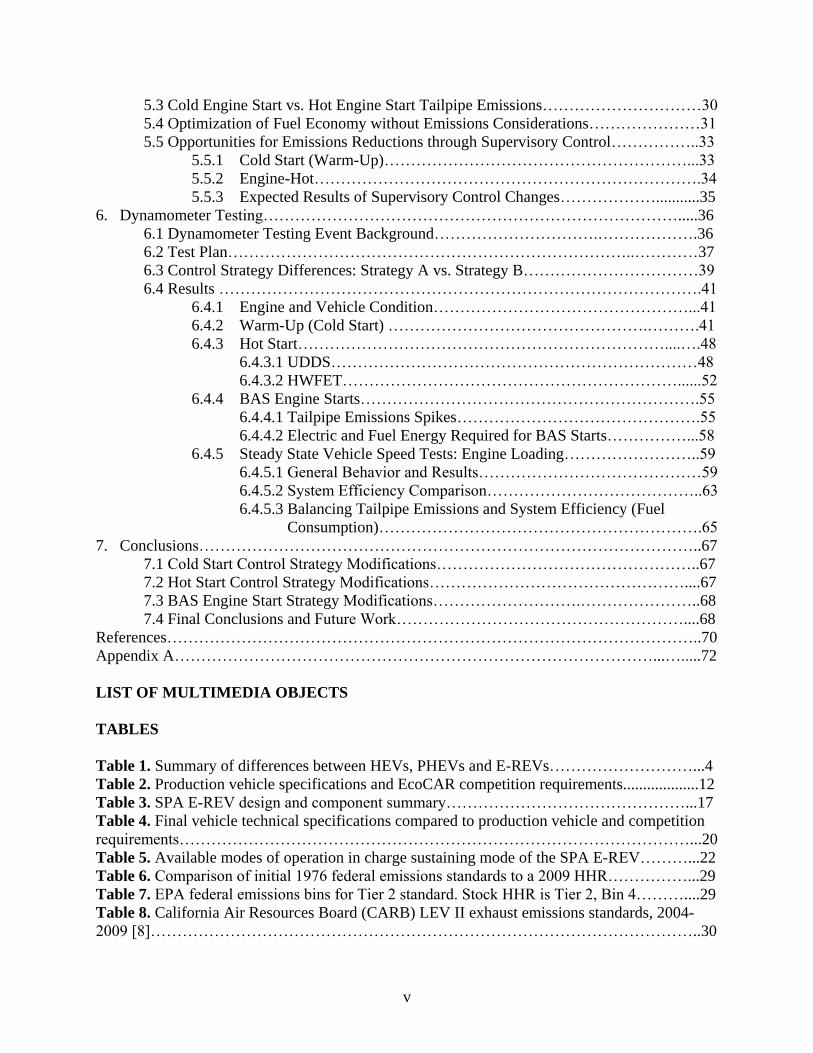
v
5.3 Cold Engine Start vs. Hot Engine Start Tailpipe Emissions…………………………30
5.4 Optimization of Fuel Economy without Emissions Considerations…………………31
5.5 Opportunities for Emissions Reductions through Supervisory Control……………..33
5.5.1 Cold Start (Warm-Up)…………………………………………………...33
5.5.2 Engine-Hot……………………………………………………………….34
5.5.3 Expected Results of Supervisory Control Changes………………...........35
6. Dynamometer Testing…………………………………………………………………….....36
6.1 Dynamometer Testing Event Background………………………….……………….36
6.2 Test Plan…………………………………………………………………..…………37
6.3 Control Strategy Differences: Strategy A vs. Strategy B……………………………39
6.4 Results ……………………………………………………………………………….41
6.4.1 Engine and Vehicle Condition…………………………………………...41
6.4.2 Warm-Up (Cold Start) ………………………………………….……….41
6.4.3 Hot Start……………………………………………………………....….48
6.4.3.1 UDDS……………………………………………………………48
6.4.3.2 HWFET………………………………………………………......52
6.4.4 BAS Engine Starts……………………………………………………….55
6.4.4.1 Tailpipe Emissions Spikes……………………………………….55
6.4.4.2 Electric and Fuel Energy Required for BAS Starts……………...58
6.4.5 Steady State Vehicle Speed Tests: Engine Loading……………………..59
6.4.5.1 General Behavior and Results……………………………………59
6.4.5.2 System Efficiency Comparison…………………………………..63
6.4.5.3 Balancing Tailpipe Emissions and System Efficiency (Fuel
Consumption)…………………………………………………….65
7. Conclusions…………………………………………………………………………………..67
7.1 Cold Start Control Strategy Modifications…………………………………………..67
7.2 Hot Start Control Strategy Modifications…………………………………………....67
7.3 BAS Engine Start Strategy Modifications……………………….…………………..68
7.4 Final Conclusions and Future Work………………………………………………....68
References………………………………………………………………………………………..70
Appendix A………………………………………………………………………………...….....72
LIST OF MULTIMEDIA OBJECTS
TABLES
Table 1. Summary of differences between HEVs, PHEVs and E-REVs………………………...4
Table 2. Production vehicle specifications and EcoCAR competition requirements...................12
Table 3. SPA E-REV design and component summary………………………………………...17
Table 4. Final vehicle technical specifications compared to production vehicle and competition
requirements……………………………………………………………………………………...20
Table 5. Available modes of operation in charge sustaining mode of the SPA E-REV………...22
Table 6. Comparison of initial 1976 federal emissions standards to a 2009 HHR……………...29
Table 7. EPA federal emissions bins for Tier 2 standard. Stock HHR is Tier 2, Bin 4………....29
Table 8. California Air Resources Board (CARB) LEV II exhaust emissions standards, 2004-
2009 [8]…………………………………………………………………………………………..30
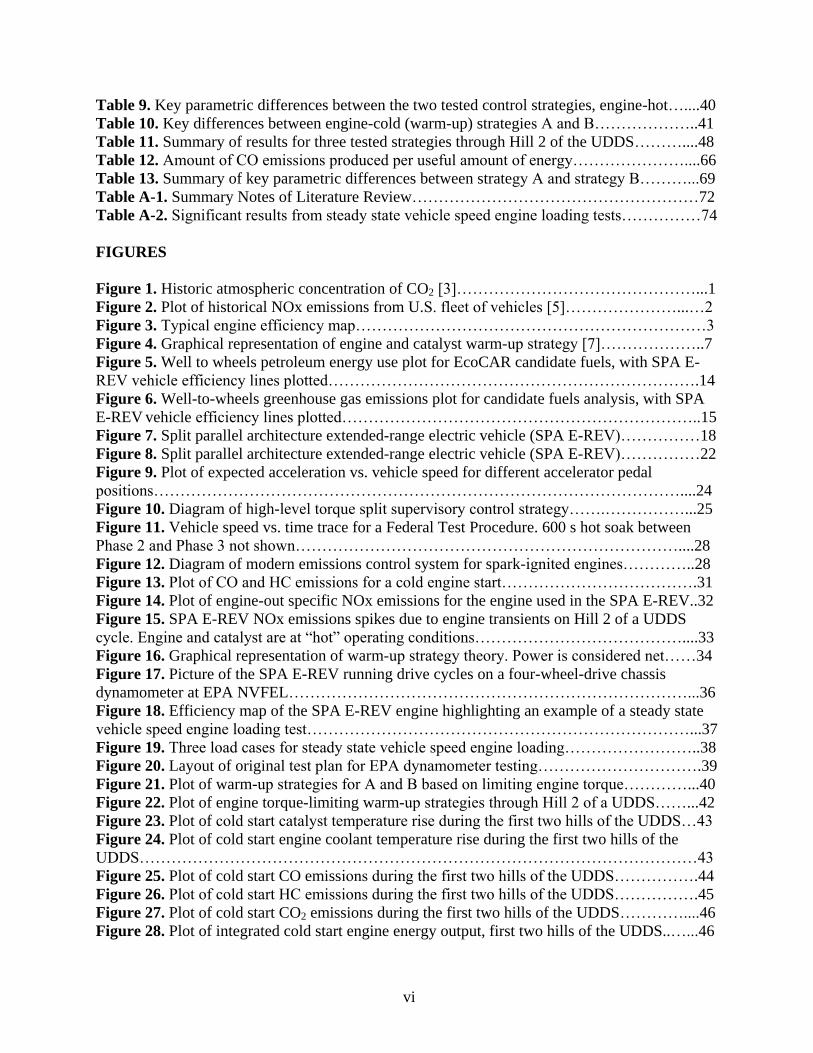
vi
Table 9. Key parametric differences between the two tested control strategies, engine-hot…....40
Table 10. Key differences between engine-cold (warm-up) strategies A and B………………..41
Table 11. Summary of results for three tested strategies through Hill 2 of the UDDS………....48
Table 12. Amount of CO emissions produced per useful amount of energy…………………....66
Table 13. Summary of key parametric differences between strategy A and strategy B………...69
Table A-1. Summary Notes of Literature Review………………………………………………72
Table A-2. Significant results from steady state vehicle speed engine loading tests……………74
FIGURES
Figure 1. Historic atmospheric concentration of CO2 [3]………………………………………...1
Figure 2. Plot of historical NOx emissions from U.S. fleet of vehicles [5]…………………...…2
Figure 3. Typical engine efficiency map…………………………………………………………3
Figure 4. Graphical representation of engine and catalyst warm-up strategy [7]………………..7
Figure 5. Well to wheels petroleum energy use plot for EcoCAR candidate fuels, with SPA E-
REV vehicle efficiency lines plotted…………………………………………………………….14
Figure 6. Well-to-wheels greenhouse gas emissions plot for candidate fuels analysis, with SPA
E-REV vehicle efficiency lines plotted…………………………………………………………..15
Figure 7. Split parallel architecture extended-range electric vehicle (SPA E-REV)……………18
Figure 8. Split parallel architecture extended-range electric vehicle (SPA E-REV)……………22
Figure 9. Plot of expected acceleration vs. vehicle speed for different accelerator pedal
positions………………………………………………………………………………………....24
Figure 10. Diagram of high-level torque split supervisory control strategy…….……………...25
Figure 11. Vehicle speed vs. time trace for a Federal Test Procedure. 600 s hot soak between
Phase 2 and Phase 3 not shown………………………………………………………………....28
Figure 12. Diagram of modern emissions control system for spark-ignited engines…………..28
Figure 13. Plot of CO and HC emissions for a cold engine start……………………………….31
Figure 14. Plot of engine-out specific NOx emissions for the engine used in the SPA E-REV..32
Figure 15. SPA E-REV NOx emissions spikes due to engine transients on Hill 2 of a UDDS
cycle. Engine and catalyst are at “hot” operating conditions…………………………………....33
Figure 16. Graphical representation of warm-up strategy theory. Power is considered net……34
Figure 17. Picture of the SPA E-REV running drive cycles on a four-wheel-drive chassis
dynamometer at EPA NVFEL…………………………………………………………………...36
Figure 18. Efficiency map of the SPA E-REV engine highlighting an example of a steady state
vehicle speed engine loading test………………………………………………………………...37
Figure 19. Three load cases for steady state vehicle speed engine loading……………………..38
Figure 20. Layout of original test plan for EPA dynamometer testing………………………….39
Figure 21. Plot of warm-up strategies for A and B based on limiting engine torque…………...40
Figure 22. Plot of engine torque-limiting warm-up strategies through Hill 2 of a UDDS……...42
Figure 23. Plot of cold start catalyst temperature rise during the first two hills of the UDDS…43
Figure 24. Plot of cold start engine coolant temperature rise during the first two hills of the
UDDS……………………………………………………………………………………………43
Figure 25. Plot of cold start CO emissions during the first two hills of the UDDS…………….44
Figure 26. Plot of cold start HC emissions during the first two hills of the UDDS…………….45
Figure 27. Plot of cold start CO2 emissions during the first two hills of the UDDS…………....46
Figure 28. Plot of integrated cold start engine energy output, first two hills of the UDDS..…...46
vii
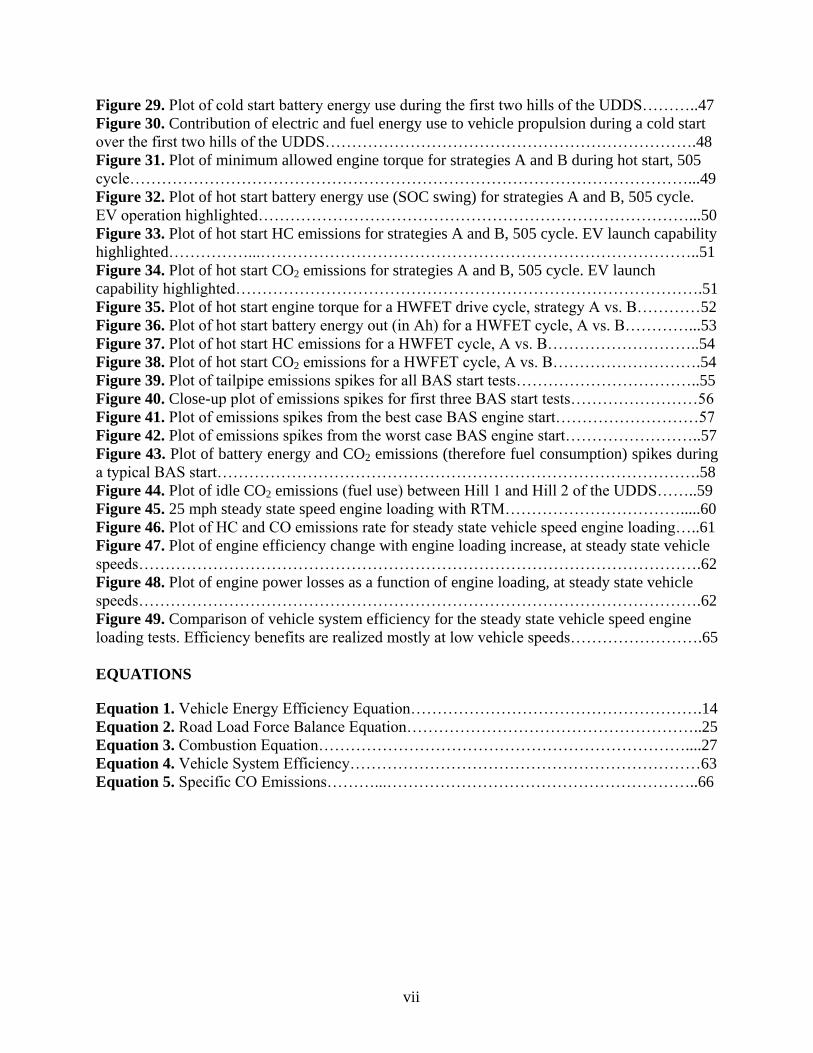
Figure 29. Plot of cold start battery energy use during the first two hills of the UDDS………..47
Figure 30. Contribution of electric and fuel energy use to vehicle propulsion during a cold start
over the first two hills of the UDDS…………………………………………………………….48
Figure 31. Plot of minimum allowed engine torque for strategies A and B during hot start, 505
cycle……………………………………………………………………………………………...49
Figure 32. Plot of hot start battery energy use (SOC swing) for strategies A and B, 505 cycle.
EV operation highlighted………………………………………………………………………...50
Figure 33. Plot of hot start HC emissions for strategies A and B, 505 cycle. EV launch capability
highlighted……………...………………………………………………………………………..51
Figure 34. Plot of hot start CO2 emissions for strategies A and B, 505 cycle. EV launch
capability highlighted…………………………………………………………………………….51
Figure 35. Plot of hot start engine torque for a HWFET drive cycle, strategy A vs. B…………52
Figure 36. Plot of hot start battery energy out (in Ah) for a HWFET cycle, A vs. B…………...53
Figure 37. Plot of hot start HC emissions for a HWFET cycle, A vs. B………………………..54
Figure 38. Plot of hot start CO2 emissions for a HWFET cycle, A vs. B……………………….54
Figure 39. Plot of tailpipe emissions spikes for all BAS start tests……………………………..55
Figure 40. Close-up plot of emissions spikes for first three BAS start tests……………………56
Figure 41. Plot of emissions spikes from the best case BAS engine start………………………57
Figure 42. Plot of emissions spikes from the worst case BAS engine start……………………..57
Figure 43. Plot of battery energy and CO2 emissions (therefore fuel consumption) spikes during
a typical BAS start……………………………………………………………………………….58
Figure 44. Plot of idle CO2 emissions (fuel use) between Hill 1 and Hill 2 of the UDDS……..59
Figure 45. 25 mph steady state speed engine loading with RTM…………………………….....60
Figure 46. Plot of HC and CO emissions rate for steady state vehicle speed engine loading…..61
Figure 47. Plot of engine efficiency change with engine loading increase, at steady state vehicle
speeds…………………………………………………………………………………………….62
Figure 48. Plot of engine power losses as a function of engine loading, at steady state vehicle
speeds…………………………………………………………………………………………….62
Figure 49. Comparison of vehicle system efficiency for the steady state vehicle speed engine
loading tests. Efficiency benefits are realized mostly at low vehicle speeds…………………….65
EQUATIONS
Equation 1. Vehicle Energy Efficiency Equation……………………………………………….14
Equation 2. Road Load Force Balance Equation………………………………………………..25
Equation 3. Combustion Equation……………………………………………………………....27
Equation 4. Vehicle System Efficiency…………………………………………………………63
Equation 5. Specific CO Emissions………...…………………………………………………..66
viii
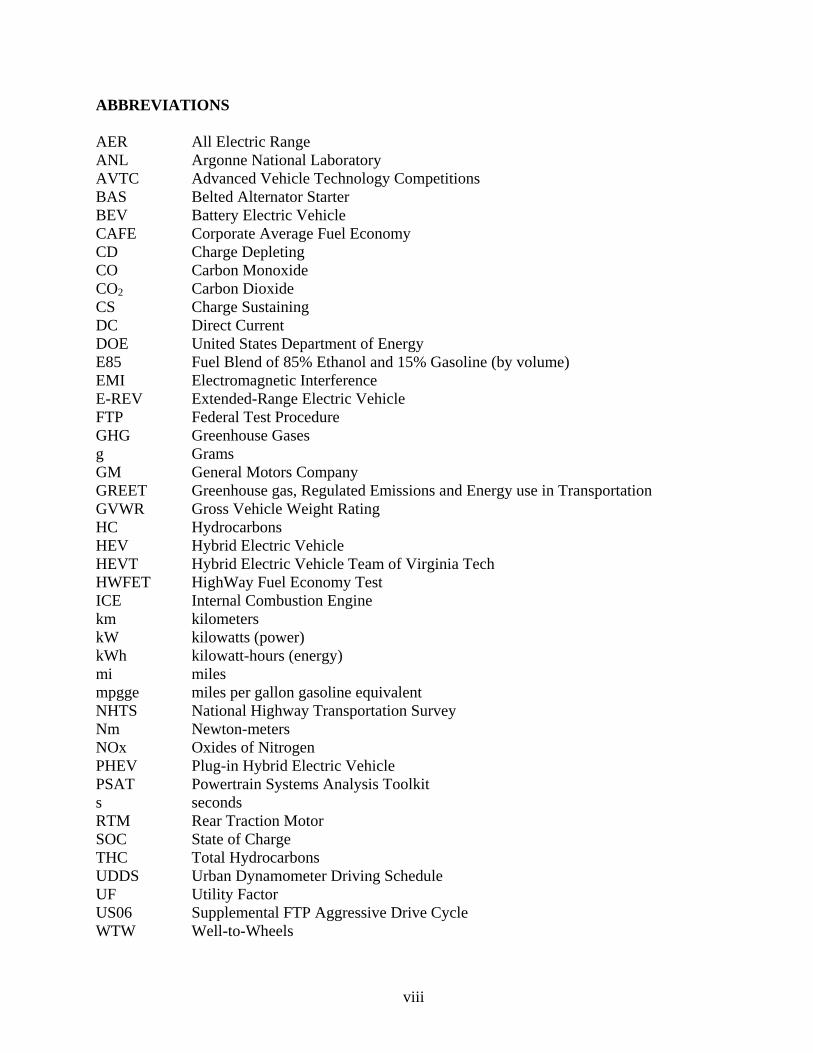
ABBREVIATIONS
AER All Electric Range
ANL Argonne National Laboratory
AVTC Advanced Vehicle Technology Competitions
BAS Belted Alternator Starter
BEV Battery Electric Vehicle
CAFE Corporate Average Fuel Economy
CD Charge Depleting
CO Carbon Monoxide
CO2 Carbon Dioxide
CS Charge Sustaining
DC Direct Current
DOE United States Department of Energy
E85 Fuel Blend of 85% Ethanol and 15% Gasoline (by volume)
EMI Electromagnetic Interference
E-REV Extended-Range Electric Vehicle
FTP Federal Test Procedure
GHG Greenhouse Gases
g Grams
GM General Motors Company
GREET Greenhouse gas, Regulated Emissions and Energy use in Transportation
GVWR Gross Vehicle Weight Rating
HC Hydrocarbons
HEV Hybrid Electric Vehicle
HEVT Hybrid Electric Vehicle Team of Virginia Tech
HWFET HighWay Fuel Economy Test
ICE Internal Combustion Engine
km kilometers
kW kilowatts (power)
kWh kilowatt-hours (energy)
mi miles
mpgge miles per gallon gasoline equivalent
NHTS National Highway Transportation Survey
Nm Newton-meters
NOx Oxides of Nitrogen
PHEV Plug-in Hybrid Electric Vehicle
PSAT Powertrain Systems Analysis Toolkit
s seconds
RTM Rear Traction Motor
SOC State of Charge
THC Total Hydrocarbons
UDDS Urban Dynamometer Driving Schedule
UF Utility Factor
US06 Supplemental FTP Aggressive Drive Cycle
WTW Well-to-Wheels
1
1. INTRODUCTION
1.1 The Motivation for Designing Advanced Technology Vehicles
Petroleum, a non-renewable fossil resource, releases greenhouse gases and other harmful
emissions into the atmosphere when combusted. Petroleum accounts for approximately 95% of
the energy consumed by the United States transportation sector. The amount of petroleum energy
consumed by the transportation sector in 2009 was 45% higher than that of 1975, totaling 7.3
trillion kilowatt-hours [1]. Anthropogenic burning of fossilized resources such as petroleum is
extremely likely to be exerting a substantial net warming influence on the global climate since
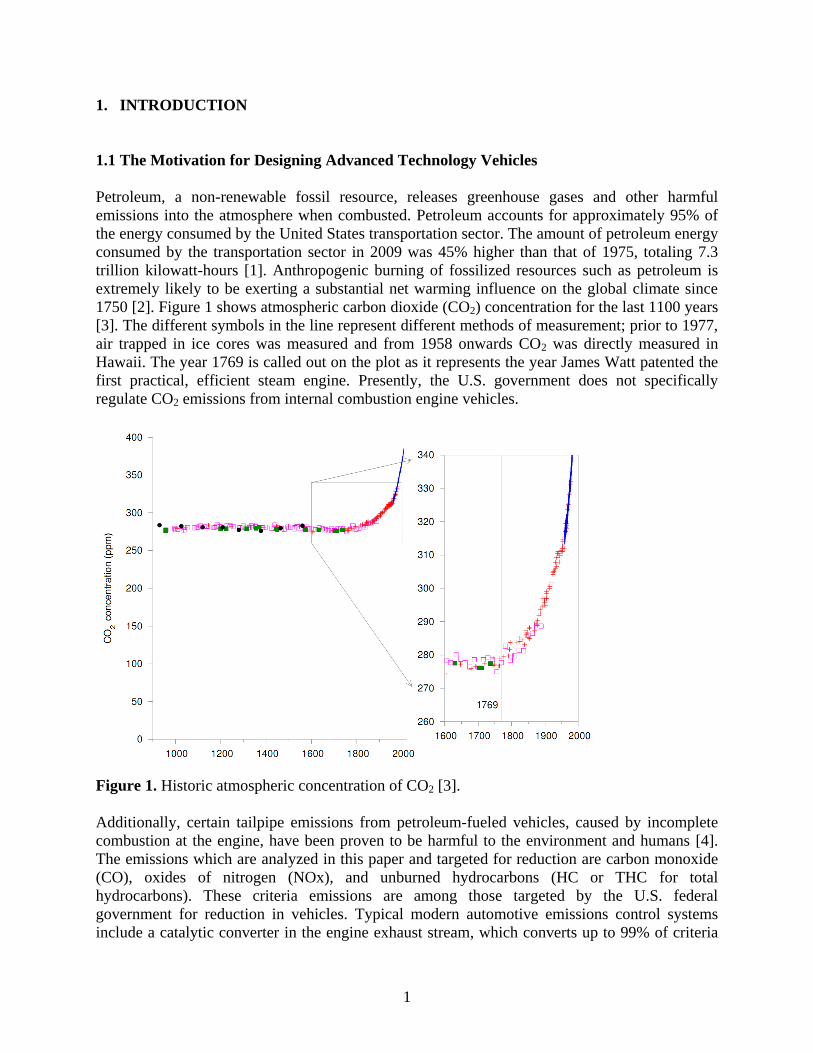
1750 [2]. Figure 1 shows atmospheric carbon dioxide (CO2) concentration for the last 1100 years
[3]. The different symbols in the line represent different methods of measurement; prior to 1977,
air trapped in ice cores was measured and from 1958 onwards CO2 was directly measured in
Hawaii. The year 1769 is called out on the plot as it represents the year James Watt patented the
first practical, efficient steam engine. Presently, the U.S. government does not specifically
regulate CO2 emissions from internal combustion engine vehicles.
Figure 1. Historic atmospheric concentration of CO2 [3].
Additionally, certain tailpipe emissions from petroleum-fueled vehicles, caused by incomplete
combustion at the engine, have been proven to be harmful to the environment and humans [4].
The emissions which are analyzed in this paper and targeted for reduction are carbon monoxide
(CO), oxides of nitrogen (NOx), and unburned hydrocarbons (HC or THC for total
hydrocarbons). These criteria emissions are among those targeted by the U.S. federal
government for reduction in vehicles. Typical modern automotive emissions control systems
include a catalytic converter in the engine exhaust stream, which converts up to 99% of criteria
2
emissions to CO2 and water at steady operating conditions, upon reaching operating temperature.
Prior to reaching operating temperature, the catalyst does not function efficiently, and thus
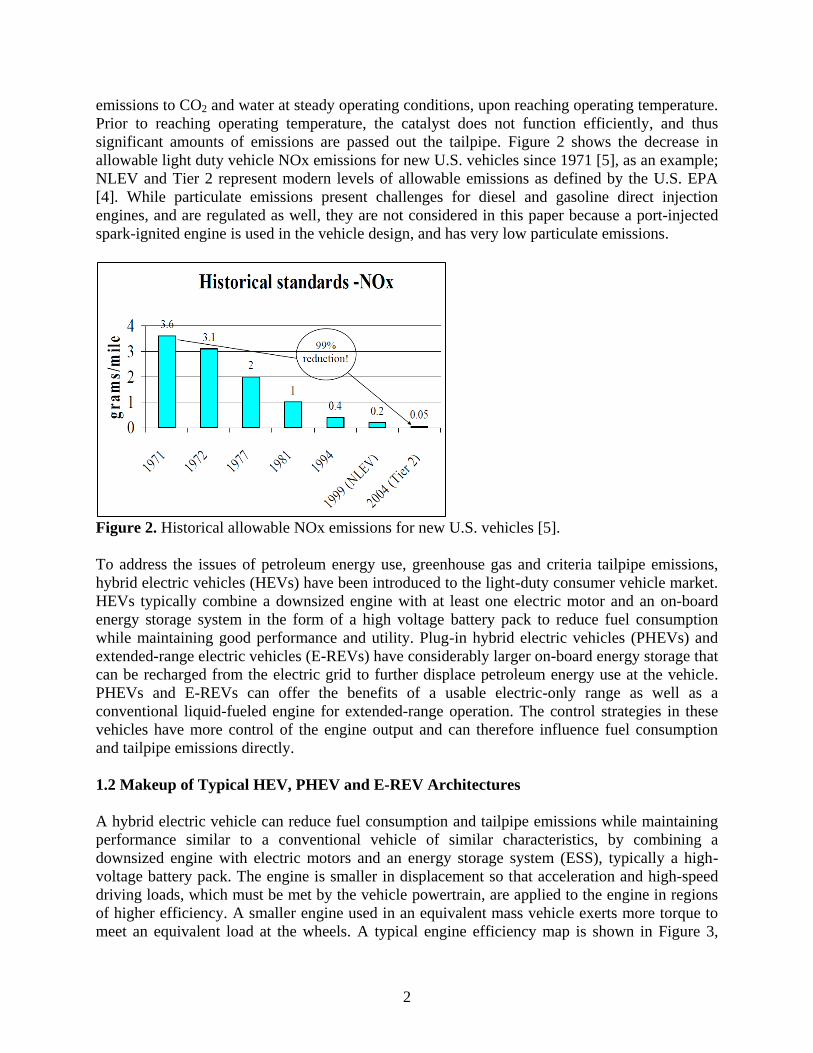
significant amounts of emissions are passed out the tailpipe. Figure 2 shows the decrease in
allowable light duty vehicle NOx emissions for new U.S. vehicles since 1971 [5], as an example;
NLEV and Tier 2 represent modern levels of allowable emissions as defined by the U.S. EPA
[4]. While particulate emissions present challenges for diesel and gasoline direct injection
engines, and are regulated as well, they are not considered in this paper because a port-injected
spark-ignited engine is used in the vehicle design, and has very low particulate emissions.
Figure 2. Historical allowable NOx emissions for new U.S. vehicles [5].
To address the issues of petroleum energy use, greenhouse gas and criteria tailpipe emissions,
hybrid electric vehicles (HEVs) have been introduced to the light-duty consumer vehicle market.
HEVs typically combine a downsized engine with at least one electric motor and an on-board
energy storage system in the form of a high voltage battery pack to reduce fuel consumption
while maintaining good performance and utility. Plug-in hybrid electric vehicles (PHEVs) and
extended-range electric vehicles (E-REVs) have considerably larger on-board energy storage that
can be recharged from the electric grid to further displace petroleum energy use at the vehicle.
PHEVs and E-REVs can offer the benefits of a usable electric-only range as well as a
conventional liquid-fueled engine for extended-range operation. The control strategies in these
vehicles have more control of the engine output and can therefore influence fuel consumption
and tailpipe emissions directly.
1.2 Makeup of Typical HEV, PHEV and E-REV Architectures
A hybrid electric vehicle can reduce fuel consumption and tailpipe emissions while maintaining
performance similar to a conventional vehicle of similar characteristics, by combining a
downsized engine with electric motors and an energy storage system (ESS), typically a high-
voltage battery pack. The engine is smaller in displacement so that acceleration and high-speed
driving loads, which must be met by the vehicle powertrain, are applied to the engine in regions
of higher efficiency. A smaller engine used in an equivalent mass vehicle exerts more torque to
meet an equivalent load at the wheels. A typical engine efficiency map is shown in Figure 3,
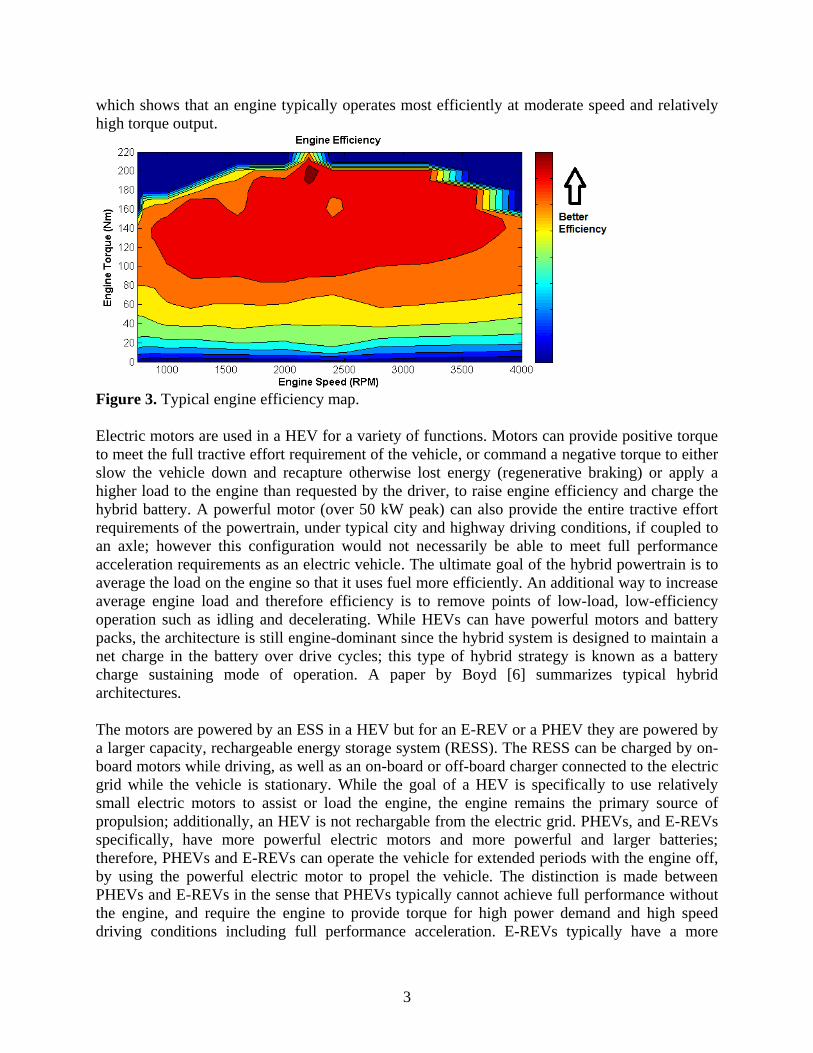
3
which shows that an engine typically operates most efficiently at moderate speed and relatively
high torque output.
Figure 3. Typical engine efficiency map.
Electric motors are used in a HEV for a variety of functions. Motors can provide positive torque
to meet the full tractive effort requirement of the vehicle, or command a negative torque to either
slow the vehicle down and recapture otherwise lost energy (regenerative braking) or apply a
higher load to the engine than requested by the driver, to raise engine efficiency and charge the
hybrid battery. A powerful motor (over 50 kW peak) can also provide the entire tractive effort
requirements of the powertrain, under typical city and highway driving conditions, if coupled to
an axle; however this configuration would not necessarily be able to meet full performance
acceleration requirements as an electric vehicle. The ultimate goal of the hybrid powertrain is to
average the load on the engine so that it uses fuel more efficiently. An additional way to increase
average engine load and therefore efficiency is to remove points of low-load, low-efficiency
operation such as idling and decelerating. While HEVs can have powerful motors and battery
packs, the architecture is still engine-dominant since the hybrid system is designed to maintain a
net charge in the battery over drive cycles; this type of hybrid strategy is known as a battery
charge sustaining mode of operation. A paper by Boyd [6] summarizes typical hybrid
architectures.
The motors are powered by an ESS in a HEV but for an E-REV or a PHEV they are powered by
a larger capacity, rechargeable energy storage system (RESS). The RESS can be charged by on-
board motors while driving, as well as an on-board or off-board charger connected to the electric
grid while the vehicle is stationary. While the goal of a HEV is specifically to use relatively
small electric motors to assist or load the engine, the engine remains the primary source of
propulsion; additionally, an HEV is not rechargable from the electric grid. PHEVs, and E-REVs
specifically, have more powerful electric motors and more powerful and larger batteries;
therefore, PHEVs and E-REVs can operate the vehicle for extended periods with the engine off,
by using the powerful electric motor to propel the vehicle. The distinction is made between
PHEVs and E-REVs in the sense that PHEVs typically cannot achieve full performance without
the engine, and require the engine to provide torque for high power demand and high speed
driving conditions including full performance acceleration. E-REVs typically have a more
4
powerful electric motor and larger RESS to propel the vehicle electrically, and therefore have a
true all-electric range (AER) under all operating conditions, during which the engine will not
start; once the RESS has been depleted to a certain point, the engine will turn on and provide
propulsion for the vehicle. Table 1 summarizes the key differences between HEVs, PHEVs and
E-REVs as they pertain to this paper. The Hybrid Electric Vehicle Team of Virginia Tech
(HEVT) has developed a Split Parallel Architecture E-REV (SPA E-REV) for the Advanced
Vehicle Technology Competition (AVTC) series entitled “EcoCAR: The NeXt Challenge,”
sponsored by General Motors (GM) and the U.S. Department of Energy (DoE).
Table 1. Summary of differences between HEVs, PHEVs and E-REVs.
HEV PHEV E-REV
Energy Source Fuel Fuel / electric grid Fuel / electric grid
Grid Rechargable? No Yes Yes
EV Operation Very limited Limited Full capability
All-Electric Range No Certain conditions Yes
1.3 Objectives
The objective of this paper is to define a high-level supervisory control strategy, based on
dynamometer test results, for a SPA E-REV specifically targeted at reducing fuel consumption
and tailpipe emissions; a supervisory control strategy is defined as a torque-split strategy that
manages powertrain component torques in order to propel the vehicle most efficiently. Engine
control methods such as modifying fuel maps, spark optimization, etc. are not considered.
Additionally, classic control methods such as feedback control, PID controllers and optimization
are not utilized. Rather, optimization of key control strategy parameters is undertaken.
Optimizing a strategy to reduce fuel consumption does not necessarily result in low tailpipe
emissions. The results of the analysis will not define the “as-programmed” strategy details such
as specific powertrain commands and control algorithm routines, but rather serve to show the
tradeoffs in balancing low fuel use and low tailpipe emissions. In short, the paper will give an
explanation of why the vehicle should be controlled in such a way to achieve the desired goals.
The objectives of the paper are to define parametric improvements that can be applied to the
strategy for cold engine and catalyst conditions, hot engine and catalyst conditions and belted
alternator starter (BAS) engine starts. The strategy improvements are suggested based on
measured experimental data from dynamometer testing.
Chapter 2 provides a review of the literature specifically addressing PHEV emissions and fuel
consumption. Chapter 3 introduces the SPA E-REV design and vehicle technical specifications
(VTS). The basic control strategy and available modes of operation are explained in Chapter 4.
Chapter 5 evaluates the theoretical opportunities for tailpipe emissions reductions through hybrid
supervisory control. Chapter 6 presents results from dynamometer testing data analysis to draw
correlations between control strategy changes and vehicle performance. Chapter 7 will then
recommend an overall strategy aimed at achieving low fuel consumption while maintaining low
criteria tailpipe emissions, based on the results from testing; conclusions will finally be stated
thereafter.
5
2. LITERATURE REVIEW
2.1 Boyd Paper on HEV Control Strategy Based on Power Losses (2008)
A paper by Boyd, et al [6] entitled “Hybrid Electric Vehicle Control Strategy Based on Power
Loss Calculations” defines an operational strategy for a HEV by calculating powertrain
component losses and comparing losses across all operational modes. The vehicle differs from
the SPA E-REV architecture in that it is a HEV with a manual transmission, but the paper
addresses a few important points that are useful in the literature review.
The paper analyzes the available operational modes for the design vehicle, which are similar to
those employed in the SPA E-REV. As the vehicle is a charge sustaining hybrid, the engine is
used for all net tractive power at the vehicle, and two electric motors are employed in a hybrid
strategy: a belted alternator starter (BAS) is mounted to the engine and a rear traction motor
(RTM) is mounted to the rear axle. The BAS has the capability to apply positive torque to the
engine for assist or negative torque for electricity generation, whereas the RTM can be used to
directly propel the rear wheels of the vehicle or command negative torque and regain otherwise
lost energy through regenerative braking. The design improves on a through-the-road hybrid
with the addition of the BAS which allows for battery charging at a stop, as well as a more
efficient way to load the engine.
The key findings of the paper show that engine operation over city and highway drive cycles
could be made considerably more efficient by employing a hybrid strategy aimed at raising
vehicle system efficiency. The findings are a result of analyzing all available modes of vehicle
operation and determining component losses in each mode. The goal of higher vehicle system
efficiency is achieved in part by loading the engine with the BAS into a more efficient region of
operation under low power demands. Through eliminating inefficient points of engine operation
including idling, the vehicle is able to reduce fuel consumption considerably.
There are several limitations of the paper findings, which present the need for this paper. First,
the Boyd paper does not specifically address control strategy changes based on the tradeoffs
between low fuel consumption and low tailpipe emissions. Second, the vehicle architecture is an
engine-dominant HEV that cannot provide full performance with the electric motor, thus high
engine loading and therefore tailpipe emissions are experienced during a cold engine start. Third,
the paper focuses specifically on analyzing the steady-state modes of operation and does not
consider transient changes in torque or component temperatures. Finally, test data in support of
the theoretical calculations is not presented.
2.2 Smith/Lohse-Busch Paper on Mitigating PHEV Tailpipe Emissions through
Supervisory Control (2010)
A joint paper between researchers at Argonne and Oak Ridge National Laboratories and the
University of Tennessee [7] investigates the opportunities for reducing PHEV tailpipe emissions
through supervisory control methods, again with supervisory control dealing only with the split
of torque between engine and motors. The vehicle tested is a pre-transmission parallel plug-in
hybrid configuration of a modular automotive test bed. Dynamometer testing is performed to

6
analyze improvements made to the control strategy that specifically target tailpipe emissions
reductions; the final goal for the vehicle is to maintain low fuel consumption whilst meeting
current Super Ultra Low Emission Vehicle (SULEV) [8] emissions levels.
While the powertrain configuration is slightly different from the SPA E-REV, the conclusions
from the paper are still useful. Two areas of control strategy improvement are explained: cold
start and hot start. During the cold start phase, prior to the catalyst operating efficiently, two
strategies are established and tested: one base case strategy (Phase 1) that optimizes for low fuel
consumption with no emissions considerations, and one (Phase 2) that specifically implements
an engine and catalyst warming strategy. During the hot start phase, the Phase 1 strategy does not
address aggressive spikes in engine torque from either engine starts or transient driving loads,
whereas the Phase 2 strategy blends electric motor torque with engine torque in order to limit
sharp transient torque changes at the engine. The paper evaluates the tradeoffs between an
engine-blended and a full-electric charge depleting mode, but those results are not evaluated for
this paper as the SPA E-REV has an all-electric charge depleting mode and does not blend in
engine torque during charge depleting. However, the paper also evaluates the tradeoffs between
two charge-sustaining strategies: one that optimizes engine efficiency (engine-optimum) and one
that commands the engine to more closely follow vehicle load requirements (load-following).
Results from the paper show that limiting torque capability of the engine while the catalyst
warms up significantly reduces tailpipe emissions over the base case; the limited engine
capability is made up with battery and motor power. The warm-up strategy is based on both time
and calculated energy out of the engine; the first phase of warm-up limits the allowable engine
torque to a prescribed value for 120 seconds, upon reaching 120 seconds the second phase allows
the engine torque limit to rise linearly as the engine out energy increases and the catalyst warms
up. Once the catalyst is at operating temperature, the engine is allowed full torque capability. A
graphical representation of the warm-up method is shown in Figure 4; while time is reported at
the end of the first phase, the second phase is based entirely on the amount of energy produced
by the engine and therefore the time required for the second phase is not known. For “hot start”
conditions, the results of the paper show that limiting sharp engine torque transients through
electric motor torque blending can reduce emissions spikes considerably; reducing the severity of
engine transients reduces the possibility of reaching engine “enrichment” conditions, and causes
the air-fuel ratio to fluctuate less under severe vehicle load transients.
7
Figure 4. Graphical representation of engine and catalyst warm-up strategy [7].
While the paper gives useful results and an inspiration for some of the methods presented in this
paper, there are key differences that bring up the need for this paper. First, the methods outlined
in the paper are specifically for a parallel PHEV, not the SPA E-REV. Second, the RESS in the
vehicle being tested has a smaller capacity (10 kWh) and lower operating voltage (260 V) than
the SPA E-REV; one of the goals of the testing done in this paper is to evaluate opportunities for
high vehicle efficiency and low emissions by charging and discharging a large RESS with a high
nominal voltage (20 kWh, 360 V) more frequently and with a larger state-of-charge (SOC)
swing. The emissions results for both engine load-following and engine-optimum cases in the
paper are nearly identical. Finally, the paper only analyzes one warm-up strategy and does not
explore other options for maximum engine torque allowed during the first phase or engine torque
ramp rates during the second phase; testing in this paper aims to address different warm-up
strategies based on varying these parameters.
2.3 Yu Paper on Transient Emissions Characteristics during Engine Start/Stop (2008)
A paper by Yu et al [9] evaluates emissions spikes on an engine test bed designed to simulate
HEV engine start/stop conditions. The paper does not specifically address tradeoffs between fuel
use and emissions from a vehicle systems standpoint, but does present useful emissions results
pertaining to restarting an internal combustion engine in a hybrid operating strategy as the SPA
E-REV is able to do. The test bed uses a 7.5 kW electric motor similar to the BAS used on the
8
SPA-EREV for engine starting. The objective of the paper is to minimize misfires during engine
starts caused by non-stoichiometric conditions, which result in emissions spikes.
The paper specifically evaluates different engine cranking speeds (from 200 RPM to 1600 RPM)
using the electric motor, and the resulting catalyst-out hydrocarbon (HC) emissions from the
engine start. Like the SPA E-REV, the test bed uses a stock engine controller setup which is not
capable of fuel and spark calibrations for different engine starting strategies. The paper
concludes that higher cranking speeds result in higher engine-out HC emissions due to internal
exhaust gas “back flow” caused by a sudden and sharp drop in intake manifold absolute pressure
(MAP); the back flow dilutes the air-fuel mixture, resulting in incomplete combustion and poor
flame propagation. However, catalyst-out HC emissions are lowest in the middle range of
cranking speeds, reaching best performance at 1000 RPM; the result is explained by the fact that
the engine is closest to stoichiometric during the 1000 RPM start which results in higher
conversion efficiency of the catalyst. In summary, the paper offers useful information in support
of the literature review, but does not address cold start emissions or tradeoffs with fuel
consumption during engine starts.
2.4 Takagi Paper on Toyota THS-II PHEV Emissions Control Development (2010)
A paper from the Toyota Motor Corporation [10] details the development of the exhaust
emissions system for the prototype Toyota THS II PHEV, based on a 3rd
generation Toyota
Prius. The vehicle differs from an ordinary Prius HEV because of the 5 kWh RESS on board; the
electric motor has a peak power of 50 kW, and the vehicle can be driven as an EV under 62 mph
at light to medium loads. The paper specifically targets reducing cold start emissions for the
design, and evaluates two different strategies of operation for cold start; the goals for the
strategies are maximum EV driving range and minimum catalyst warm-up time, respectively.
The first strategy is deemed unfeasible due a large spike in emissions on Hill 2 of the EPA
Federal Test Procedure (FTP) for tailpipe emissions, which would cause the vehicle to fail
current SULEV emissions requirements [8]. Based on studies performed for the paper, catalyst
light off is determined to occur when the close-coupled or “start” catalyst temperature reaches
380 C. The amount of energy required to heat the catalyst to this temperature is determined to be
more than 200 kJ. The most significant conclusion from the paper, for purposes of this literature
review, is that cold start emissions (specifically hydrocarbons) are minimized when the time to
warm up the catalyst is minimized. The warm-up time is minimized by supplying the catalyst
energy more quickly by maintaining a steady, light load on the engine after a cold start;
fluctuations in engine torque during a cold start are determined to cause emissions spikes. The
final strategy commands the engine to operate at 35% load at 1500 RPM for approximately 45
seconds to produce the necessary energy to heat the catalyst.
While the paper provides useful insight into catalyst warm-up in a PHEV, the architecture is
different from the SPA E-REV, particularly in that engine demand can be fully decoupled from
vehicle demand in the Toyota vehicle; the engine in the SPA E-REV is directly connected to the
front wheels through the automatic transmission, and therefore cannot be fully decoupled from
vehicle demand. The paper also does not explore warm-up strategy options that would allow
9
light engine torque fluctuations that vary with vehicle load until the catalyst is warmed up; one
goal of this paper is to explore such options.
2.5 Li Paper on Engine Start/Stop Emissions (2009)
A paper by Li et al [11] evaluates the effects of catalyst temperature on engine start emissions.
Catalyst temperatures at time of engine start range from 150 to 400 C in the analysis, and HC
and NOx emissions are reported. The findings of the paper conclude that in order to maintain at
least 50% HC conversion efficiency during an engine start, the catalyst temperature must be at
least 350 C at the time of starting; NOx emissions also decrease with rising temperature. While
the 400 C catalyst temperature case provided for the best emissions performance, the dip in
catalyst substrate temperature upon startup brought the substrate to approximately 350 C before
rising again; this dip in temperature is due to the cooler gases flowing through the hotter (larger
thermal mass) catalyst brick upon initial engine start. Therefore, the additional fuel that must be
burned to maintain 400 C catalyst temperature for all engine starts would not be worth the small
gain in emissions reductions.
The paper only evaluates hot start emissions for an engine test bed and does not evaluate fuel
consumption in comparison to emissions. Additionally, the researchers have control over the
engine controller calibration including commanded air/fuel ratio; the engine controller in the
SPA E-REV is an unmodified stock unit from a production vehicle. Two interesting notes arise
in comparing this paper to the Toyota [10] and Yu [9] papers: this paper concludes a minimum
operating catalyst temperature of 350 C, very similar to the 380 C stated by the Toyota paper;
additionally, this paper evaluates all engine starts at 1000 RPM cranking speed, which is
determined to be ideal in the Yu paper.
2.6 Muta Paper on 2nd
Generation Toyota Prius Development (2004)
Another paper from the Toyota Motor Corporation [12] explains design and development
improvements of the 2nd
generation (2004-2009) Toyota Prius over the 1st generation, and
specifically covers the overall strategy employed by the Toyota Hybrid System II (THS-II).
While the paper covers improvements in fuel economy and acceleration performance and
reduction in vehicle accessory loads, the conclusions of interest deal with the THS-II emissions
strategy for engine cold starts. HC and NOx emissions are reduced by taking advantage of
electric motor assist while the engine runs solely for catalyst warm-up immediately after a cold
start. Essentially, the engine is commanded to produce a steady load independent of vehicle
demands until the catalyst is warmed up. By loading the engine in such a way, the THS-II
control strategy is able to warm the catalyst more quickly on a Federal Test Procedure cycle than
if the strategy were not optimized for cold start emissions considerations; an additional benefit of
warming the engine and catalyst quickly is the ability to perform engine idle-stop sooner. The
vehicle also employs changes in engine fuel mapping calibration during warm-up and late fuel
shutoff on hot engine stops to prevent NOx emissions on restart, both of which are beyond the
scope of this paper as they focus on engine controller calibration rather than hybrid supervisory
control.
10
2.7 Summary of Literature Review
The literature review provides background and an introduction of published papers that relate to
PHEVs, optimization for low fuel consumption, and the challenges in mitigating HEV and
PHEV tailpipe emissions. However, no analysis for a split parallel E-REV exists; additionally,
no analysis exists that evaluates fuel consumption and emissions tradeoffs of distinct control
strategies for a PHEV with charge depleting and charge sustaining capability. This paper will
address the topic of balancing low fuel consumption and low tailpipe emissions for an E-REV
over standard drive cycles using supervisory control methods; cold start and hot start emissions
are considered for analysis. The next section introduces and describes the SPA E-REV design
and the specific powertrain components that are used for this analysis. Table A-1 in the
Appendix summarizes the key notes from each of the reviewed papers.
11
3. SPLIT PARALLEL ARCHITECTURE EXTENDED-RANGE ELECTRIC VEHICLE
From this point in the paper on, only a split parallel architecture extended-range electric vehicle
(SPA E-REV) will be the topic of discussion. However, the approach of balancing vehicle fuel
consumption with tailpipe emissions through supervisory control in a charge sustaining mode
can easily be applied to other strong hybrid architectures with large energy storage systems and
powerful electric motors.
3.1 Introduction to the EcoCAR Competition
The following sections summarize the design process and results for the SPA E-REV vehicle.
For this paper, a hybrid vehicle supervisory control strategy is defined and developed specifically
for the SPA E-REV architecture. This architecture is used by HEVT in the 2008-2011 EcoCAR
competition series. EcoCAR is a collegiate student design competition for advanced technology
vehicles. The goals of the competition are to reduce well-to-wheels petroleum energy use,
greenhouse gas and criteria emissions, vehicle fuel consumption, and maintain stock
performance, safety and consumer appeal. The teams received identical 2009 Saturn VUEs to
modify in order to meet the competition goals.
3.2 SPA E-REV Design Motivation and Process
In addition to meeting the safety, consumer acceptability, fuel efficiency, emissions, and
performance targets of EcoCAR, the SPA E-REV vehicle design focuses on reducing petroleum
consumption. Fossil fuels like petroleum are non-renewable and release greenhouse gases and
other harmful emissions into the atmosphere when burned. Petroleum is also an imported
resource, so reducing its use has additional economic and energy supply security benefits. The
SPA E-REV is therefore designed for maximum petroleum displacement while maintaining a
technologically feasible powertrain for consumers.
As part of the EcoCAR vehicle development process, the design process includes a literature
review to identify candidate fuels, technologies, and approaches to improving light-duty
vehicles. Then, the potential fuels and technologies are compared to those of the stock vehicle to
establish what the improved vehicle design must achieve to meet or improve upon stock vehicle
specifications. The vehicle design then helps to establish the new vehicle technical specifications
as metrics, which leads to evaluation of component specifications and vehicle models. Finally,
powertrain architectures and fuels are selected and a vehicle model is developed in Powertrain
Systems Analysis Toolkit [13] to finalize a design that meets the vehicle technical specifications.
This design process establishes the final vehicle design in this paper: a split parallel architecture
extended-range electric vehicle with a front-mounted 2.4 L inline four cylinder E85 engine that
incorporates a belted alternator starter and a rear-mounted electric traction drive.
3.3 Baseline and Target Vehicle Technical Specifications
This first step of the design process quantifies stock vehicle performance and develops a set of
target vehicle technical specifications that the vehicle design must achieve based on team goals,
competition requirements and competitive vehicle analysis. Table 2 defines the vehicle technical
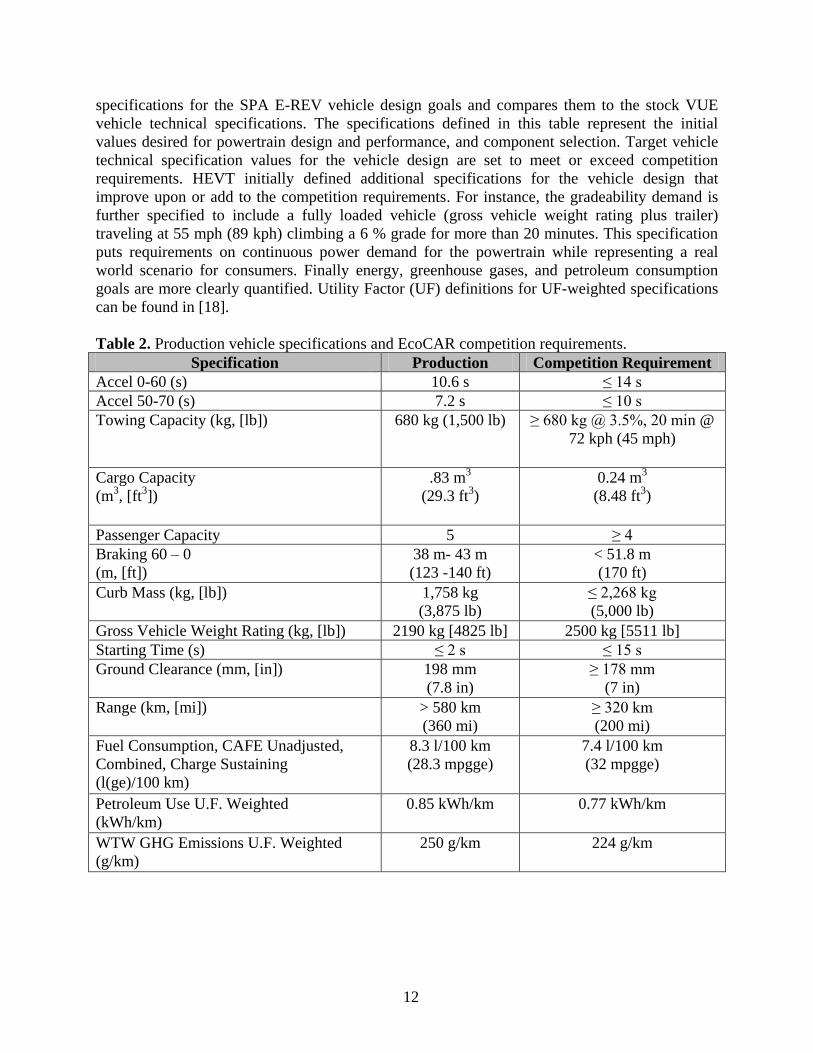
12
specifications for the SPA E-REV vehicle design goals and compares them to the stock VUE
vehicle technical specifications. The specifications defined in this table represent the initial
values desired for powertrain design and performance, and component selection. Target vehicle
technical specification values for the vehicle design are set to meet or exceed competition
requirements. HEVT initially defined additional specifications for the vehicle design that
improve upon or add to the competition requirements. For instance, the gradeability demand is
further specified to include a fully loaded vehicle (gross vehicle weight rating plus trailer)
traveling at 55 mph (89 kph) climbing a 6 % grade for more than 20 minutes. This specification
puts requirements on continuous power demand for the powertrain while representing a real
world scenario for consumers. Finally energy, greenhouse gases, and petroleum consumption
goals are more clearly quantified. Utility Factor (UF) definitions for UF-weighted specifications
can be found in [18].
Table 2. Production vehicle specifications and EcoCAR competition requirements.
Specification Production Competition Requirement
Accel 0-60 (s) 10.6 s ≤ 14 s
Accel 50-70 (s) 7.2 s ≤ 10 s
Towing Capacity (kg, [lb]) 680 kg (1,500 lb) ≥ 680 kg @ 3.5%, 20 min @
72 kph (45 mph)
Cargo Capacity
(m3, [ft
3])
.83 m3
(29.3 ft3)
0.24 m3
(8.48 ft3)
Passenger Capacity 5 ≥ 4
Braking 60 – 0
(m, [ft])
38 m- 43 m
(123 -140 ft)
< 51.8 m
(170 ft)
Curb Mass (kg, [lb]) 1,758 kg
(3,875 lb)
≤ 2,268 kg
(5,000 lb)
Gross Vehicle Weight Rating (kg, [lb]) 2190 kg [4825 lb] 2500 kg [5511 lb]
Starting Time (s) ≤ 2 s ≤ 15 s
Ground Clearance (mm, [in]) 198 mm
(7.8 in)
≥ 178 mm
(7 in)
Range (km, [mi]) > 580 km
(360 mi)
≥ 320 km
(200 mi)
Fuel Consumption, CAFE Unadjusted,
Combined, Charge Sustaining
(l(ge)/100 km)
8.3 l/100 km
(28.3 mpgge)
7.4 l/100 km
(32 mpgge)
Petroleum Use U.F. Weighted
(kWh/km)
0.85 kWh/km 0.77 kWh/km
WTW GHG Emissions U.F. Weighted
(g/km)
250 g/km 224 g/km
13
3.4 Vehicle Energy and Emissions Impact, and Fuel Selection
The selection of the vehicle fuel is influenced by its petroleum energy use and greenhouse gas
emissions impact, as well as by the components that are installed in the vehicle and used to
convert the fuel energy into propulsion [14].
Fuel environmental impact cannot be measured simply by tailpipe emissions and fuel
consumption at the vehicle; greenhouse gases (GHG), petroleum energy use and criteria
emissions should be measured over the entire fuel production and consumption cycle, or from
“well-to-wheels”. For this reason, Argonne National Laboratory‟s Greenhouse Gas and
Regulated Emissions for Transportation (GREET) model [15] is used to calculate total well-to-
pump petroleum energy, GHG emissions and criteria emissions released for the fuel as well [16].
EcoCAR teams are given well-to-pump numbers for North America for the following candidate
fuels: gasoline (10% ethanol), E85 ethanol, B20 biodiesel, grid electricity and gaseous hydrogen
[17]. The pump-to-wheels petroleum energy use (PEU) is calculated based on vehicle
powertrain efficiency. The overall well-to-wheels impact for GHG and PEU is the sum of the
upstream and downstream factors when they are expressed per unit of fuel energy.
To meet the goal of at least 80% reduction in petroleum energy consumption, an analysis of the
EcoCAR candidate fuels is performed. Figure 5 is used to analyze various scenarios for fuel and
powertrain selection; the EcoCAR candidate fuels are presented as columns on the x-axis [17], in
units of well-to-wheels petroleum energy content per unit of fuel energy used at the vehicle.
These numbers are given to EcoCAR teams by the organizers in order to standardize the fuel
selection process for all teams. Note that the x-axis represents the petroleum content of the fuel
energy and does not take into account how efficiently the fuel energy is used on the vehicle. The
y-axis value is the critical characteristic to reduce, as it takes vehicle efficiency into account as
well; the y-axis represents the total amount of well-to-wheels petroleum energy consumed per
distance traveled at the vehicle. The stock vehicle petroleum consumption, based on combined
Corporate Average Fuel Economy ratings, is represented by the black dot; the final predicted
estimates for the SPA E-REV in both modes of operation are shown by the orange dots. Note
that the combined fuel economy rating for the predicted SPA E-REV is based on the SAE J1711
standard for utility factor weighting [18].
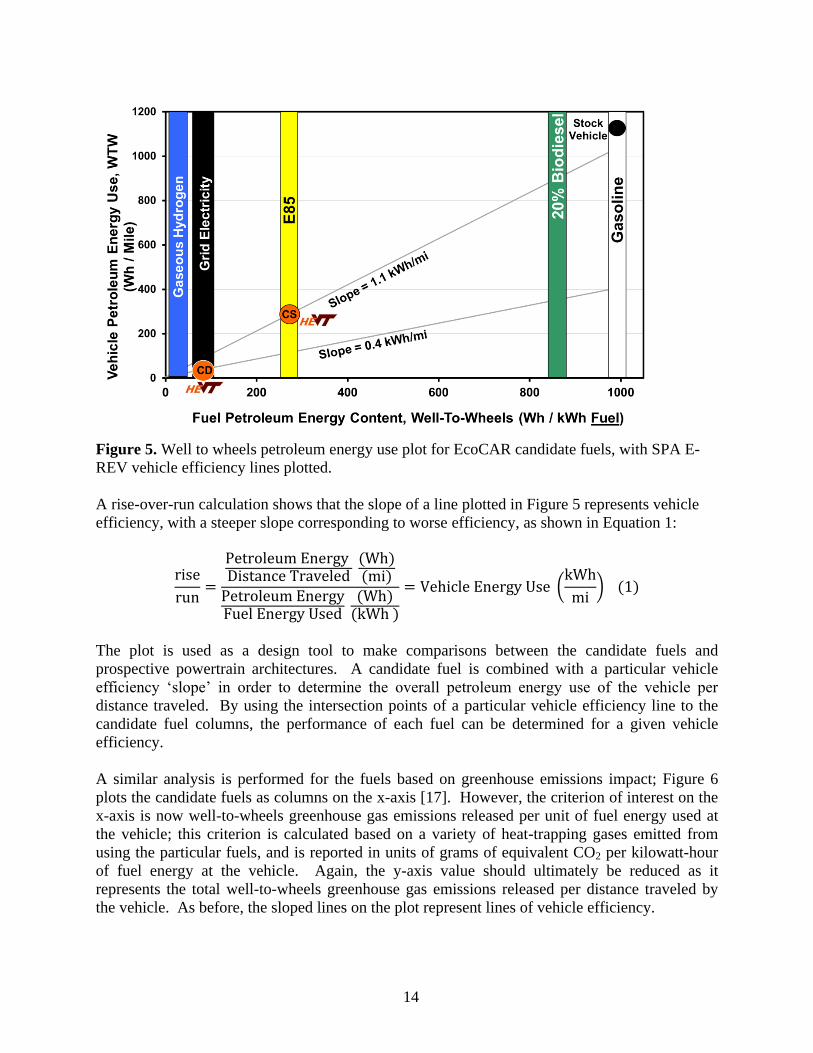
14
Figure 5. Well to wheels petroleum energy use plot for EcoCAR candidate fuels, with SPA E-
REV vehicle efficiency lines plotted.
A rise-over-run calculation shows that the slope of a line plotted in Figure 5 represents vehicle
efficiency, with a steeper slope corresponding to worse efficiency, as shown in Equation 1:
(
)
The plot is used as a design tool to make comparisons between the candidate fuels and
prospective powertrain architectures. A candidate fuel is combined with a particular vehicle
efficiency „slope‟ in order to determine the overall petroleum energy use of the vehicle per
distance traveled. By using the intersection points of a particular vehicle efficiency line to the
candidate fuel columns, the performance of each fuel can be determined for a given vehicle
efficiency.
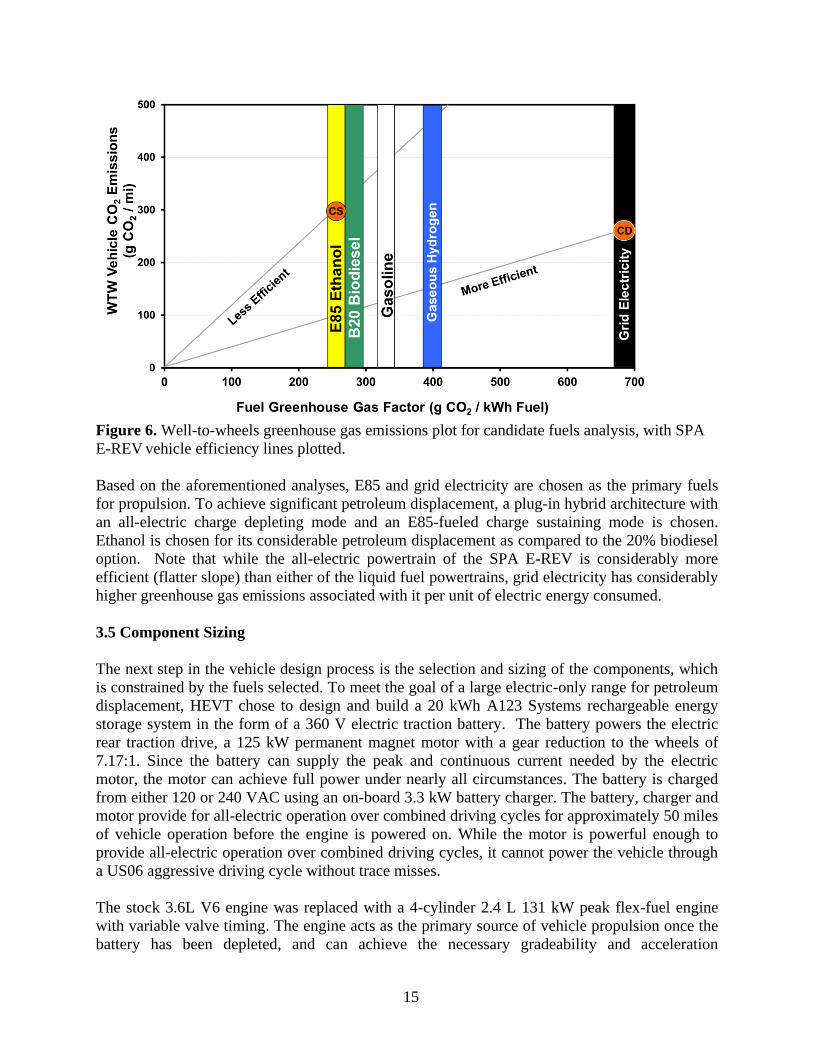
A similar analysis is performed for the fuels based on greenhouse emissions impact; Figure 6
plots the candidate fuels as columns on the x-axis [17]. However, the criterion of interest on the
x-axis is now well-to-wheels greenhouse gas emissions released per unit of fuel energy used at
the vehicle; this criterion is calculated based on a variety of heat-trapping gases emitted from
using the particular fuels, and is reported in units of grams of equivalent CO2 per kilowatt-hour
of fuel energy at the vehicle. Again, the y-axis value should ultimately be reduced as it
represents the total well-to-wheels greenhouse gas emissions released per distance traveled by
the vehicle. As before, the sloped lines on the plot represent lines of vehicle efficiency.
15
Figure 6. Well-to-wheels greenhouse gas emissions plot for candidate fuels analysis, with SPA
E-REV vehicle efficiency lines plotted.
Based on the aforementioned analyses, E85 and grid electricity are chosen as the primary fuels
for propulsion. To achieve significant petroleum displacement, a plug-in hybrid architecture with
an all-electric charge depleting mode and an E85-fueled charge sustaining mode is chosen.
Ethanol is chosen for its considerable petroleum displacement as compared to the 20% biodiesel
option. Note that while the all-electric powertrain of the SPA E-REV is considerably more
efficient (flatter slope) than either of the liquid fuel powertrains, grid electricity has considerably
higher greenhouse gas emissions associated with it per unit of electric energy consumed.
3.5 Component Sizing
The next step in the vehicle design process is the selection and sizing of the components, which
is constrained by the fuels selected. To meet the goal of a large electric-only range for petroleum
displacement, HEVT chose to design and build a 20 kWh A123 Systems rechargeable energy
storage system in the form of a 360 V electric traction battery. The battery powers the electric
rear traction drive, a 125 kW permanent magnet motor with a gear reduction to the wheels of
7.17:1. Since the battery can supply the peak and continuous current needed by the electric
motor, the motor can achieve full power under nearly all circumstances. The battery is charged
from either 120 or 240 VAC using an on-board 3.3 kW battery charger. The battery, charger and
motor provide for all-electric operation over combined driving cycles for approximately 50 miles
of vehicle operation before the engine is powered on. While the motor is powerful enough to
provide all-electric operation over combined driving cycles, it cannot power the vehicle through
a US06 aggressive driving cycle without trace misses.
The stock 3.6L V6 engine was replaced with a 4-cylinder 2.4 L 131 kW peak flex-fuel engine
with variable valve timing. The engine acts as the primary source of vehicle propulsion once the
battery has been depleted, and can achieve the necessary gradeability and acceleration
16
requirements defined by the vehicle technical specifications. The engine is chosen for its good
fuel economy performance, continuous power capability, E85 capability, and stock emissions
control system. While modern, high-performance turbo diesel engines typically require advanced
emissions after-treatment systems including ammonia injection devices, the “LE9” flex-fuel
engine does not require additional exhaust after-treatment equipment or calibration; the factory
three-way catalytic converter and dual oxygen sensor setup is retained. An overview of catalytic
exhaust emissions control in automobiles is found in a later section.
The engine converts E85 fuel energy into either mechanical energy through the transmission and
front powertrain or electrical energy through a 15 kW peak belted alternator starter. This motor is
belted to the engine crankshaft pulley at a ratio of 2.1:1 and replaces the conventional starter and
alternator. The motor improves overall vehicle efficiency by eliminating idle fuel use and
operating the engine more efficiently. Idle fuel use is eliminated because the powerful, liquid
cooled motor can repeatedly perform engine starts while driving, whereas a conventional 12V
starter cannot. The motor can also allow the engine to operate more efficiently by applying a
load on the engine, which operates the engine in a more efficient region and uses the extra load
to generate electric energy for storage in the high voltage battery. The pulley ratio is chosen so
that the motor could provide enough torque to start the engine as well as operate in its designed
speed range of up to 12,000 RPM. In addition to the belted alternator starter, the rear traction
motor can also be used to apply a load on the engine. A discussion of the use of the BAS and
RTM in various modes of operation is found in a later section.
The engine is coupled to a 4-speed automatic transmission directly to the front wheels. Because
the belted alternator starter or rear traction motor can operate the engine at higher efficiency
under most operating conditions with a 4-speed automatic transmission, the benefits of a 6-speed
automatic transmission were minimum when taking into account the additional integration task,
and therefore a 4-speed automatic is retained.
Table 3 summarizes the major powertrain components on the SPA E-REV design. The battery
energy is sized to provide the all-electric range while also meeting electric motor power
requirements, and having a low internal resistance to charging and discharging. The rear traction
motor is sized to reliably meet combined drive cycle accelerations as well as provide good
performance in best effort acceleration. The use of high voltage electric air conditioning, stock
12V electric power steering, and a DC/DC converter eliminate typical mechanical engine
accessory loads and provide a means to better manage electric accessory loads on the vehicle and
further improve vehicle efficiency; the belted alternator starter therefore is the only component
mechanically driven by the engine accessory belt drive.
17
Table 3. SPA E-REV design and component summary.
Architecture Split Parallel Extended-Range Electric Vehicle
Fuel E85 for competition, flex-fuel capable (0-85% ethanol)
Component Power, Mass Type
Engine 131 kW peak,
125 kg
GM LE9 SI I4 DOHC VVT 16 V 2.4L Flex-
Fuel Capable
Emissions Control 5.2 kg GM three-way catalyst, OBD-II, dual oxygen
sensors
Transmission 85 kg GM ME7 4T45 4-speed Automatic
Belted Alternator
Starter Motor and
Inverter
15 kW peak, 8 kW
cont., 32 kg MES 150-125W AC induction
Rear Traction Motor
and Inverter
125 kW peak, 45 kW
cont., 57 kg
UQM PP 125 permanent magnet motor with
BorgWarner 7.17:1 gear reduction
Energy Storage 360 V, 57 Ah, 230 kg A123Systems 20 kWh, 140 kW used peak
output
A/C system 3 kW, 5.5 kg GM Saturn VUE 2-Mode, high voltage electric
drive, high efficiency, variable speed
12V supply 1 kW cont., 5.0 kg Delphi high voltage DC/DC converter
3.6 Design Considerations
Having a small electric motor belted to the engine allows a conventional front-wheel-drive
automatic transmission to be used on the front axle, therefore a power-split device with multiple
planetary gear sets as found in a Toyota Prius is not necessary. Integrating a powerful electric
transaxle on the rear axle provides for efficient EV operation given sufficient battery charge,
additional power for best effort acceleration performance in charge sustaining mode, and
considerable regenerative braking capability. Using two motors provides an additional series
path that can use the engine and belted alternator starter to charge the battery and/or provide
power directly to the rear traction drive through the high voltage bus. This two-motor design
improves on a pure through-the-road parallel design by providing a more efficient and direct
series path for maintaining battery SOC; the battery SOC and A/C operation are maintained
while the vehicle is stationary (such as being stuck in traffic). The design provides some of the
benefits of a power-split architecture while using conventional, off-the-shelf components in a
simple mechanical layout. Figure 7 shows the SPA E-REV concept laid out in a powertrain
architecture diagram. Note that full acceleration performance is not available in all modes of
operation; the engine is not used during EV mode and therefore cannot provide tractive power,
but the engine and both motors can directly propel the vehicle in charge sustaining mode. A
more detailed description of the modes of operation is found in a later section.
18
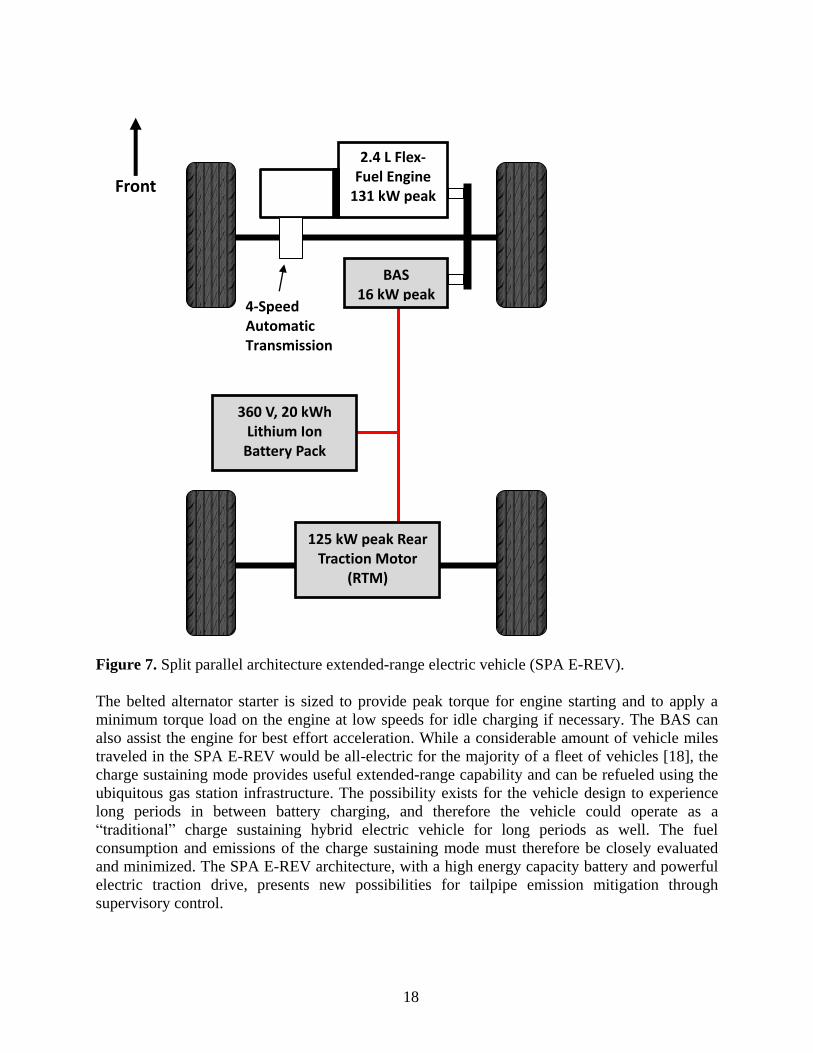
Figure 7. Split parallel architecture extended-range electric vehicle (SPA E-REV).
The belted alternator starter is sized to provide peak torque for engine starting and to apply a
minimum torque load on the engine at low speeds for idle charging if necessary. The BAS can
also assist the engine for best effort acceleration. While a considerable amount of vehicle miles
traveled in the SPA E-REV would be all-electric for the majority of a fleet of vehicles [18], the
charge sustaining mode provides useful extended-range capability and can be refueled using the
ubiquitous gas station infrastructure. The possibility exists for the vehicle design to experience
long periods in between battery charging, and therefore the vehicle could operate as a
“traditional” charge sustaining hybrid electric vehicle for long periods as well. The fuel
consumption and emissions of the charge sustaining mode must therefore be closely evaluated
and minimized. The SPA E-REV architecture, with a high energy capacity battery and powerful
electric traction drive, presents new possibilities for tailpipe emission mitigation through
supervisory control.
2.4 L Flex-Fuel Engine
131 kW peak
125 kW peak Rear Traction Motor
(RTM)
BAS 16 kW peak
360 V, 20 kWh Lithium Ion
Battery Pack
Front
4-Speed Automatic Transmission
19
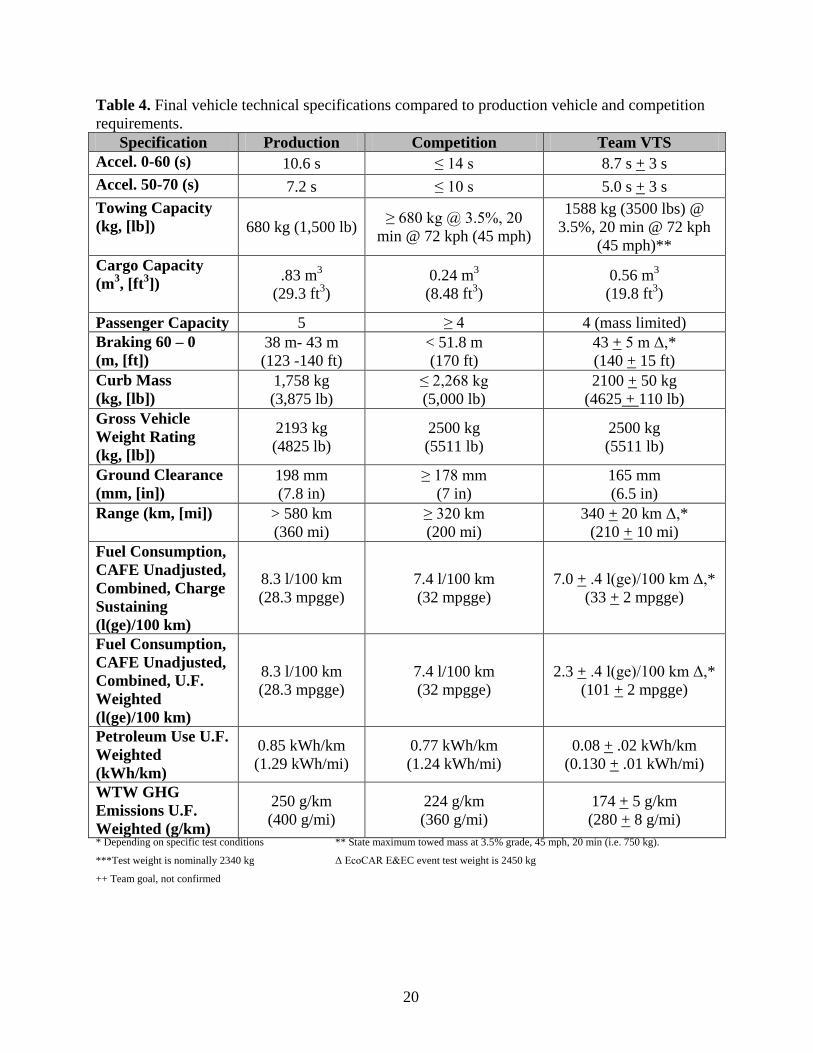
3.7 Final Vehicle Technical Specifications
The final vehicle technical specifications for the SPA E-REV are shown in Table 4 along with
the production vehicle and competition requirement specifications. In summary, this section
describes the development, component and fuel selection for the SPA E-REV architecture used
in the VTREX. Simple vehicle models show that this vehicle can meet the VTS for vehicle
performance, environmental impact, and fuel economy. However, a specific method for
minimizing fuel consumption and tailpipe emissions is needed to determine the overall control
strategy in charge sustaining mode. The next section describes the available control modes for
the vehicle design.
20
Table 4. Final vehicle technical specifications compared to production vehicle and competition
requirements.
Specification Production Competition Team VTS
Accel. 0-60 (s) 10.6 s ≤ 14 s 8.7 s + 3 s
Accel. 50-70 (s) 7.2 s ≤ 10 s 5.0 s + 3 s
Towing Capacity
(kg, [lb]) 680 kg (1,500 lb) ≥ 680 kg @ 3.5%, 20
min @ 72 kph (45 mph)
1588 kg (3500 lbs) @
3.5%, 20 min @ 72 kph
(45 mph)**
Cargo Capacity
(m3, [ft
3])
.83 m3
(29.3 ft3)
0.24 m3
(8.48 ft3)
0.56 m3
(19.8 ft3)
Passenger Capacity 5 ≥ 4 4 (mass limited)
Braking 60 – 0
(m, [ft])
38 m- 43 m
(123 -140 ft)
< 51.8 m
(170 ft)
43 + 5 m Δ,*
(140 + 15 ft)
Curb Mass
(kg, [lb])
1,758 kg
(3,875 lb)
≤ 2,268 kg
(5,000 lb)
2100 + 50 kg
(4625 + 110 lb)
Gross Vehicle
Weight Rating
(kg, [lb])
2193 kg
(4825 lb)
2500 kg
(5511 lb)
2500 kg
(5511 lb)
Ground Clearance
(mm, [in])
198 mm
(7.8 in)
≥ 178 mm
(7 in)
165 mm
(6.5 in)
Range (km, [mi]) > 580 km
(360 mi)
≥ 320 km
(200 mi)
340 + 20 km Δ,*
(210 + 10 mi)
Fuel Consumption,
CAFE Unadjusted,
Combined, Charge
Sustaining
(l(ge)/100 km)
8.3 l/100 km
(28.3 mpgge)
7.4 l/100 km
(32 mpgge)
7.0 + .4 l(ge)/100 km Δ,*
(33 + 2 mpgge)
Fuel Consumption,
CAFE Unadjusted,
Combined, U.F.
Weighted
(l(ge)/100 km)
8.3 l/100 km
(28.3 mpgge)
7.4 l/100 km
(32 mpgge)
2.3 + .4 l(ge)/100 km Δ,*
(101 + 2 mpgge)
Petroleum Use U.F.
Weighted
(kWh/km)
0.85 kWh/km
(1.29 kWh/mi)
0.77 kWh/km
(1.24 kWh/mi)
0.08 + .02 kWh/km
(0.130 + .01 kWh/mi)
WTW GHG
Emissions U.F.
Weighted (g/km)
250 g/km
(400 g/mi)
224 g/km
(360 g/mi)
174 + 5 g/km
(280 + 8 g/mi)
* Depending on specific test conditions ** State maximum towed mass at 3.5% grade, 45 mph, 20 min (i.e. 750 kg).
***Test weight is nominally 2340 kg Δ EcoCAR E&EC event test weight is 2450 kg
++ Team goal, not confirmed
21
4. HYBRID SUPERVISORY CONTROL STRATEGY AND VEHICLE MODES
The SPA E-REV has distinctive modes of operation available, largely dependent on high voltage
battery state of charge. To develop a strategy for reducing criteria tailpipe emissions of the
design while balancing vehicle energy efficiency, the available modes of operation are defined.
4.1 Charge Depleting Mode
The SPA E-REV architecture can operate as a pure electric vehicle in charge depleting mode for
50 miles on combined city and highway drive cycles. All-electric operation over a considerable
distance is made possible with the large capacity and powerful battery as well as the powerful
rear traction motor. The all-electric operation over a large distance allows for a high utility
factor-weighted fuel economy and no tailpipe emissions at the vehicle. All-electric operation in
charge depleting mode is selected over “engine-blended” operation primarily to simplify the
control strategy and provide a desirable consumer feature. Additionally, blended-mode charge
depleting operation is challenging in terms of emissions; the engine must be started in order to
meet high power demands and is then shut off when not needed, therefore the engine loading and
run time are critical [19].
All-electric charge depleting operation for the SPA E-REV is not discussed in depth in this
paper, as the scope is limited to balancing energy consumption and tailpipe emissions in charge
sustaining mode when the engine is being used. Additional information on all-electric charge
depleting modes of operation, including effects of regenerative braking efficiency, can be found
in the literature [20] [21].
4.2 Charge Sustaining Mode
When the high voltage battery is depleted down to its charge sustaining state of charge, the
vehicle enters charge sustaining mode to continue driving. Within charge sustaining mode,
several operational modes can be used, and are listed below. Figure 8 describes the different
energy paths that are available on the SPA E-REV. For reference, a conventional, gasoline-
powered vehicle would convert fuel energy to mechanical energy at the engine, and transmit the
mechanical energy through gear reduction to the wheels. The SPA E-REV can use either electric
motor to provide positive torque for propulsion or negative torque for electricity generation and
regenerative braking. The electric motors and battery can experience positive or negative energy
flow, as depicted by arrows going in both directions on the diagram. Table 5 details the hybrid
modes of operation in terms of component torques.

22
Figure 8. Split parallel architecture extended-range electric vehicle (SPA E-REV).
Table 5. Available modes of operation in charge sustaining mode of the SPA E-REV.
Mode Engine Torque BAS Torque RTM Torque
Engine Only + 0 0
Engine Generate + - -
Engine Assist + + +
Regenerative Braking 0 0 -
Engine Idle Stop 0 0 0
Electric Launch 0 0 +
4.2.1 Engine Only – Since the SPA E-REV allows for engine torque to be transmitted directly
to the ground, engine only mode can be used for most normal driving conditions in
charge sustaining mode.
4.2.2 Engine Generate – In order to operate the engine in a more efficient region, this mode is
activated to load the engine higher than the driver is requesting. Either the BAS or RTM
2.4 L Flex-Fuel Engine
131 kW peak
Charger
BAS 16 kW peak
360 V, 20 kWh Lithium Ion
Battery Pack
125 kW peak Rear Traction Motor
(RTM)
Fuel Mech. Elec.
Front
Grid Energy
E
EF
4-Speed Automatic
E85
~
23
is commanded a negative torque while raising the torque requested to the engine. This
mode is useful for battery state of charge management as the motors convert the extra
mechanical energy generated by the engine to electric energy which can be stored in the
battery pack.
4.2.3 Engine Assist – Under wide-open-throttle conditions, both electric motors can be used to
assist the engine by providing positive torque, effectively boosting best effort
acceleration performance.
4.2.4 Regenerative Braking – The vehicle uses regenerative braking whenever the accelerator
pedal is lifted or the brake pedal is pressed. In charge depleting, all-electric operation, a
small amount of regenerative braking is captured when the accelerator pedal is lifted; this
function is designed to simulate conventional engine compression braking. When the
brake pedal is pressed, from the point of initial travel, regenerative braking capture is
increased with increasing pedal pressure. Negative torque commanded to the RTM is
converted to electric energy by the motor and stored in the battery, within SOC limits of
the battery. The recaptured energy can be used later for propulsion or to run accessories;
a conventional vehicle cannot recapture braking energy, and instead converts it to heat.
4.2.5 Engine Idle Stop – If enough charge has been built up in the battery through either
Engine Generate or Regenerative Braking, and other criteria are met, the engine will
automatically shut off when the vehicle is at rest; this function eliminates idle fuel use.
The BAS is used to restart the engine when necessary.
4.2.6 Electric Launch – If enough charge has been built up in the battery pack, and the vehicle
is already in Engine Idle Stop, the vehicle will enter electric launch. This mode uses
solely the RTM to propel the vehicle up to a predetermined speed, where the engine will
start and provide propulsion. Engine operation at low loads, particularly “off-the-line” is
inefficient, and is therefore replaced by more efficient electric operation. In this mode,
the vehicle behaves exactly as in charge depleting mode up to the maximum electric
launch speed. Since the front powertrain transmits torque to the ground through a
conventional 4-speed torque converter automatic transmission, the transmission gear
upon engine restart is considered. The large battery pack and powerful electric traction
motor allow for electric launch for all power requests up to the electric launch speed of
approximately 20 mph; this functionality allows for first gear of the automatic
transmission to be avoided entirely. The control strategy commands the transmission into
second gear upon engine start, eliminating an inefficient zone of operation for the engine.
4.3 Meeting Driver Demand
The control strategy of the vehicle decides which mode is best to use at any given time in
order to meet driver demand; the vehicle cannot simply operate as efficiently as possible and
not meet the requests of the driver. The control strategy is therefore written to always
produce a certain power at the wheels, to propel the vehicle, based on accelerator pedal
position; the most efficient split of torque between engine, BAS and RTM is determined
from there. The driver demand is therefore always met by the vehicle, regardless of operating
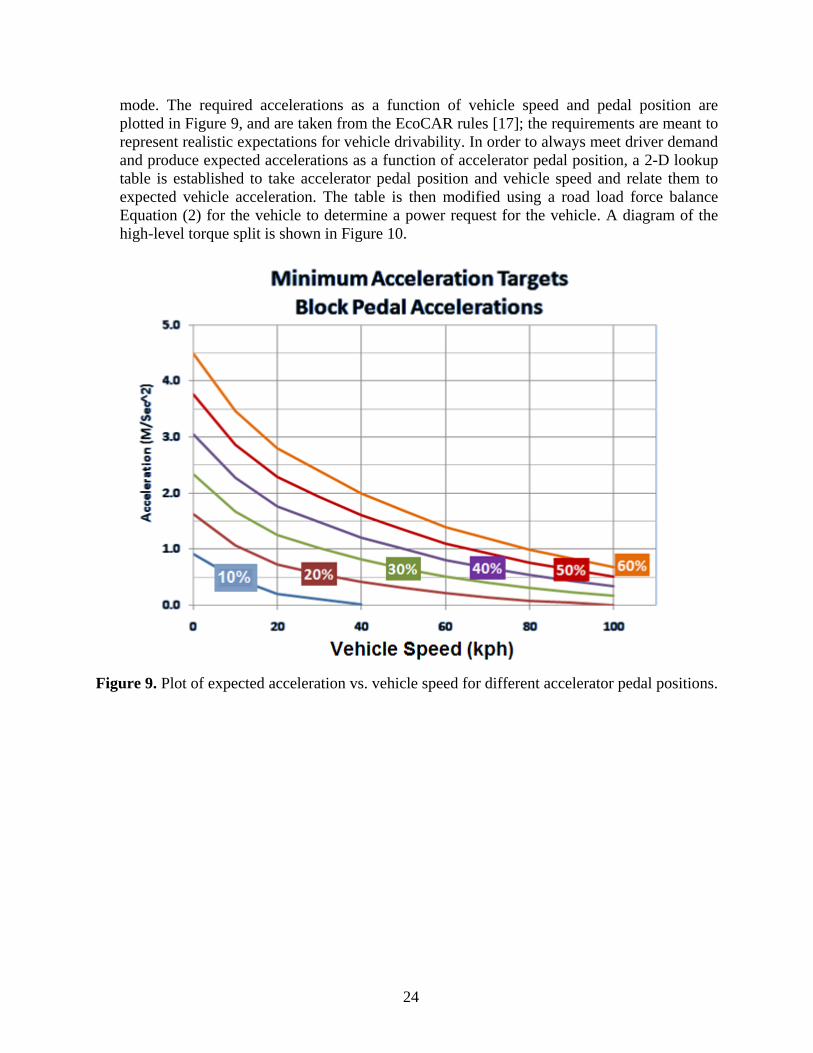
24
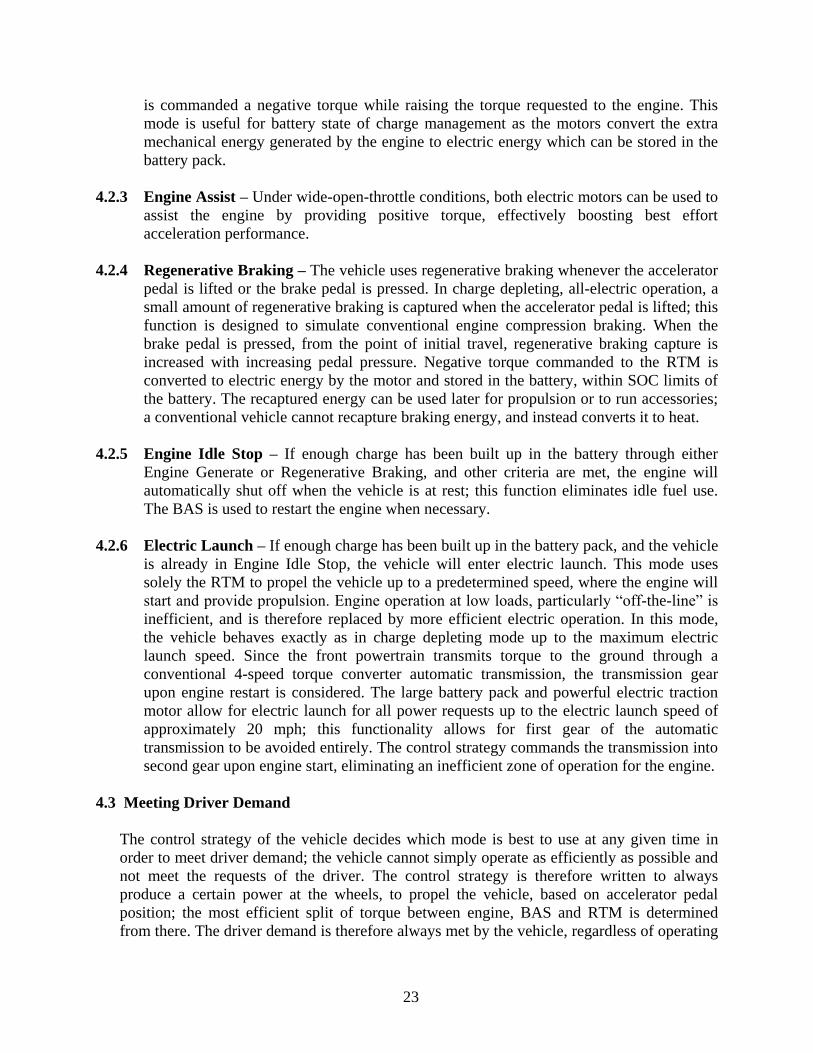
mode. The required accelerations as a function of vehicle speed and pedal position are
plotted in Figure 9, and are taken from the EcoCAR rules [17]; the requirements are meant to
represent realistic expectations for vehicle drivability. In order to always meet driver demand
and produce expected accelerations as a function of accelerator pedal position, a 2-D lookup
table is established to take accelerator pedal position and vehicle speed and relate them to
expected vehicle acceleration. The table is then modified using a road load force balance
Equation (2) for the vehicle to determine a power request for the vehicle. A diagram of the
high-level torque split is shown in Figure 10.
Figure 9. Plot of expected acceleration vs. vehicle speed for different accelerator pedal positions.
25
Figure 10. Diagram of high-level torque split supervisory control strategy.
Additional considerations such as grade or additional load in the vehicle are not accounted for in
the force calculations. A grade, additional towing load or passenger load would require the
accelerator to be pressed further than normal to meet a given acceleration; this behavior is
common amongst conventional automobiles, and the vehicle accelerates and brakes differently
with additional mass or load. Once expected acceleration is converted into a force and then a
power request, a power request 2-D lookup table is created and is used by the strategy to meet
driver demand; the power is then split up efficiently between the RTM, BAS and engine.
4.4 Efficient Vehicle Operation
As designed, the control strategy meets driver demand to produce expected accelerations based
on accelerator pedal position and vehicle speed. In charge sustaining mode, the engine, RTM and
BAS are all torque-producing devices which can be commanded as necessary to ensure efficient
vehicle operation. An in-depth explanation of the torque split control strategy is beyond the
scope of this paper; however, a basic overview of the strategy is necessary to understand the
goals and weaknesses.
𝐹𝑇𝑟𝑎𝑐𝑡𝑖𝑣𝑒 𝐹𝐴𝑒𝑟𝑜 + 𝐹𝑅𝑜𝑙𝑙𝑖𝑛𝑔𝑅𝑒𝑠𝑖𝑠𝑡𝑎𝑛𝑐𝑒 + 𝐹𝐴𝑐𝑐𝑒𝑙 2
𝐹𝑇𝑟𝑎𝑐𝑡𝑖𝑣𝑒
2𝜌𝑉2𝐶𝑑𝐴 +𝑚𝑣𝑔𝐶𝑟𝑟 +𝑚𝑎𝑑𝑗𝑎
26
Since the RTM is not power-limited to meet typical UDDS/HWFET acceleration requirements, it
provides all tractive power between stop and approximately 20 mph provided there is enough
charge in the battery back. Beyond 20 mph, the engine is started and then becomes the source of
propulsion. Based on efficiency data for the engine, a minimum allowed engine torque level is
set to remove inefficient points of operation while driving. If the desired engine torque lies above
the minimum allowed level, the vehicle will operate in engine only mode; if the desired engine
torque is below the minimum level, the RTM or BAS will command a negative torque to force
the engine into a higher loaded condition. As vehicle speed and average load increases, the
engine load increases and therefore the engine operates in more efficient regions of operation;
above approximately 45 mph, the engine is not loaded with either of the motors unless battery
SOC is too low.
4.5 Limitations of Charge Sustaining Modes
While the established modes of operation in charge sustaining provide for efficient operation of
the vehicle while meeting driver demand, they do not inherently take into account effects on
tailpipe emissions. For instance, once the strategy transitions from charge depleting to charge
sustaining operation, Engine Only mode could be the most efficient mode to use immediately.
However, if the engine and catalyst are not up to operating temperature when the engine starts
producing high torque, the vehicle will produce high tailpipe emissions. In addition to the
consideration of intelligent engine and catalyst warm-up, other changes are made to the strategy
to prevent spikes in tailpipe emissions under all operating conditions. The following section will
provide a background on automotive catalyst technology and criteria tailpipe emissions before
explaining the changes implemented into the control strategy.
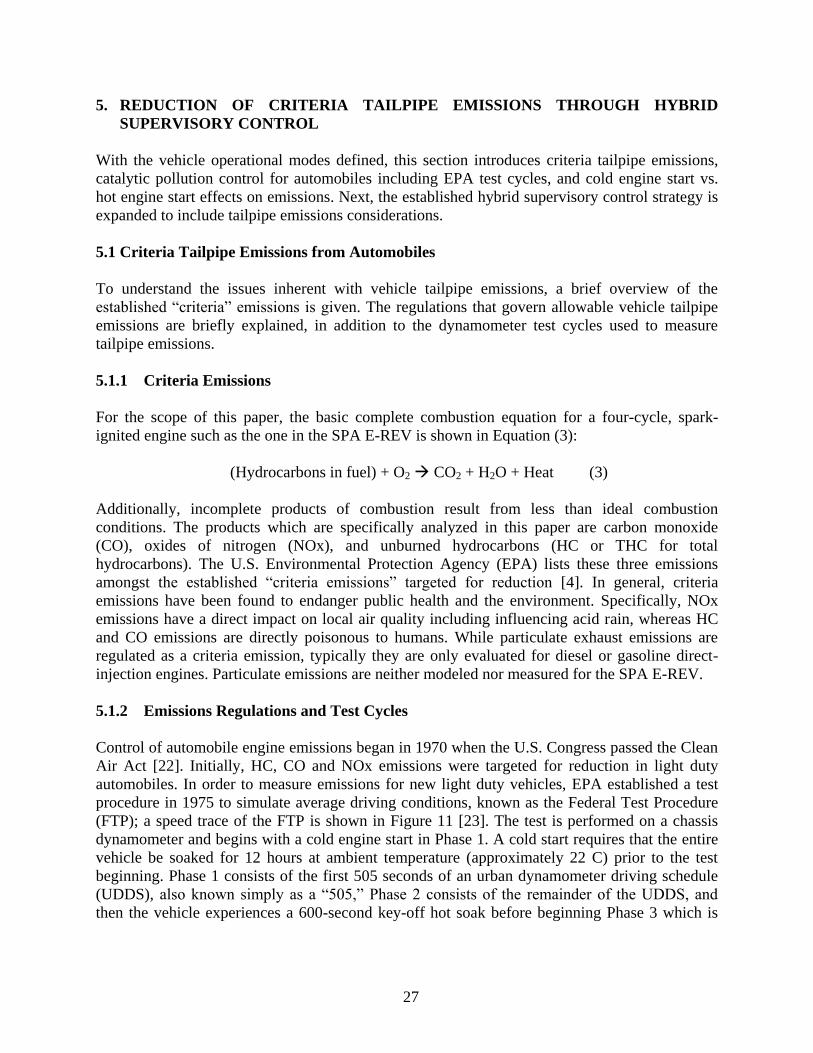
27
5. REDUCTION OF CRITERIA TAILPIPE EMISSIONS THROUGH HYBRID
SUPERVISORY CONTROL
With the vehicle operational modes defined, this section introduces criteria tailpipe emissions,
catalytic pollution control for automobiles including EPA test cycles, and cold engine start vs.
hot engine start effects on emissions. Next, the established hybrid supervisory control strategy is
expanded to include tailpipe emissions considerations.
5.1 Criteria Tailpipe Emissions from Automobiles
To understand the issues inherent with vehicle tailpipe emissions, a brief overview of the
established “criteria” emissions is given. The regulations that govern allowable vehicle tailpipe
emissions are briefly explained, in addition to the dynamometer test cycles used to measure
tailpipe emissions.
5.1.1 Criteria Emissions
For the scope of this paper, the basic complete combustion equation for a four-cycle, spark-
ignited engine such as the one in the SPA E-REV is shown in Equation (3):
(Hydrocarbons in fuel) + O2 CO2 + H2O + Heat (3)
Additionally, incomplete products of combustion result from less than ideal combustion
conditions. The products which are specifically analyzed in this paper are carbon monoxide
(CO), oxides of nitrogen (NOx), and unburned hydrocarbons (HC or THC for total
hydrocarbons). The U.S. Environmental Protection Agency (EPA) lists these three emissions
amongst the established “criteria emissions” targeted for reduction [4]. In general, criteria
emissions have been found to endanger public health and the environment. Specifically, NOx
emissions have a direct impact on local air quality including influencing acid rain, whereas HC
and CO emissions are directly poisonous to humans. While particulate exhaust emissions are
regulated as a criteria emission, typically they are only evaluated for diesel or gasoline direct-
injection engines. Particulate emissions are neither modeled nor measured for the SPA E-REV.
5.1.2 Emissions Regulations and Test Cycles
Control of automobile engine emissions began in 1970 when the U.S. Congress passed the Clean
Air Act [22]. Initially, HC, CO and NOx emissions were targeted for reduction in light duty
automobiles. In order to measure emissions for new light duty vehicles, EPA established a test
procedure in 1975 to simulate average driving conditions, known as the Federal Test Procedure
(FTP); a speed trace of the FTP is shown in Figure 11 [23]. The test is performed on a chassis
dynamometer and begins with a cold engine start in Phase 1. A cold start requires that the entire
vehicle be soaked for 12 hours at ambient temperature (approximately 22 C) prior to the test
beginning. Phase 1 consists of the first 505 seconds of an urban dynamometer driving schedule
(UDDS), also known simply as a “505,” Phase 2 consists of the remainder of the UDDS, and
then the vehicle experiences a 600-second key-off hot soak before beginning Phase 3 which is
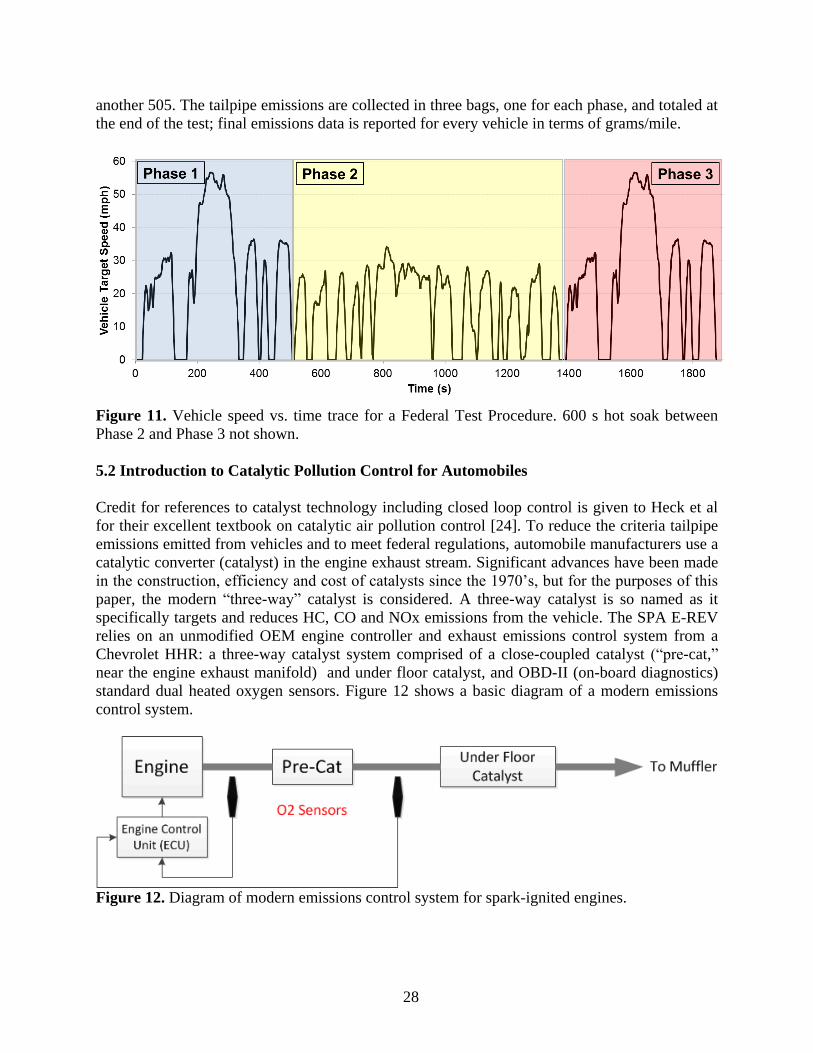
28
another 505. The tailpipe emissions are collected in three bags, one for each phase, and totaled at
the end of the test; final emissions data is reported for every vehicle in terms of grams/mile.
Figure 11. Vehicle speed vs. time trace for a Federal Test Procedure. 600 s hot soak between
Phase 2 and Phase 3 not shown.
5.2 Introduction to Catalytic Pollution Control for Automobiles
Credit for references to catalyst technology including closed loop control is given to Heck et al
for their excellent textbook on catalytic air pollution control [24]. To reduce the criteria tailpipe
emissions emitted from vehicles and to meet federal regulations, automobile manufacturers use a
catalytic converter (catalyst) in the engine exhaust stream. Significant advances have been made
in the construction, efficiency and cost of catalysts since the 1970‟s, but for the purposes of this
paper, the modern “three-way” catalyst is considered. A three-way catalyst is so named as it
specifically targets and reduces HC, CO and NOx emissions from the vehicle. The SPA E-REV
relies on an unmodified OEM engine controller and exhaust emissions control system from a
Chevrolet HHR: a three-way catalyst system comprised of a close-coupled catalyst (“pre-cat,”
near the engine exhaust manifold) and under floor catalyst, and OBD-II (on-board diagnostics)
standard dual heated oxygen sensors. Figure 12 shows a basic diagram of a modern emissions
control system.
Figure 12. Diagram of modern emissions control system for spark-ignited engines.
29
In a three-way catalyst, a combination of precious metals, typically platinum (Pt), palladium (Pd)
and rhodium (Rh), is placed in the engine exhaust stream to catalyze the combustion reactions
and effectively convert the emissions in the exhaust stream to CO2 and water. In order for the
three-way catalyst to function, the engine must be operated at near-stoichiometric conditions
constantly once open-loop operation has finished and closed-loop operation is reached; open
loop operation occurs at a cold engine start and lasts until enough fuel has been burned by the
engine to heat up the oxygen sensors, after which the emissions control system goes into closed
loop operation. In closed-loop operation, modern engine controllers can dither the engine air/fuel
ratio at approximately 1 Hz to switch between slightly lean and slightly rich operating conditions
in order for the catalyst to operate properly. The engine controller in the SPA E-REV is
unmodified and has been calibrated specifically for the stock emissions control system used in
the vehicle, and is able to perform open and closed loop operation as well as dither the air/fuel
ratio around stoichiometric operation.
While the aim of this paper is to devise a hybrid strategy for further reduction of tailpipe
emissions in the SPA E-REV using a stock engine controller and emissions control system, it is
important to note the progress made in catalyst technology since the 1970‟s. Table 6 compares
typical emissions levels measured from mid-70‟s vehicles [24] to that of the EPA bin designation
for a stock 2009 Chevrolet HHR 2.4L, which uses the same engine as the design vehicle. The
HHR falls into Bin 4 of the current Tier 2 emissions standards, shown in Table 7, as well as the
Low Emission Vehicle (LEV) classification from the California Air Resources Board (CARB) as
shown in Table 8. [8].
Table 6. Comparison of initial 1976 federal emissions standards to a 2009 HHR.
HC (g/mi) CO (g/mi) NOx (g/mi)
1976 Federal Standard 1.5 15 3.1
Tier 2 Bin 4 (2009 HHR) 0.07 (NMOG) 2.1 0.04
% Reduction 95% 86% 99%
Table 7. EPA federal emissions bins for Tier 2 standard. Stock HHR is Tier 2, Bin 4.
30
Table 8. California Air Resources Board (CARB) LEV II exhaust emissions standards, 2004-
2009 [8].
5.3 Cold Engine Start vs. Hot Engine Start Tailpipe Emissions
While modern three-way catalysts are 99% efficient at converting incomplete products of
combustion to water and CO2 [24], cold engine start operation remains an issue for tailpipe
emissions. A catalyst must reach a “light-off” temperature before it begins significantly
catalyzing combustion reactions. Before light-off temperature is reached, typically 300-400 C,
the catalytic reactions are not initiated and significant criteria emissions pass through the catalyst
and out of the tailpipe. Due to the aggressive nature of the first 505 seconds of the FTP and the
fact that the engine and catalyst start at ambient temperature for Phase 1, a large portion of the
tailpipe emissions emitted from a vehicle will come from Phase 1. In particular, the second “hill”
of the FTP, which begins at around 180 seconds, is the most aggressive portion of Phase 1 and is
a major determining factor in measured and reported tailpipe emissions. A catalyst in a
conventional vehicle must essentially reach light-off temperature before the large acceleration in
the second hill. To highlight the impact of a cold engine start, Figure 13 shows an example trace
of emissions from a cold start from the SPA E-REV. Once the engine and catalyst have reached
operating temperature, CO and HC emissions are minimal.
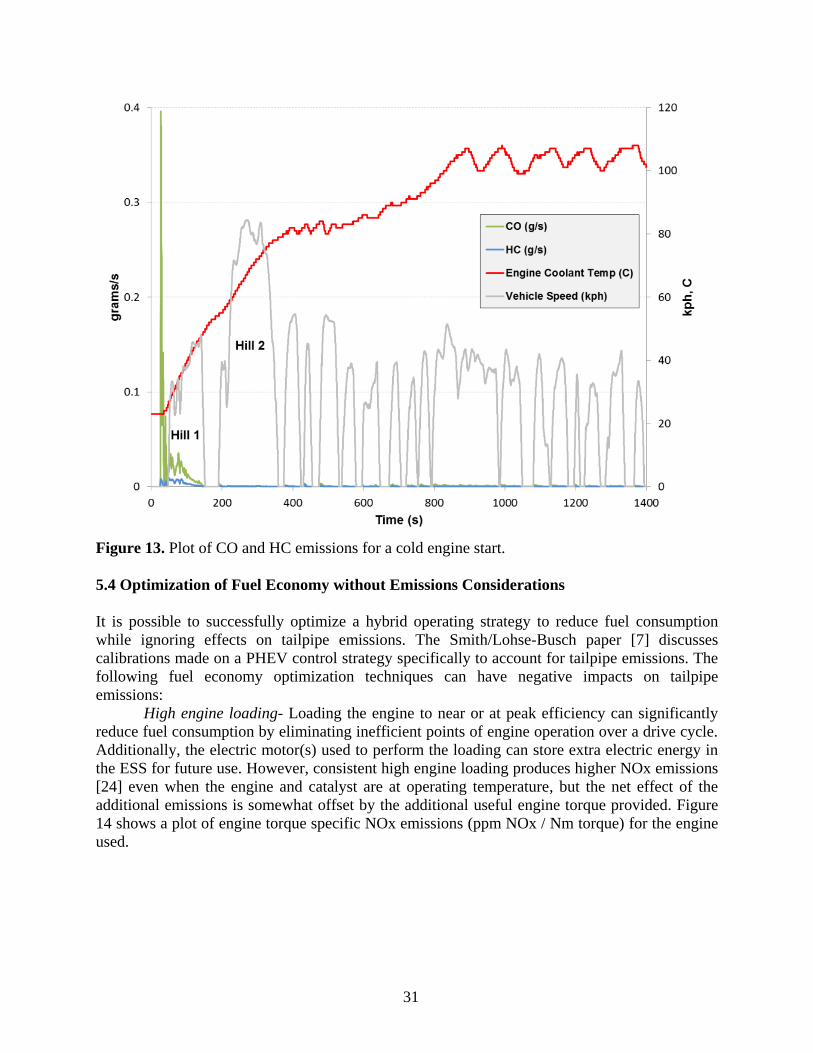
31
Figure 13. Plot of CO and HC emissions for a cold engine start.
5.4 Optimization of Fuel Economy without Emissions Considerations
It is possible to successfully optimize a hybrid operating strategy to reduce fuel consumption
while ignoring effects on tailpipe emissions. The Smith/Lohse-Busch paper [7] discusses
calibrations made on a PHEV control strategy specifically to account for tailpipe emissions. The
following fuel economy optimization techniques can have negative impacts on tailpipe
emissions:
High engine loading- Loading the engine to near or at peak efficiency can significantly
reduce fuel consumption by eliminating inefficient points of engine operation over a drive cycle.
Additionally, the electric motor(s) used to perform the loading can store extra electric energy in
the ESS for future use. However, consistent high engine loading produces higher NOx emissions
[24] even when the engine and catalyst are at operating temperature, but the net effect of the
additional emissions is somewhat offset by the additional useful engine torque provided. Figure
14 shows a plot of engine torque specific NOx emissions (ppm NOx / Nm torque) for the engine
used.
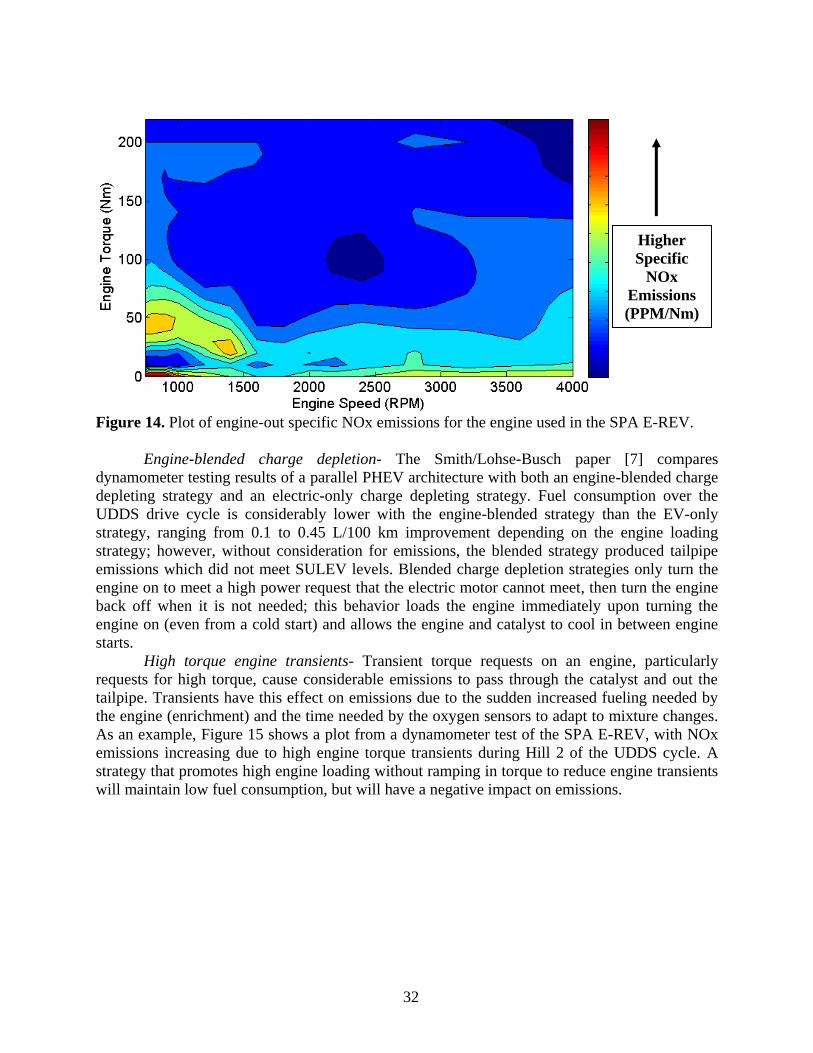
32
Figure 14. Plot of engine-out specific NOx emissions for the engine used in the SPA E-REV.
Engine-blended charge depletion- The Smith/Lohse-Busch paper [7] compares
dynamometer testing results of a parallel PHEV architecture with both an engine-blended charge
depleting strategy and an electric-only charge depleting strategy. Fuel consumption over the
UDDS drive cycle is considerably lower with the engine-blended strategy than the EV-only
strategy, ranging from 0.1 to 0.45 L/100 km improvement depending on the engine loading
strategy; however, without consideration for emissions, the blended strategy produced tailpipe
emissions which did not meet SULEV levels. Blended charge depletion strategies only turn the
engine on to meet a high power request that the electric motor cannot meet, then turn the engine
back off when it is not needed; this behavior loads the engine immediately upon turning the
engine on (even from a cold start) and allows the engine and catalyst to cool in between engine
starts.
High torque engine transients- Transient torque requests on an engine, particularly
requests for high torque, cause considerable emissions to pass through the catalyst and out the
tailpipe. Transients have this effect on emissions due to the sudden increased fueling needed by
the engine (enrichment) and the time needed by the oxygen sensors to adapt to mixture changes.
As an example, Figure 15 shows a plot from a dynamometer test of the SPA E-REV, with NOx
emissions increasing due to high engine torque transients during Hill 2 of the UDDS cycle. A
strategy that promotes high engine loading without ramping in torque to reduce engine transients
will maintain low fuel consumption, but will have a negative impact on emissions.
Higher
Specific
NOx
Emissions
(PPM/Nm)

33
Figure 15. SPA E-REV NOx emissions spikes due to engine transients on Hill 2 of a UDDS
cycle. Engine and catalyst are at “hot” operating conditions.
5.5 Opportunities for Emissions Reductions through Supervisory Control
Two categories of vehicle operation are evaluated in order to analyze and reduce tailpipe
emissions: cold-start (or warm-up) and engine-hot. The following sections will detail the theories
behind control strategy changes with the goal of balancing tailpipe emissions with fuel and
electric energy consumption.
5.5.1 Cold Start (Warm-Up)
In a conventional vehicle, the engine is the sole source of propulsion for the vehicle and
therefore provides all tractive torque for all operating conditions. Increases in required propelling
torque are met by increased engine torque, and therefore increased fuel consumption and engine-
out emissions. In the first phase of engine operation, before the catalyst has reached light-off
temperature, a considerable portion of the engine-out emissions pass through the catalyst and out
of the tailpipe.
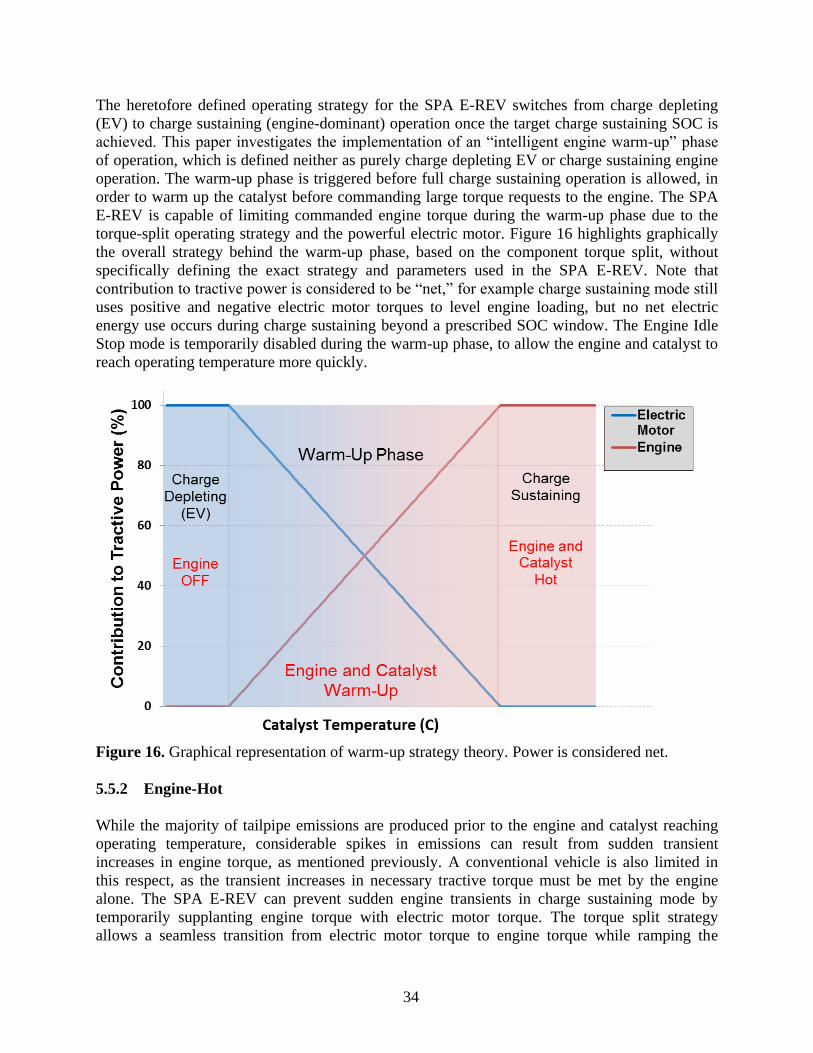
34
The heretofore defined operating strategy for the SPA E-REV switches from charge depleting
(EV) to charge sustaining (engine-dominant) operation once the target charge sustaining SOC is
achieved. This paper investigates the implementation of an “intelligent engine warm-up” phase
of operation, which is defined neither as purely charge depleting EV or charge sustaining engine
operation. The warm-up phase is triggered before full charge sustaining operation is allowed, in
order to warm up the catalyst before commanding large torque requests to the engine. The SPA
E-REV is capable of limiting commanded engine torque during the warm-up phase due to the
torque-split operating strategy and the powerful electric motor. Figure 16 highlights graphically
the overall strategy behind the warm-up phase, based on the component torque split, without
specifically defining the exact strategy and parameters used in the SPA E-REV. Note that
contribution to tractive power is considered to be “net,” for example charge sustaining mode still
uses positive and negative electric motor torques to level engine loading, but no net electric
energy use occurs during charge sustaining beyond a prescribed SOC window. The Engine Idle
Stop mode is temporarily disabled during the warm-up phase, to allow the engine and catalyst to
reach operating temperature more quickly.
Figure 16. Graphical representation of warm-up strategy theory. Power is considered net.
5.5.2 Engine-Hot
While the majority of tailpipe emissions are produced prior to the engine and catalyst reaching
operating temperature, considerable spikes in emissions can result from sudden transient
increases in engine torque, as mentioned previously. A conventional vehicle is also limited in
this respect, as the transient increases in necessary tractive torque must be met by the engine
alone. The SPA E-REV can prevent sudden engine transients in charge sustaining mode by
temporarily supplanting engine torque with electric motor torque. The torque split strategy
allows a seamless transition from electric motor torque to engine torque while ramping the
35
torques out and in respectively. Specifically, the control strategy allows the engine to ramp in
torque at a maximum rate, in terms of Nm/sec.
5.5.3 Expected Results of Supervisory Control Changes
With the aforementioned additions to the control strategy, significant reductions in tailpipe
emissions over a FTP drive cycle are expected. During the cold start phase, engine torque is
limited to a prescribed value until the catalyst is determined to be warm; the specific details of
the engine torque limiting function of the warm-up strategy will be discussed in a later section.
This functionality ensures that the engine does not produce too high torque and therefore engine-
out emissions before the catalyst is functioning. Once the catalyst has reached light-off
temperature, large transients in commanded engine torque will be supplanted with electric torque
to prevent spikes in tailpipe emissions. The specific tests designed to get calibration data for the
control strategy parameters are outlined in the next section, along with the data retrieved from
dynamometer testing and resulting analysis.
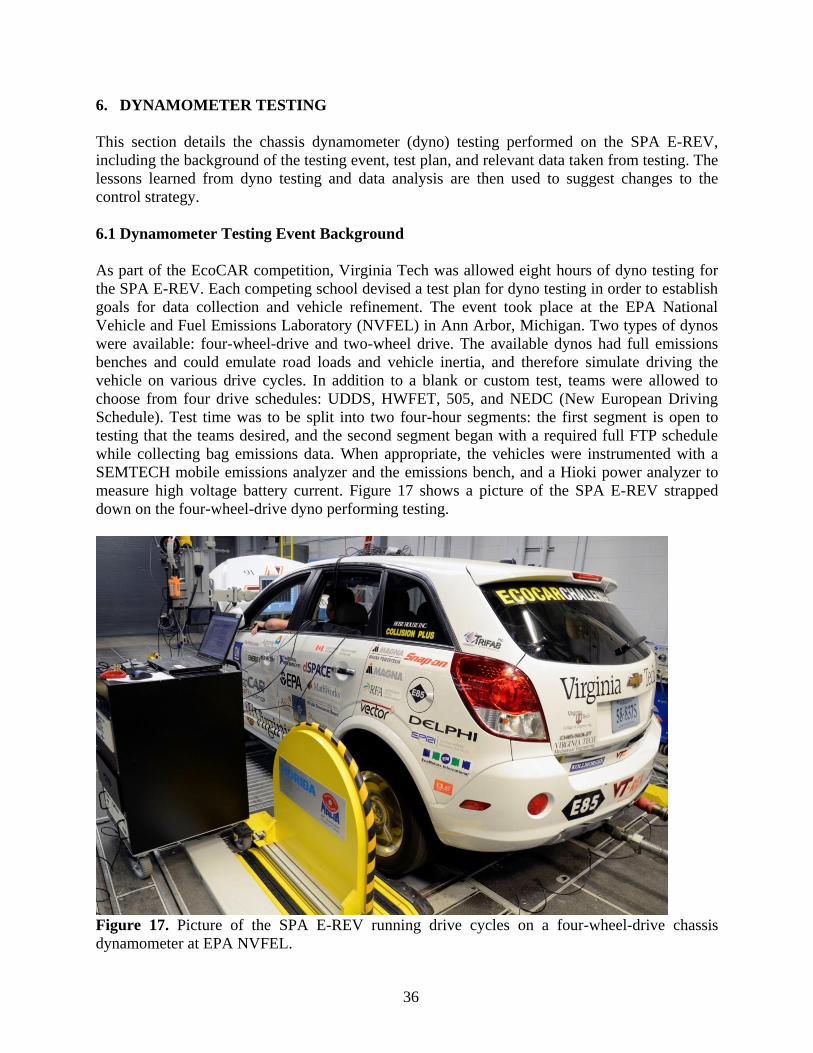
36
6. DYNAMOMETER TESTING
This section details the chassis dynamometer (dyno) testing performed on the SPA E-REV,
including the background of the testing event, test plan, and relevant data taken from testing. The
lessons learned from dyno testing and data analysis are then used to suggest changes to the
control strategy.
6.1 Dynamometer Testing Event Background
As part of the EcoCAR competition, Virginia Tech was allowed eight hours of dyno testing for
the SPA E-REV. Each competing school devised a test plan for dyno testing in order to establish
goals for data collection and vehicle refinement. The event took place at the EPA National
Vehicle and Fuel Emissions Laboratory (NVFEL) in Ann Arbor, Michigan. Two types of dynos
were available: four-wheel-drive and two-wheel drive. The available dynos had full emissions
benches and could emulate road loads and vehicle inertia, and therefore simulate driving the
vehicle on various drive cycles. In addition to a blank or custom test, teams were allowed to
choose from four drive schedules: UDDS, HWFET, 505, and NEDC (New European Driving
Schedule). Test time was to be split into two four-hour segments: the first segment is open to
testing that the teams desired, and the second segment began with a required full FTP schedule
while collecting bag emissions data. When appropriate, the vehicles were instrumented with a
SEMTECH mobile emissions analyzer and the emissions bench, and a Hioki power analyzer to
measure high voltage battery current. Figure 17 shows a picture of the SPA E-REV strapped
down on the four-wheel-drive dyno performing testing.
Figure 17. Picture of the SPA E-REV running drive cycles on a four-wheel-drive chassis
dynamometer at EPA NVFEL.
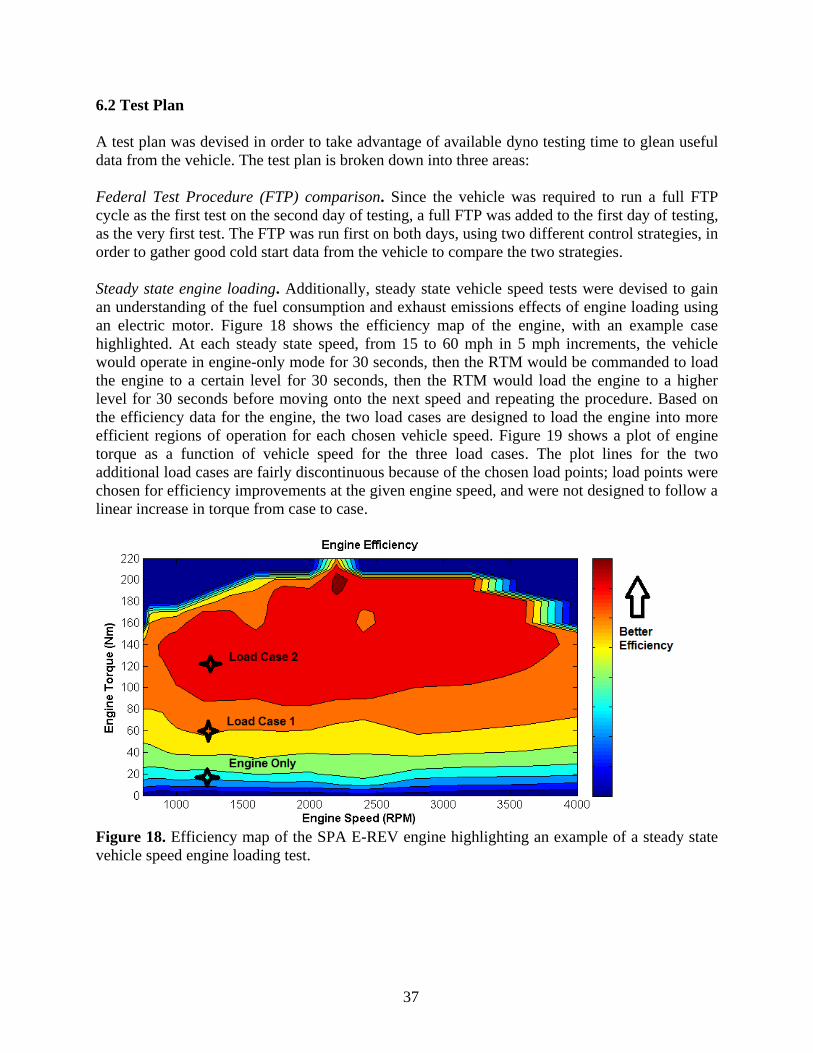
37
6.2 Test Plan
A test plan was devised in order to take advantage of available dyno testing time to glean useful
data from the vehicle. The test plan is broken down into three areas:
Federal Test Procedure (FTP) comparison. Since the vehicle was required to run a full FTP
cycle as the first test on the second day of testing, a full FTP was added to the first day of testing,
as the very first test. The FTP was run first on both days, using two different control strategies, in
order to gather good cold start data from the vehicle to compare the two strategies.
Steady state engine loading. Additionally, steady state vehicle speed tests were devised to gain
an understanding of the fuel consumption and exhaust emissions effects of engine loading using
an electric motor. Figure 18 shows the efficiency map of the engine, with an example case
highlighted. At each steady state speed, from 15 to 60 mph in 5 mph increments, the vehicle
would operate in engine-only mode for 30 seconds, then the RTM would be commanded to load
the engine to a certain level for 30 seconds, then the RTM would load the engine to a higher
level for 30 seconds before moving onto the next speed and repeating the procedure. Based on
the efficiency data for the engine, the two load cases are designed to load the engine into more
efficient regions of operation for each chosen vehicle speed. Figure 19 shows a plot of engine
torque as a function of vehicle speed for the three load cases. The plot lines for the two
additional load cases are fairly discontinuous because of the chosen load points; load points were
chosen for efficiency improvements at the given engine speed, and were not designed to follow a
linear increase in torque from case to case.
Figure 18. Efficiency map of the SPA E-REV engine highlighting an example of a steady state
vehicle speed engine loading test.

38
Figure 19. Three load cases for steady state vehicle speed engine loading.
BAS engine starts, hot engine and catalyst. The final test of interest evaluated BAS engine starts
at different vehicle speeds to evaluate potential spikes in emissions, fuel consumption and
electric energy consumption. The BAS start strategy would not change, only the vehicle speeds
at which the BAS is commanded to start the engine. Figure 20 shows the original test plan that
was written for the event.
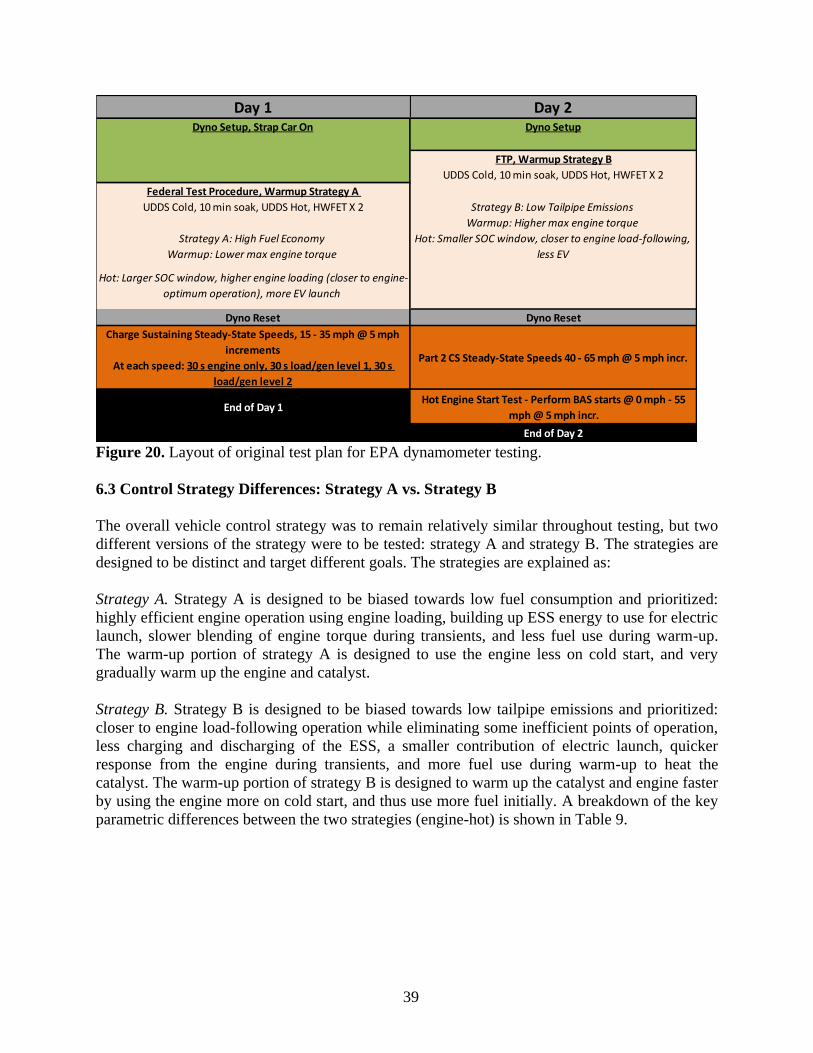
39
Figure 20. Layout of original test plan for EPA dynamometer testing.
6.3 Control Strategy Differences: Strategy A vs. Strategy B
The overall vehicle control strategy was to remain relatively similar throughout testing, but two
different versions of the strategy were to be tested: strategy A and strategy B. The strategies are
designed to be distinct and target different goals. The strategies are explained as:
Strategy A. Strategy A is designed to be biased towards low fuel consumption and prioritized:
highly efficient engine operation using engine loading, building up ESS energy to use for electric
launch, slower blending of engine torque during transients, and less fuel use during warm-up.
The warm-up portion of strategy A is designed to use the engine less on cold start, and very
gradually warm up the engine and catalyst.
Strategy B. Strategy B is designed to be biased towards low tailpipe emissions and prioritized:
closer to engine load-following operation while eliminating some inefficient points of operation,
less charging and discharging of the ESS, a smaller contribution of electric launch, quicker
response from the engine during transients, and more fuel use during warm-up to heat the
catalyst. The warm-up portion of strategy B is designed to warm up the catalyst and engine faster
by using the engine more on cold start, and thus use more fuel initially. A breakdown of the key
parametric differences between the two strategies (engine-hot) is shown in Table 9.
Day 1 Day 2Dyno Setup, Strap Car On Dyno Setup
FTP, Warmup Strategy B
UDDS Cold, 10 min soak, UDDS Hot, HWFET X 2
Federal Test Procedure, Warmup Strategy A
UDDS Cold, 10 min soak, UDDS Hot, HWFET X 2 Strategy B: Low Tailpipe Emissions
Warmup: Higher max engine torque
Strategy A: High Fuel Economy
Warmup: Lower max engine torque
Dyno Reset Dyno Reset
Charge Sustaining Steady-State Speeds, 15 - 35 mph @ 5 mph
increments
At each speed: 30 s engine only, 30 s load/gen level 1, 30 s
load/gen level 2
Part 2 CS Steady-State Speeds 40 - 65 mph @ 5 mph incr.
End of Day 1Hot Engine Start Test - Perform BAS starts @ 0 mph - 55
mph @ 5 mph incr.
End of Day 2
Hot: Smaller SOC window, closer to engine load-following,
less EV
Hot: Larger SOC window, higher engine loading (closer to engine-
optimum operation), more EV launch
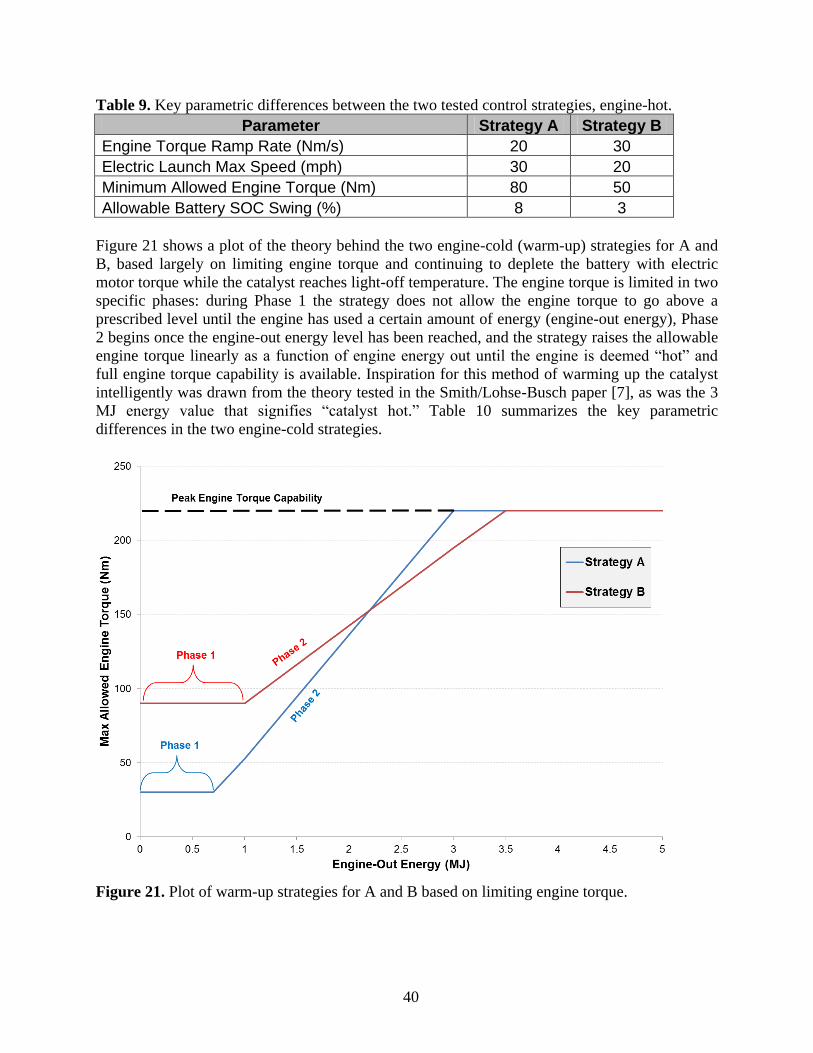
40
Table 9. Key parametric differences between the two tested control strategies, engine-hot.
Parameter Strategy A Strategy B
Engine Torque Ramp Rate (Nm/s) 20 30
Electric Launch Max Speed (mph) 30 20
Minimum Allowed Engine Torque (Nm) 80 50
Allowable Battery SOC Swing (%) 8 3
Figure 21 shows a plot of the theory behind the two engine-cold (warm-up) strategies for A and
B, based largely on limiting engine torque and continuing to deplete the battery with electric
motor torque while the catalyst reaches light-off temperature. The engine torque is limited in two
specific phases: during Phase 1 the strategy does not allow the engine torque to go above a
prescribed level until the engine has used a certain amount of energy (engine-out energy), Phase
2 begins once the engine-out energy level has been reached, and the strategy raises the allowable
engine torque linearly as a function of engine energy out until the engine is deemed “hot” and
full engine torque capability is available. Inspiration for this method of warming up the catalyst
intelligently was drawn from the theory tested in the Smith/Lohse-Busch paper [7], as was the 3
MJ energy value that signifies “catalyst hot.” Table 10 summarizes the key parametric
differences in the two engine-cold strategies.
Figure 21. Plot of warm-up strategies for A and B based on limiting engine torque.
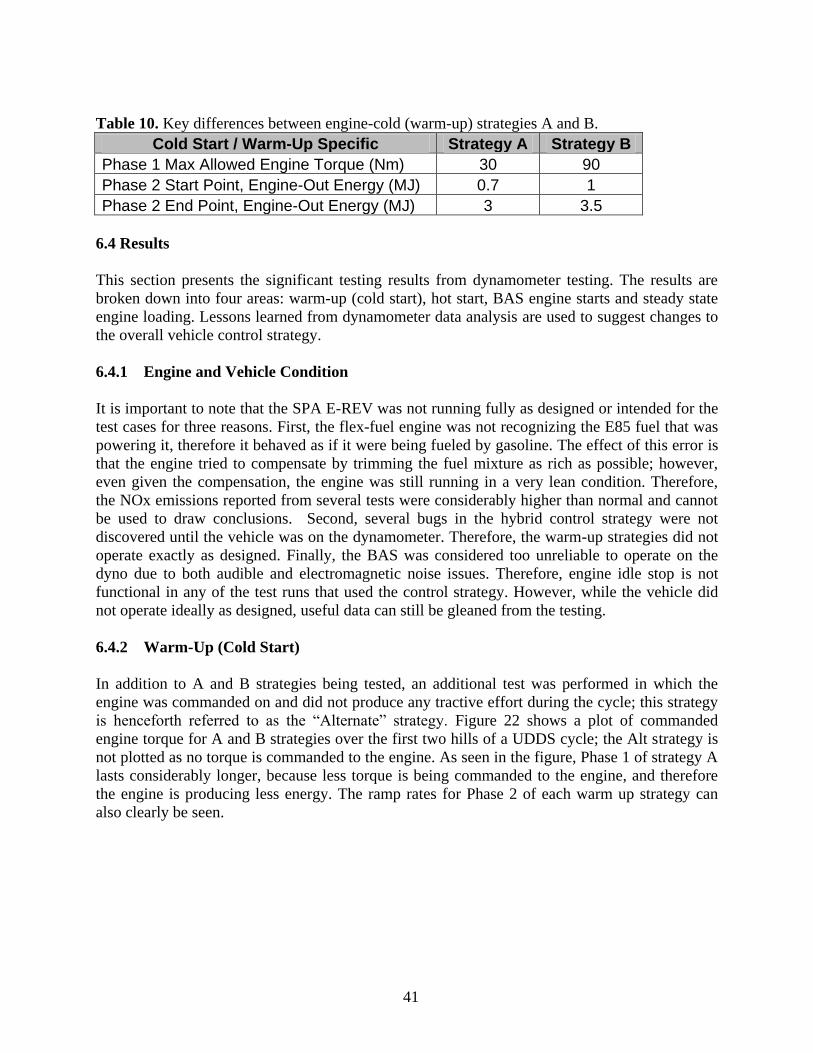
41
Table 10. Key differences between engine-cold (warm-up) strategies A and B.
Cold Start / Warm-Up Specific Strategy A Strategy B
Phase 1 Max Allowed Engine Torque (Nm) 30 90
Phase 2 Start Point, Engine-Out Energy (MJ) 0.7 1
Phase 2 End Point, Engine-Out Energy (MJ) 3 3.5
6.4 Results
This section presents the significant testing results from dynamometer testing. The results are
broken down into four areas: warm-up (cold start), hot start, BAS engine starts and steady state
engine loading. Lessons learned from dynamometer data analysis are used to suggest changes to
the overall vehicle control strategy.
6.4.1 Engine and Vehicle Condition
It is important to note that the SPA E-REV was not running fully as designed or intended for the
test cases for three reasons. First, the flex-fuel engine was not recognizing the E85 fuel that was
powering it, therefore it behaved as if it were being fueled by gasoline. The effect of this error is
that the engine tried to compensate by trimming the fuel mixture as rich as possible; however,
even given the compensation, the engine was still running in a very lean condition. Therefore,
the NOx emissions reported from several tests were considerably higher than normal and cannot
be used to draw conclusions. Second, several bugs in the hybrid control strategy were not
discovered until the vehicle was on the dynamometer. Therefore, the warm-up strategies did not
operate exactly as designed. Finally, the BAS was considered too unreliable to operate on the
dyno due to both audible and electromagnetic noise issues. Therefore, engine idle stop is not
functional in any of the test runs that used the control strategy. However, while the vehicle did
not operate ideally as designed, useful data can still be gleaned from the testing.
6.4.2 Warm-Up (Cold Start)
In addition to A and B strategies being tested, an additional test was performed in which the
engine was commanded on and did not produce any tractive effort during the cycle; this strategy
is henceforth referred to as the “Alternate” strategy. Figure 22 shows a plot of commanded
engine torque for A and B strategies over the first two hills of a UDDS cycle; the Alt strategy is
not plotted as no torque is commanded to the engine. As seen in the figure, Phase 1 of strategy A
lasts considerably longer, because less torque is being commanded to the engine, and therefore
the engine is producing less energy. The ramp rates for Phase 2 of each warm up strategy can
also clearly be seen.
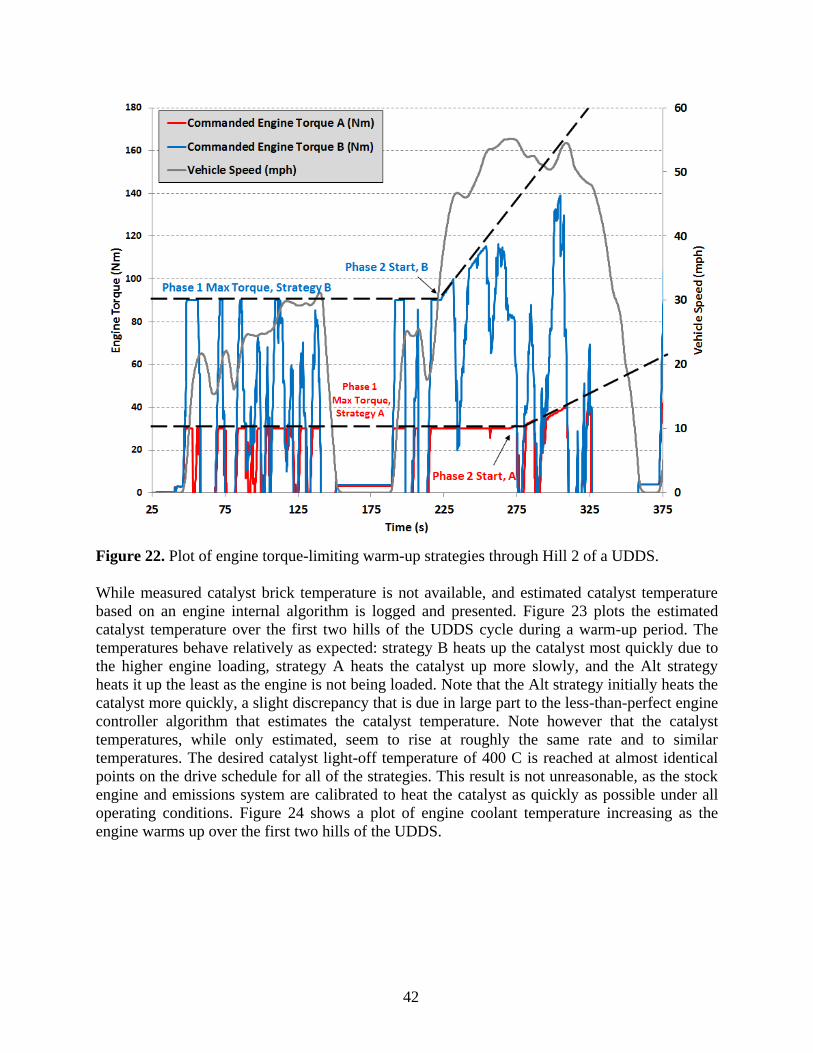
42
Figure 22. Plot of engine torque-limiting warm-up strategies through Hill 2 of a UDDS.
While measured catalyst brick temperature is not available, and estimated catalyst temperature
based on an engine internal algorithm is logged and presented. Figure 23 plots the estimated
catalyst temperature over the first two hills of the UDDS cycle during a warm-up period. The
temperatures behave relatively as expected: strategy B heats up the catalyst most quickly due to
the higher engine loading, strategy A heats the catalyst up more slowly, and the Alt strategy
heats it up the least as the engine is not being loaded. Note that the Alt strategy initially heats the
catalyst more quickly, a slight discrepancy that is due in large part to the less-than-perfect engine
controller algorithm that estimates the catalyst temperature. Note however that the catalyst
temperatures, while only estimated, seem to rise at roughly the same rate and to similar
temperatures. The desired catalyst light-off temperature of 400 C is reached at almost identical
points on the drive schedule for all of the strategies. This result is not unreasonable, as the stock
engine and emissions system are calibrated to heat the catalyst as quickly as possible under all
operating conditions. Figure 24 shows a plot of engine coolant temperature increasing as the
engine warms up over the first two hills of the UDDS.
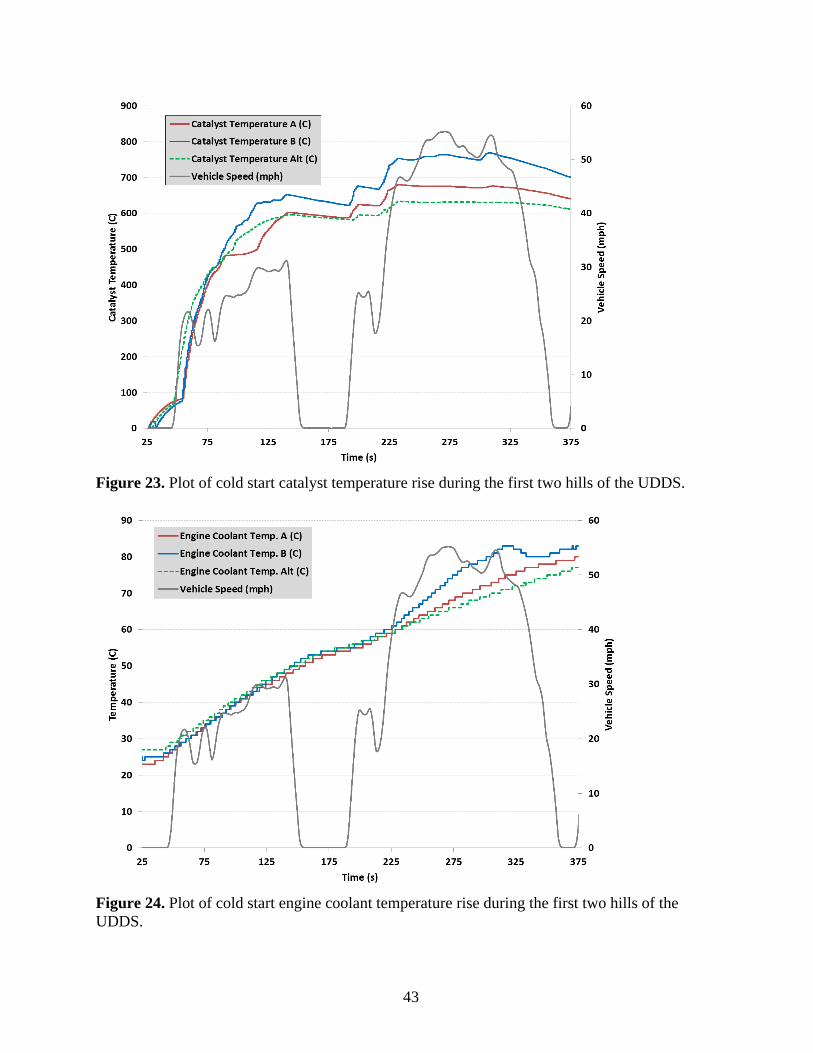
43
Figure 23. Plot of cold start catalyst temperature rise during the first two hills of the UDDS.
Figure 24. Plot of cold start engine coolant temperature rise during the first two hills of the
UDDS.
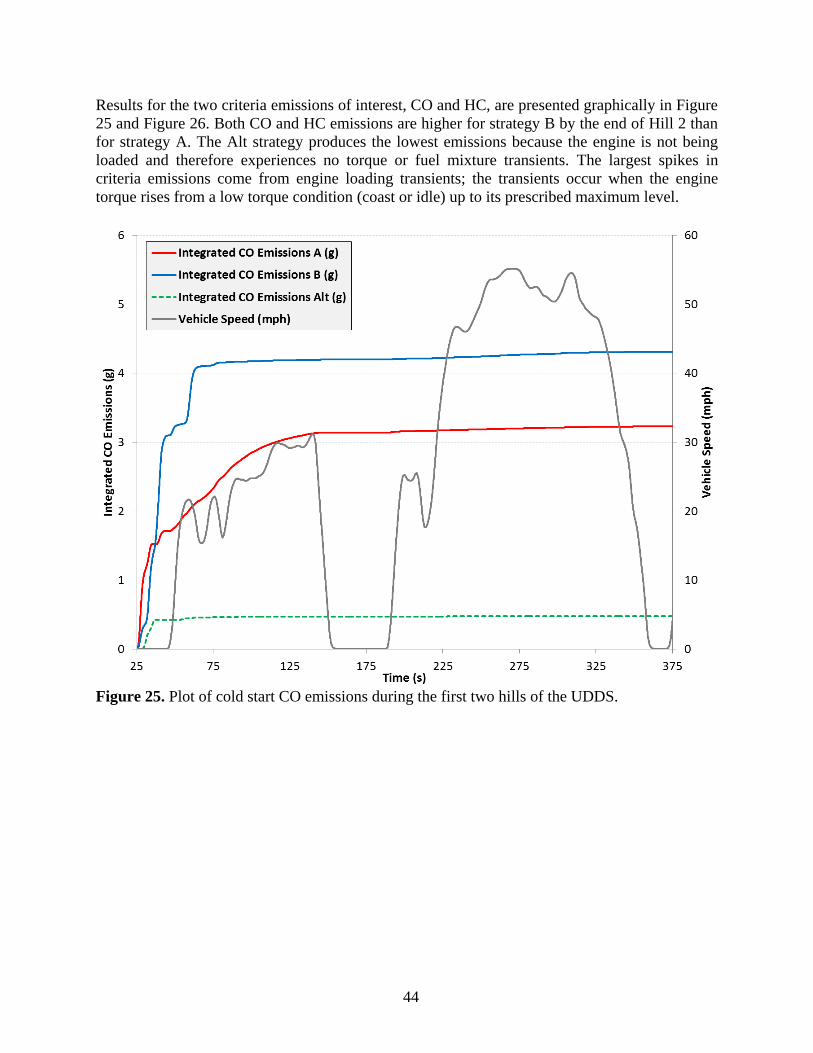
44
Results for the two criteria emissions of interest, CO and HC, are presented graphically in Figure
25 and Figure 26. Both CO and HC emissions are higher for strategy B by the end of Hill 2 than
for strategy A. The Alt strategy produces the lowest emissions because the engine is not being
loaded and therefore experiences no torque or fuel mixture transients. The largest spikes in
criteria emissions come from engine loading transients; the transients occur when the engine
torque rises from a low torque condition (coast or idle) up to its prescribed maximum level.
Figure 25. Plot of cold start CO emissions during the first two hills of the UDDS.

45
Figure 26. Plot of cold start HC emissions during the first two hills of the UDDS.
The CO2 emissions released by the vehicle during warm-up, which are directly related to fuel
consumption, are shown in Figure 27. As with criteria tailpipe emissions, CO2 emissions and
therefore fuel consumption were higher for strategy B due to the higher engine loading
throughout the first two hills. The Alt strategy produced considerably lower CO2 emissions
because the engine was producing no load and using very little fuel. The amount of energy
expended by the engine for propulsion is plotted for each strategy in Figure 28. While the engine
was providing no useful work in the Alt case, strategy A used the engine for some propulsion
while strategy B used considerably more engine power for propulsion. Notice from Figures 25
and 26 previously that neither CO nor HC emissions spike considerably past the first hill of the
UDDS cycle. It is determined that the amount of engine-out energy at the end of hill 1 (for
strategy A, and shortly before for strategy B) is deemed the “catalyst warm” engine-out energy;
Figure 28 shows that this amount of engine out energy is approximately 0.3 MJ, given lighter
engine loading in strategy A.
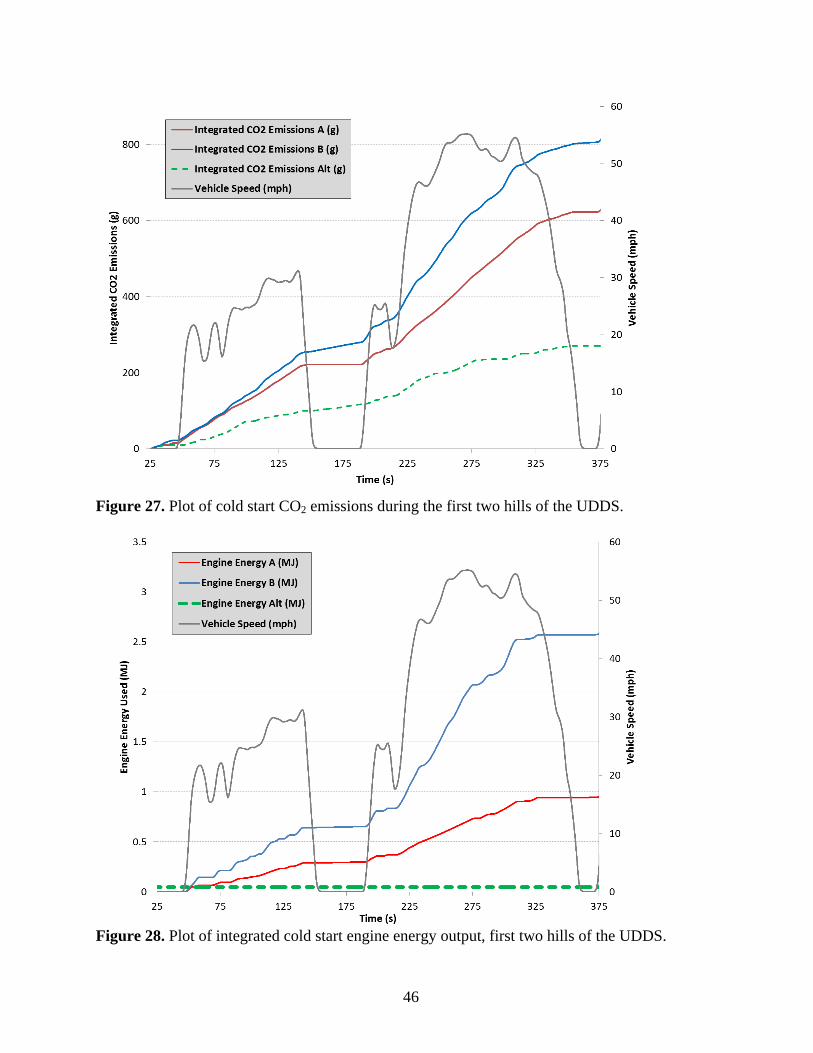
46
Figure 27. Plot of cold start CO2 emissions during the first two hills of the UDDS.
Figure 28. Plot of integrated cold start engine energy output, first two hills of the UDDS.
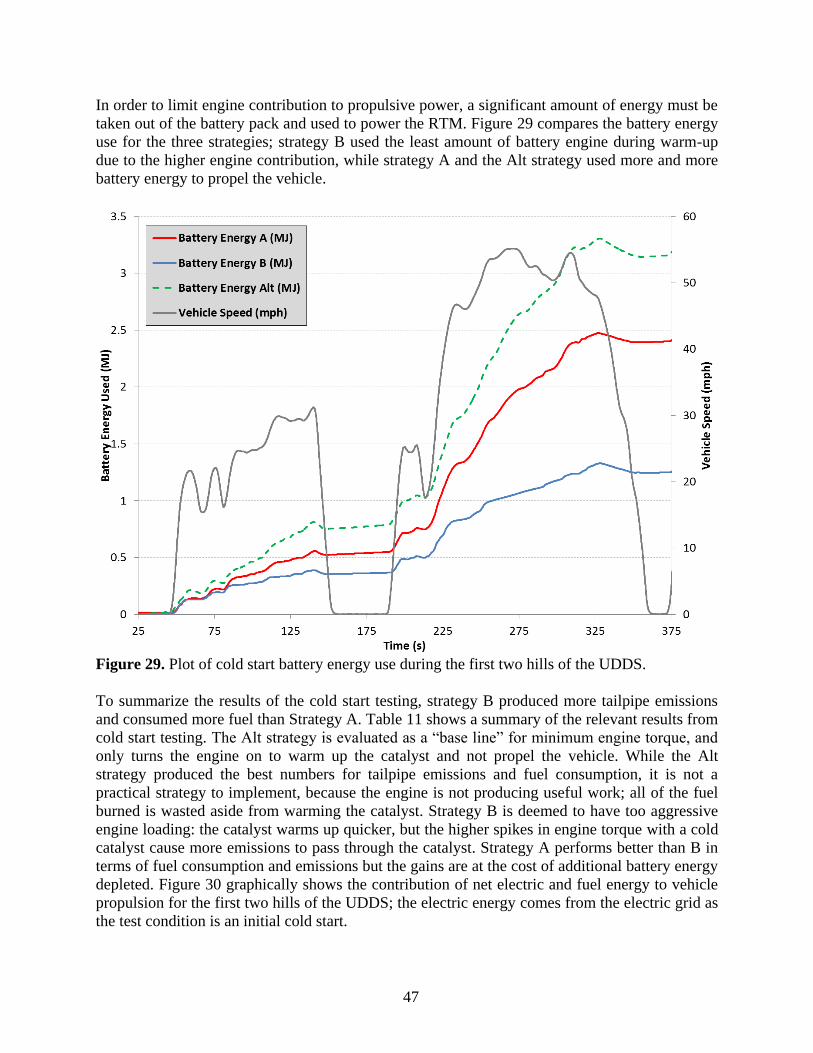
47
In order to limit engine contribution to propulsive power, a significant amount of energy must be
taken out of the battery pack and used to power the RTM. Figure 29 compares the battery energy
use for the three strategies; strategy B used the least amount of battery engine during warm-up
due to the higher engine contribution, while strategy A and the Alt strategy used more and more
battery energy to propel the vehicle.
Figure 29. Plot of cold start battery energy use during the first two hills of the UDDS.
To summarize the results of the cold start testing, strategy B produced more tailpipe emissions
and consumed more fuel than Strategy A. Table 11 shows a summary of the relevant results from
cold start testing. The Alt strategy is evaluated as a “base line” for minimum engine torque, and
only turns the engine on to warm up the catalyst and not propel the vehicle. While the Alt
strategy produced the best numbers for tailpipe emissions and fuel consumption, it is not a
practical strategy to implement, because the engine is not producing useful work; all of the fuel
burned is wasted aside from warming the catalyst. Strategy B is deemed to have too aggressive
engine loading: the catalyst warms up quicker, but the higher spikes in engine torque with a cold
catalyst cause more emissions to pass through the catalyst. Strategy A performs better than B in
terms of fuel consumption and emissions but the gains are at the cost of additional battery energy
depleted. Figure 30 graphically shows the contribution of net electric and fuel energy to vehicle
propulsion for the first two hills of the UDDS; the electric energy comes from the electric grid as
the test condition is an initial cold start.
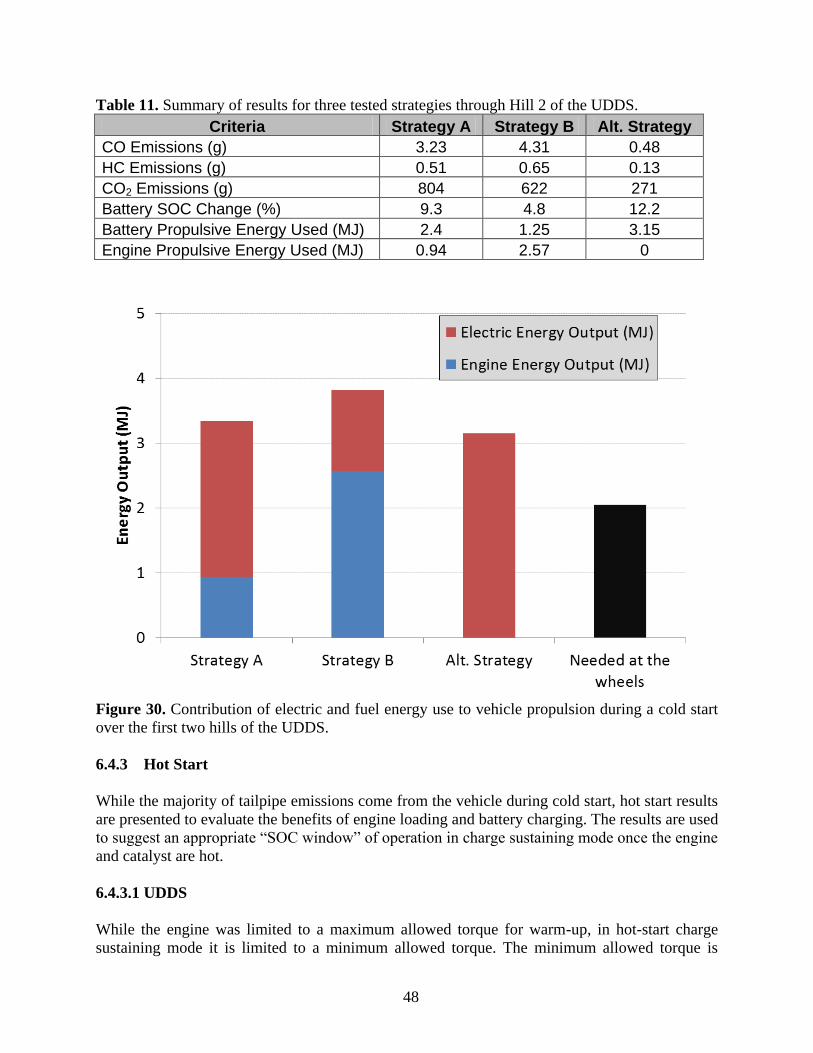
48
Table 11. Summary of results for three tested strategies through Hill 2 of the UDDS.
Criteria Strategy A Strategy B Alt. Strategy
CO Emissions (g) 3.23 4.31 0.48
HC Emissions (g) 0.51 0.65 0.13
CO2 Emissions (g) 804 622 271
Battery SOC Change (%) 9.3 4.8 12.2
Battery Propulsive Energy Used (MJ) 2.4 1.25 3.15
Engine Propulsive Energy Used (MJ) 0.94 2.57 0
Figure 30. Contribution of electric and fuel energy use to vehicle propulsion during a cold start
over the first two hills of the UDDS.
6.4.3 Hot Start
While the majority of tailpipe emissions come from the vehicle during cold start, hot start results
are presented to evaluate the benefits of engine loading and battery charging. The results are used
to suggest an appropriate “SOC window” of operation in charge sustaining mode once the engine
and catalyst are hot.
6.4.3.1 UDDS
While the engine was limited to a maximum allowed torque for warm-up, in hot-start charge
sustaining mode it is limited to a minimum allowed torque. The minimum allowed torque is
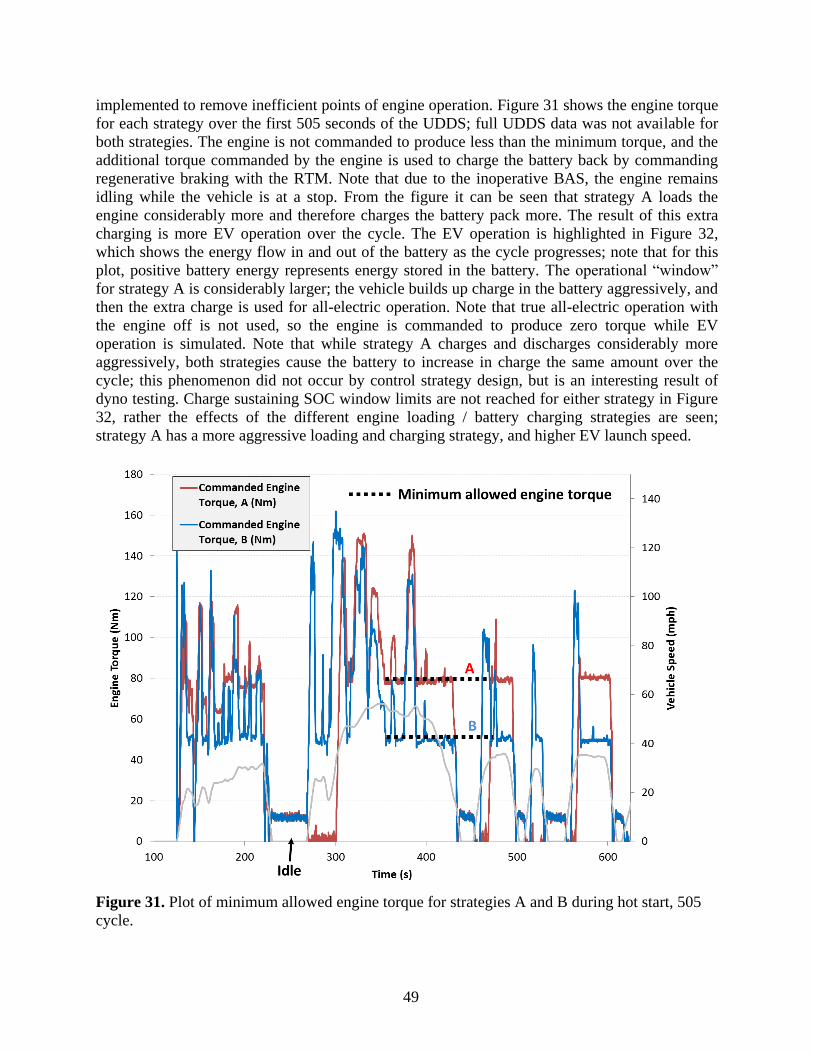
49
implemented to remove inefficient points of engine operation. Figure 31 shows the engine torque
for each strategy over the first 505 seconds of the UDDS; full UDDS data was not available for
both strategies. The engine is not commanded to produce less than the minimum torque, and the
additional torque commanded by the engine is used to charge the battery back by commanding
regenerative braking with the RTM. Note that due to the inoperative BAS, the engine remains
idling while the vehicle is at a stop. From the figure it can be seen that strategy A loads the
engine considerably more and therefore charges the battery pack more. The result of this extra
charging is more EV operation over the cycle. The EV operation is highlighted in Figure 32,
which shows the energy flow in and out of the battery as the cycle progresses; note that for this
plot, positive battery energy represents energy stored in the battery. The operational “window”
for strategy A is considerably larger; the vehicle builds up charge in the battery aggressively, and
then the extra charge is used for all-electric operation. Note that true all-electric operation with
the engine off is not used, so the engine is commanded to produce zero torque while EV
operation is simulated. Note that while strategy A charges and discharges considerably more
aggressively, both strategies cause the battery to increase in charge the same amount over the
cycle; this phenomenon did not occur by control strategy design, but is an interesting result of
dyno testing. Charge sustaining SOC window limits are not reached for either strategy in Figure
32, rather the effects of the different engine loading / battery charging strategies are seen;
strategy A has a more aggressive loading and charging strategy, and higher EV launch speed.
Figure 31. Plot of minimum allowed engine torque for strategies A and B during hot start, 505
cycle.
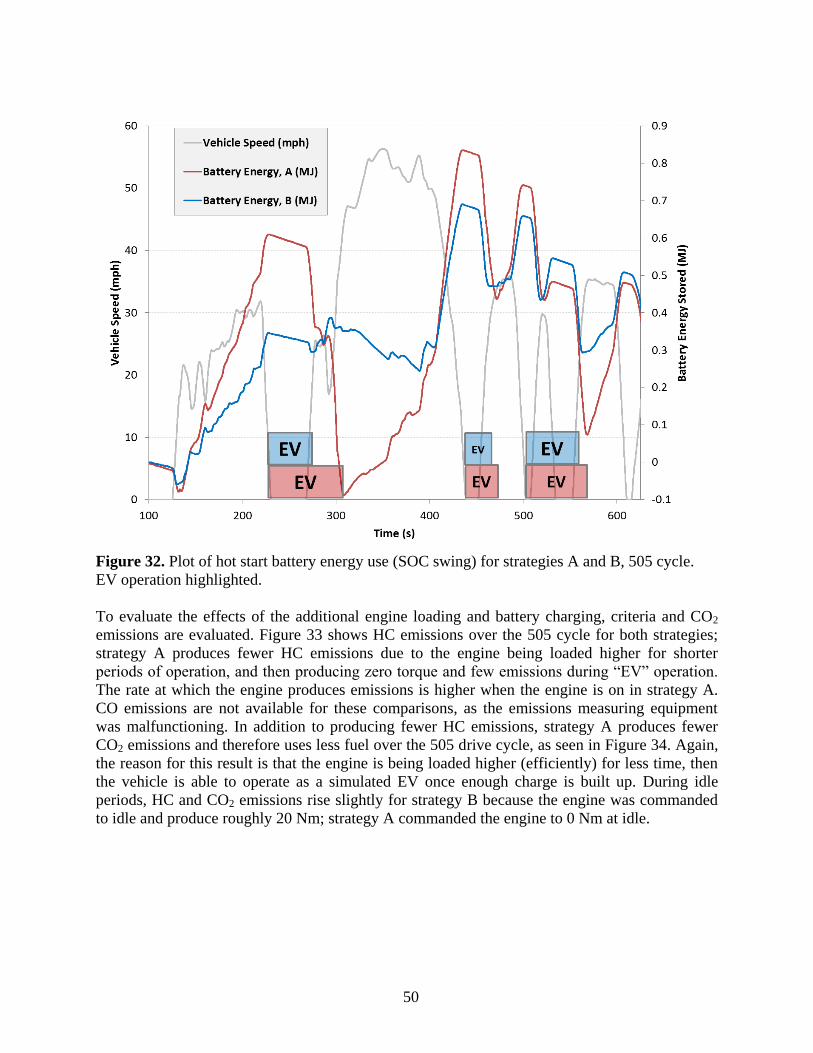
50
Figure 32. Plot of hot start battery energy use (SOC swing) for strategies A and B, 505 cycle.
EV operation highlighted.
To evaluate the effects of the additional engine loading and battery charging, criteria and CO2
emissions are evaluated. Figure 33 shows HC emissions over the 505 cycle for both strategies;
strategy A produces fewer HC emissions due to the engine being loaded higher for shorter
periods of operation, and then producing zero torque and few emissions during “EV” operation.
The rate at which the engine produces emissions is higher when the engine is on in strategy A.
CO emissions are not available for these comparisons, as the emissions measuring equipment
was malfunctioning. In addition to producing fewer HC emissions, strategy A produces fewer
CO2 emissions and therefore uses less fuel over the 505 drive cycle, as seen in Figure 34. Again,
the reason for this result is that the engine is being loaded higher (efficiently) for less time, then
the vehicle is able to operate as a simulated EV once enough charge is built up. During idle
periods, HC and CO2 emissions rise slightly for strategy B because the engine was commanded
to idle and produce roughly 20 Nm; strategy A commanded the engine to 0 Nm at idle.
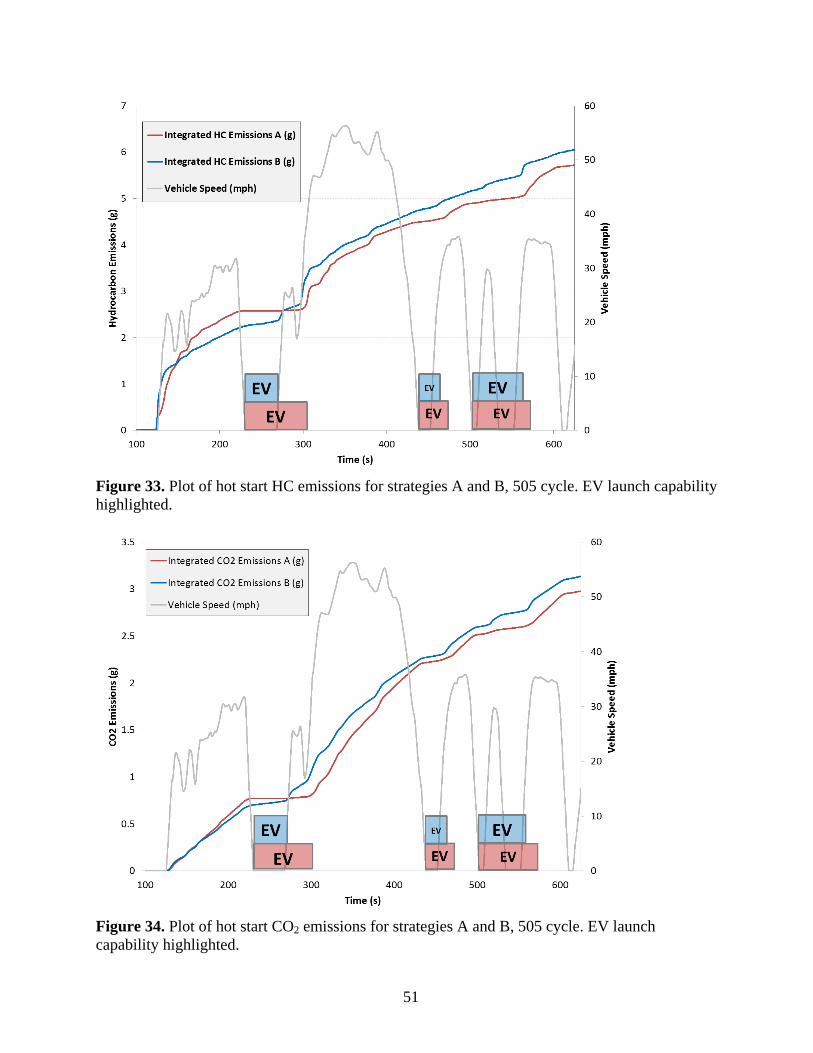
51
Figure 33. Plot of hot start HC emissions for strategies A and B, 505 cycle. EV launch capability
highlighted.
Figure 34. Plot of hot start CO2 emissions for strategies A and B, 505 cycle. EV launch
capability highlighted.
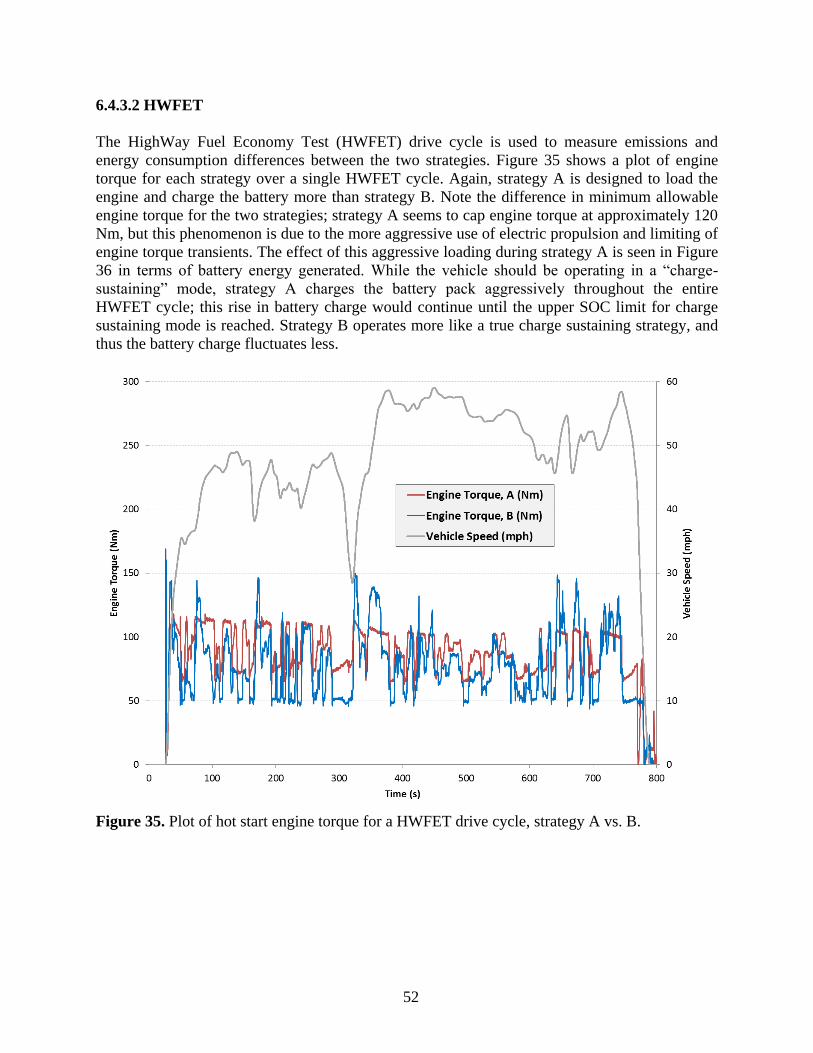
52
6.4.3.2 HWFET
The HighWay Fuel Economy Test (HWFET) drive cycle is used to measure emissions and
energy consumption differences between the two strategies. Figure 35 shows a plot of engine
torque for each strategy over a single HWFET cycle. Again, strategy A is designed to load the
engine and charge the battery more than strategy B. Note the difference in minimum allowable
engine torque for the two strategies; strategy A seems to cap engine torque at approximately 120
Nm, but this phenomenon is due to the more aggressive use of electric propulsion and limiting of
engine torque transients. The effect of this aggressive loading during strategy A is seen in Figure
36 in terms of battery energy generated. While the vehicle should be operating in a “charge-
sustaining” mode, strategy A charges the battery pack aggressively throughout the entire
HWFET cycle; this rise in battery charge would continue until the upper SOC limit for charge
sustaining mode is reached. Strategy B operates more like a true charge sustaining strategy, and
thus the battery charge fluctuates less.
Figure 35. Plot of hot start engine torque for a HWFET drive cycle, strategy A vs. B.
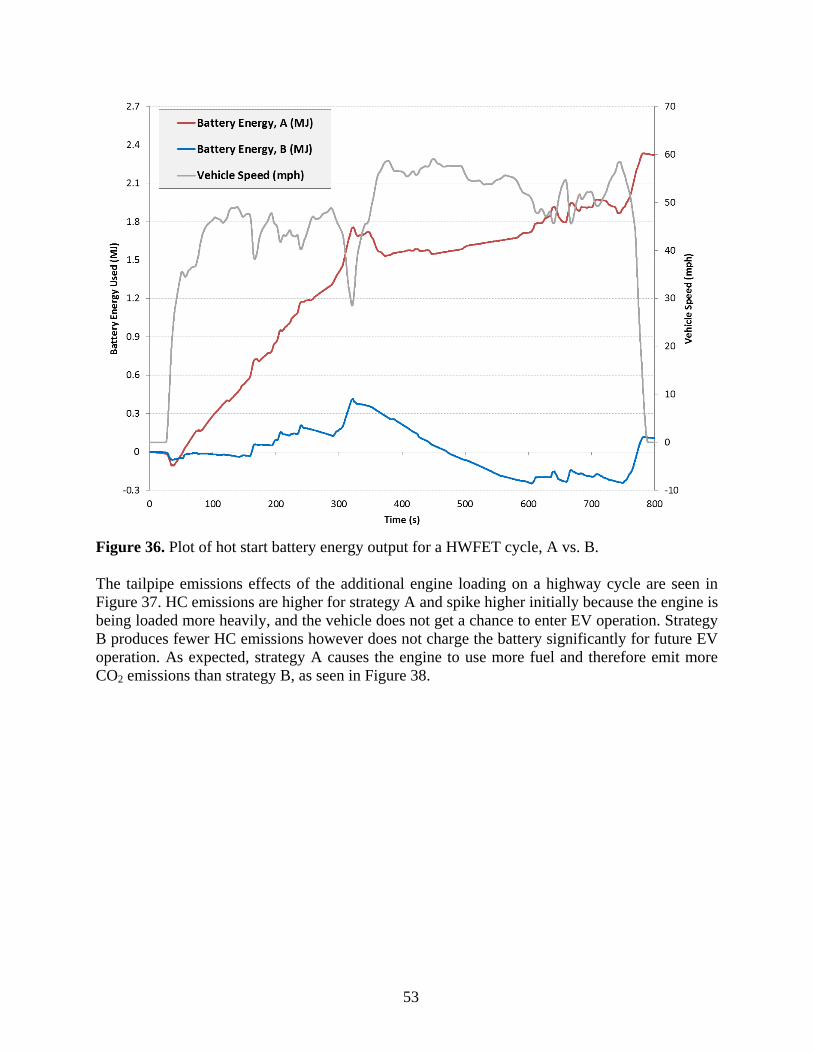
53
Figure 36. Plot of hot start battery energy output for a HWFET cycle, A vs. B.
The tailpipe emissions effects of the additional engine loading on a highway cycle are seen in
Figure 37. HC emissions are higher for strategy A and spike higher initially because the engine is
being loaded more heavily, and the vehicle does not get a chance to enter EV operation. Strategy
B produces fewer HC emissions however does not charge the battery significantly for future EV
operation. As expected, strategy A causes the engine to use more fuel and therefore emit more
CO2 emissions than strategy B, as seen in Figure 38.
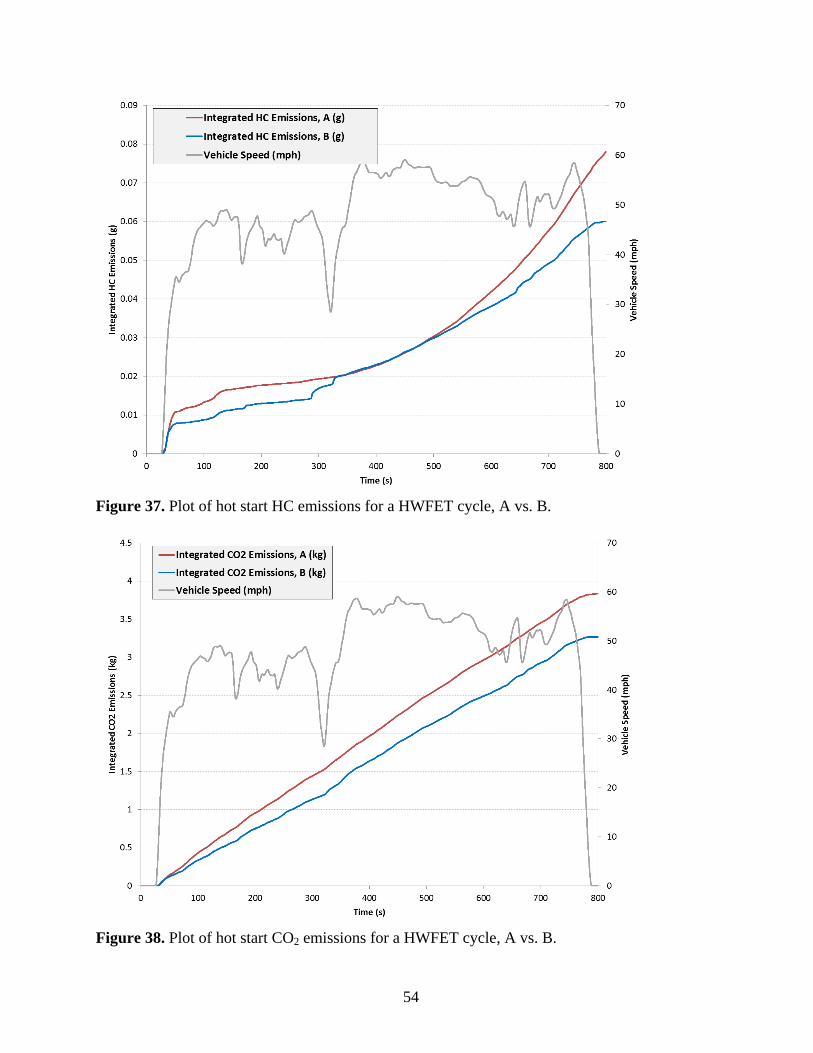
54
Figure 37. Plot of hot start HC emissions for a HWFET cycle, A vs. B.
Figure 38. Plot of hot start CO2 emissions for a HWFET cycle, A vs. B.

55
6.4.4 BAS Engine Starts
Additional dynamometer testing was available, therefore an additional set of tests that were not
on the original test plan were performed. These tests were designed to evaluate emissions and
energy consumption caused by BAS engine starts at various vehicle speeds. Results are
presented for specific tests designed to characterize emissions spikes and energy consumption
caused by engine idle stop followed by BAS engine starts.
6.4.4.1 Tailpipe Emissions Spikes
BAS engine start data shows that considerable emissions spikes occurred during BAS starts at all
vehicle speeds tested. Note that the BAS start strategy remained the same throughout all tests and
is not calibrated. Figure 39 shows HC, CO and NOx emissions spikes for each of the 10 test
cases, ranging in vehicle speed from less than 5 kph to over 50 kph; the apparent sudden spikes
in vehicle speed are due to the BAS emitting considerable electromagnetic interference (EMI)
during an engine start attempt, and causing the data recorded from the CAN buses to become
momentarily garbled. Figure 40 shows a zoomed-in view of the first three BAS starts. Note the
large spike in engine RPM during the start, which is due to the aggressive engine starting
strategy, which at the time of testing had not been calibrated for drivability or emissions. Note
that because the engine controller could not realize it was running on E85 (causing a severe lean
burn condition), the NOx emissions spikes are much more severe than normal; actual values of
the NOx emissions spikes should not be evaluated, but rather the comparison of NOx emissions
between cases.
Figure 39. Plot of tailpipe emissions spikes for all BAS start tests.
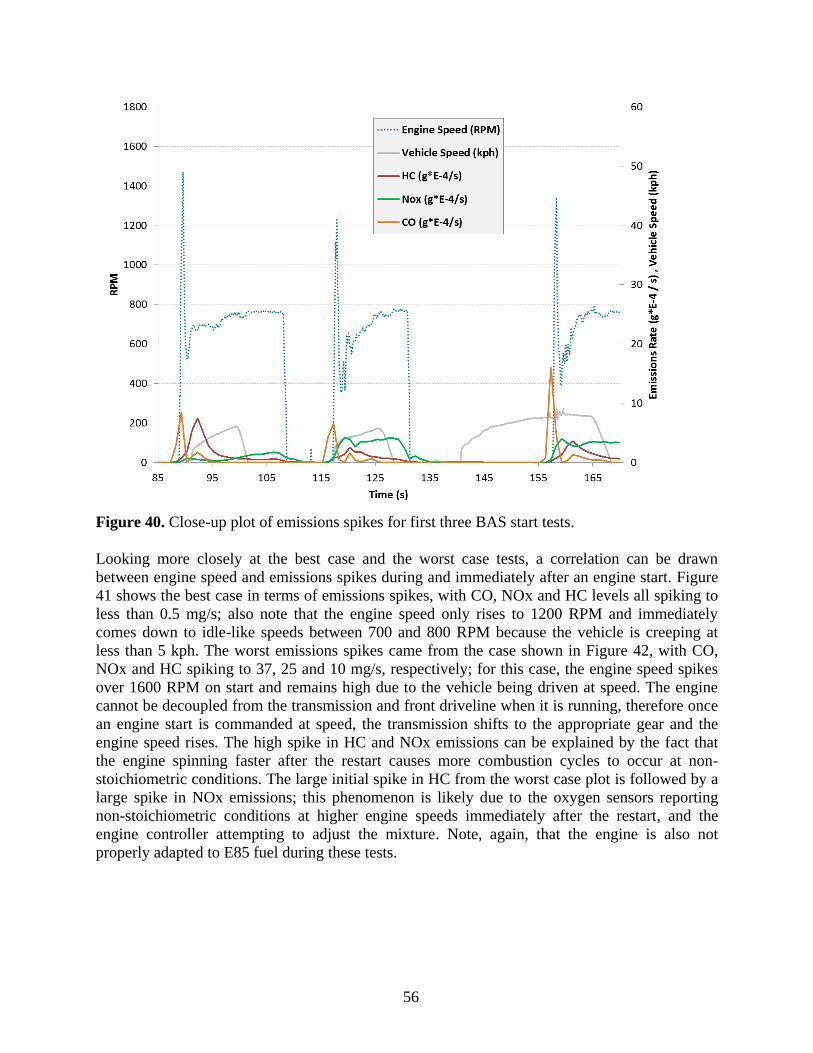
56
Figure 40. Close-up plot of emissions spikes for first three BAS start tests.
Looking more closely at the best case and the worst case tests, a correlation can be drawn
between engine speed and emissions spikes during and immediately after an engine start. Figure
41 shows the best case in terms of emissions spikes, with CO, NOx and HC levels all spiking to
less than 0.5 mg/s; also note that the engine speed only rises to 1200 RPM and immediately
comes down to idle-like speeds between 700 and 800 RPM because the vehicle is creeping at
less than 5 kph. The worst emissions spikes came from the case shown in Figure 42, with CO,
NOx and HC spiking to 37, 25 and 10 mg/s, respectively; for this case, the engine speed spikes
over 1600 RPM on start and remains high due to the vehicle being driven at speed. The engine
cannot be decoupled from the transmission and front driveline when it is running, therefore once
an engine start is commanded at speed, the transmission shifts to the appropriate gear and the
engine speed rises. The high spike in HC and NOx emissions can be explained by the fact that
the engine spinning faster after the restart causes more combustion cycles to occur at non-
stoichiometric conditions. The large initial spike in HC from the worst case plot is followed by a
large spike in NOx emissions; this phenomenon is likely due to the oxygen sensors reporting
non-stoichiometric conditions at higher engine speeds immediately after the restart, and the
engine controller attempting to adjust the mixture. Note, again, that the engine is also not
properly adapted to E85 fuel during these tests.
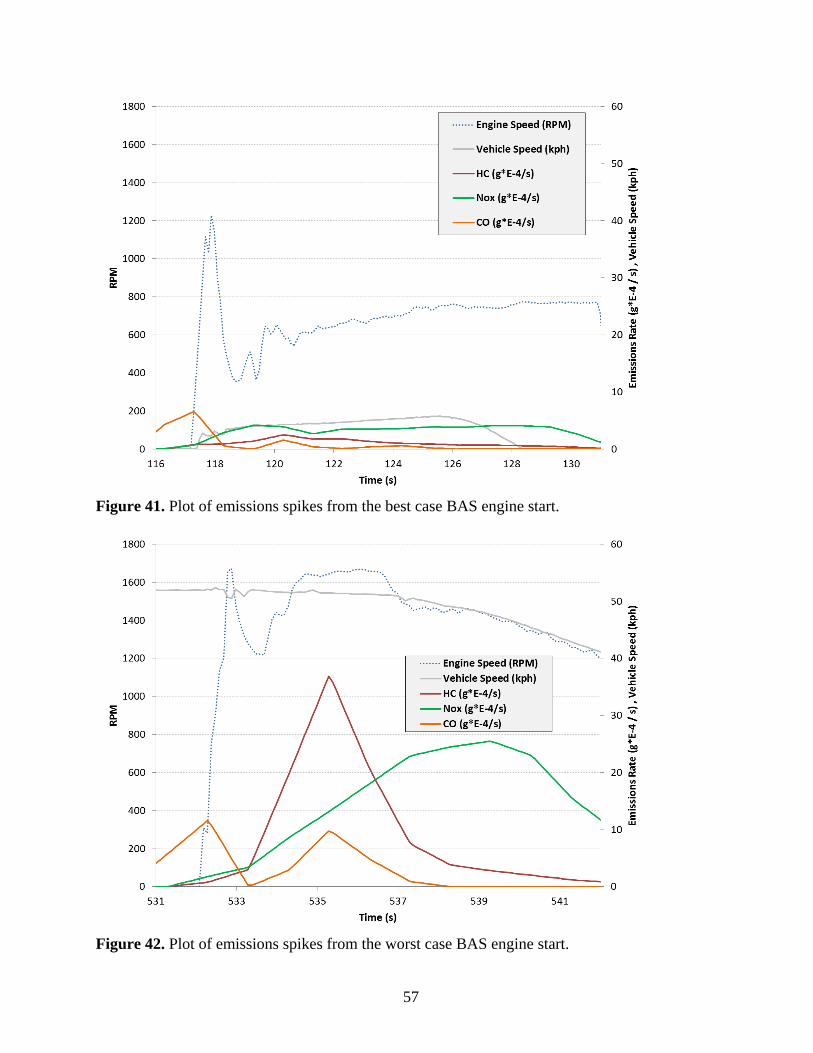
57
Figure 41. Plot of emissions spikes from the best case BAS engine start.
Figure 42. Plot of emissions spikes from the worst case BAS engine start.
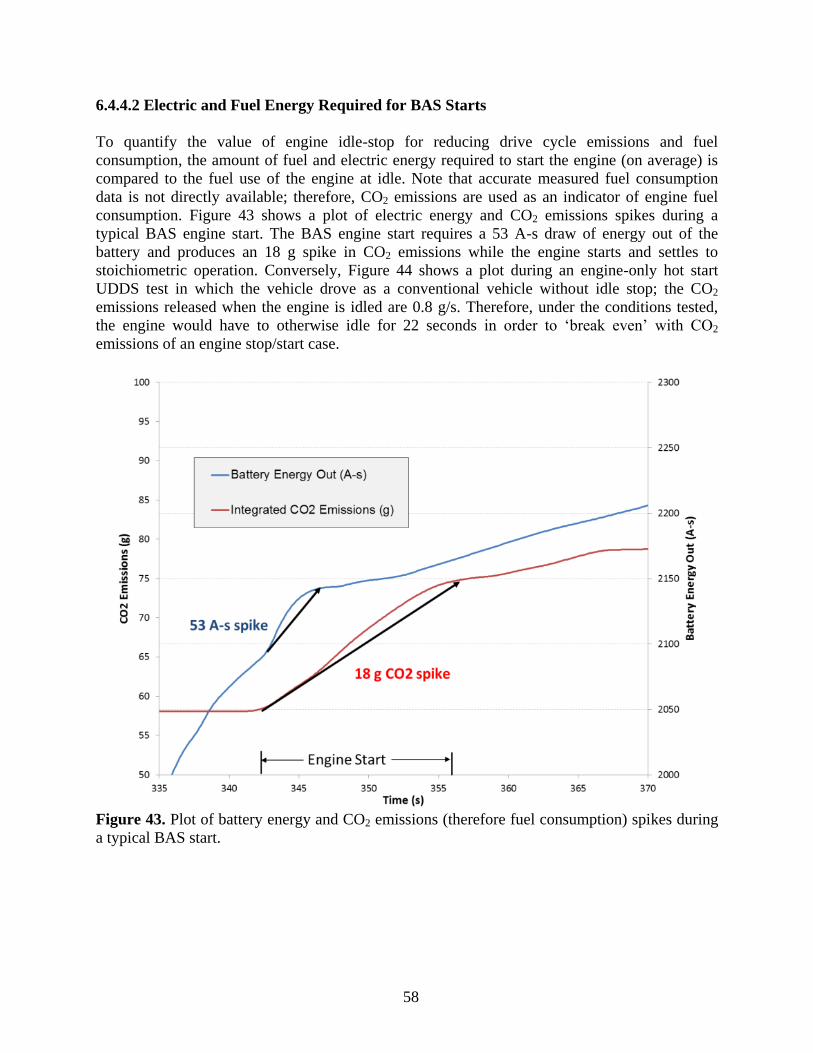
58
6.4.4.2 Electric and Fuel Energy Required for BAS Starts
To quantify the value of engine idle-stop for reducing drive cycle emissions and fuel
consumption, the amount of fuel and electric energy required to start the engine (on average) is
compared to the fuel use of the engine at idle. Note that accurate measured fuel consumption
data is not directly available; therefore, CO2 emissions are used as an indicator of engine fuel
consumption. Figure 43 shows a plot of electric energy and CO2 emissions spikes during a
typical BAS engine start. The BAS engine start requires a 53 A-s draw of energy out of the
battery and produces an 18 g spike in CO2 emissions while the engine starts and settles to
stoichiometric operation. Conversely, Figure 44 shows a plot during an engine-only hot start
UDDS test in which the vehicle drove as a conventional vehicle without idle stop; the CO2
emissions released when the engine is idled are 0.8 g/s. Therefore, under the conditions tested,
the engine would have to otherwise idle for 22 seconds in order to „break even‟ with CO2
emissions of an engine stop/start case.
Figure 43. Plot of battery energy and CO2 emissions (therefore fuel consumption) spikes during
a typical BAS start.
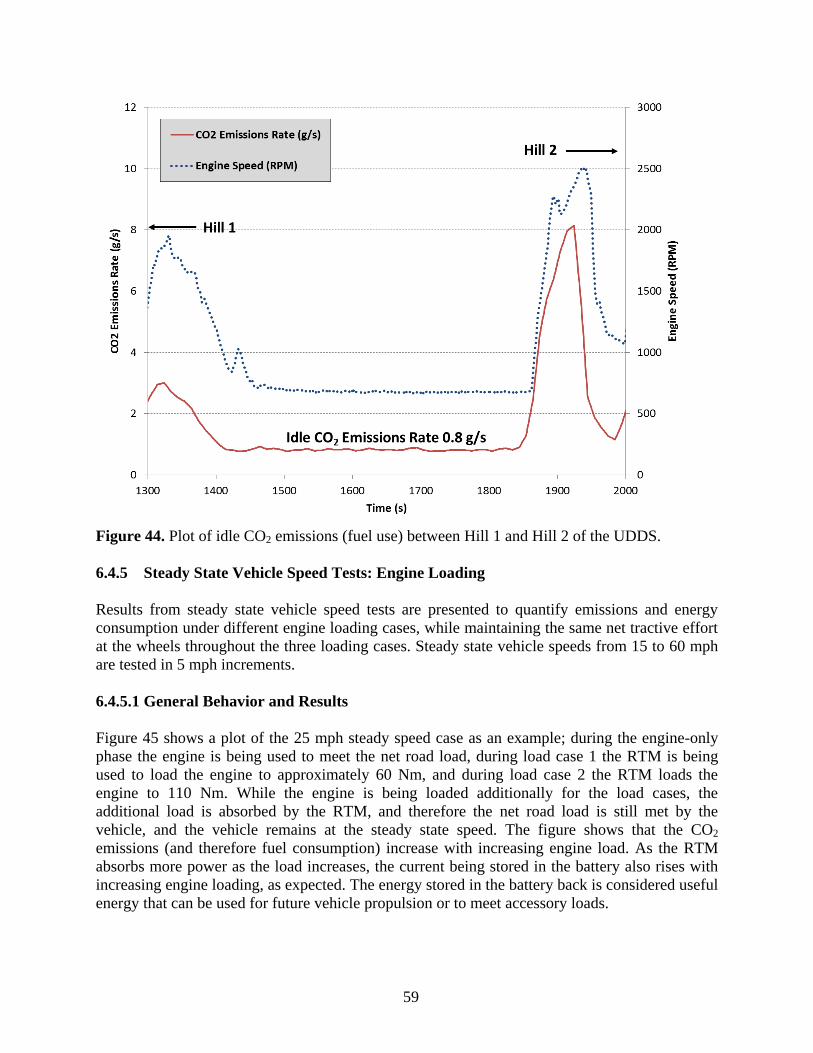
59
Figure 44. Plot of idle CO2 emissions (fuel use) between Hill 1 and Hill 2 of the UDDS.
6.4.5 Steady State Vehicle Speed Tests: Engine Loading
Results from steady state vehicle speed tests are presented to quantify emissions and energy
consumption under different engine loading cases, while maintaining the same net tractive effort
at the wheels throughout the three loading cases. Steady state vehicle speeds from 15 to 60 mph
are tested in 5 mph increments.
6.4.5.1 General Behavior and Results
Figure 45 shows a plot of the 25 mph steady speed case as an example; during the engine-only
phase the engine is being used to meet the net road load, during load case 1 the RTM is being
used to load the engine to approximately 60 Nm, and during load case 2 the RTM loads the
engine to 110 Nm. While the engine is being loaded additionally for the load cases, the
additional load is absorbed by the RTM, and therefore the net road load is still met by the
vehicle, and the vehicle remains at the steady state speed. The figure shows that the CO2
emissions (and therefore fuel consumption) increase with increasing engine load. As the RTM
absorbs more power as the load increases, the current being stored in the battery also rises with
increasing engine loading, as expected. The energy stored in the battery back is considered useful
energy that can be used for future vehicle propulsion or to meet accessory loads.
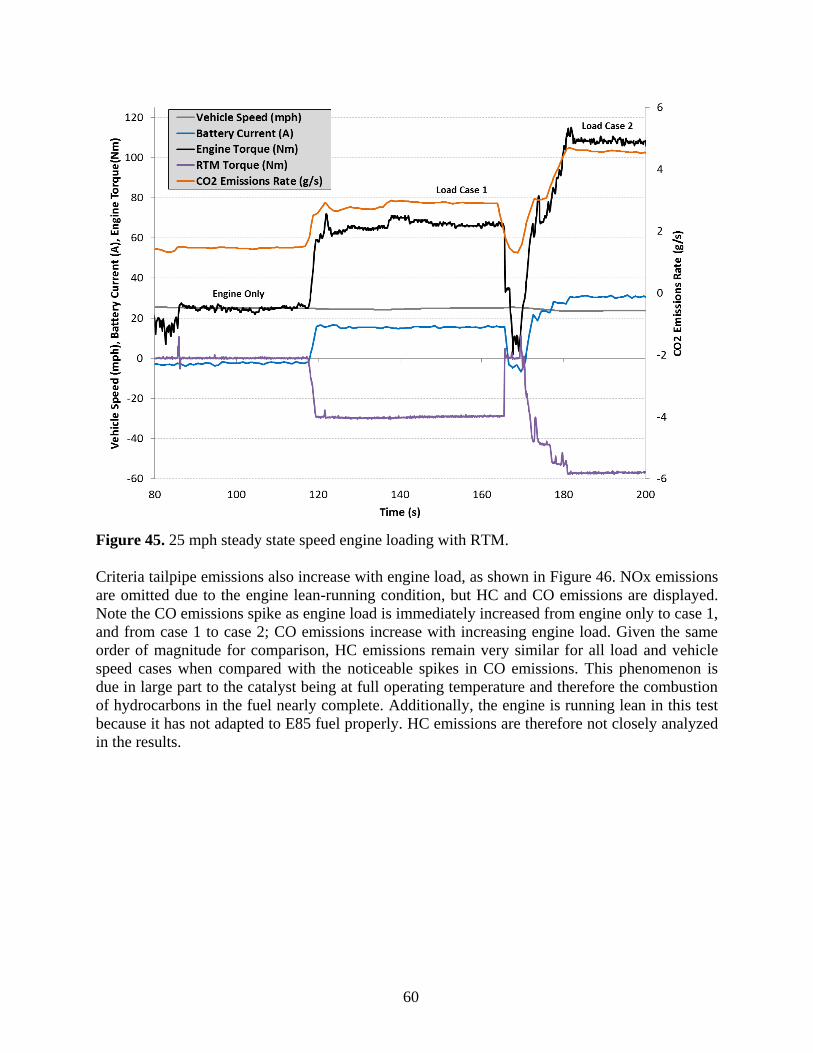
60
Figure 45. 25 mph steady state speed engine loading with RTM.
Criteria tailpipe emissions also increase with engine load, as shown in Figure 46. NOx emissions
are omitted due to the engine lean-running condition, but HC and CO emissions are displayed.
Note the CO emissions spike as engine load is immediately increased from engine only to case 1,
and from case 1 to case 2; CO emissions increase with increasing engine load. Given the same
order of magnitude for comparison, HC emissions remain very similar for all load and vehicle
speed cases when compared with the noticeable spikes in CO emissions. This phenomenon is
due in large part to the catalyst being at full operating temperature and therefore the combustion
of hydrocarbons in the fuel nearly complete. Additionally, the engine is running lean in this test
because it has not adapted to E85 fuel properly. HC emissions are therefore not closely analyzed
in the results.
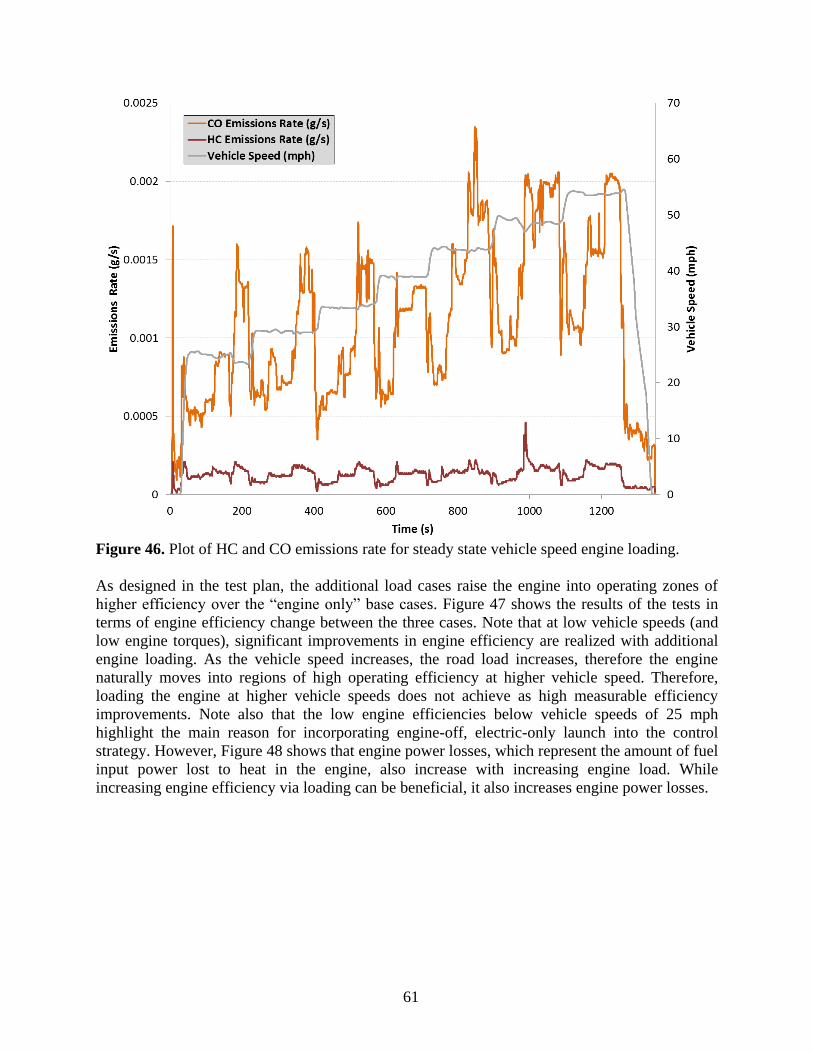
61
Figure 46. Plot of HC and CO emissions rate for steady state vehicle speed engine loading.
As designed in the test plan, the additional load cases raise the engine into operating zones of
higher efficiency over the “engine only” base cases. Figure 47 shows the results of the tests in
terms of engine efficiency change between the three cases. Note that at low vehicle speeds (and
low engine torques), significant improvements in engine efficiency are realized with additional
engine loading. As the vehicle speed increases, the road load increases, therefore the engine
naturally moves into regions of high operating efficiency at higher vehicle speed. Therefore,
loading the engine at higher vehicle speeds does not achieve as high measurable efficiency
improvements. Note also that the low engine efficiencies below vehicle speeds of 25 mph
highlight the main reason for incorporating engine-off, electric-only launch into the control
strategy. However, Figure 48 shows that engine power losses, which represent the amount of fuel
input power lost to heat in the engine, also increase with increasing engine load. While
increasing engine efficiency via loading can be beneficial, it also increases engine power losses.
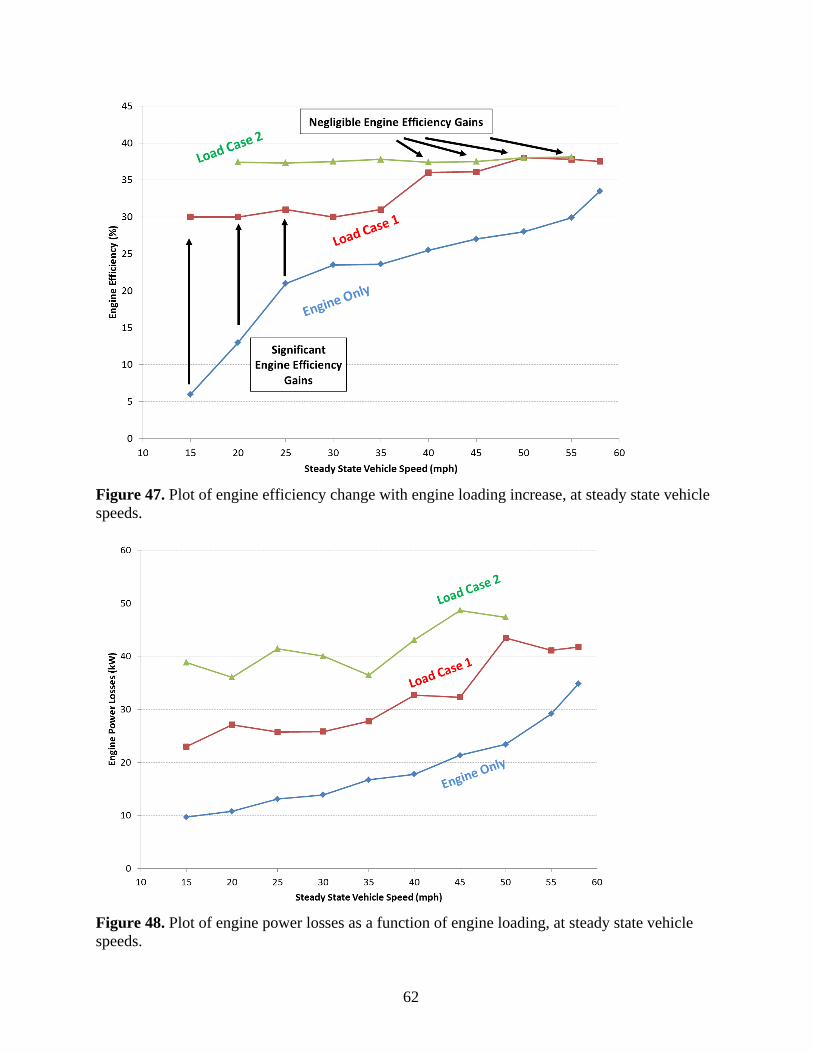
62
Figure 47. Plot of engine efficiency change with engine loading increase, at steady state vehicle
speeds.
Figure 48. Plot of engine power losses as a function of engine loading, at steady state vehicle
speeds.
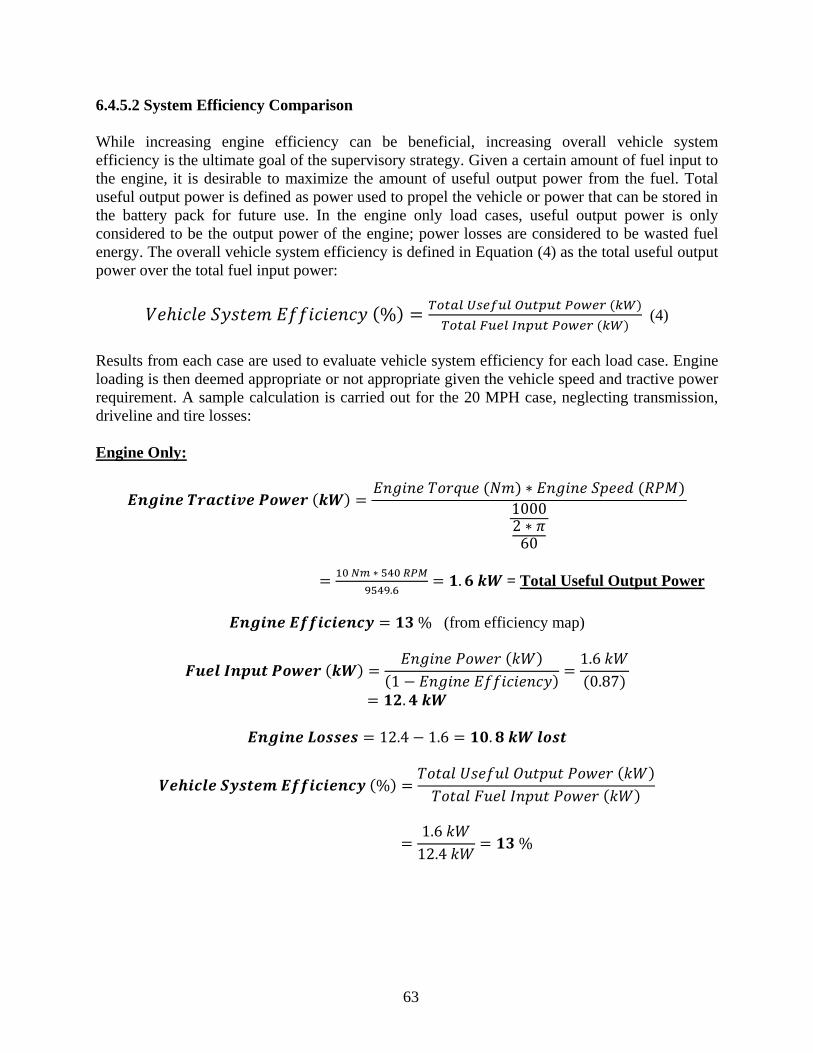
63
6.4.5.2 System Efficiency Comparison
While increasing engine efficiency can be beneficial, increasing overall vehicle system
efficiency is the ultimate goal of the supervisory strategy. Given a certain amount of fuel input to
the engine, it is desirable to maximize the amount of useful output power from the fuel. Total
useful output power is defined as power used to propel the vehicle or power that can be stored in
the battery pack for future use. In the engine only load cases, useful output power is only
considered to be the output power of the engine; power losses are considered to be wasted fuel
energy. The overall vehicle system efficiency is defined in Equation (4) as the total useful output
power over the total fuel input power:
(4)
Results from each case are used to evaluate vehicle system efficiency for each load case. Engine
loading is then deemed appropriate or not appropriate given the vehicle speed and tractive power
requirement. A sample calculation is carried out for the 20 MPH case, neglecting transmission,
driveline and tire losses:
Engine Only:
2
= Total Useful Output Power
(from efficiency map)
2
2
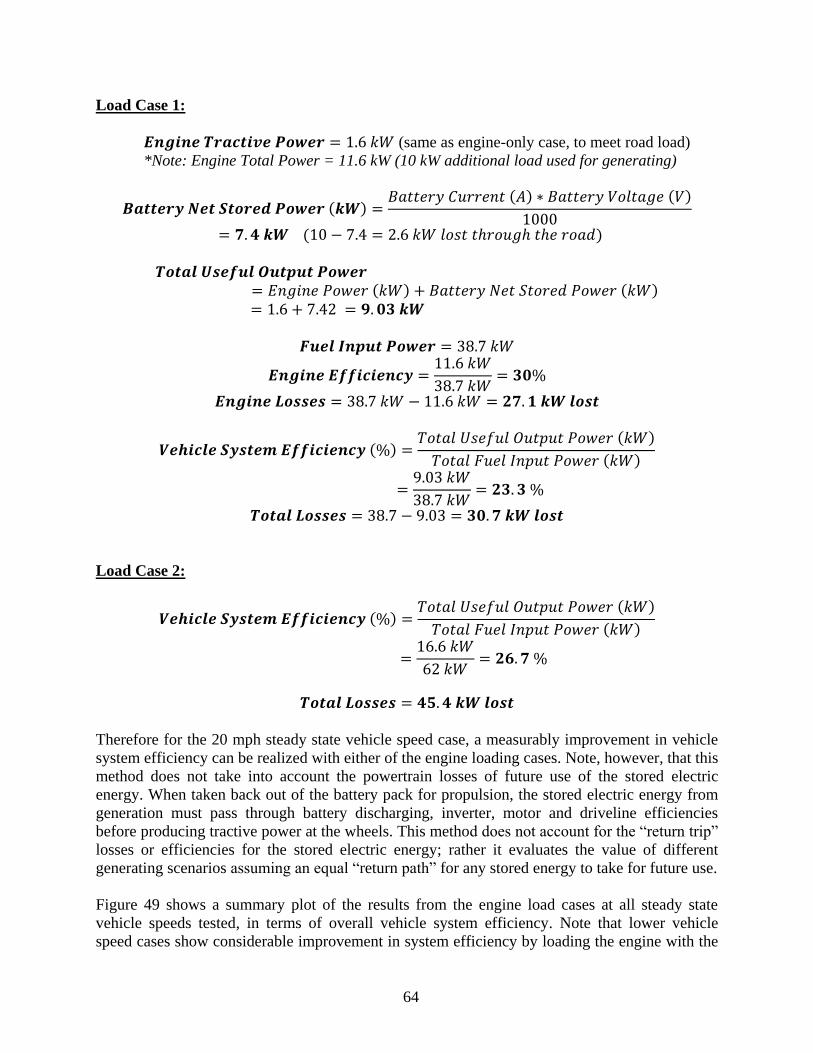
64
Load Case 1:
(same as engine-only case, to meet road load)
*Note: Engine Total Power = 11.6 kW (10 kW additional load used for generating)
2
+
+ 2
Load Case 2:
2
Therefore for the 20 mph steady state vehicle speed case, a measurably improvement in vehicle
system efficiency can be realized with either of the engine loading cases. Note, however, that this
method does not take into account the powertrain losses of future use of the stored electric
energy. When taken back out of the battery pack for propulsion, the stored electric energy from
generation must pass through battery discharging, inverter, motor and driveline efficiencies
before producing tractive power at the wheels. This method does not account for the “return trip”
losses or efficiencies for the stored electric energy; rather it evaluates the value of different
generating scenarios assuming an equal “return path” for any stored energy to take for future use.
Figure 49 shows a summary plot of the results from the engine load cases at all steady state
vehicle speeds tested, in terms of overall vehicle system efficiency. Note that lower vehicle
speed cases show considerable improvement in system efficiency by loading the engine with the
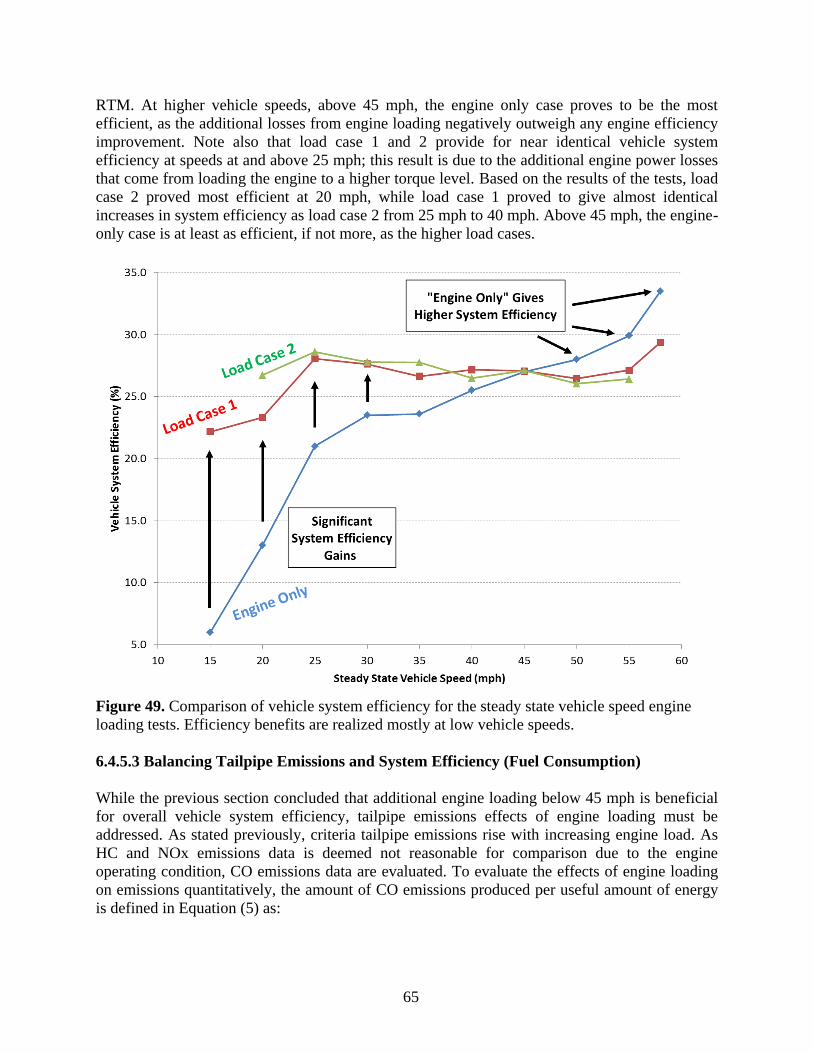
65
RTM. At higher vehicle speeds, above 45 mph, the engine only case proves to be the most
efficient, as the additional losses from engine loading negatively outweigh any engine efficiency
improvement. Note also that load case 1 and 2 provide for near identical vehicle system
efficiency at speeds at and above 25 mph; this result is due to the additional engine power losses
that come from loading the engine to a higher torque level. Based on the results of the tests, load
case 2 proved most efficient at 20 mph, while load case 1 proved to give almost identical
increases in system efficiency as load case 2 from 25 mph to 40 mph. Above 45 mph, the engine-
only case is at least as efficient, if not more, as the higher load cases.
Figure 49. Comparison of vehicle system efficiency for the steady state vehicle speed engine
loading tests. Efficiency benefits are realized mostly at low vehicle speeds.
6.4.5.3 Balancing Tailpipe Emissions and System Efficiency (Fuel Consumption)
While the previous section concluded that additional engine loading below 45 mph is beneficial
for overall vehicle system efficiency, tailpipe emissions effects of engine loading must be
addressed. As stated previously, criteria tailpipe emissions rise with increasing engine load. As
HC and NOx emissions data is deemed not reasonable for comparison due to the engine
operating condition, CO emissions data are evaluated. To evaluate the effects of engine loading
on emissions quantitatively, the amount of CO emissions produced per useful amount of energy
is defined in Equation (5) as:
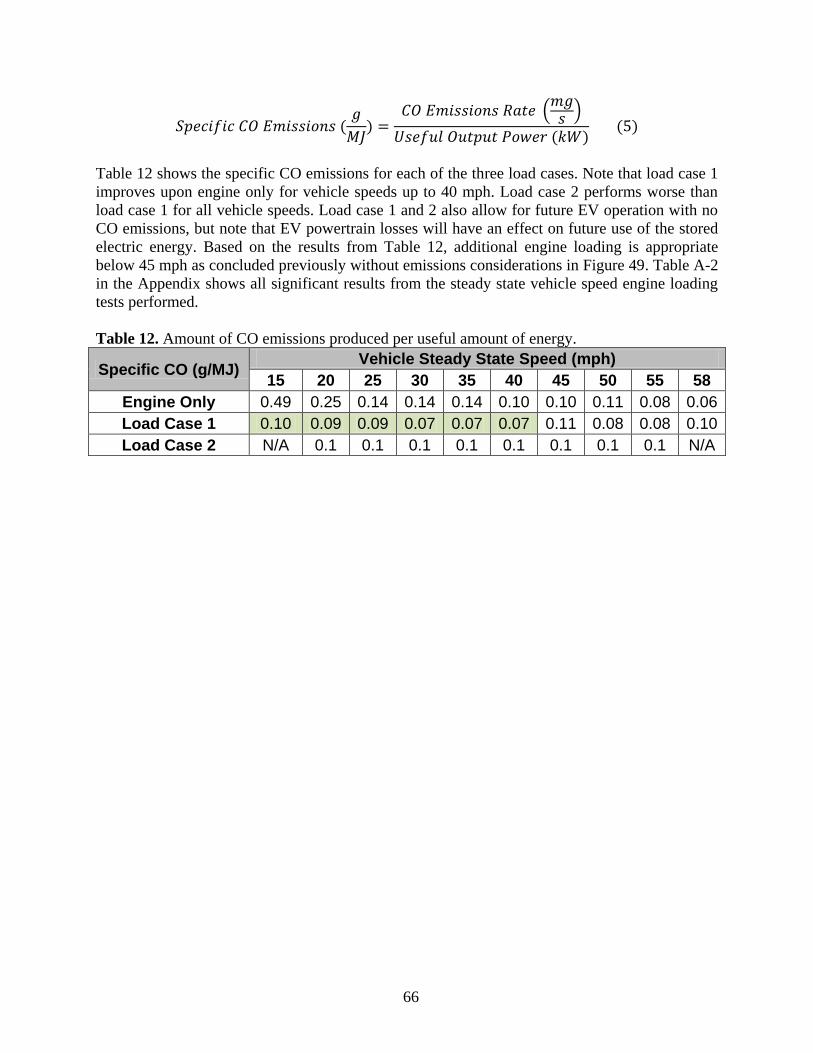
66
(
)
Table 12 shows the specific CO emissions for each of the three load cases. Note that load case 1
improves upon engine only for vehicle speeds up to 40 mph. Load case 2 performs worse than
load case 1 for all vehicle speeds. Load case 1 and 2 also allow for future EV operation with no
CO emissions, but note that EV powertrain losses will have an effect on future use of the stored
electric energy. Based on the results from Table 12, additional engine loading is appropriate
below 45 mph as concluded previously without emissions considerations in Figure 49. Table A-2
in the Appendix shows all significant results from the steady state vehicle speed engine loading
tests performed.
Table 12. Amount of CO emissions produced per useful amount of energy.
Specific CO (g/MJ) Vehicle Steady State Speed (mph)
15 20 25 30 35 40 45 50 55 58
Engine Only 0.49 0.25 0.14 0.14 0.14 0.10 0.10 0.11 0.08 0.06
Load Case 1 0.10 0.09 0.09 0.07 0.07 0.07 0.11 0.08 0.08 0.10
Load Case 2 N/A 0.1 0.1 0.1 0.1 0.1 0.1 0.1 0.1 N/A
67
7. CONCLUSIONS
Now that the emissions and energy consumption data for the modes of operation are measured
and analyzed, modifications are made to the SPA E-REV control strategy which specifically
target reduced fuel consumption and criteria tailpipe emissions.
7.1 Cold Start Control Strategy Modifications
Based on the data analysis performed from dynamometer testing, a warm-up strategy that is less
aggressive with engine loading warms up the catalyst quickly while not letting too many
emissions pass through the catalyst. Strategy A performed the best of the “usable” strategies
tested both in terms of fuel consumption and criteria emissions, but noticeable spikes in
emissions resulted from engine loading transients; the Alt strategy is not considered, as the fuel
consumed during warm-up is wasted. Therefore, as almost universally concluded in the
literature, a warm-up strategy is implemented that commands a steady and light load on the
engine while the catalyst warms up. The engine is commanded to idle when the vehicle is at rest
unless the battery SOC is low, in which case a functional BAS would be used to lightly load the
engine and charge the battery while the engine is near idle speed. The tested energy values for
engine-out energy (3 MJ, 3.5 MJ) are deemed unnecessarily large for strategies A and B due to
the catalyst warming up considerably quicker than predicted; therefore an engine-out energy
value of 0.3 MJ (based on light engine loading) is selected to be the amount of energy at which
point the catalyst is hot. While the engine loading transients from strategy A caused emissions
spikes, the maximum torque level of 30 Nm proved to give good results for both emissions and
fuel consumption. However, the commanded steady torque level is increased to 40 Nm in the
final control strategy to heat the catalyst more quickly without increasing cold-start emissions
significantly.
7.2 Hot Start Control Strategy Modifications
Based on the data analysis performed from dynamometer testing, the engine-hot control strategy
is chosen to behave similar to strategy B under highway conditions (high speed, high engine
load) and in between the two strategies for city conditions (low speed, low engine load). Strategy
B behaved more closely like a true charge-sustaining hybrid and did not continually charge the
battery as strategy A did, proving beneficial for high load conditions where the engine would
ordinarily have a reasonably high load and therefore additional engine loading is not necessary.
Under city operating conditions, low-speed and low engine load, more engine loading and
battery charging is desirable; the additional energy stored in the battery pack can be used for
future electric operation. Recalling the results from steady state vehicle speed engine loading, an
engine torque of 60 Nm provided for approximately 30 % engine efficiency, which is deemed the
minimum allowable level for both. Electric launch maximum speed is set to 25 mph to account
for the additional stored battery energy over strategy B (20 mph EV launch speed) in city
driving. Therefore, above 25 mph when the engine is on, if the engine would otherwise be
operated below 60 Nm, the RTM loads it to 60 Nm and stores the additional electric energy in
the battery pack. Engine torque transients are limited to 35 Nm/sec, as the additional amount of
electric energy required to limit engine transients in this way is deemed insignificant given the
large energy capacity of the battery pack; significant reductions in tailpipe emissions (from
68
transient A/F ratios) and fuel consumption (from enrichment) can be realized from limiting
engine torque transients as seen in the hot start emissions data.
7.3 BAS Engine Start Strategy Modifications
Based on the BAS engine start data, the control strategy is modified to reduce the aggressiveness
of the BAS starts. Considerable emissions spikes result from aggressive BAS starts where engine
speed spikes well above 1000 RPM. Therefore, the starting strategy is modified to start the
engine more gently and use the negative torque capability of the BAS to prevent the engine from
speeding over 1000 RPM during an engine start. As the electric launch speed has been set to 25
mph, which corresponds to an engine speed of 1300 RPM in second gear, the engine will be
commanded to start around 1000 RPM and then it will rise to 1300 RPM as the engine flywheel
speed and transmission torque converter speed become approximately equal. Additionally, the
strategy is modified to prevent immediate loading of the engine after an engine start to prevent
tailpipe emissions that result from non-stoichiometric engine loading conditions. To prevent the
engine from spinning too fast during an engine start, the highest available gear is commanded
during the engine start to keep engine speed low. Based on the BAS engine start strategy tested
on the dynamometer, engine idle-stop would not be useful for the E&EC event at EcoCAR
competition, as 22 seconds of otherwise “engine idle” time would be necessary for a BAS engine
start to be worth the start fuel and emissions. However, given the control strategy modifications,
the revised BAS start strategy is implemented in the vehicle for competition, thus enabling
engine idle-stop.
7.4 Final Conclusions and Future Work
This paper presents a control strategy for a SPA E-REV for balancing fuel and energy
consumption with criteria tailpipe emissions. The literature review gives a background of hybrid
and PHEV publications about emissions, fuel consumption and control, and without the SPA E-
REV addressed, there is a need for this paper. The SPA E-REV architecture and components are
explained in detail since the analysis in this paper is directly related to the performance of the
components used on the vehicle. Following the architecture introduction, the SPA E-REV modes
of operation are defined, including charge depleting and charge sustaining modes. The operating
modes alone do not take into consideration transitions between modes or tailpipe emissions
directly. An introduction to catalytic air pollution control in automobiles is presented, along with
theoretical opportunities for emissions reduction using hybrid supervisory control in the SPA E-
REV. Dynamometer testing results are presented for two different control strategies, A and B,
which take into account both cold start and hot start operation. BAS engine start testing and
steady state vehicle speed engine load testing results are presented to show the opportunities for
control strategy improvement. Finally, suggestions are made to further improve the control
strategy to maintain low criteria tailpipe emissions simultaneously with low fuel and electric
energy consumption. Table 13 revisits the key parametric differences between strategies A and B
in comparison to the final parameters for the strategy.
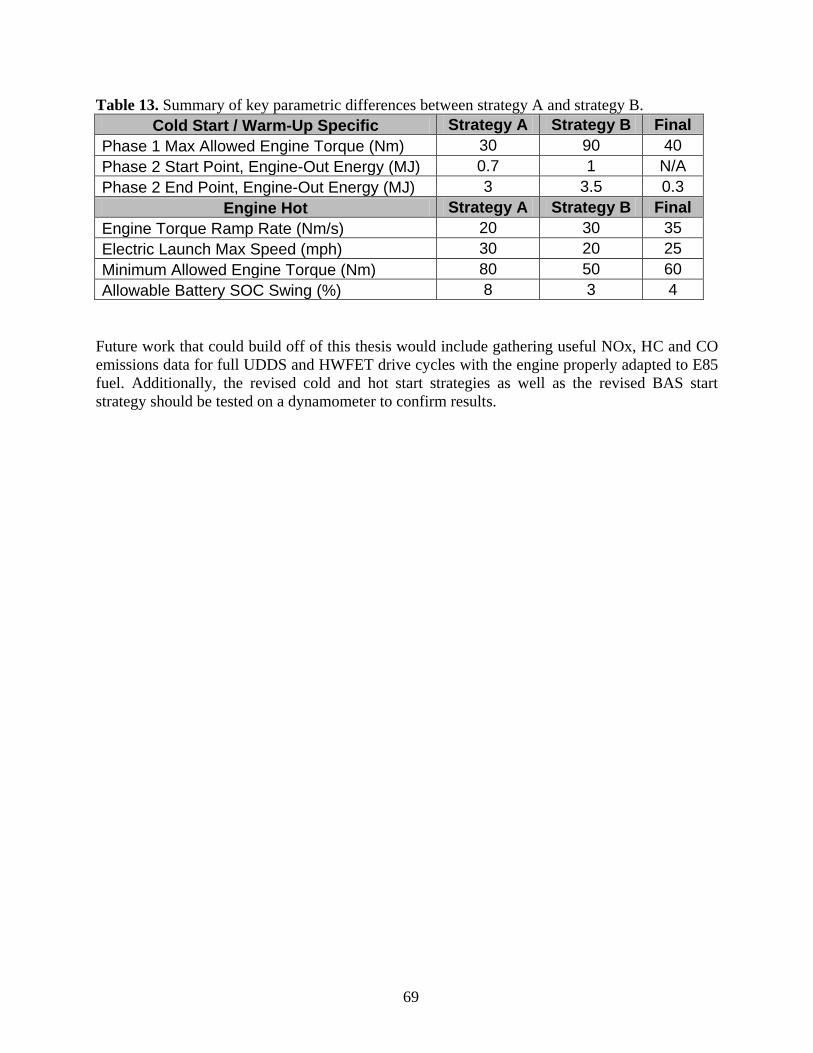
69
Table 13. Summary of key parametric differences between strategy A and strategy B.
Cold Start / Warm-Up Specific Strategy A Strategy B Final
Phase 1 Max Allowed Engine Torque (Nm) 30 90 40
Phase 2 Start Point, Engine-Out Energy (MJ) 0.7 1 N/A
Phase 2 End Point, Engine-Out Energy (MJ) 3 3.5 0.3
Engine Hot Strategy A Strategy B Final
Engine Torque Ramp Rate (Nm/s) 20 30 35
Electric Launch Max Speed (mph) 30 20 25
Minimum Allowed Engine Torque (Nm) 80 50 60
Allowable Battery SOC Swing (%) 8 3 4
Future work that could build off of this thesis would include gathering useful NOx, HC and CO
emissions data for full UDDS and HWFET drive cycles with the engine properly adapted to E85
fuel. Additionally, the revised cold and hot start strategies as well as the revised BAS start
strategy should be tested on a dynamometer to confirm results.
70
REFERENCES
1. “Transportation Sector Energy Consumption.” U.S. Energy Information Administration
Monthly Energy Review. June 2010, http://www.eia.doe.gov/emeu/mer/pdf/pages/sec2_11.pdf
2. Solomon, S., et al. “Technical Summary in Climate Change 2007: The Physical Science Basis.
Contribution of Working Group I to the Fourth Assessment Report of the Intergovernmental
Panel on Climate Change.” Cambridge University Press, Cambridge, United Kingdom and New
York, NY, USA. 2007.
3. MacKay, D. “Sustainable Energy – without the hot air.” UIT Cambridge Ltd., Cambridge,
United Kingdom. 2009.
4. “Six Common Air Pollutants,” U.S. Environmental Protection Agency, April 5, 2011,
http://www.epa.gov/oaqps001/urbanair/
5. Kiss, B. and Nelson, D., “Vehicle Emissions and Fuel Standards Past Present and Future,”
(presentation), 2009.
6. Boyd, S. and Nelson, D., “Hybrid Electric Vehicle Control Strategy Based on Power Loss
Calculations,” SAE paper no. 2008-01-0084, 2008.
7. Smith, D., Lohse-Busch, H., and Irick, D., “A Preliminary Investigation into the Mitigation of
Plug-in Hybrid Electric Vehicle Tailpipe Emissions Through Supervisory Control Methods,”
SAE paper no. 2010-01-1266, 2010.
8. The California Low-Emission Vehicle Regulations for Passenger Cars, Light-Duty Trucks and
Medium-Duty Vehicles, including all or portions of Sections 1900, 1956.8, 1960.1, 1960.5,
1961, 1961.1, 1962, 1962.1, 1962.2, 1965, 1976, 1978, 2062, and 2101, title 13, California Code
of Regulations, California Air Resources Board, 2010,
http://www.arb.ca.gov/msprog/levprog/cleandoc/cleancomplete_lev-ghg_regs_12-10.pdf
9. Yu, S., Dong, G., and Li, L., “Transient Characteristics of Emissions During Engine Start/Stop
Operating Employing a Conventional Gasoline Engine for HEV Application,” International
Journal of Automotive Technology, Vol. 9, No. 5, pp. 543-549, 2008.
10. Tagaki, N., et al, “Development of Exhaust and Evaporative Emissions Systems for Toyota
THS II Plug-in Hybrid Electric Vehicle,” SAE paper no. 2010-01-0831, 2010.
11. Li, L., et al, “Characteristics of Three-way Catalyst during Quickly Start-up Process in a PFI
Engine for HEV Application,” SAE paper no. 2009-01-1325, 2009.
12. Muta, K., Yamazaki, M., and Tokieda, J., “Development of New-Generation Hybrid System
THS II - Dras–ic Improvement of Power Performance and Fuel Economy,” SAE paper no. 2004-
01-0064, 2004.
71
13. Powertrain Systems Analysis Toolkit (PSAT), Argonne National Laboratory,
http://www.transportation.anl.gov/modeling_simulation/PSAT/index.html
14. Gantt, L., Walsh, P., Nelson, D., “Design and Development Process for a Range Extended
Split Parallel Hybrid Electric Vehicle,” IDETC 2010, Montreal, Quebec, Canada, ASME paper
no. DETC2010-28576, 2010.
15. “The Greenhouse Gases, Regulated Emissions, and Energy Use in Transportation (GREET)
Model,” Argonne National Laboratory, 2010.
16. Brinkman, T., Weber, M., Wang, T., Darlington, “Well-to-Wheels Analysis of Advanced
Fuel/Vehicle Systems - A North American Study of Energy Use, Greenhouse Gas Emissions,
and Criteria Pollutant Emissions.” Argonne National Laboratory, 2005.
17. Draft EcoCAR Challenge Rules, available from Argonne National Laboratory, draft
04/01/2010.
18. SAE J1711, Jun 2010, Recommended Practice for Measuring the Exhaust Emissions and
Fuel Economy of Hybrid-Electric Vehicles, Including Plug-in Hybrid Vehicles.
19. Carlson, R., et al, “Testing and Analysis of Three Plug-in Hybrid Electric Vehicles,” SAE
paper no. 2007-01-0283, 2007.
20. Gao, Y., et al, “Investigation into the Effectiveness of Regenerative Braking for EV and
HEV,” SAE paper no. 1999-01-2910, 1999.
21. Sovran, G., “The Impact of Regenerative Braking on the Powertrain-Delivered Energy
Required for Propulsion,” SAE paper no. 2011-01-0891, 2011.
22. Clean Air Act, United States Code, Title 42, Chapter 85, 2008,
http://www.gpo.gov/fdsys/pkg/USCODE-2008-title42/pdf/USCODE-2008-title42-chap85.pdf
23. “Federal Test Procedure Revisions,” U.S. Environmental Protection Agency, 2011,
http://www.epa.gov/oms/sftp.htm
24. Heck, R., et al, “Catalytic Air Pollution Control,” John Wiley & Sons, Inc., Hoboken, New
Jersey, 2009.
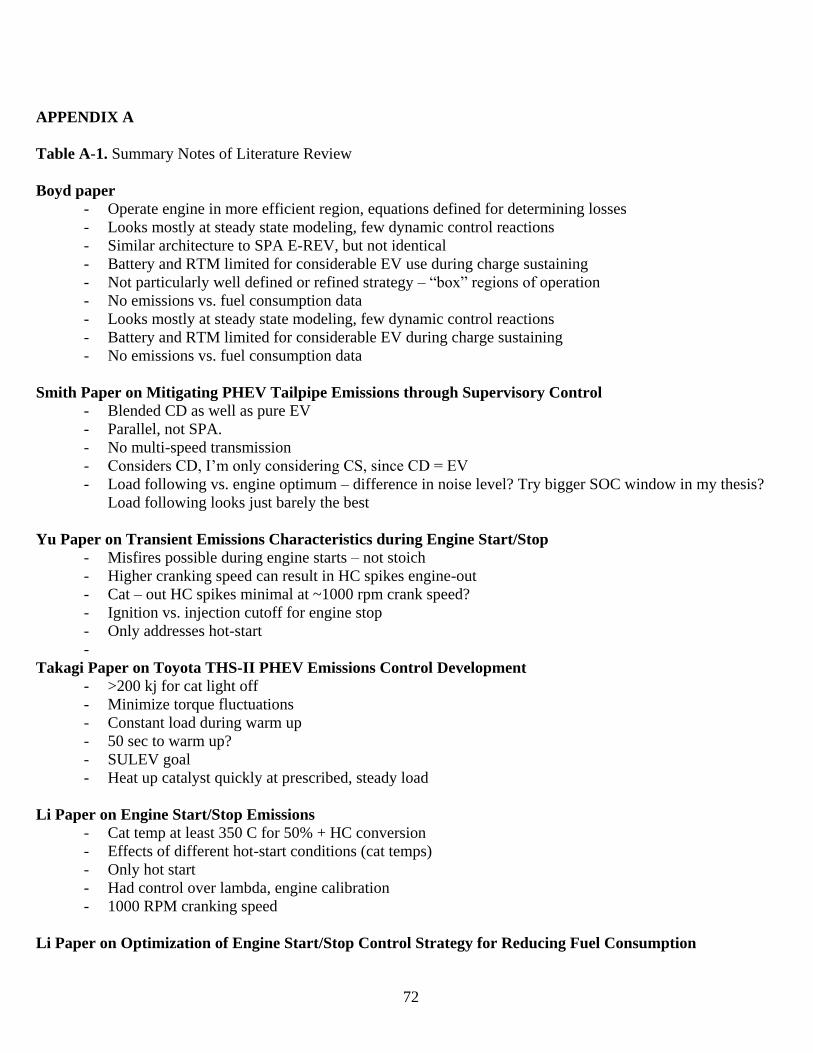
72
APPENDIX A
Table A-1. Summary Notes of Literature Review
Boyd paper
- Operate engine in more efficient region, equations defined for determining losses
- Looks mostly at steady state modeling, few dynamic control reactions
- Similar architecture to SPA E-REV, but not identical
- Battery and RTM limited for considerable EV use during charge sustaining
- Not particularly well defined or refined strategy – “box” regions of operation
- No emissions vs. fuel consumption data
- Looks mostly at steady state modeling, few dynamic control reactions
- Battery and RTM limited for considerable EV during charge sustaining
- No emissions vs. fuel consumption data
Smith Paper on Mitigating PHEV Tailpipe Emissions through Supervisory Control
- Blended CD as well as pure EV
- Parallel, not SPA.
- No multi-speed transmission
- Considers CD, I‟m only considering CS, since CD = EV
- Load following vs. engine optimum – difference in noise level? Try bigger SOC window in my thesis?
Load following looks just barely the best
Yu Paper on Transient Emissions Characteristics during Engine Start/Stop
- Misfires possible during engine starts – not stoich
- Higher cranking speed can result in HC spikes engine-out
- Cat – out HC spikes minimal at ~1000 rpm crank speed?
- Ignition vs. injection cutoff for engine stop
- Only addresses hot-start
-
Takagi Paper on Toyota THS-II PHEV Emissions Control Development
- >200 kj for cat light off
- Minimize torque fluctuations
- Constant load during warm up
- 50 sec to warm up?
- SULEV goal
- Heat up catalyst quickly at prescribed, steady load
Li Paper on Engine Start/Stop Emissions
- Cat temp at least 350 C for 50% + HC conversion
- Effects of different hot-start conditions (cat temps)
- Only hot start
- Had control over lambda, engine calibration
- 1000 RPM cranking speed
Li Paper on Optimization of Engine Start/Stop Control Strategy for Reducing Fuel Consumption
73
- Series PHEV optimized for fuel consumption
- Bang-bang
- Minimize engine run time in CS
- No emissions considerations
Muta Paper on 2nd
Generation Toyota Prius Development
- Improvements over 1st gen Prius – FE, performance, lower emissions
- Constant engine load during cold start, use electric motor to meet vehicle load when possible
- O2 sensor preheating, enables closed loop operation sooner
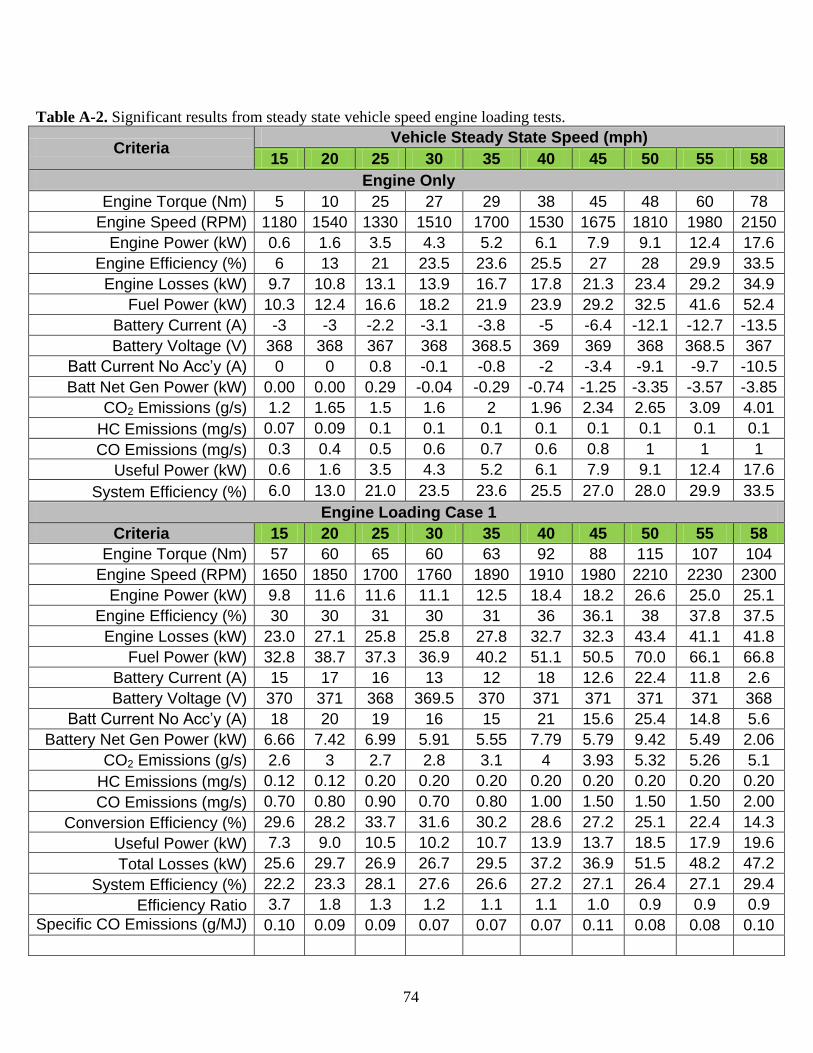
74
Table A-2. Significant results from steady state vehicle speed engine loading tests.
Criteria Vehicle Steady State Speed (mph)
15 20 25 30 35 40 45 50 55 58
Engine Only
Engine Torque (Nm) 5 10 25 27 29 38 45 48 60 78
Engine Speed (RPM) 1180 1540 1330 1510 1700 1530 1675 1810 1980 2150
Engine Power (kW) 0.6 1.6 3.5 4.3 5.2 6.1 7.9 9.1 12.4 17.6
Engine Efficiency (%) 6 13 21 23.5 23.6 25.5 27 28 29.9 33.5
Engine Losses (kW) 9.7 10.8 13.1 13.9 16.7 17.8 21.3 23.4 29.2 34.9
Fuel Power (kW) 10.3 12.4 16.6 18.2 21.9 23.9 29.2 32.5 41.6 52.4
Battery Current (A) -3 -3 -2.2 -3.1 -3.8 -5 -6.4 -12.1 -12.7 -13.5
Battery Voltage (V) 368 368 367 368 368.5 369 369 368 368.5 367
Batt Current No Acc’y (A) 0 0 0.8 -0.1 -0.8 -2 -3.4 -9.1 -9.7 -10.5
Batt Net Gen Power (kW) 0.00 0.00 0.29 -0.04 -0.29 -0.74 -1.25 -3.35 -3.57 -3.85
CO2 Emissions (g/s) 1.2 1.65 1.5 1.6 2 1.96 2.34 2.65 3.09 4.01
HC Emissions (mg/s) 0.07 0.09 0.1 0.1 0.1 0.1 0.1 0.1 0.1 0.1
CO Emissions (mg/s) 0.3 0.4 0.5 0.6 0.7 0.6 0.8 1 1 1
Useful Power (kW) 0.6 1.6 3.5 4.3 5.2 6.1 7.9 9.1 12.4 17.6
System Efficiency (%) 6.0 13.0 21.0 23.5 23.6 25.5 27.0 28.0 29.9 33.5
Engine Loading Case 1
Criteria 15 20 25 30 35 40 45 50 55 58
Engine Torque (Nm) 57 60 65 60 63 92 88 115 107 104
Engine Speed (RPM) 1650 1850 1700 1760 1890 1910 1980 2210 2230 2300
Engine Power (kW) 9.8 11.6 11.6 11.1 12.5 18.4 18.2 26.6 25.0 25.1
Engine Efficiency (%) 30 30 31 30 31 36 36.1 38 37.8 37.5
Engine Losses (kW) 23.0 27.1 25.8 25.8 27.8 32.7 32.3 43.4 41.1 41.8
Fuel Power (kW) 32.8 38.7 37.3 36.9 40.2 51.1 50.5 70.0 66.1 66.8
Battery Current (A) 15 17 16 13 12 18 12.6 22.4 11.8 2.6
Battery Voltage (V) 370 371 368 369.5 370 371 371 371 371 368
Batt Current No Acc’y (A) 18 20 19 16 15 21 15.6 25.4 14.8 5.6
Battery Net Gen Power (kW) 6.66 7.42 6.99 5.91 5.55 7.79 5.79 9.42 5.49 2.06
CO2 Emissions (g/s) 2.6 3 2.7 2.8 3.1 4 3.93 5.32 5.26 5.1
HC Emissions (mg/s) 0.12 0.12 0.20 0.20 0.20 0.20 0.20 0.20 0.20 0.20
CO Emissions (mg/s) 0.70 0.80 0.90 0.70 0.80 1.00 1.50 1.50 1.50 2.00
Conversion Efficiency (%) 29.6 28.2 33.7 31.6 30.2 28.6 27.2 25.1 22.4 14.3
Useful Power (kW) 7.3 9.0 10.5 10.2 10.7 13.9 13.7 18.5 17.9 19.6
Total Losses (kW) 25.6 29.7 26.9 26.7 29.5 37.2 36.9 51.5 48.2 47.2
System Efficiency (%) 22.2 23.3 28.1 27.6 26.6 27.2 27.1 26.4 27.1 29.4
Efficiency Ratio 3.7 1.8 1.3 1.2 1.1 1.1 1.0 0.9 0.9 0.9
Specific CO Emissions (g/MJ) 0.10 0.09 0.09 0.07 0.07 0.07 0.11 0.08 0.08 0.10

75
Engine Loading Case 2
Criteria 15 20 25 30 35 40 45 50 55 58
Engine Torque (Nm) N/A 105 105 113 108 105 117 126 121 N/A
Engine Speed (RPM) N/A 2110 1950 2100 2150 1980 2110 2260 2300 N/A
Engine Power (kW) N/A 23.2 21.4 24.9 24.3 21.8 25.9 29.8 29.1 N/A
Engine Efficiency (%) N/A 37.4 37.3 37.5 37.8 37.4 37.5 38 38.1 N/A
Engine Losses (kW) N/A 38.8 36.0 41.4 40.0 36.4 43.1 48.7 47.4 N/A
Fuel Power (kW) N/A 62.0 57.5 66.3 64.3 58.2 68.9 78.5 76.5 N/A
Battery Current (A) N/A 37 32 35 31 22 25.9 27.3 17.8 N/A
Battery Voltage (V) N/A 374 370 372 373 373 373 374 373 N/A
Batt Current No Acc’y (A) N/A 40 35 38 34 25 28.9 30.3 20.8 N/A
Battery Net Gen Power (kW) N/A 15.0 13.0 14.1 12.7 9.3 10.8 11.3 7.8 N/A
CO2 Emissions (g/s) N/A 5 4.5 5.3 5.02 4.53 5.28 5.8 5.86 N/A
HC Emissions (mg/s) N/A 0.15 0.2 0.2 0.2 0.2 0.2 0.2 0.2 N/A
CO Emissions (mg/s) N/A 1 1 1 1 1 2 2 2 N/A
Conversion Efficiency (%) N/A 33.2 31.2 26.5 24.2 23.2 19.1 20.2 12.0 N/A
Useful Power (kW) N/A 16.6 16.4 18.4 17.8 15.4 18.7 20.4 20.2 N/A
Total Losses (kW) N/A 45.5 41.1 47.9 46.5 42.8 50.3 58.0 56.3 N/A
System Efficiency (%) N/A 26.7 28.6 27.8 27.7 26.5 27.1 26.0 26.4 N/A
Specific CO Emissions (g/MJ) N/A 0.1 0.1 0.1 0.1 0.1 0.1 0.1 0.1 N/A