plug-in electric vehicle introduction in the...
TRANSCRIPT
1
Plug-In Electric Vehicle Introduction in the EU
by
Fernando J. de Sisternes
M.Eng. Industrial Engineering Universidad Carlos III de Madrid, 2005
Submitted to the Engineering Systems Division
in partial fulfillment of the requirements for the degree of
Master of Science in Technology and Policy
at the Massachusetts Institute of Technology
June 2010
© 2010 Massachusetts Institute of Technology. All rights reserved. Signature of author:
Engineering Systems Division Technology and Policy Program
May 7, 2010 Certified by:
Professor John B. Heywood Professor of Mechanical Engineering
Sun Jae Professor, Emeritus Thesis Supervisor
Accepted by:
Professor Dava J. Newman Professor of Aeronautics and Astronautics and Engineering Systems
Director of Technology and Policy Program

2

3
Plug-In Electric Vehicle Introduction in the EU
by
Fernando J. de Sisternes
Submitted to the Engineering Systems Division on May 7,2010 in Partial Fulfillment of the
Requirements for the Degree of Master of Science in Technology and Policy Abstract Plug-in electric vehicles (PEVs) could significantly reduce gasoline consumption and greenhouse gas (GHG) emissions in the EU’s transport sector. However, PEV well-to-wheel (WTW) emissions depend on improvements in vehicle technology and on the emissions produced in generating the electricity to charge the vehicle. This electricity is produced to a certain extent by conventional GHG emitting technologies such as coal, petroleum and gas depending on each country’s electricity generation mix. Hence, individual country assessments need to be done to evaluate the potential gains from PEVs. This research quantifies the reductions in GHG emissions and gasoline consumption achievable by plug-in hybrid electric vehicles (PHEVs) and battery electric vehicles (BEVs) in several EU member states, focusing on two timeframes: present time and year 2035. It also outlines (1) the potential impacts that widespread PEV adoption can have on the electricity infrastructure, (2) how the PEV electricity retailing activity should be regulated to prevent utilities exercise market power, and (3) how to ensure interoperability among PEVs. Finally, this work presents projections on the incremental costs of PEVs and fuel costs savings in the EU from using PEVs. Based on the findings in this analysis, several conclusions can be drawn. First, GHG emissions assessments should consider average electricity emissions instead of marginal emissions. Second, PEVs can consistently reduce gasoline consumption but they will only reduce GHG emissions in countries with a less carbon intensive electricity generation portfolio (unlike Poland). Third, the impacts of PEV fleets on the electricity system can only be evaluated on a case-by-case basis, transformers in the distribution network being the most likely element to be affected. Four, although in EU countries fuel cost savings over the driven lifetime of a PEV are significant, upfront costs of PEVs are higher than those of mainstream technologies. Government-supported pilot projects and tax incentives can help lower cost of ownership and build the market to ultimately lower manufacturing costs. Thesis Supervisor: John B. Heywood Title: Professor of Mechanical Engineering
Sun Jae Professor, Emeritus

4
Acknowledgements This thesis is dedicated to my family and to everyone with whom I did not spend all the time they deserved because I had something else to do. First and foremost, I am deeply grateful to my supervisor, Professor John B. Heywood for his guidance during these two years. He has taught me about the qualities necessary to lead a scientific field and to inspire excellence in his students. I would especially like to thank Professor David Marks for his mentorship since two years before I started the Technology and Policy Program. I have been very lucky to have had his permanent support. Professor Ignacio Pérez-Arriaga deserves special acknowledgement. He has taught me the significance of feeling passion for what you are doing, and the importance of placing yourself at the same level of understanding as the person you want to communicate to. He has built a community of electricity-related research students at MIT and has selfless devoted his time to help them, being a great example of leadership through humility and excellent work. I am deeply indebted to “La Caixa” Foundation for their support. It has been an incredible an enriching experience to be part of the “La Caixa” community, and to get to know so many good and talented people in fields very different to mine. I am very thankful too to the great people working at the Sloan Automotive Laboratory, especially to Valerie Karplus, Lynette Cheah, Emmanuel Kasseris and Stephen Zoepf for their valuable comments and suggestions during different stages of this research. Professor Dava Newman, Professor Mort Webster, Professor Jennifer Gunn (University of Minnesota), Professor Andrés Ramos (IIT) and Bryan Palmintier gave me also great feedback in defining the research that I will conduct in the future during the doctorate program. Finally, I would like to thank the wonderful people in the Technology and Policy Program, fellow students and friends, especially Sydney Miller and Ed Ballo for their hard work and invaluable help to the students.

5
6
Table of Contents Acknowledgements............................................................................................................. 4 1. Introduction................................................................................................................ 8
1.1. Greenhouse Gas Emissions and Fuel Use in Transportation in the EU.............. 8 1.1.1. Greenhouse Gas Emissions and Global Warming...................................... 8 1.1.2. Fuel Use .................................................................................................... 12
1.2. EU Light-Duty Vehicle Context ....................................................................... 13 1.2.1. The EU Light-Duty Vehicle Market .......................................................... 13 1.2.2. The ACEA Agreement ............................................................................... 14 1.2.3. EU Green Cars Initiative .......................................................................... 16
1.3. The Resurgence of the EV Industry.................................................................. 16 1.4. Contribution and Overview............................................................................... 17
2. Methodology............................................................................................................ 20 2.1. Overview........................................................................................................... 20 2.2. Simulation Methodology .................................................................................. 22 2.3. Previous Works................................................................................................. 22 2.4. Fuel Consumption and GHG Emissions ........................................................... 23
2.4.1. Mainstream technologies .......................................................................... 23 2.4.2. PEV technologies ...................................................................................... 24
2.5. Marginal vs. Average Emissions ...................................................................... 25 3. GHG Emissions and Fuel Consumption Reduction................................................. 30
3.1. EU Electricity Generation Mix ......................................................................... 30 3.1.1. Present EU Generation Mix...................................................................... 31 3.1.2. 2035 EU Generation Mix: Reference Scenario Projection ...................... 32 3.1.3. 2035 EU Generation Mix: 450 ppm Scenario Projection ........................ 33 3.1.4. EU Average CO2 Emissions from Electricity Generation ........................ 35
3.2. BEV Electricity Consumption and GHG Emissions ........................................ 35 3.2.1. 2010 BEV Electricity Consumption .......................................................... 36 3.2.2. 2035 BEV Electricity Consumption .......................................................... 38 3.2.3. BEV GHG Emissions (2010 and 2035)..................................................... 40
3.3. PHEV Fuel Consumption and GHG Emissions................................................ 41 3.3.1. Utility factor.............................................................................................. 42 3.3.2. PHEV petroleum consumption (2010 and 2035) ...................................... 43 3.3.3. PHEV GHG emissions (2010 and 2035) .................................................. 44
3.4. Results............................................................................................................... 46

7
3.5. Conclusions....................................................................................................... 47 4. PEV Charging Infrastructure ................................................................................... 48
4.1. Charging Levels ................................................................................................ 48 4.2. Home, public and workplace charging ............................................................. 50 4.3. Interoperability.................................................................................................. 52 4.4. Conclusions....................................................................................................... 52
5. PEV Impact on the Electricity System..................................................................... 54 5.1. Generation......................................................................................................... 54
5.1.1. Capacity expansion ................................................................................... 54 5.1.2. Technology options ................................................................................... 54
5.2. Distribution ....................................................................................................... 56 5.3. Charging profiles and clustering....................................................................... 57 5.4. Demand Management and Smart Grids............................................................ 58 5.5. Conclusion ........................................................................................................ 60
6. PEV Electricity Retailing Regulation ...................................................................... 62 6.1. The Market for Specialized EV Electricity Retailers ....................................... 62 6.2. Liberalization of the Market for Electric Vehicle Electricity Retailers ............ 64
6.2.1. Distribution companies’ market power .................................................... 65 6.2.2. EVERs’ market power............................................................................... 65
6.3. Regulation of the Market for Electric Vehicle Electricity Retailers................. 66 6.4. Conclusions....................................................................................................... 67
7. PEV Economics ....................................................................................................... 70 7.1. Present market of PEVs and expected price ..................................................... 70 7.2. Batteries ............................................................................................................ 72 7.3. PEV sales projections ....................................................................................... 74 7.4. PEV pilot projects and deployment policies ..................................................... 75 7.5. Fuel savings ...................................................................................................... 77 7.6. Gasoline tax revenue loss.................................................................................. 79
8. Policy Recommendations......................................................................................... 82 References......................................................................................................................... 84
8
1. Introduction 1.1. Greenhouse Gas Emissions and Fuel Use in Transportation in the EU 1.1.1. Greenhouse Gas Emissions and Global Warming
The Intergovernmental Panel on Climate Change (IPCC) has observed increases in global average air and ocean temperatures, melting of Artic sea ice and rising global average sea level in the last decades at rates much higher than those registered at the beginning of the twentieth century. These climate effects are derived mainly from an increasing concentration of greenhouse gas (GHG) emissions (CO2, CH4 and N2O, among others) in the atmosphere. Concentration variations of GHGs alter the absorption of radiation within the atmosphere, changing the earth’s climate, and ultimately increasing the likelihood of extreme weather events. (IPCC, 2007) Global anthropogenic emissions have risen by 70% between 1970 and 2004, to a total of 49 GtCO2eq/yr1. This increment has led to an increment of CO2 concentration levels from about 280ppm in 1750 to 379pmm in 2005. Societies can respond to climate change through adaptation (coping with climate change impacts that will occur regardless of future GHGs emissions), and through mitigation (reducing future GHGs emissions). Nevertheless, although there is a large potential for a substantial reduction in GHG emissions over the coming decades, it is generally agreed that with the present climate change mitigation policies in place, emissions will continue to grow by 25 to 90% between 2000 and 2030. In the long term, this can produce increments in average global temperature to a point reaching levels above humans can adapt to. Hence, present mitigation policies are not sufficient The IPCC has performed simulations with models that represent the dynamics of biosphere, oceans and atmosphere, and has concluded that in order to stabilize the CO2 concentration in the atmosphere, emissions will have to peak and then decrease as quickly as possible. Following these models, the Panel has outlined several GHGs
1 “CO2 -equivalent emission is the amount of CO2 that would cause the same time-integrated radiative forcing, over a given time horizon, as an emitted amount of long lived GHG or a mixture of GHGs. The equivalent CO2 emissions is obtained by multiplying the emission of a GHG by its Global Warming Potential (GWP) for the given time horizon. For a mix of GHGs it is obtained by summing the equivalent CO2 emissions of each gas.” (IPCC, 2007)

9
concentration stabilization trajectories, and the emissions reduction that would need to be achieved for each stabilization level (Fig. 1.1).
Fig.1.1 CO2 Emissions for a Range of Stabilization Level. Source: IPCC (2007)
Each of these stabilization levels, will lead to different global average equilibrium temperatures (Fig. 1.2). The resulting stabilization trajectories indicate the importance of acting within the next two to three decades to achieve lower stabilization levels and, ultimately, lower temperature increments. It is also important to note that the distribution of these temperature increments will not be uniform across the globe, and that the impact of this trend will be more severe at higher latitudes (IPCC, 2007).
Fig.1.2 Equilibrium Temperature Increases for a Range of Stabilization Levels. Source:
IPCC (2007)
10
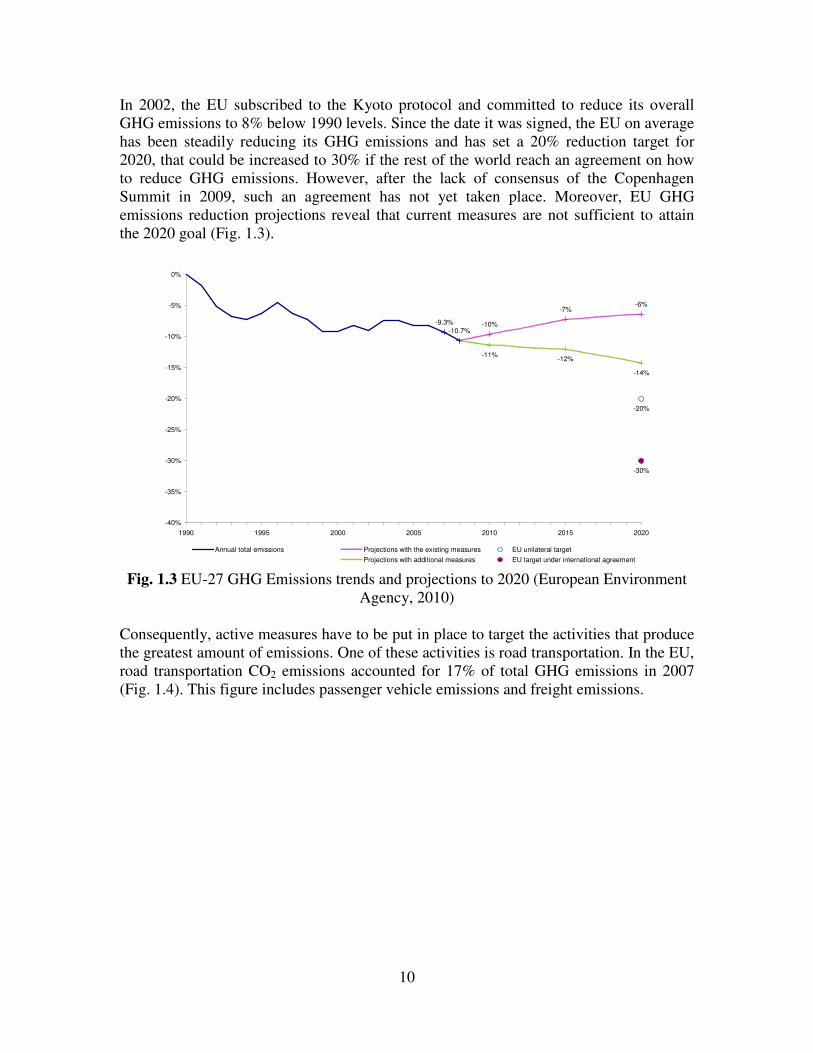
In 2002, the EU subscribed to the Kyoto protocol and committed to reduce its overall GHG emissions to 8% below 1990 levels. Since the date it was signed, the EU on average has been steadily reducing its GHG emissions and has set a 20% reduction target for 2020, that could be increased to 30% if the rest of the world reach an agreement on how to reduce GHG emissions. However, after the lack of consensus of the Copenhagen Summit in 2009, such an agreement has not yet taken place. Moreover, EU GHG emissions reduction projections reveal that current measures are not sufficient to attain the 2020 goal (Fig. 1.3).
-20%
-30%
-9.3%
-10.7%
-6%-7%
-10%
-11%-12%
-14%
-40%
-35%
-30%
-25%
-20%
-15%
-10%
-5%
0%
1990 1995 2000 2005 2010 2015 2020
Annual total emissions Projections with the existing measures EU unilateral target
Projections with additional measures EU target under international agreement
Fig. 1.3 EU-27 GHG Emissions trends and projections to 2020 (European Environment Agency, 2010)
Consequently, active measures have to be put in place to target the activities that produce the greatest amount of emissions. One of these activities is road transportation. In the EU, road transportation CO2 emissions accounted for 17% of total GHG emissions in 2007 (Fig. 1.4). This figure includes passenger vehicle emissions and freight emissions.

11
Road transportation (CO2),
17%
Manufacturing and
construction industries
(CO2), 10%Residential sector (CO2),
8%
Agricultural soils (N2O), 4%
Iron and steel production
(CO2), 4%
Navigation and shipping
(CO2), 4%
Tertiary sector (CO2), 3%
Aviation (international and
domestic) (CO2), 3%
Enteric fermentation (CH4),
3%
Petroleum refining (CO2),
3%
Cement production (CO2),
2%
Solid w aste disposal on
land (CH4), 2%
Other sources, 12.7%
Production of public
electricity and heat (CO2),
26%
Fig. 1.4 Greenhouse gas emissions in the EU27 by main source activity, 2007. (European
Environment Agency, 2010)
In most EU countries, emissions associated with transportation have mostly increased during the period between 1990 and 2006 (Fig. 1.5). Hence, road transport needs to be one of the activities to be addressed if GHG emissions are to be reduced.
-50%
0%
50%
100%
150%
200%
Cypru
s
Irela
nd
Czech R
epublic
Luxem
bourg
CC
-1 (
Turk
ey)
Slo
venia
Spain
Port
ugal
Austr
ia
Icela
nd
Rom
ania
Gre
ece
Malta
Pola
nd
Hungary
New
EU
-12
Norw
ay
Neth
erlands
Slo
vakia
Denm
ark
Latv
ia
EE
A-3
2
Belg
ium
Italy
EF
TA
-4
EU
-15
Fin
land
Fra
nce
Lie
chte
nste
in
Sw
eden
United K
ingdom
Sw
itzerland
Germ
any
Lithuania
Esto
nia
Bulg
aria
ch
an
ge
19
90-2
00
6
Fig. 1.5 Change in total GHG emissions from transport, 1990-2006. (European
Environment Agency, 2010)

12
1.1.2. Fuel Use
Recent shocks in oil prices like the one in the summer of 2008 have indicated the EU’s full exposure to markets’ volatility. Most of the world’s oil reserves are located in countries outside the EU which results in an EU oil dependence above 80% (Fig. 1.6). Some of the countries that are major oil suppliers to the EU are governed by regimes that are politically unstable or that could use fuel supply curtailment as leverage to achieve political concessions.
0%
10%
20%
30%
40%
50%
60%
70%
80%
90%
2000 2001 2002 2003 2004 2005 2006
Ne
t C
rud
e o
il i
mp
ort
s a
s a
% o
f p
rim
ary
oil
co
ns
um
pti
on
Other countries
Iran
Libya
Saudi Arabia
Norway
Russia
EU Crude oil dependence
Fig. 1.6 EU Crude Oil Imports (European Environment Agency, 2010)
Although energy independence in general, and specifically oil independence, could be regarded as a desirable goal, it has proved to be an objective that is not realistically achievable (Raymond, 2007). The objective must therefore be redefined as the goal of reducing exposure to the volatility of oil market prices and enhancing oil supply security. This goal can be attained through strengthening alliances with oil exporting countries by diplomatic means and reducing the dependence on oil.
As shown in Fig. 1.7, demand for gasoline and diesel in the EU has been steadily increasing since 1990. Reducing gasoline and diesel consumption in the EU would contribute to reducing the exposure to the financial and security risks of oil price shocks and oil supply. Achieving this goal would entail reducing gasoline and diesel demand either by decreasing private transportation needs or by displacing petroleum-based fuels with alternative fuels.

13
EU 27 gas and diesel oil consumption in transport
0
50
100
150
200
250
1990
1991
1992
1993
1994
1995
1996
1997
1998
1999
2000
2001
2002
2003
2004
2005
2006
2007
year
mill
ions o
f to
nnes
Gas and diesel consumption
in transport
Fig. 1.7 EU27 Gas and diesel oil consumption in transport (million tones) (EUROSTAT,
2010) 1.2. EU Light-Duty Vehicle Context
1.2.1. The EU Light-Duty Vehicle Market
According to ANFAC, there are a total of 197 million light-duty vehicles in the EU15. The fleet is distributed among member states as it is shown in Fig. 1.8:
41,184
4,246 5,0062,059
21,760
2,554
30,700
4,8211,883
35,680
7,5974,379
30,178
4,2581,434
14,589
4,280
0
5,000
10,000
15,000
20,000
25,000
30,000
35,000
40,000
45,000
Germ
any
Austr
ia
Belg
ium
Denm
ark
Spain
Fin
land
Fra
nce
Gre
ece
Irela
nd
Italy
Neth
erlands
Port
ugal
United
Kin
gdom
Sw
eden
Slo
vak
Republic
Pola
nd
Czech
Republic
Th
ou
san
ds o
f veh
icle
s,
2007
Fig. 1.8 EU15 + Poland + Czech Republic, Light duty vehicle fleet in 2007. (ANFAC,
2009)

14
With the exception of Luxemburg, the degree of motorization (the number of cars per 1,000 inhabitants) has grown in all member states from 1998 to 2008 (Fig. 1.9). This indicates that the demand for private transportation is still growing, which is in accordance with the findings in Fig. 1.7.
0
100
200
300
400
500
600
700
800
Luxem
bourg
Cypru
s
Italy
Germ
any
Fin
land
Sw
itzerland
Malta
Austr
ia
Fra
nce
Slo
venia
Belg
ium
Spain
Sw
eden
Norw
ay
United K
ingdom
Gre
ece
Neth
erlands
Lithuania
Irela
nd
EE
A-3
2
Esto
nia
Czech R
epublic
Denm
ark
Port
ugal
Latv
ia
Bulg
aria
Pola
nd
Hungary
Slo
vakia
Rom
ania
Turk
ey
cars
per
1,0
00 i
nh
ab
itan
ts
1995
2008
Fig. 1.9 Passenger car ownership for the 30 EEA member countries (that is EU27 plus
Norway, Switzerland, Turkey). (European Environment Agency, 2010)
1.2.2. The ACEA Agreement
Acknowledging the importance of the problem that global warming entails, European policymakers have confronted this issue of reducing the emissions associated to transportation though reducing vehicle fuel consumption. In 1998, The European Automobile Manufacturers Association (ACEA) agreed voluntarily with the European Commission to limit the amount of CO2 emissions produced by new passenger vehicles sold in Europe to an average of 140 g/km by 2008. This target was also adopted by the Japan Manufacturers Association (JAMA) and the Korea Automobile Manufacturers Association (KAMA), although the target year was set to 2009 and not 2008, as with the ACEA. The final EU target was subsequently revised to reach an average CO2 emission of 130 g/km for all new passenger cars by 2015 (Fig. 1.10). According to the Monitoring CO2 Emissions Report for 2008 (EU Commission, 2010), although the trend for gasoline, diesel and alternative fuel vehicles has been decreasing since 2000, the average specific CO2 emissions in 2008 were 153.5 gCO2/km, 13.5 g/km above the target. Just two car manufacturers, Fiat (with a value of 133.7 g/km) and

15
Peugeot (with 138.1 g/km), were able to meet the 140 g/km goal, while the rest of the manufacturers were selling vehicles with a greater emissions average.
0
50
100
150
200
250
2000 2005 2010 2015 2020
gC
O2
/km
130 gCO2/km
95 gCO2/km
petroldiesel
afv
Fig. 1.10 Evolution of CO2 Emissions from New Passenger Cars by Fuel (EU27) (EU
Commission, 2010) It can be observed that the tendency from year 2000 has been towards a progressive dieselization of the fleet, and a slow adoption of alternative fuel vehicles (AFV), namely Liquefied Petroleum Gas (LPG), Natural Gas (NG), Electric, Hydrogen, Dual Fuel, Gasoline-Bioethanol, Petrol-LPG, Gasoline-NG.
Table 1.1 Share of fuel type in new passenger cars in the EU (EU Commission, 2010)
Fuel type 2000 2001 2002 2003 2004 2005 2006 2007 2008
Gasoline 68.9% 64.0% 59.2% 55.5% 51.9% 50.7% 49.4% 47.3% 47.3%
Diesel 31.0% 35.9% 40.7% 44.4% 47.9% 49.1% 50.3% 51.9% 51.4%
Alter. fuel 0.1% 0.1% 0.1% 0.1% 0.2% 0.3% 0.3% 0.7% 1.3%
Despite the policy efforts to reduce the emissions of new vehicles sold in the EU region, it is not specified how to achieve these targets. The EU Commission reports that the average engine power has increased steadily from 77 kW in 2002 to 84 kW in 2008; the average engine capacity has remained constant at 1690 cc; as well as the vehicle weight for gasoline and diesel vehicles, while the weight of AFVs has decreased by 32 kg. Having lower CO2 emissions that mainstream fuel vehicles, AFVs have a large potential of providing lower emissions transportation (Schäfer, Heywood, Jacoby & Waitz, 2009,
16
p.p. 162). Among the array of possible alternative fuels, electric vehicles present a especially attractive option as electric motors’ efficiency is significantly higher than that of combustion engines (typically in the order of 0.9 and 0.2-0.45 respectively), they do not present land management issues for fuel procurement as with biodiesel or ethanol, they avoid the high costs of collecting residues for biomass, and they rely on an energy distribution system that is very well-known and already in place. 1.2.3. EU Green Cars Initiative
In the European Union, electric vehicle technology is seen as having a large potential to reduce GHG emissions and reduce oil consumption. To this regard, the EU GreenCars initiative foresees a package of €5 billion in the form of grants from the European Commission, and loans from the European Investment Bank, to support the development of new, sustainable forms of road transport. This funding will focus its attention primarily on electric vehicle research. Additionally, the initiative will target demand-side measures that give incentives for the purchase of AFVs across member states. Many EU countries have already taken individual initiatives to introduce electric vehicle technologies, and have launched pilot projects to show their technical feasibility, as well as introduce incentive schemes to foster the deployment of an EV fleet and infrastructure. 1.3. The Resurgence of the EV Industry The combined urgency stemming from the recent collapse of the financial system experienced by developed economies with the pressing global problems –fossil fuel depletion and potential effects from climate change–, has encouraged governments all over the world (mainly the United States, China, Japan and European Union countries) to begin considering the electrification of the transportation fleet as a means to economically re-activate the auto industry, to curve greenhouse gas (GHG) national emissions downwards and to reduce exposure to volatile oil market prices. Although the electrification of the transportation sector would reduce the tank-to-wheel emissions to zero, well-to-tank emissions, or the emissions produced in the generation of the electricity used in propulsion, will be non-zero. Electric vehicles will be connected to the electricity network and will consume electricity that is ultimately produced to a large extent by mainstream GHG emitting technologies such as coal, petroleum and natural gas. Nevertheless, the commitment expressed by many nations to reduce their contribution to global emissions is driving EU countries to introduce, or to make plans to introduce, a significant amount of renewable forms of energy - mainly wind power, solar power and biomass - into their electricity generation portfolio. This is progressively leading to considerable reductions of the total amount of GHG emissions from the power sector. This is exemplified in the cases of countries like Denmark or Spain, where
17
twenty-eight and nineteen percent of their generation respectively comes from renewable energy sources. Indeed, this tendency to have a “greener” electricity generation technology mix can significantly reduce the well-to-tank emissions and the overall well-to-wheel emissions. Kromer and Heywood (2007) indicated how in the US potential reductions of emissions and fuel consumption could be achieved through switching over to renewable energy generation sources, and how this will result in plug-in hybrid electric vehicles and battery electric vehicles (full-electric vehicles) producing less greenhouse gas emissions compared with the present technology of gasoline and diesel engines. As in the EU, many other industrialized nations are already taking steps to build the future of the auto industry and are considering electric vehicles as a viable option. For instance, in the United States, the American Recovery and Reinvestment Bill of 2009 approved a direct investment of $200 million to encourage electric vehicle technology development. Additionally, countries such as Spain, Denmark and Sweden, not only already have pilot projects underway to demonstrate the feasibility of this technology, but also have established specific targets on electric vehicle penetration for the coming years. For instance, Spain has set an objective of one million electric vehicles on the road by 2014; Denmark aims to have 100% of the new vehicle sales to be electric vehicles by 2011; and Sweden plans to have an all electric powertrain fleet driven by the year 2030. 1.4. Contribution and Overview
The final contribution of this work is to demonstrate that the deployment of plug-in electric vehicles (PEVs) in the EU has the potential to achieve GHG emission reductions as well as fuel savings, to quantify these reductions and savings, and to identify which are the major deployment challenges and opportunities. It also aims to show how these challenges can be overcome, if an appropriate recharging management system is jointly deployed, and to outline policy recommendations to achieve the potential gains from this technology. This thesis is organized as follows: Section 2 provides an overview of the different methodologies used in this thesis and explains how results have been obtained. Section 3 shows the extent to which PEVs can reduce GHG emissions and fuel consumption taking into account EU electricity generation portfolios and improvements in vehicle technology. Section 4 presents different options for recharging infrastructure and what are the considerations that have to be made in order to decide on the deployment of one or the other. Section 5 identifies potential impacts that massive deployment of PEVs can have on the electricity system in its different levels: generation, transmission network, distribution network and retailing. Section 6 gives some guidelines on how new regulation for PEV electricity retailing would need to be put in place to avoid abuse of

18
market power situations and ensure interoperability of the vehicles. Section 7 presents some of the PEVs that are presently in the market; a review of economic considerations affecting the cost of PEVs; and performs a fuel cost savings analysis of several types of PEVs, taking into account present vehicle market prices, fuel prices and electricity prices. Section 8 summarizes the policy recommendations drawn from the results obtained along the development of this work.

19
20
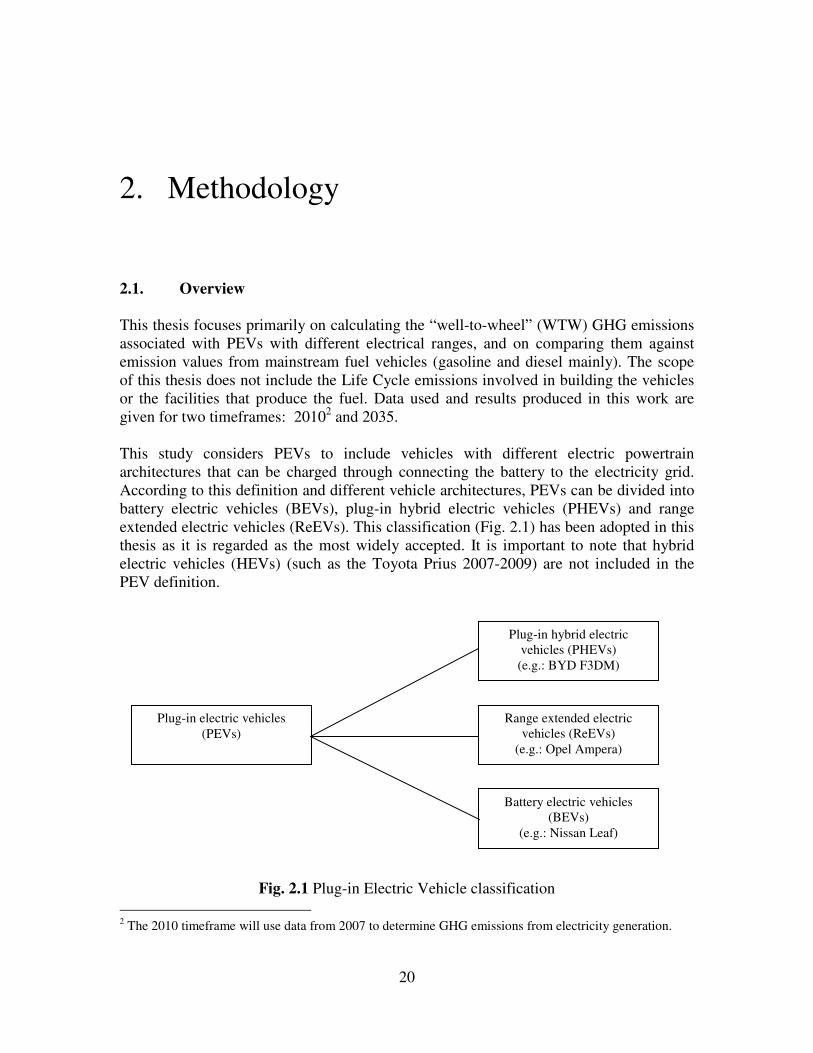
2. Methodology 2.1. Overview This thesis focuses primarily on calculating the “well-to-wheel” (WTW) GHG emissions associated with PEVs with different electrical ranges, and on comparing them against emission values from mainstream fuel vehicles (gasoline and diesel mainly). The scope of this thesis does not include the Life Cycle emissions involved in building the vehicles or the facilities that produce the fuel. Data used and results produced in this work are given for two timeframes: 20102 and 2035. This study considers PEVs to include vehicles with different electric powertrain architectures that can be charged through connecting the battery to the electricity grid. According to this definition and different vehicle architectures, PEVs can be divided into battery electric vehicles (BEVs), plug-in hybrid electric vehicles (PHEVs) and range extended electric vehicles (ReEVs). This classification (Fig. 2.1) has been adopted in this thesis as it is regarded as the most widely accepted. It is important to note that hybrid electric vehicles (HEVs) (such as the Toyota Prius 2007-2009) are not included in the PEV definition.
Fig. 2.1 Plug-in Electric Vehicle classification
2 The 2010 timeframe will use data from 2007 to determine GHG emissions from electricity generation.
Plug-in hybrid electric vehicles (PHEVs) (e.g.: BYD F3DM)
Range extended electric vehicles (ReEVs)
(e.g.: Opel Ampera)
Battery electric vehicles (BEVs)
(e.g.: Nissan Leaf)
Plug-in electric vehicles (PEVs)
21
From the three powertrains included in the definition of PEVs, this study will focus on PHEV and BEV types. Although some of the PEVs about to enter the market are ReEVs, this architecture has a lower power-weight ratio than PHEVs, as engine and motor operate in series. In this configuration the engine is used to drive a generator that provides back-up energy to the battery that feeds the motor (or motors), being these the only elements driving the vehicle. Thus, the final power output is limited by the rated power of the motor. PHEVs on the other hand allow for a parallel operation of the engine and the motor, and thus, for a control that optimizes the efficiency of the engine and the motor. Additionally, in driving conditions demanding high power, this architecture permits motor and engine power to add up, delivering together power directly to the transmission. For the mainstream fuel vehicles, the data that will be used will be that presented in Bodek and Heywood (2008), which is an adaptation of the values obtained in the “Well-to-wheels Report” by EUCAR, the EU Commission and CONCAWE (2007). This study considered achievable improvements that were estimated among the European Council for Automotive R&D (EUCAR) members based on expected technological progress. For calculating the GHG emissions associated with PHEVs and BEVs this study will focus on the fuel production pathway and powertrain efficiency of each type of vehicle. Hence, data will be calculated in two stages:
• First, values for energy consumption will be calculated for BEVs with different electrical range, as a greater battery capacity will increase the weight of the vehicle.
• Second, energy and fuel consumption for vehicles with different electrical range will be determined weighting the values obtained for BEVs and those obtained for conventional hybrids in the CONCAWE (2007) study, according to the utility factor3 value of a certain electrical range. Values of GHG emissions will be determined using values of emissions produced in generating electricity and those produced during the extraction, processing and burning fuel consumed by the engine. This calculation assumes that PHEVs operate in a blended mode (as in a parallel configuration) when there is no energy left in the battery.
The Volkswagen Golf was the vehicle model used in the CONCAWE (2007) report and the same platform will be used in this study for all the calculations and simulations. Although this model is not intended to represent the average EU fleet, it was the best selling car in the EU in 2009 and 2008, and also its weight and performance are close to EU averages.
3 See section 3.3.1
22
2.2. Simulation Methodology In order to better understand what the variation on energy consumption is with different driving conditions, four different driving cycles will be simulated in each case. In addition to the New European Driving Cycle (NEDC), used in the CONCAWE (2007) study, the following US driving cycles were used: FTP (urban), HWFET (highway), and US06 (blended cycle). The main variable that will be simulated is the energy consumption (kWh/km) necessary to perform each driving cycle. Simulations of energy consumption will be run for BEVs with different electrical range varying the battery capacity and holding the weight of the rest of the vehicle constant. Energy consumption simulations were performed using ADVISOR (Advanced Vehicle Simulator), a Simulink based software developed by AVL. 2.3. Previous Works One of the objectives of this thesis is to perform an assessment of WTW GHG emissions and fuel consumption for the EU, based on the same principles as the analysis found in Kromer & Heywood (2007) for the US. As mentioned above, one of the works that this thesis will be drawing on is the CONCAWE (2007) study, which has gained extensive recognition since its publication date. Bodek & Heywood (2008) used results from this report as well to project Europe’s fuel use and GHG emissions through 2035 for mainstream fuel vehicles. This thesis will use the CO2 emissions and fuel consumption results obtained in this study to compare them with the equivalent results generated for EU PEVs. The procedure that this study will follow is similar to the one in Kromer & Heywood (2007). Regarding the economic considerations of PEVs, this study will use the summary found in Cheah and Heywood (2010) of projections on how electric vehicle system costs and battery costs ($/kWh) will evolve over time. The report on strategies for the uptake of electric vehicles and associated infrastructure carried out by Element Energy (2009) has also been illuminating in determining which are the most relevant aspects to pay attention to in deploying recharging infrastructure as well as the potential impacts in the electricity system that PEVs can produce.

23
2.4. Fuel Consumption and GHG Emissions 2.4.1. Mainstream technologies
This thesis will use results on present fuel consumption and projections to 2035 derived from Bodek & Heywood (2008) (Table 2.1). This study drew upon values of fuel consumption of today’s naturally aspirated (NA) and turbocharged gasoline, diesel, gasoline hybrid and diesel hybrids in Europe found in CONCAWE (2007). It then applied the relative improvement factors projected by Bandivadekar et al. (2008) for the corresponding US powertrains. These projections were determined by establishing first the lowest consumption reasonably achieved by each powertrain, considering that vehicle performance (acceleration, top speed, etc) was kept constant at today’s levels. To estimate fuel consumption in 2035, educated estimates were made about the rate of improvement of drag coefficient, rolling resistance, engine efficiency, hybrid control system optimization, etc. Fuel consumption values from both studies and for the two time scopes are represented in Table 2.1. Table 2.1 Future European vehicle fuel consumption levels (Bodek & Heywood, 2008) Sources: CONCAWE et al. (2007), Kasseris & Heywood (2007), Bandivadekar et al.
(2008).
year powertrain Fuel consumption (l/100 km gasoline equivalent)
Relative to Today’s NA Gasoline
Relative to Future NA Gasoline
MIT US Vehicle Simulation Results:
NA Gasoline 8.8 1
Diesel 7.4 0.84
Gasoline Turbo 7.9 0.90 20
05
Gasoline HEV 5.7 0.65
NA Gasoline 5.5 0.63 1
Diesel 4.7 0.53 0.85
Gasoline Turbo 4.9 0.56 0.89 20
30
Gasoline HEV 3.1 0.35 0.56
2010 Projections by CONCAWE et al.:
NA Gasoline 6.57 1
Diesel (w/DPF) 5.48 0.83
Gasoline Turbo 5.9 0.90
Gasoline HEV 5.02 0.76
20
10
Diesel HEV 4.51 0.69
Relative Improvement from US Results Applied to CONCAWE et al.’s 2010 Projections
NA Gasoline 4.11 0.63 1
2035 Diesel 3.48 0.53 0.85
2035 Gasoline Turbo 3.66 0.56 0.89
2035 Gasoline HEV 2.73 0.42 0.66
20
35
2035 Diesel HEV 2.45 0.37 0.60

24
The final values of GHG emissions per kilometer produced by each powertrain can be calculated using the previous results and data of energy density (MJ/l) and well-to-wheels GHG emissions (g CO2/MJ) for gasoline and diesel fuels (Heywood, 1988) (Table 2.2).
Table 2.2. EU ICE GHG Emissions. Sources: CONCAWE et al. (2007), Kasseris and Heywood (2007), Banvidadekar et al. (2008)
powertrain Fuel
Consumption [l/100 km]
Improvements 2007-2035
[%]
Energy Density [MJ/l]
GHG Emissions [g CO2/MJ delivered from well to wheels]
GHG Emissions
[g CO2/km] 2010 Gasoline 6.57 - 32 92 193 2010 Diesel 5.48 - 34 94 185 2010 Turbo Gasoline 5.9 - 32 92 174 2010 Gasoline HEV 5.02 - 32 92 148 2010 Diesel HEV 4.51 - 34 94 153 2035 Gasoline 4.11 37 32 92 121 2035 Diesel 3.48 36 34 94 118 2035 Turbo Gasoline 3.66 38 32 92 108 2035 Gasoline HEV 2.73 46 32 92 80 2035 Diesel HEV 2.45 66 34 94 83
2.4.2. PEV technologies
As it will be explained in the following section, fuel consumption for PEVs will be calculated weighing the miles traveled in charge sustaining mode (these are miles traveled using petroleum) by the total miles traveled using the utility factor corresponding to the electrical range of the vehicle. Well-to-tank GHG emissions for each PEV type will be calculated on the basis of where the electricity used to charge the vehicle comes from. For this purpose, average emissions for a country/region at a given future time scope will be estimated. Electricity generation portfolios will be translated to average GHG emissions weighing the emissions produced by each technology. These emissions will be obtained combining data provided by the EU Commission on lifecycle CO2 emissions (Table 2.3) and annual electricity output for each technology.
Table 2.3. Electricity Generation Technologies Lifecycle CO2 Emissions. Source: EU Commission (2008)
Technology Lifecycle grCO2/kWh
Gas: CCGT4 420
Gas: CCGT & CCS5 145
Oil: CC 585
4 Combined cycle gas turbine 5 Carbon capture and sequestration
25
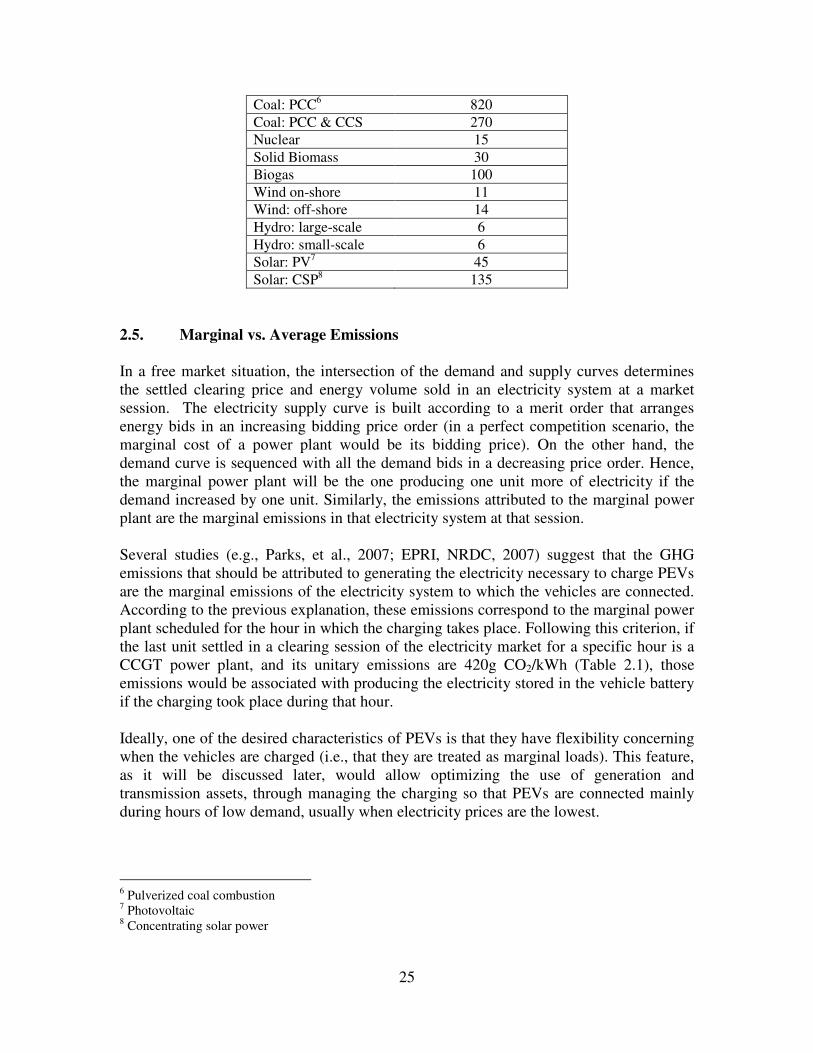
Coal: PCC6 820
Coal: PCC & CCS 270
Nuclear 15
Solid Biomass 30
Biogas 100
Wind on-shore 11
Wind: off-shore 14
Hydro: large-scale 6
Hydro: small-scale 6
Solar: PV7 45
Solar: CSP8 135
2.5. Marginal vs. Average Emissions In a free market situation, the intersection of the demand and supply curves determines the settled clearing price and energy volume sold in an electricity system at a market session. The electricity supply curve is built according to a merit order that arranges energy bids in an increasing bidding price order (in a perfect competition scenario, the marginal cost of a power plant would be its bidding price). On the other hand, the demand curve is sequenced with all the demand bids in a decreasing price order. Hence, the marginal power plant will be the one producing one unit more of electricity if the demand increased by one unit. Similarly, the emissions attributed to the marginal power plant are the marginal emissions in that electricity system at that session. Several studies (e.g., Parks, et al., 2007; EPRI, NRDC, 2007) suggest that the GHG emissions that should be attributed to generating the electricity necessary to charge PEVs are the marginal emissions of the electricity system to which the vehicles are connected. According to the previous explanation, these emissions correspond to the marginal power plant scheduled for the hour in which the charging takes place. Following this criterion, if the last unit settled in a clearing session of the electricity market for a specific hour is a CCGT power plant, and its unitary emissions are 420g CO2/kWh (Table 2.1), those emissions would be associated with producing the electricity stored in the vehicle battery if the charging took place during that hour. Ideally, one of the desired characteristics of PEVs is that they have flexibility concerning when the vehicles are charged (i.e., that they are treated as marginal loads). This feature, as it will be discussed later, would allow optimizing the use of generation and transmission assets, through managing the charging so that PEVs are connected mainly during hours of low demand, usually when electricity prices are the lowest.
6 Pulverized coal combustion 7 Photovoltaic 8 Concentrating solar power
26
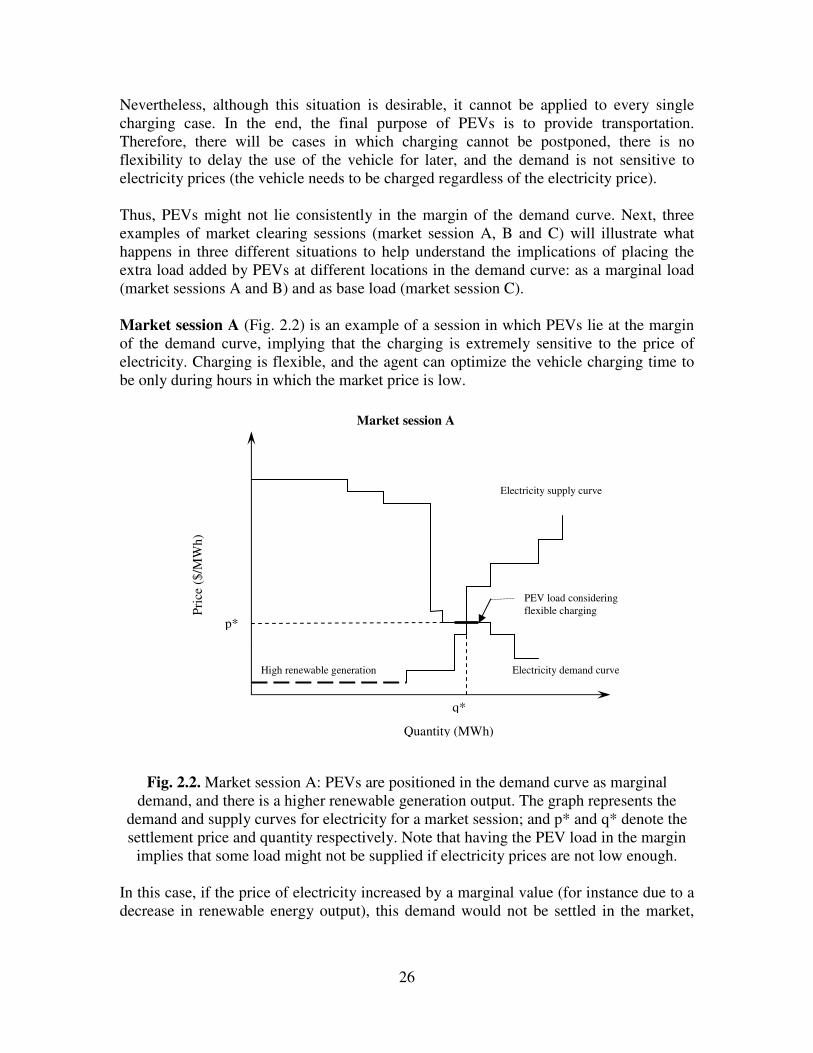
Nevertheless, although this situation is desirable, it cannot be applied to every single charging case. In the end, the final purpose of PEVs is to provide transportation. Therefore, there will be cases in which charging cannot be postponed, there is no flexibility to delay the use of the vehicle for later, and the demand is not sensitive to electricity prices (the vehicle needs to be charged regardless of the electricity price). Thus, PEVs might not lie consistently in the margin of the demand curve. Next, three examples of market clearing sessions (market session A, B and C) will illustrate what happens in three different situations to help understand the implications of placing the extra load added by PEVs at different locations in the demand curve: as a marginal load (market sessions A and B) and as base load (market session C). Market session A (Fig. 2.2) is an example of a session in which PEVs lie at the margin of the demand curve, implying that the charging is extremely sensitive to the price of electricity. Charging is flexible, and the agent can optimize the vehicle charging time to be only during hours in which the market price is low.
Fig. 2.2. Market session A: PEVs are positioned in the demand curve as marginal demand, and there is a higher renewable generation output. The graph represents the
demand and supply curves for electricity for a market session; and p* and q* denote the settlement price and quantity respectively. Note that having the PEV load in the margin
implies that some load might not be supplied if electricity prices are not low enough. In this case, if the price of electricity increased by a marginal value (for instance due to a decrease in renewable energy output), this demand would not be settled in the market,
q*
p*
PEV load considering flexible charging
Electricity demand curve
Electricity supply curve
High renewable generation
Quantity (MWh)
Pri
ce (
$/M
Wh
)
Market session A
27
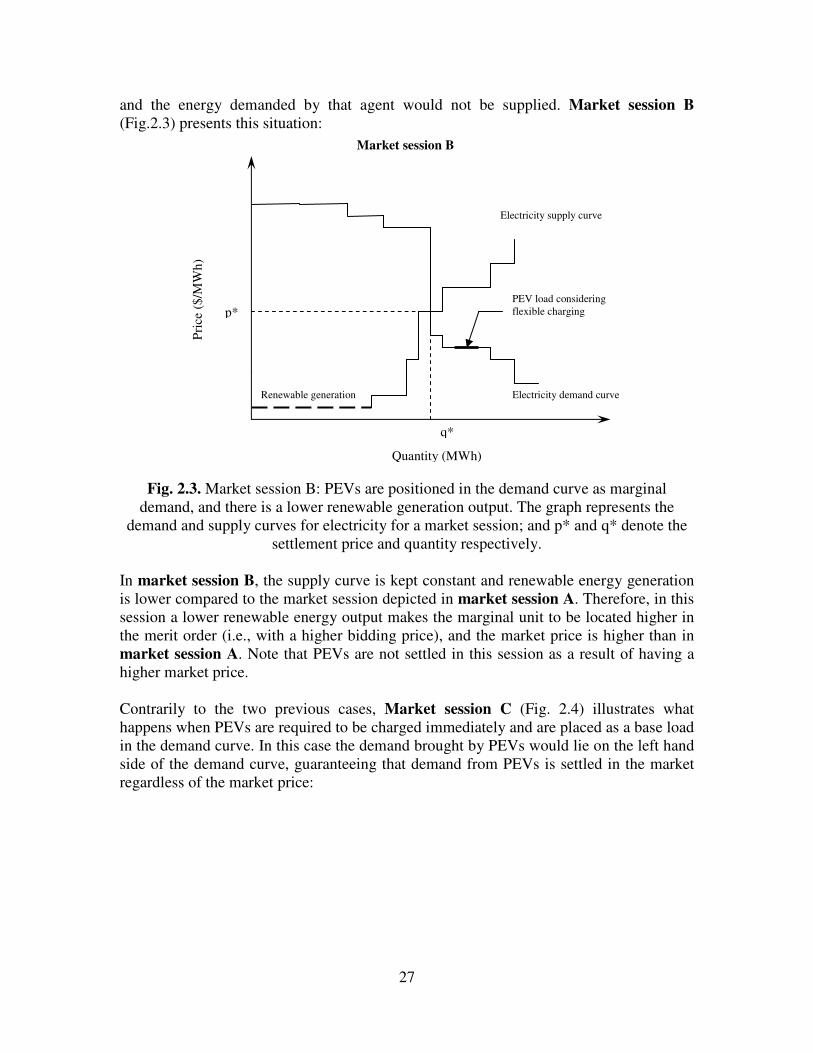
and the energy demanded by that agent would not be supplied. Market session B (Fig.2.3) presents this situation:
Fig. 2.3. Market session B: PEVs are positioned in the demand curve as marginal
demand, and there is a lower renewable generation output. The graph represents the demand and supply curves for electricity for a market session; and p* and q* denote the
settlement price and quantity respectively.
In market session B, the supply curve is kept constant and renewable energy generation is lower compared to the market session depicted in market session A. Therefore, in this session a lower renewable energy output makes the marginal unit to be located higher in the merit order (i.e., with a higher bidding price), and the market price is higher than in market session A. Note that PEVs are not settled in this session as a result of having a higher market price.
Contrarily to the two previous cases, Market session C (Fig. 2.4) illustrates what happens when PEVs are required to be charged immediately and are placed as a base load in the demand curve. In this case the demand brought by PEVs would lie on the left hand side of the demand curve, guaranteeing that demand from PEVs is settled in the market regardless of the market price:
Pri
ce (
$/M
Wh
)
Quantity (MWh)
q*
p* PEV load considering flexible charging
Electricity demand curve
Electricity supply curve
Renewable generation
Market session B
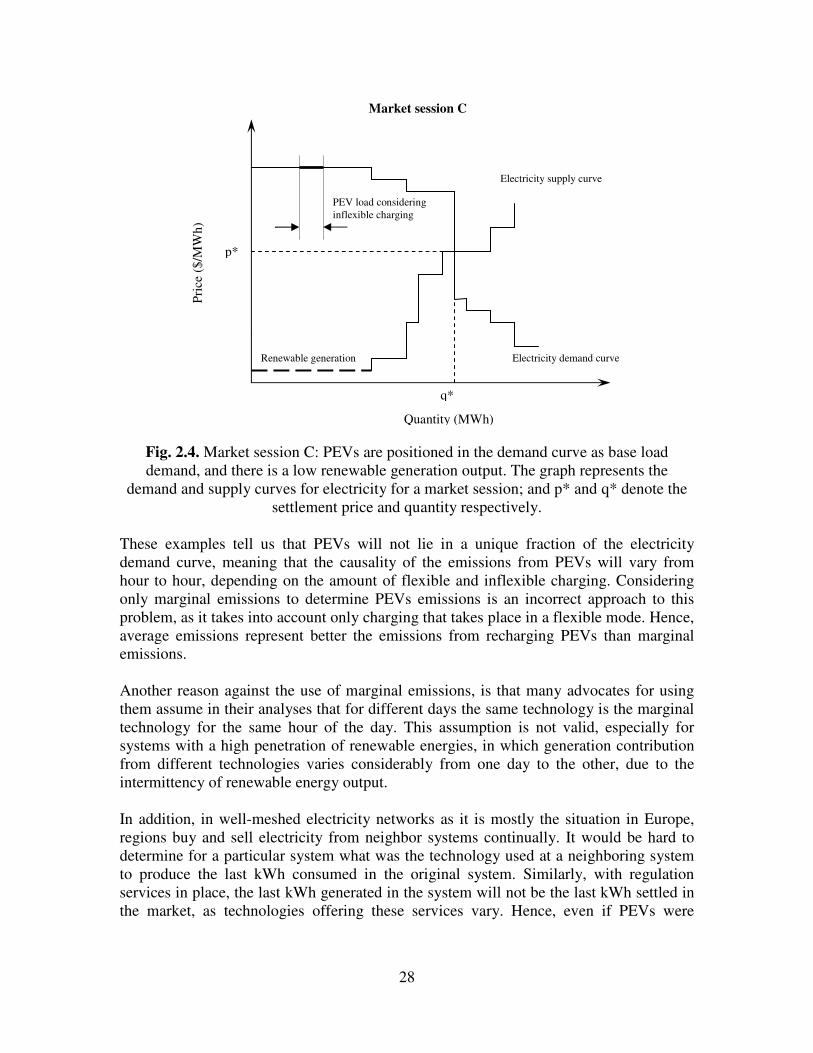
28
Fig. 2.4. Market session C: PEVs are positioned in the demand curve as base load demand, and there is a low renewable generation output. The graph represents the
demand and supply curves for electricity for a market session; and p* and q* denote the settlement price and quantity respectively.
These examples tell us that PEVs will not lie in a unique fraction of the electricity demand curve, meaning that the causality of the emissions from PEVs will vary from hour to hour, depending on the amount of flexible and inflexible charging. Considering only marginal emissions to determine PEVs emissions is an incorrect approach to this problem, as it takes into account only charging that takes place in a flexible mode. Hence, average emissions represent better the emissions from recharging PEVs than marginal emissions. Another reason against the use of marginal emissions, is that many advocates for using them assume in their analyses that for different days the same technology is the marginal technology for the same hour of the day. This assumption is not valid, especially for systems with a high penetration of renewable energies, in which generation contribution from different technologies varies considerably from one day to the other, due to the intermittency of renewable energy output. In addition, in well-meshed electricity networks as it is mostly the situation in Europe, regions buy and sell electricity from neighbor systems continually. It would be hard to determine for a particular system what was the technology used at a neighboring system to produce the last kWh consumed in the original system. Similarly, with regulation services in place, the last kWh generated in the system will not be the last kWh settled in the market, as technologies offering these services vary. Hence, even if PEVs were
q*
p*
PEV load considering inflexible charging
Electricity demand curve
Electricity supply curve
Renewable generation
Quantity (MWh)
Pri
ce (
$/M
Wh
)
Market session C

29
placed as a marginal load, it would also be inaccurate to consider only the marginal emissions in that system. All in all, for all the reasons explained above, marginal emissions do not appropriately represent the emissions associated with charging PEVs. Hence, taking average emissions from a single electricity system will be preferred to the former method, as it describes more accurately what the emissions are from producing the electricity used in charging PEVs.
30
3. GHG Emissions and Fuel Consumption Reduction
Emissions associated with PEVs and their fuel consumption depend largely on two fundamental factors: improvements in vehicle technology that increase fuel economy, reducing GHG emissions from fuel combustion; and emissions linked to the specific technologies used to produce the electricity that the vehicle consumes. This section will compare the relative performance of what are considered to be now mainstream powertrains (NA gasoline, gasoline turbo, diesel and hybrids) with PEVs, in terms of GHG emissions and fuel consumption.
• The values for fuel consumption for mainstream powertrain vehicles will be taken from Bodek & Heywood (2008). GHG emissions will be obtained by applying standard values of energy density and GHG emissions per MJ delivered from well to wheels (Table 2.3) to fuel consumption.
• GHG emissions of PEVs will be calculated on the basis of different present and future regional electricity generation mixes, using the demand for energy results obtained from ADVISOR simulations for a standard European car, applying different driving cycles and with different battery capacities.
• Fuel consumption and GHG emissions of PHEVs will be determined by combining the results for PEVs and the results for gasoline hybrids, weighed by the utility factor corresponding to the electric range of each PHEV.
3.1. EU Electricity Generation Mix Average GHG emissions from electricity production in a particular electricity system are directly linked to the electricity generation mix in that system. Electricity generation portfolios of different EU countries have been the result of different capacity expansion plans adopted by each sovereign nation for the last decades. Although there is presently an EU emissions target, and electricity generation is one of the main sectors targeted for GHG emissions reduction, each member country has freedom to choose how these emissions reductions will be achieved and which technologies should be encouraged and implemented. This explains the variation in each country’s generation mix.

31
3.1.1. Present EU Generation Mix
Figure 3.1 shows an example of how the contribution of different technologies to the total electricity generation varies across EU countries. Data for the US has also been included for reference purposes. In general, most countries have a diversified electricity generation portfolio, with the exception of France, which relies on Nuclear power for 78% of its electricity needs, and Poland, which generates 93% of its electricity with coal. Other countries like Italy and Portugal exhibit a strong social opposition against the problems posed by nuclear power, and have no operating nuclear reactors.
EU and US average generation mix 2007
0%
10%
20%
30%
40%
50%
60%
70%
80%
90%
100%
Spa
in UK
Ger
man
y
Franc
e
Polan
d
Por
tuga
l
Net
herla
nds
Italy
EU27 U
S
% o
f E
lec
tric
ity
Ge
ne
rati
on
20
07
Nuclear
Solar
Hydro
Wind
Other renewables
Coal
Oil
Gas
Fig. 3.1 EU and US average electricity generation mix in 2007. The data represent the percentage of the total electricity generation (kWh) attributed to different technologies
during year 2007. Source: IEA (2009) Although both regions - the EU27 and the US - present diversified generation portfolios, the US has a greater reliance on coal than the EU does (a 50% rate in the case of the US compared to 30% for the EU), and less wind power and nuclear power penetration. We can translate these results into CO2 emissions using the data on lifecycle emissions attributable to each technology provided by the EU Commission (Table. 2.3). Figure 3.2 shows the variation of CO2 emissions from electricity generation among some EU countries, the EU27 and the US. It can be noticed how France, depending mostly on nuclear power, has the lowest emissions from all the cases considered. However, as it will be discussed later, nuclear power entails problems for which a solution has not yet been found, which may disqualify it as a sustainable option.
32
EU and US average electricity unit emissions 2007
0
100
200
300
400
500
600
700
800
900
Spain
UK
Ger
man
y
France
Polan
d
Portuga
l
Net
herla
nds
Italy
EU27 U
S
CO
2 e
mis
sio
ns
gr/
kW
h
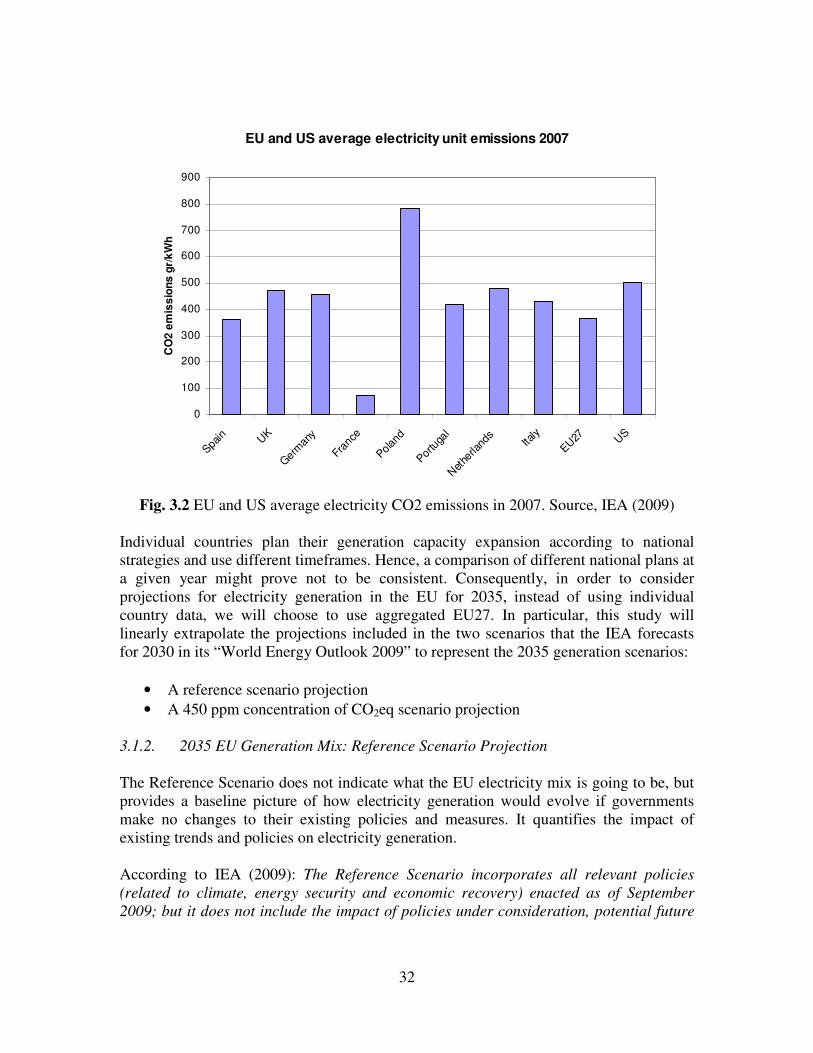
Fig. 3.2 EU and US average electricity CO2 emissions in 2007. Source, IEA (2009)
Individual countries plan their generation capacity expansion according to national strategies and use different timeframes. Hence, a comparison of different national plans at a given year might prove not to be consistent. Consequently, in order to consider projections for electricity generation in the EU for 2035, instead of using individual country data, we will choose to use aggregated EU27. In particular, this study will linearly extrapolate the projections included in the two scenarios that the IEA forecasts for 2030 in its “World Energy Outlook 2009” to represent the 2035 generation scenarios:
• A reference scenario projection
• A 450 ppm concentration of CO2eq scenario projection 3.1.2. 2035 EU Generation Mix: Reference Scenario Projection
The Reference Scenario does not indicate what the EU electricity mix is going to be, but provides a baseline picture of how electricity generation would evolve if governments make no changes to their existing policies and measures. It quantifies the impact of existing trends and policies on electricity generation. According to IEA (2009): The Reference Scenario incorporates all relevant policies
(related to climate, energy security and economic recovery) enacted as of September
2009; but it does not include the impact of policies under consideration, potential future

33
policies (which differ from current policies) or “targets” that are not backed up by
commensurate policy measures. An additional important assumption in the Reference
Scenario is that energy subsidies on fossil fuels will be gradually reduced globally, such
that end-use prices reflect more closely the real cost of production, transformation and
transportation of fossil fuels.
Coal is an abundant and cheap fuel, so this IEA scenario assumes that countries will not abandon coal, and that it will remain as one of the main contributors to the total bulk of electricity generated.
EU 27 Generation Mix (reference scenario)
0%
10%
20%
30%
40%
50%
60%
70%
80%
90%
100%
2007 2015 2020 2025 2030 2035
year
% o
f to
tal
gen
era
tio
n
Coal Oil Gas
Nuclear Hydro Other renewables
Wind Solar
Fig.3.3 EU27 generation mix from 2007 to 2035 according to the Reference Scenario.
(Projected from IEA, 2009) 3.1.3. 2035 EU Generation Mix: 450 ppm Scenario Projection
The 450 Scenario analyses how global energy markets could evolve if countries take
coordinated action to restrict the global temperature increase to 2°C. OECD+ countries
are assumed to take on national emissions-reduction commitments for 2020. All other
countries are assumed to adopt domestic policies and measures, and to generate and sell
emissions credits. In this scenario, global energy-related CO2 emissions peak just before
2020 at 30.9 Gt and decline thereafter to 26.4 Gt in 2030. (IEA, 2009)
34
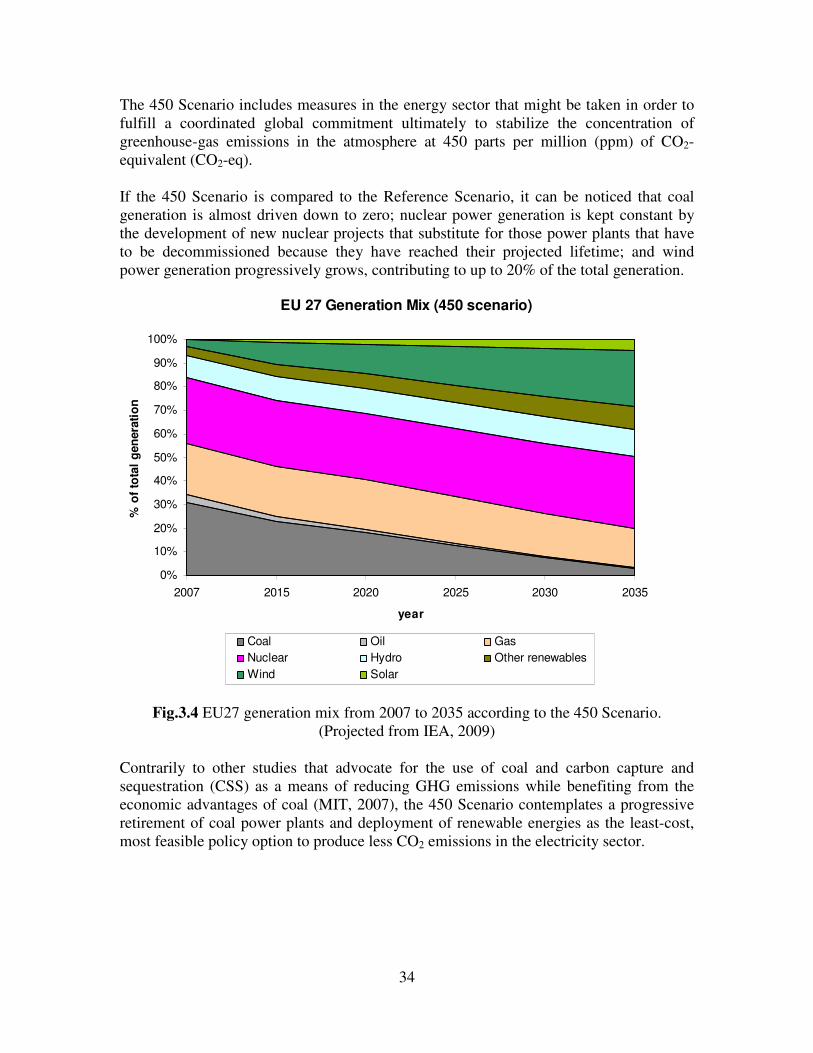
The 450 Scenario includes measures in the energy sector that might be taken in order to fulfill a coordinated global commitment ultimately to stabilize the concentration of greenhouse-gas emissions in the atmosphere at 450 parts per million (ppm) of CO2-equivalent (CO2-eq). If the 450 Scenario is compared to the Reference Scenario, it can be noticed that coal generation is almost driven down to zero; nuclear power generation is kept constant by the development of new nuclear projects that substitute for those power plants that have to be decommissioned because they have reached their projected lifetime; and wind power generation progressively grows, contributing to up to 20% of the total generation.
EU 27 Generation Mix (450 scenario)
0%
10%
20%
30%
40%
50%
60%
70%
80%
90%
100%
2007 2015 2020 2025 2030 2035
year
% o
f to
tal
gen
era
tio
n
Coal Oil Gas
Nuclear Hydro Other renewables
Wind Solar
Fig.3.4 EU27 generation mix from 2007 to 2035 according to the 450 Scenario.
(Projected from IEA, 2009) Contrarily to other studies that advocate for the use of coal and carbon capture and sequestration (CSS) as a means of reducing GHG emissions while benefiting from the economic advantages of coal (MIT, 2007), the 450 Scenario contemplates a progressive retirement of coal power plants and deployment of renewable energies as the least-cost, most feasible policy option to produce less CO2 emissions in the electricity sector.

35
3.1.4. EU Average CO2 Emissions from Electricity Generation
The electricity generation paths determined by the two IEA scenarios can be represented in terms of CO2 emissions as it was done with individual countries using the technology emissions values given by the EU Commission (Table 2.3). Results are presented in Figure 3.5. It can be observed in this plot that 2035 emissions in the 450 Scenario are roughly 65% less than those in the Reference Scenario, mainly due to decreasing coal generation.
EU27 average CO2 emissions in electricity generation
0
50
100
150
200
250
300
350
400
2007 2015 2020 2025 2030 2035
year
gC
O2
/kW
h
reference scenario 450 scenario
Fig.3.5 EU27 emissions evolution according to the Reference Scenario and the 450
Scenario. Sources: IEA (2009) and EU Commission (2008) Once emissions from electricity have been obtained for the two scopes considered in this study, it will be necessary to understand how much electricity will be demanded by the vehicle to travel a given distance with certain speeds and accelerations. 3.2. BEV Electricity Consumption and GHG Emissions Using the Volkswagen Golf 2010 as vehicle platform and a BEV powertrain, ADVISOR simulations were performed for different battery capacities, in order to include the effect of battery weight on the final weight of the vehicle. Different driving cycles were used during the simulations to better understand the effect of different driving patterns (speeds and accelerations) on the electrical range achievable with a specific battery capacity. For the two timeframes considered in this study, two different assumptions were taken for the battery energy density: 150 Wh/kg for present battery technology and 300 Wh/Kg for 2035. These assumptions are consistent with the projections made by BCG (2010).
36
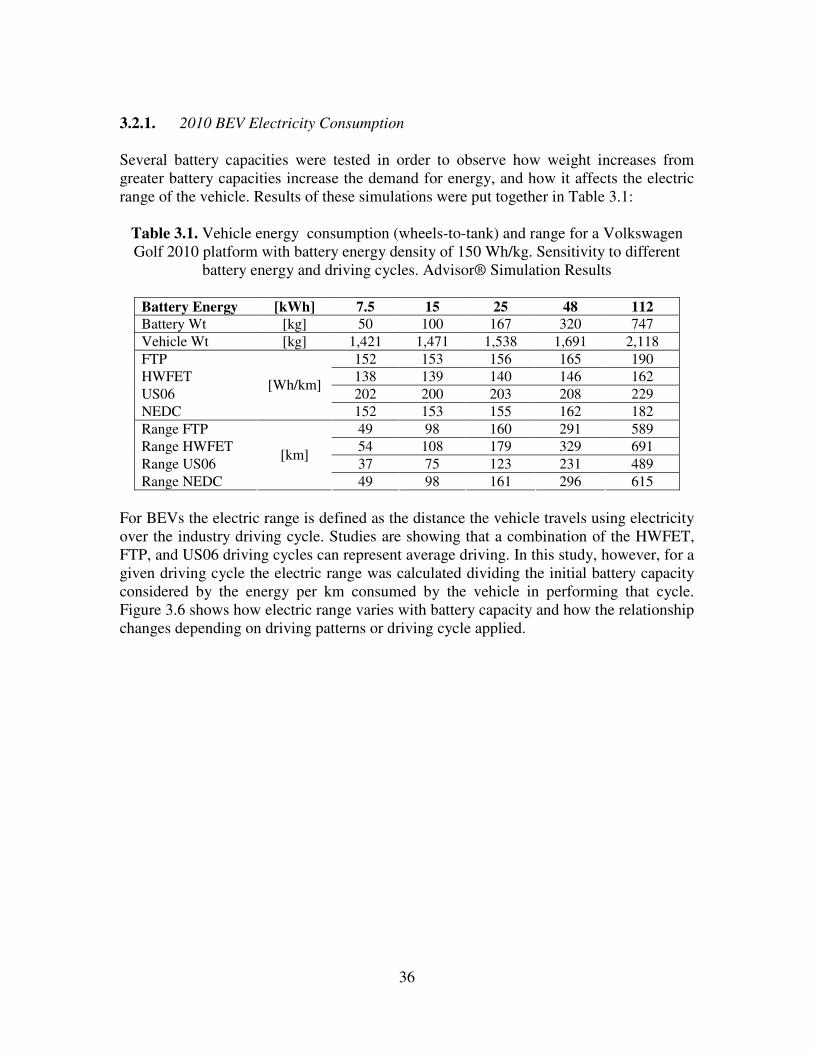
3.2.1. 2010 BEV Electricity Consumption Several battery capacities were tested in order to observe how weight increases from greater battery capacities increase the demand for energy, and how it affects the electric range of the vehicle. Results of these simulations were put together in Table 3.1:
Table 3.1. Vehicle energy consumption (wheels-to-tank) and range for a Volkswagen Golf 2010 platform with battery energy density of 150 Wh/kg. Sensitivity to different
battery energy and driving cycles. Advisor® Simulation Results
Battery Energy [kWh] 7.5 15 25 48 112 Battery Wt [kg] 50 100 167 320 747
Vehicle Wt [kg] 1,421 1,471 1,538 1,691 2,118
FTP 152 153 156 165 190
HWFET 138 139 140 146 162
US06 202 200 203 208 229
NEDC
[Wh/km]
152 153 155 162 182
Range FTP 49 98 160 291 589
Range HWFET 54 108 179 329 691
Range US06 37 75 123 231 489
Range NEDC
[km]
49 98 161 296 615
For BEVs the electric range is defined as the distance the vehicle travels using electricity over the industry driving cycle. Studies are showing that a combination of the HWFET, FTP, and US06 driving cycles can represent average driving. In this study, however, for a given driving cycle the electric range was calculated dividing the initial battery capacity considered by the energy per km consumed by the vehicle in performing that cycle. Figure 3.6 shows how electric range varies with battery capacity and how the relationship changes depending on driving patterns or driving cycle applied.
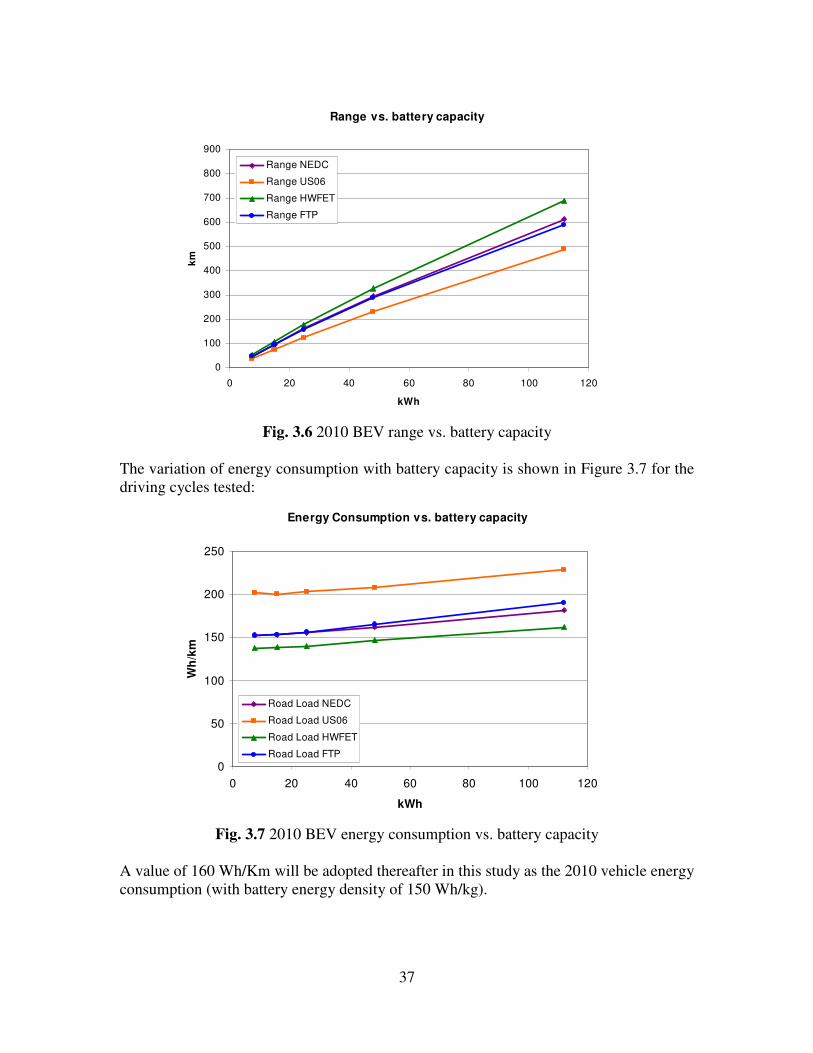
37
Range vs. battery capacity
0
100
200
300
400
500
600
700
800
900
0 20 40 60 80 100 120
kWh
km
Range NEDC
Range US06
Range HWFET
Range FTP
Fig. 3.6 2010 BEV range vs. battery capacity
The variation of energy consumption with battery capacity is shown in Figure 3.7 for the driving cycles tested:
Energy Consumption vs. battery capacity
0
50
100
150
200
250
0 20 40 60 80 100 120
kWh
Wh
/km
Road Load NEDC
Road Load US06
Road Load HWFET
Road Load FTP
Fig. 3.7 2010 BEV energy consumption vs. battery capacity
A value of 160 Wh/Km will be adopted thereafter in this study as the 2010 vehicle energy consumption (with battery energy density of 150 Wh/kg).
38
However, the energy consumed by the vehicle is not equal to the energy that has to be produced in the power plant to supply the vehicle with the energy it needs, as there are losses in each of the components of the system. In order to obtain the demand for electricity at the power plant, assumptions were made on values for the efficiency of the motor and gear, the power electronics, the battery, the inverter and the grid. The values taken for these variables are shown in Table 3.2, as well as the resulting value of electricity demanded at the power plant. Table 3.2. BEV (with 160Wh/Km energy consumption) demand for electricity (well-to-
wheel) at generation bus bars
Vehicle Energy
Consumption
Motor and gear
efficiency
Power electronics efficiency
Battery efficiency
Inverter efficiency
Grid Efficiency
Electricity Demand
160 Wh/Km 0.85 0.9 0.9 0.9 0.93 278Wh/km
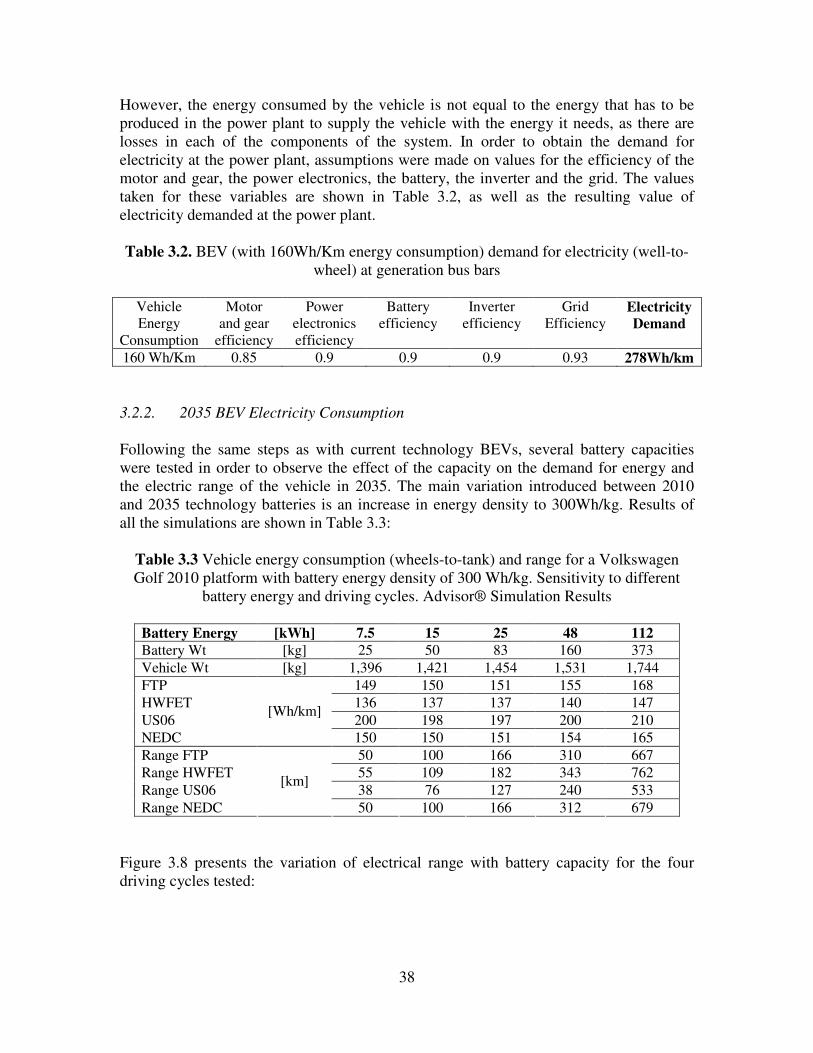
3.2.2. 2035 BEV Electricity Consumption
Following the same steps as with current technology BEVs, several battery capacities were tested in order to observe the effect of the capacity on the demand for energy and the electric range of the vehicle in 2035. The main variation introduced between 2010 and 2035 technology batteries is an increase in energy density to 300Wh/kg. Results of all the simulations are shown in Table 3.3:
Table 3.3 Vehicle energy consumption (wheels-to-tank) and range for a Volkswagen Golf 2010 platform with battery energy density of 300 Wh/kg. Sensitivity to different
battery energy and driving cycles. Advisor® Simulation Results
Battery Energy [kWh] 7.5 15 25 48 112 Battery Wt [kg] 25 50 83 160 373
Vehicle Wt [kg] 1,396 1,421 1,454 1,531 1,744
FTP 149 150 151 155 168
HWFET 136 137 137 140 147
US06 200 198 197 200 210
NEDC
[Wh/km]
150 150 151 154 165
Range FTP 50 100 166 310 667
Range HWFET 55 109 182 343 762
Range US06 38 76 127 240 533
Range NEDC
[km]
50 100 166 312 679
Figure 3.8 presents the variation of electrical range with battery capacity for the four driving cycles tested:

39
Range vs. battery capacity
0
100
200
300
400
500
600
700
800
900
0 20 40 60 80 100 120
kWh
km
Range NEDC
Range US06
Range HWFET
Range FTP
Fig. 3.8 2035 BEV range vs. battery capacity
Figure 3.9 shows how energy consumption changes with different battery capacities and driving cycle:
Energy Consumption vs. battery capacity
0
50
100
150
200
250
0 20 40 60 80 100 120
kWh
Wh
/km
Road Load NEDC
Road Load US06
Road Load HWFET
Road Load FTP
Fig. 3.9 2035 BEV energy consumption vs. battery capacity

40
A value of 150 Wh/Km will be adopted thereafter in this study as the 2035 vehicle energy consumption (with battery energy density of 300 Wh/kg), compared to 160 Wh/Km estimated for current technology electric drive. The potential for a significant percentage improvement in the efficiency of the electrical components is limited as their efficiency is already high. Thus, for calculating the demand for electricity in the power plant, the same values of efficiency used in present scope calculations were assumed, disregarding the small effect of possible efficiency improvements in the electrical components of the system (Table 3.4). Table 3.4 BEV (with 150Wh/Km energy consumption) demand for electricity (well-to-
wheels) at generation bus bars
Vehicle Energy
Consumption
Motor and gear
efficiency
Power electronics efficiency
Battery efficiency
Inverter efficiency
Grid Efficiency
Electricity Demand
150 Wh/Km 0.85 0.9 0.9 0.9 0.93 260Wh/km
3.2.3. BEV GHG Emissions (2010 and 2035)
BEVs GHG emissions depend on the energy consumption of the vehicle and the emissions produced at the power plants in the region where the vehicle is connected. Table 3.5 shows BEVs GHG emissions variation using previously calculated energy consumption values and regional average emissions: Table 3.5 BEV GHG emissions (grCO2/km) according to time scope and region/scenario
Scope Region/scenario CO2 emissions [gr/km] SP 100
UK 131
GE 126
FR 20
PL 217
Present
EU 101
EUrs 75 2035
EU450s 28
Figure 3.10 shows the evolution of EU27 average BEV emissions per km taking into account the average emissions from electricity generation according to the two scenarios from the IEA. It can be seen from the figure that if active measures embodied in the 450 Scenario are taken by EU member countries to reduce GHG emissions from electricity, emissions from BEV can be as low as 28grCO2/km in 2035.
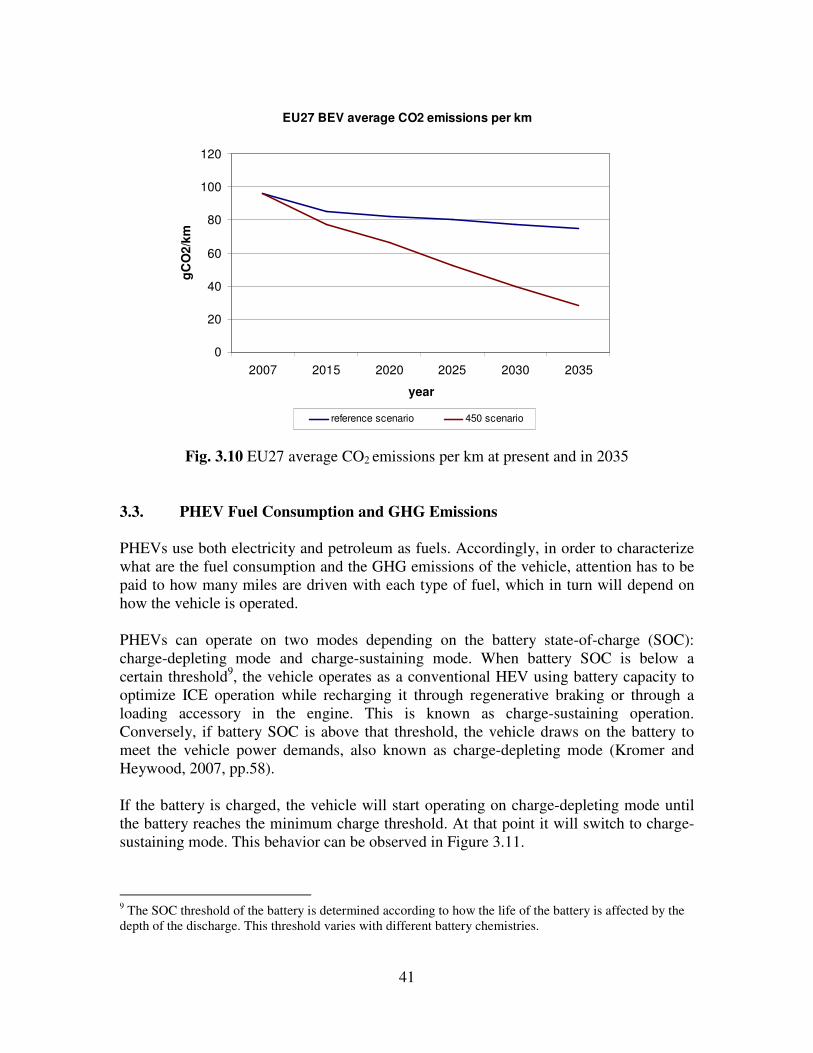
41
EU27 BEV average CO2 emissions per km
0
20
40
60
80
100
120
2007 2015 2020 2025 2030 2035
year
gC
O2
/km
reference scenario 450 scenario
Fig. 3.10 EU27 average CO2 emissions per km at present and in 2035
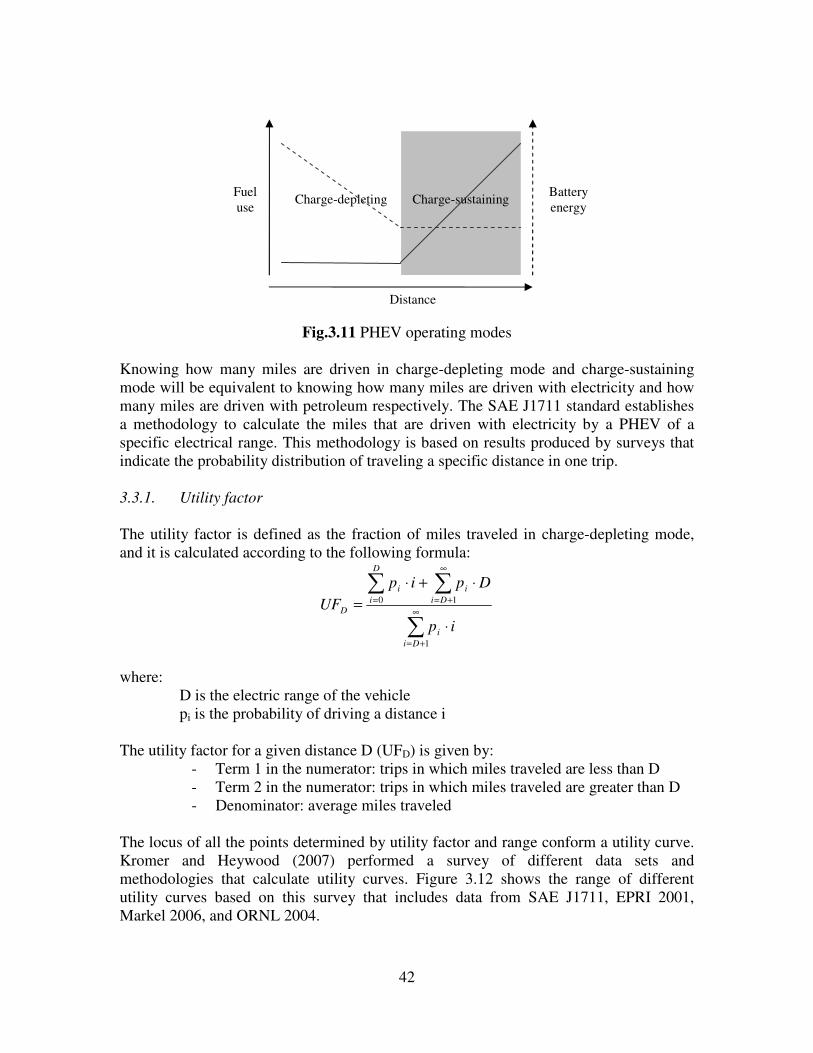
3.3. PHEV Fuel Consumption and GHG Emissions PHEVs use both electricity and petroleum as fuels. Accordingly, in order to characterize what are the fuel consumption and the GHG emissions of the vehicle, attention has to be paid to how many miles are driven with each type of fuel, which in turn will depend on how the vehicle is operated. PHEVs can operate on two modes depending on the battery state-of-charge (SOC): charge-depleting mode and charge-sustaining mode. When battery SOC is below a certain threshold9, the vehicle operates as a conventional HEV using battery capacity to optimize ICE operation while recharging it through regenerative braking or through a loading accessory in the engine. This is known as charge-sustaining operation. Conversely, if battery SOC is above that threshold, the vehicle draws on the battery to meet the vehicle power demands, also known as charge-depleting mode (Kromer and Heywood, 2007, pp.58). If the battery is charged, the vehicle will start operating on charge-depleting mode until the battery reaches the minimum charge threshold. At that point it will switch to charge-sustaining mode. This behavior can be observed in Figure 3.11.
9 The SOC threshold of the battery is determined according to how the life of the battery is affected by the depth of the discharge. This threshold varies with different battery chemistries.
42
Fig.3.11 PHEV operating modes
Knowing how many miles are driven in charge-depleting mode and charge-sustaining mode will be equivalent to knowing how many miles are driven with electricity and how many miles are driven with petroleum respectively. The SAE J1711 standard establishes a methodology to calculate the miles that are driven with electricity by a PHEV of a specific electrical range. This methodology is based on results produced by surveys that indicate the probability distribution of traveling a specific distance in one trip. 3.3.1. Utility factor
The utility factor is defined as the fraction of miles traveled in charge-depleting mode, and it is calculated according to the following formula:
∑
∑ ∑∞
+=
=
∞
+=
⋅
⋅+⋅
=
1
0 1
Di
i
D
i Di
ii
D
ip
Dpip
UF
where: D is the electric range of the vehicle pi is the probability of driving a distance i The utility factor for a given distance D (UFD) is given by:
- Term 1 in the numerator: trips in which miles traveled are less than D - Term 2 in the numerator: trips in which miles traveled are greater than D - Denominator: average miles traveled
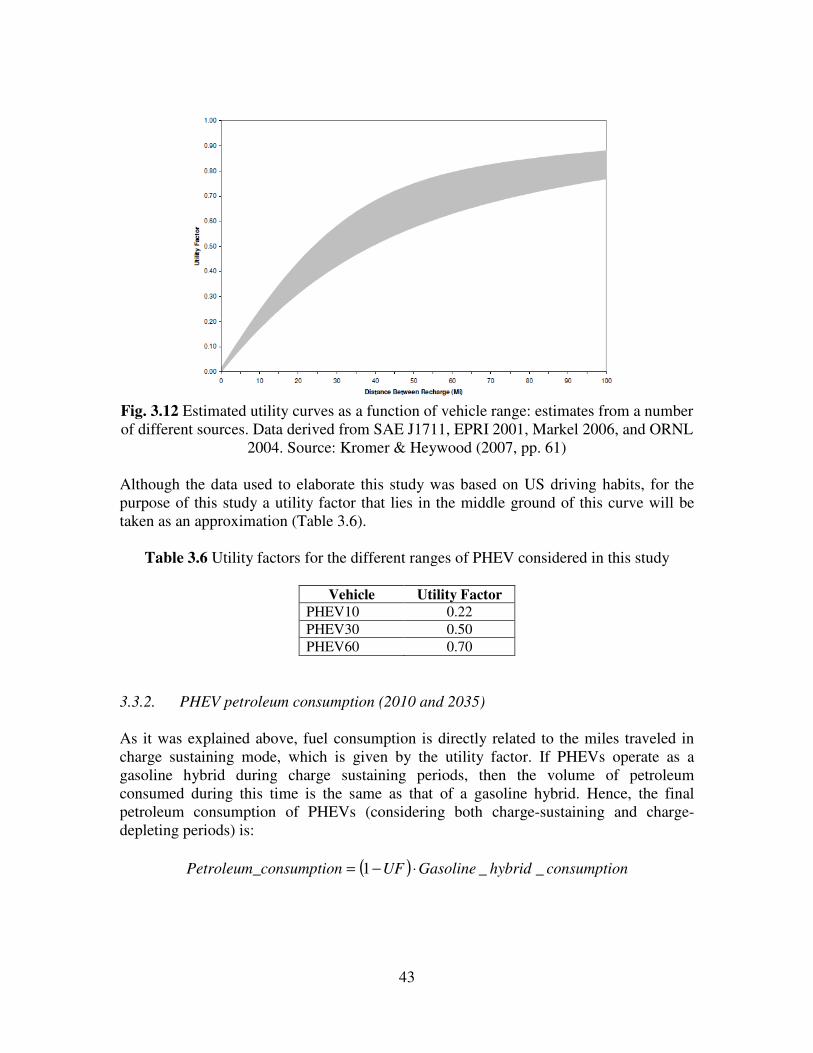
The locus of all the points determined by utility factor and range conform a utility curve. Kromer and Heywood (2007) performed a survey of different data sets and methodologies that calculate utility curves. Figure 3.12 shows the range of different utility curves based on this survey that includes data from SAE J1711, EPRI 2001, Markel 2006, and ORNL 2004.
Charge-depleting
Charge-sustaining Fuel use
Battery energy
Distance
43
Fig. 3.12 Estimated utility curves as a function of vehicle range: estimates from a number of different sources. Data derived from SAE J1711, EPRI 2001, Markel 2006, and ORNL
2004. Source: Kromer & Heywood (2007, pp. 61) Although the data used to elaborate this study was based on US driving habits, for the purpose of this study a utility factor that lies in the middle ground of this curve will be taken as an approximation (Table 3.6).
Table 3.6 Utility factors for the different ranges of PHEV considered in this study
Vehicle Utility Factor PHEV10 0.22
PHEV30 0.50
PHEV60 0.70
3.3.2. PHEV petroleum consumption (2010 and 2035)
As it was explained above, fuel consumption is directly related to the miles traveled in charge sustaining mode, which is given by the utility factor. If PHEVs operate as a gasoline hybrid during charge sustaining periods, then the volume of petroleum consumed during this time is the same as that of a gasoline hybrid. Hence, the final petroleum consumption of PHEVs (considering both charge-sustaining and charge-depleting periods) is:
( ) nconsumptiohybridGasolineUFnconsumptioPetroleum_ __1 ⋅−=
44
If we take into account petroleum consumption of gasoline hybrid vehicles in 2010 and in 2035, we can obtain values for PHEVs in the present and in 2035 for different electric range (Table 3.7). Values for standard hybrid vehicles (HEVs) have also been included for comparative purposes:
Table 3.7 PHEV and HEV petroleum consumption [l/100 km] according to timeframe
Timeframe Vehicle Petroleum consumption [l/100 km]
Gasoline HEV 5.02
Diesel HEV 4.51
PHEV10 3.92
PHEV30 2.51
2010
PHEV60 1.51
Gasoline HEV 2.73
Diesel HEV 2.45
PHEV10 2.13
PHEV30 1.37
2035
PHEV60 0.82
3.3.3. PHEV GHG emissions (2010 and 2035)
Emissions from PHEV will be separated in those produced in charge-sustaining mode derived from petroleum and those produced during charge-depleting mode associated with electricity. Thus, emissions can be expressed according to the following expression:
( ) emissionshybridGasolineUFemissionsyElectricitUFEmissionsPHEV __1__ ⋅−+⋅=
Taking into account the different petroleum consumption and emissions from electricity in the two scopes considered, and the regional variation in the case of electricity emissions, we can obtain values for the different combinations studied (Table 3.8):
Table 3.8 PHEV GHG emissions [gCO2/ km] according to time scope and region/scenario
Scope Region Vehicle GHG emissions [gCO2/km]
PHEV10 137.29
PHEV30 123.94 Spain
PHEV60 114.40
PHEV10 144.18
PHEV30 139.58 UK
PHEV60 136.29
PHEV10 143.01
PHEV30 136.94 Germany
PHEV60 132.60
2010
France PHEV10 119.77

45
PHEV30 84.12
PHEV60 58.65
PHEV10 162.96
PHEV30 182.26 Poland
PHEV60 196.05
PHEV10 137.49
PHEV30 124.38 EU27
PHEV60 115.02
PHEV10 79.20
PHEV30 77.70 EU-rs
PHEV60 76.63
PHEV10 68.91
PHEV30 54.33
2035
EU-450
PHEV60 43.92
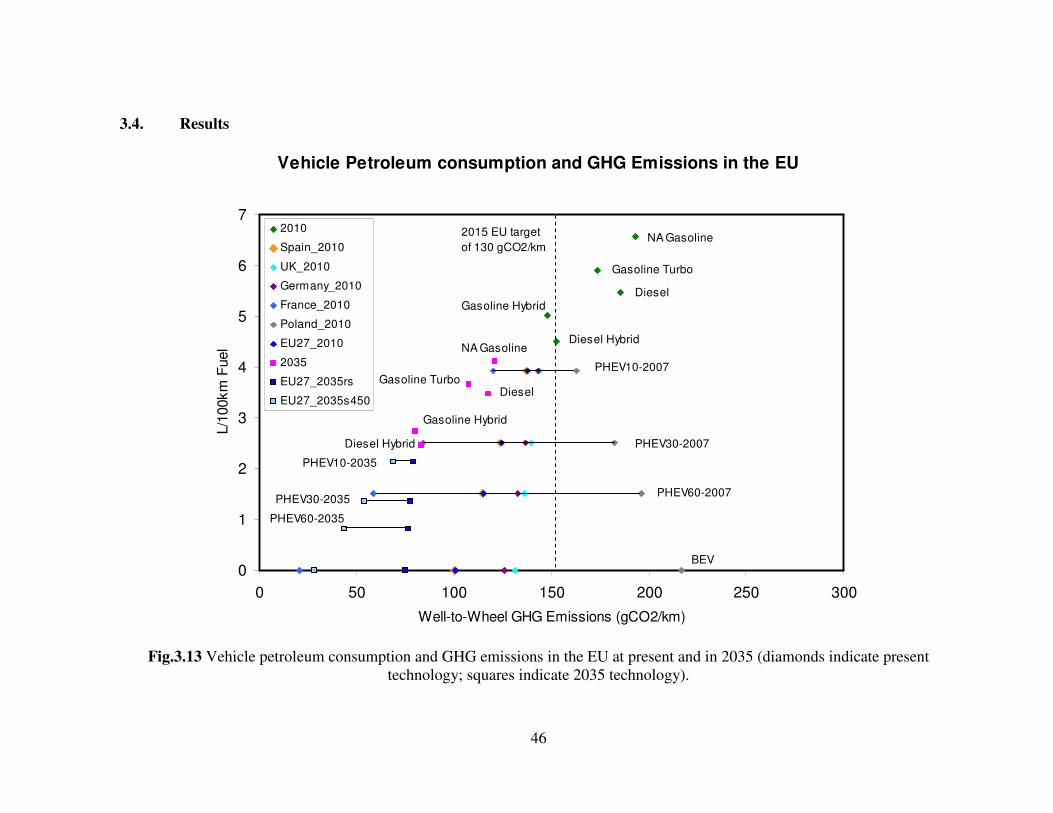
Results from all previous calculations can be plotted together now in one single graph that represents fuel consumption and GHG emissions for the different powertrains in the two timeframes (present and 2035) and with different regional electricity generation portfolios.
46
3.4. Results
Vehicle Petroleum consumption and GHG Emissions in the EU
0
1
2
3
4
5
6
7
0 50 100 150 200 250 300
Well-to-Wheel GHG Emissions (gCO2/km)
L/1
00km
Fuel
2010
Spain_2010
UK_2010
Germany_2010
France_2010
Poland_2010
EU27_2010
2035
EU27_2035rs
EU27_2035s450
NA Gasoline
Gasoline Turbo
DieselGasoline Hybrid
Diesel HybridNA Gasoline
Gasoline TurboDiesel
Gasoline Hybrid
Diesel Hybrid
PHEV10-2007
PHEV30-2007
PHEV60-2007
PHEV10-2035
PHEV30-2035
PHEV60-2035
BEV
2015 EU target
of 130 gCO2/km
Fig.3.13 Vehicle petroleum consumption and GHG emissions in the EU at present and in 2035 (diamonds indicate present
technology; squares indicate 2035 technology).

47
3.5. Conclusions The analysis shows that both BEVs and PHEVs consistently have the ability to reduce fuel consumption when compared with mainstream technologies in the 2010 and in the 2035 projection. This result confirms findings from other studies that reach the same conclusion. Regarding GHG emissions, this analysis does not find a unique result. Countries like France, with most of its electricity generation coming from nuclear will clearly be benefited from the deployment of PEVs. Similarly, in countries like Spain, France, the UK and Germany, with a diversified portfolio of generation and an increasing amount of renewable energies, PEVs will emit less GHG emissions than mainstream technologies. Conversely, for example with Poland which relies on coal generation, the results show that in order to attain the potential gains from PEVs, it is essential that electricity is generated with low GHG emitting technologies. In fact, opting for PEVs in countries with high levels of electricity emissions can increase the overall emissions compared to mainstream powertrains. Pollutants produced with the emissions should also be taken into account. Consequently, for the same level of GHG emissions between PEVs and mainstream technologies, PEVs would be preferred as the bulk of emissions and pollutants are generated at the power plants, typically situated outside urban areas. Displacing emissions to less populated areas would reduce the impact that air pollutants have on the population. Finally, accounting for the extra cost of larger battery capacities and how a greater capacity can reduce fuel consumption, users should evaluate which electric range would make economically more sense according to their planned vehicle use.

48
4. PEV Charging Infrastructure One of the main advantages of PEVs over other alternative fuel vehicles like biogas, ethanol or hydrogen is that a fuel supply infrastructure for electricity is already in place: the electricity grid. Nevertheless, connecting PEVs to the electricity network requires also other elements that will add to the cost of the vehicle. These additional elements are those constituting the PEV charging system. The PEV charging system is integrated by the electric vehicle supply equipment (EVSE) and the on-board charging system built in the vehicle. EVSE refers to the off-board equipment used to supply electricity to the vehicle (i.e., vehicle charge cord, charging station, attachment plugs, vehicle connector, etc). The on-board charging system includes a charging control system, and AC/DC converter to charge the battery and a cooling system for the battery and the charger. The cost of these elements will be proportional to the rated design power, as greater power transmission capacity will require thicker cables and insulators to operate with higher voltages and to transmit higher currents, as well as more demanding safety specifications. 4.1. Charging Levels The ability to transmit higher power reduces the charging time of the battery, although at a higher cost. Charging systems with different power capabilities have been typically grouped in three levels (Table 4.1):
Table 4.1 Charging Levels according to different voltage and current levels
Level Voltage [V]
Current [A]
Apparent Power [kVA]
Charging Time for a 40kWh pack [h]
Retail price [$]
Level I 120-230 ~ 16 ~ 1.9 – 3.7 ~ 20 t.b.d.
Level II 230 ~ 80 ~ 18 ~ 2 > 2,000
Level III 400 three-phase
> 200 > 140 < 0.3 ~ 40,000
The time during which the vehicle remains parked in a parking space is the time during which it can be charged. Hence, this time will determine the choice between one charging
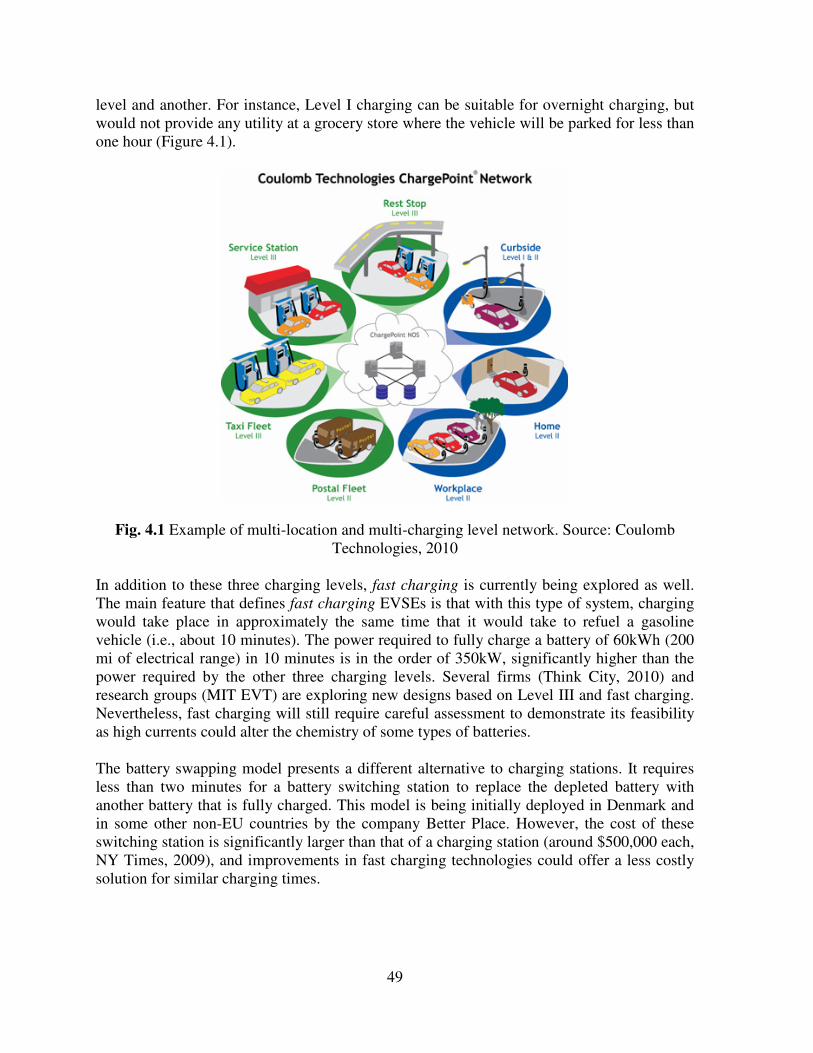
49
level and another. For instance, Level I charging can be suitable for overnight charging, but would not provide any utility at a grocery store where the vehicle will be parked for less than one hour (Figure 4.1).
Fig. 4.1 Example of multi-location and multi-charging level network. Source: Coulomb Technologies, 2010
In addition to these three charging levels, fast charging is currently being explored as well. The main feature that defines fast charging EVSEs is that with this type of system, charging would take place in approximately the same time that it would take to refuel a gasoline vehicle (i.e., about 10 minutes). The power required to fully charge a battery of 60kWh (200 mi of electrical range) in 10 minutes is in the order of 350kW, significantly higher than the power required by the other three charging levels. Several firms (Think City, 2010) and research groups (MIT EVT) are exploring new designs based on Level III and fast charging. Nevertheless, fast charging will still require careful assessment to demonstrate its feasibility as high currents could alter the chemistry of some types of batteries. The battery swapping model presents a different alternative to charging stations. It requires less than two minutes for a battery switching station to replace the depleted battery with another battery that is fully charged. This model is being initially deployed in Denmark and in some other non-EU countries by the company Better Place. However, the cost of these switching station is significantly larger than that of a charging station (around $500,000 each, NY Times, 2009), and improvements in fast charging technologies could offer a less costly solution for similar charging times.

50
4.2. Home, public and workplace charging One of the main questions that urban designers and policy makers will have to consider while planning the deployment of infrastructure for PEVs is where the recharging EVSE should be installed. In order to answer this question it is important to understand where vehicles are parked depending on the type of trip (commuting, shopping, business, etc), the time that vehicles are parked in different locations, and the trip frequencies according to distance traveled. Depending on the location of the charging infrastructure, charging can be classified as residential (at houses or apartment buildings), workplace or public (in the street, in publicly accessible buildings or in public parking lots). Element Energy published in 2009 a study with strategies for the uptake of PEVs and infrastructure implications for the UK, based on statistical data from the National Travel Survey (NTS) conducted in 2006 by the British Department for Transportation (DfT). These statistics are used in the study to help estimating the technical capabilities and the utility of different charging infrastructures (residential, workplace and public) in the UK. Figure 4.2 represents car -km driven in the eight most frequent trip types in the UK accounting for 77% of all trips. The data shows that 22% of all trips are for commuting, and that two thirds of commuting trips are less than 16km.
Fig. 4.2 Analysis of car-km driven in the eight most frequent trip types in the UK. Source:
Element Energy (2009) Figure 4.3 shows the availability and use of parking facilities from households taking the 2005 ONS Omnibus survey. This graph reports that, in the UK, 80% of car-owning households use a garage or some other off-street parking.
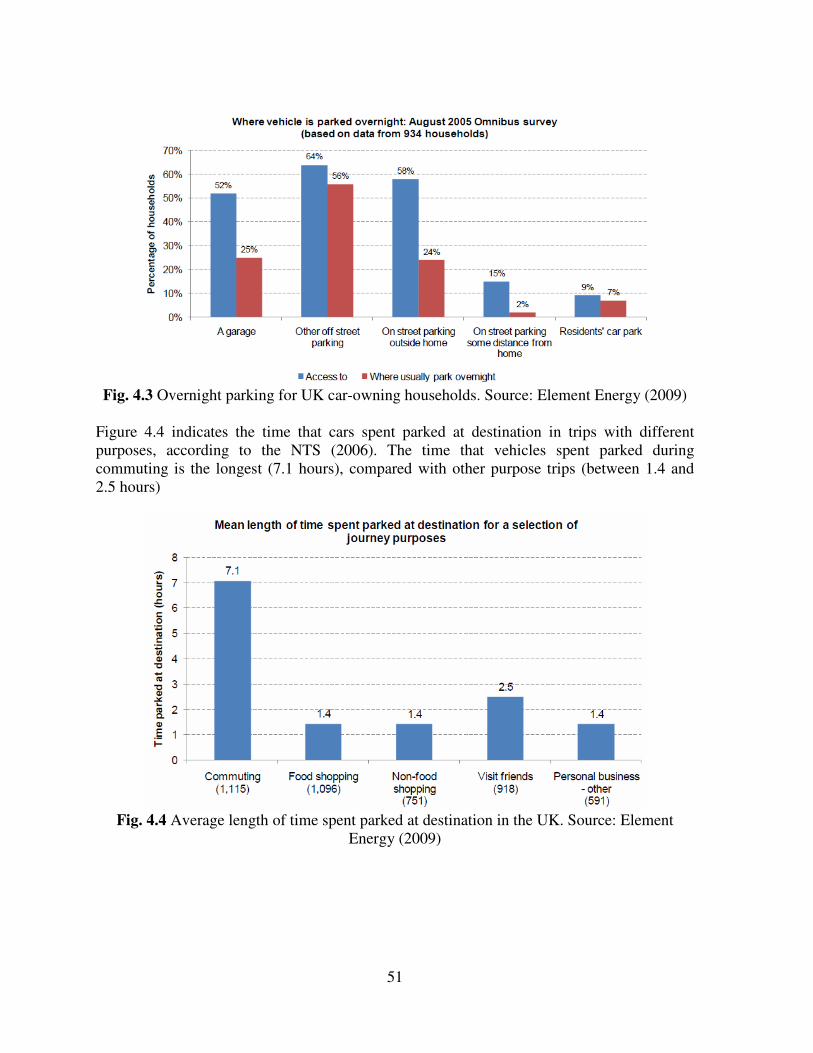
51
Fig. 4.3 Overnight parking for UK car-owning households. Source: Element Energy (2009)
Figure 4.4 indicates the time that cars spent parked at destination in trips with different purposes, according to the NTS (2006). The time that vehicles spent parked during commuting is the longest (7.1 hours), compared with other purpose trips (between 1.4 and 2.5 hours)
Fig. 4.4 Average length of time spent parked at destination in the UK. Source: Element
Energy (2009)

52
4.3. Interoperability Interoperability is the ability to charge a PEV at charging systems located in different regions or operated by different agents. Interoperability must be a fundamental feature in the PEV charging network to guarantee the mobility of PEVs, and it is a major issue that has to be taken into account in the design of charging systems for PEVs. To achieve interoperability two aspects should be addressed: standardization of the connection system and a centralized billing system. In the US standardization efforts have resulted in the J1772™ standard for connectors, developed by the Society of Automotive Engineers (SAE). In the EU, several working groups are bringing together utilities, the auto industry, the International Electrotechnical Commission (IEC) and the International Organization for Standardization (ISO) to develop a connection standard for those PEVs sold in the EU. In Japan, the Japan Automobile Research Institute (JARI) is the organization developing these standards (Markel, 2010). Nevertheless, having different standards across regions can increase the overall cost of these components, and a single standard that could be used everywhere would be preferred. A centralized billing system will also be necessary to allow electricity retailers or EVSE operators to charge for services provided to PEVs associated to other operators. With a centralized billing system, PEV users will be able to have a unique service provider and have their services charged in a single bill. 4.4. Conclusions The following conclusions will have to be considered during for the deployment of PEV charging infrastructure:
• Performing statistical studies on driving habits, private and workplace parking availability, and travel surveys is fundamental to understand the driving patterns in a specific region and to efficiently design the PEV charging infrastructure that best meets the requirements of a community.
• Deploying publicly available street recharging can play an important role to encourage the uptake of PEVs, even though for regions with general access to private parking streets might not be the location providing the largest utility to PEV users. The utility of public charging will be determined by the charging level installed.
• Interoperability of charging must be guaranteed through the development of connection standards and centralized billing.
Other findings derived from the 2009 Element Energy study for the UK are:
53
• Home private charging and workplace charging can provide the majority of passenger km, whereas the utility of public charging would be limited.
• Workplace charging will be important in expanding the role of PEVs, as commuting accounts now for 25% of annual car-km in the UK.
• The major advantage of public charging stations is that they have high visibility, encouraging uptake of PEVs. However, in many occasions vehicles are not parked at a public place for long, so the utility of this type of charging will depend on the charging level installed and the cost premium of public charging.
• With a technical range of 100 miles and a usable range ratio10 of 1.5, one half of total annual UK car-km could be driven with PEVs with home charging only.
• 80% of all car-km could be driven by PEVS with technical ranges of 200 miles and with home charging only.
Nonetheless, these results are based on statistical data on UK vehicle owners, and the conclusions can only apply strictly to the UK. Similar data could be gathered elsewhere to perform the same analyses in other regions.
10 Usable range ratio: ratio between the electric range that is actually used in a trip and the electric range that is required by the driver to travel that trip comfortably. A ratio of two implies that the driver only uses one half of the energy in the battery.

54
5. PEV Impact on the Electricity System From the perspective of the electricity grid, PEVs are new loads consuming a relatively large amount of power compared to home appliances. If electric vehicles are adopted massively, their impact on the electricity system must be studied to ensure reliability in its operation and that projected reductions in GHG emissions are achieved. The impact of PEVs on the system will be mainly influenced by the deployment rate, but will also depend on when charging takes place, as the capacity of the system to supply new demand varies during the day (different congestion levels in the cables and different costs of electricity), and also on how PEVs are clustered in the electricity network. This section reviews the potential impacts that a fleet of electric vehicles could have on the different activities that integrate the electricity system (generation, transmission, distribution and retailing) and suggests how these effects could be mitigated. 5.1. Generation 5.1.1. Capacity expansion
At least for an early stage of deployment, it is very unlikely that an expansion of generation capacity, motivated exclusively by the uptake of PEVs and the increment in electricity consumption associated with them, will be needed. The maximum generation capacity required by a system is determined by the expected maximum demand and the number of hours in a year during which this maximum demand value is reached. If the system is designed for a certain maximum capacity, the system will be prepared to supply new demand as long as the new demand is not concentrated in the hours of maximum demand of the year. Nevertheless, in order to realize the potential reductions of GHG emissions offered by PEVs, generation expansion plans will have to introduce progressively low-emitting sources of electricity that substitute for others like coal or fuel-oil with higher emissions per kWh generated. 5.1.2. Technology options
As a result of the capability of nuclear power to produce large amounts of electricity with low emissions, this technology has been chosen by many countries – such as France – to
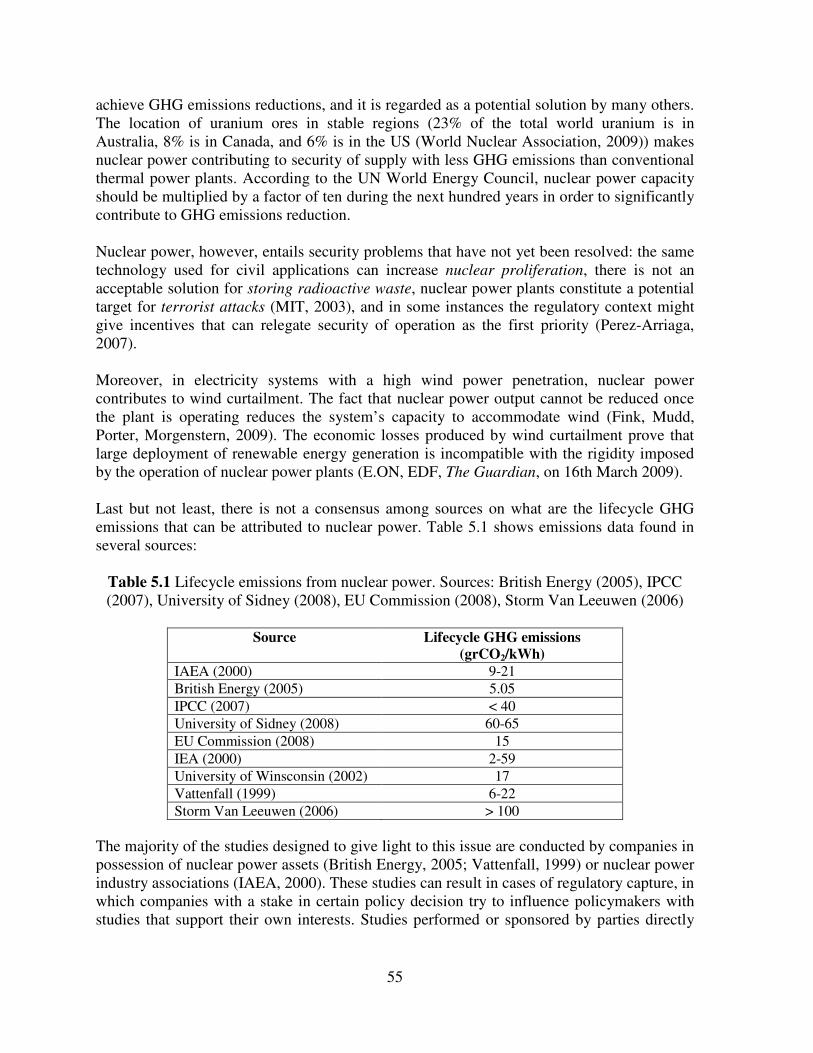
55
achieve GHG emissions reductions, and it is regarded as a potential solution by many others. The location of uranium ores in stable regions (23% of the total world uranium is in Australia, 8% is in Canada, and 6% is in the US (World Nuclear Association, 2009)) makes nuclear power contributing to security of supply with less GHG emissions than conventional thermal power plants. According to the UN World Energy Council, nuclear power capacity should be multiplied by a factor of ten during the next hundred years in order to significantly contribute to GHG emissions reduction. Nuclear power, however, entails security problems that have not yet been resolved: the same technology used for civil applications can increase nuclear proliferation, there is not an acceptable solution for storing radioactive waste, nuclear power plants constitute a potential target for terrorist attacks (MIT, 2003), and in some instances the regulatory context might give incentives that can relegate security of operation as the first priority (Perez-Arriaga, 2007). Moreover, in electricity systems with a high wind power penetration, nuclear power contributes to wind curtailment. The fact that nuclear power output cannot be reduced once the plant is operating reduces the system’s capacity to accommodate wind (Fink, Mudd, Porter, Morgenstern, 2009). The economic losses produced by wind curtailment prove that large deployment of renewable energy generation is incompatible with the rigidity imposed by the operation of nuclear power plants (E.ON, EDF, The Guardian, on 16th March 2009). Last but not least, there is not a consensus among sources on what are the lifecycle GHG emissions that can be attributed to nuclear power. Table 5.1 shows emissions data found in several sources:
Table 5.1 Lifecycle emissions from nuclear power. Sources: British Energy (2005), IPCC (2007), University of Sidney (2008), EU Commission (2008), Storm Van Leeuwen (2006)
Source Lifecycle GHG emissions
(grCO2/kWh) IAEA (2000) 9-21
British Energy (2005) 5.05
IPCC (2007) < 40
University of Sidney (2008) 60-65
EU Commission (2008) 15
IEA (2000) 2-59
University of Winsconsin (2002) 17
Vattenfall (1999) 6-22
Storm Van Leeuwen (2006) > 100
The majority of the studies designed to give light to this issue are conducted by companies in possession of nuclear power assets (British Energy, 2005; Vattenfall, 1999) or nuclear power industry associations (IAEA, 2000). These studies can result in cases of regulatory capture, in which companies with a stake in certain policy decision try to influence policymakers with studies that support their own interests. Studies performed or sponsored by parties directly
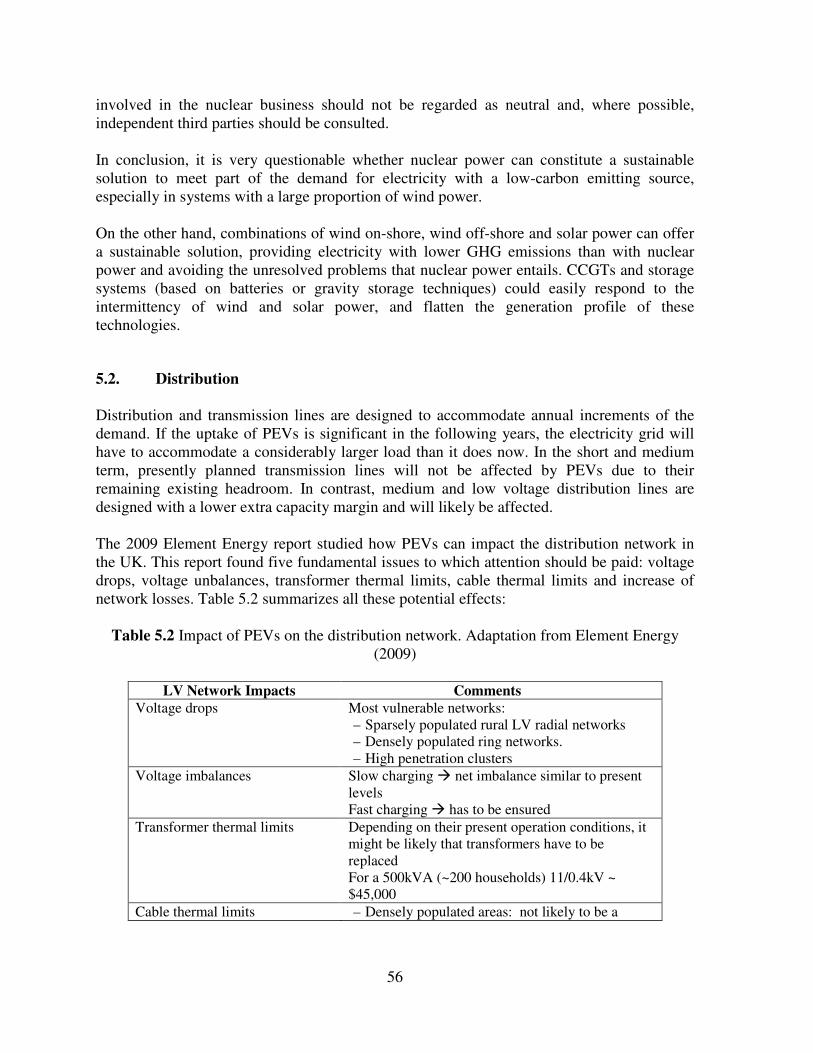
56
involved in the nuclear business should not be regarded as neutral and, where possible, independent third parties should be consulted. In conclusion, it is very questionable whether nuclear power can constitute a sustainable solution to meet part of the demand for electricity with a low-carbon emitting source, especially in systems with a large proportion of wind power. On the other hand, combinations of wind on-shore, wind off-shore and solar power can offer a sustainable solution, providing electricity with lower GHG emissions than with nuclear power and avoiding the unresolved problems that nuclear power entails. CCGTs and storage systems (based on batteries or gravity storage techniques) could easily respond to the intermittency of wind and solar power, and flatten the generation profile of these technologies.
5.2. Distribution Distribution and transmission lines are designed to accommodate annual increments of the demand. If the uptake of PEVs is significant in the following years, the electricity grid will have to accommodate a considerably larger load than it does now. In the short and medium term, presently planned transmission lines will not be affected by PEVs due to their remaining existing headroom. In contrast, medium and low voltage distribution lines are designed with a lower extra capacity margin and will likely be affected. The 2009 Element Energy report studied how PEVs can impact the distribution network in the UK. This report found five fundamental issues to which attention should be paid: voltage drops, voltage unbalances, transformer thermal limits, cable thermal limits and increase of network losses. Table 5.2 summarizes all these potential effects:
Table 5.2 Impact of PEVs on the distribution network. Adaptation from Element Energy (2009)
LV Network Impacts Comments
Voltage drops Most vulnerable networks: – Sparsely populated rural LV radial networks – Densely populated ring networks. – High penetration clusters
Voltage imbalances Slow charging � net imbalance similar to present levels Fast charging � has to be ensured
Transformer thermal limits Depending on their present operation conditions, it might be likely that transformers have to be replaced For a 500kVA (~200 households) 11/0.4kV ~ $45,000
Cable thermal limits – Densely populated areas: not likely to be a
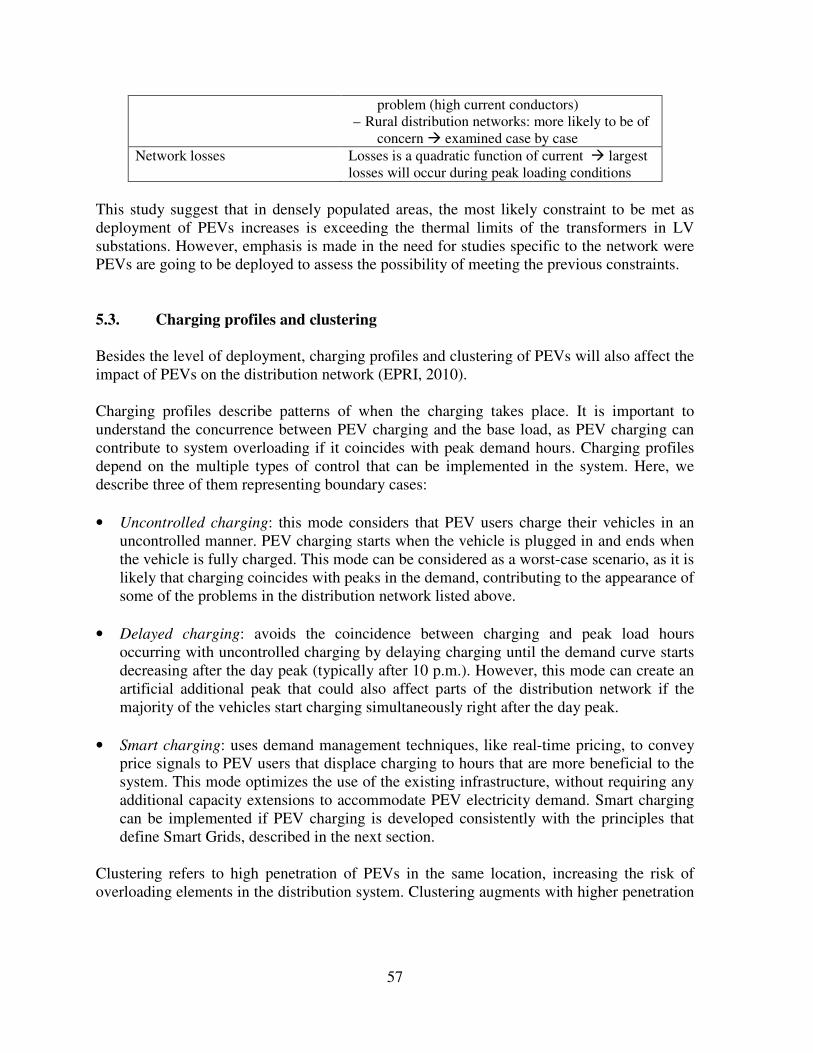
57
problem (high current conductors) – Rural distribution networks: more likely to be of
concern � examined case by case
Network losses Losses is a quadratic function of current � largest losses will occur during peak loading conditions
This study suggest that in densely populated areas, the most likely constraint to be met as deployment of PEVs increases is exceeding the thermal limits of the transformers in LV substations. However, emphasis is made in the need for studies specific to the network were PEVs are going to be deployed to assess the possibility of meeting the previous constraints. 5.3. Charging profiles and clustering Besides the level of deployment, charging profiles and clustering of PEVs will also affect the impact of PEVs on the distribution network (EPRI, 2010). Charging profiles describe patterns of when the charging takes place. It is important to understand the concurrence between PEV charging and the base load, as PEV charging can contribute to system overloading if it coincides with peak demand hours. Charging profiles depend on the multiple types of control that can be implemented in the system. Here, we describe three of them representing boundary cases:
• Uncontrolled charging: this mode considers that PEV users charge their vehicles in an uncontrolled manner. PEV charging starts when the vehicle is plugged in and ends when the vehicle is fully charged. This mode can be considered as a worst-case scenario, as it is likely that charging coincides with peaks in the demand, contributing to the appearance of some of the problems in the distribution network listed above.
• Delayed charging: avoids the coincidence between charging and peak load hours occurring with uncontrolled charging by delaying charging until the demand curve starts decreasing after the day peak (typically after 10 p.m.). However, this mode can create an artificial additional peak that could also affect parts of the distribution network if the majority of the vehicles start charging simultaneously right after the day peak.
• Smart charging: uses demand management techniques, like real-time pricing, to convey price signals to PEV users that displace charging to hours that are more beneficial to the system. This mode optimizes the use of the existing infrastructure, without requiring any additional capacity extensions to accommodate PEV electricity demand. Smart charging can be implemented if PEV charging is developed consistently with the principles that define Smart Grids, described in the next section.
Clustering refers to high penetration of PEVs in the same location, increasing the risk of overloading elements in the distribution system. Clustering augments with higher penetration

58
rates, but geographic clustering may as well occur randomly with an overall low PEV penetration based on customer adoption probabilities (EPRI, 2010). Utilities have different practices and network architecture and network attributes vary from one region to the other. Hence, assessing the likelihood of overload occurrence will require analyzing PEV uptake rate and clustering level, PEV charging habits and the existing remaining capacity in the elements integrating the electricity system. 5.4. Demand Management and Smart Grids The 2009 Element Energy study concludes that the adoption of demand management techniques have the potential to facilitate a large deployment of PEVs without the need for network reinforcement. Demand management constitutes one of the major alternatives presently available to reduce electricity consumption (Schweppe, et al., 1980). A fundamental principle of modern
economics is that prices provide the correct signals to buyers if and only if they are equal to
marginal costs (Joskow and Schmalensee, 1993:80) and, in this context, smart grids are electricity systems that enable demand response to changing electricity prices. The increasing introduction of intermittent forms of generation such as wind and solar power, require the electricity system to have extra regulation capacity (or energy reserves available) ready for those periods of time where these sources are producing at lower capacity levels. It has been empirically demonstrated that loads providing regulation (i.e.: loads that have the flexibility to be modulated) are more reliable and offer a faster response than conventional generators (Black and Ilic, 2002). In addition, if economic efficiency is to be achieved, the expansion of presently existing transmission and distribution infrastructure will have to be minimized as much as possible. Hence, since infrastructure is dimensioned according to the maximum forecasted demand, demand peaks will need to be flattened, shifting that load to less constrained time slots. For this purpose, demand response to the varying costs of network congestion is the fundamental tool to optimize the use of the network (Black and Larson, 2006). Smart grids are systems that deliver electricity from suppliers to consumers in an efficient way, through charging the consumer the actual cost of generating and transmitting electricity. The interface between utility and consumers is embodied in controlling devices such as the “energy box” concept developed at MIT (Livengood and Larson, 2009) that connects and disconnects appliances and loads according to some pre-arranged agreements between the utility and the consumer. A load aggregator can aggregate PEV loads and use real-time information on network use and electricity prices to optimally manage the times when the charging takes place.

59
Smart grids use digital communication technologies to establish the communication channel between all the agents. In this sense, smart grids are the first attempt to integrate electricity systems with telecommunication systems and information technologies. Conceptually, a smart grid system is integrated by the elements represented in the next figure:
Fig. 5.1 Smart Grid System and subsystems
The schematic flow of information and electricity is depicted below (Fig. 5.2). A distinction has been made between appliances according to their controllability. For instance, the refrigerator will need to be permanently connected if we want to avoid foodstuffs going bad, as we might also want to have the possibility of watching our favorite show on TV regardless of the time when it is broadcasted. On the contrary, other types of appliances such as PEVs, or washing machines, dryers, etc might be more flexible in terms of when they have to be operating (or charged for the case of PEVs). The use of this flexibility is at the core of the Smart Grid concept.
Smart Grid System
IT System
Consumer Behavior
Electricity System
Communication System
Demand Response Regulation
Electricity Market

60
Fig. 5.2 Sketch of a Smart Grid System representing flow of information and electricity Hence, as it was suggested above, the use of Smart Grid systems can optimize PEV charging through combining customer information (state of charge of the battery and customer driving needs) with real-time grid congestion information and electricity prices. 5.5. Conclusion Massive deployment of PEVs will have a non-negligible impact on the electricity system. Although extensive analysis of the different impacts must still be conducted, studies performed to date reveal that:
• To materialize reductions in GHG emissions by PEVs, generation expansion plans will have to progressively introduce low-emitting sources of electricity that substitute for others with higher emissions per kWh.
• The impact of PEVs on the system will be mainly influenced by the deployment rate, but charging profiles and clustering will also influence the degree of the impact of PEV deployment on the electricity system.
Electricity Market Distribution System Operator (DSO)
Load Aggregator (Utility)
Energy Box
Uncontrolable Devices - Lighting - Television - Refrigerator - Undetected Loads
-
Controlable Devices - Dishwasher machine - AC/Heating - Washing machine - PEV
-
Storage Devices - PEV
Distribution Network
Electricity System
Household
Feeder
MV/LV Transformer
61
• The assets with the lowest capacities per customer will be the most likely to be impacted by PEV adoption. This impact will most likely affect MV and LV transformers. Micro-level analysis of PEV grid impact, exploring the uptake rate of PEVs and the existing remaining capacity of assets, must be conducted to determine the impacts on specific networks.
• If PEVs reach significant volumes, management of charging time can minimize the loading effect on the transformer, minimizing the network reinforcements that would be required to avoid exceeding the thermal limits of the equipment. Joint deployment of PEVs with Smart Grid systems can optimize PEV charging avoiding potential negative impacts on the grid without the need to upgrade the infrastructure.

62
6. PEV Electricity Retailing Regulation 6.1. The Market for Specialized EV Electricity Retailers As it was discussed in the previous section, PEVs presently do not pose any significant challenge to the electricity system. However, if all the targets for electric vehicle penetration are progressively achieved, the impact of the electric vehicle fleet on the electricity system will cease to be negligible. The daily load curve of any electricity system is usually characterized by one or two peak intervals coincidental with the hours of maximum human activity and use of appliances. Hence, it is commonly understood that, if we are to achieve economic efficiency, increments in the demand would need to be supplied to the greatest extent with presently existing generation, transmission and distribution assets. This is the philosophy underlying the idea that PEVs should be charged during non-peak time intervals to avoid the necessity of having to install extra peaking capacity. However, the problem is not just limited to efficient use of generation units and charging vehicles during non-peak hours. Although the use of the transmission and distribution networks are intimately related to the power generated, there are often contingencies that might not be caused by a general increase in the demand, but by more locally concentrated phenomena. Contrarily to transmission cables that are intentionally over-dimensioned and rarely overloaded in a well-meshed network, some lower voltage cables and feeders are designed only to accommodate a restricted amount of capacity. Usually, this capacity is equivalent to the average household peak consumption multiplied by the number of households and by a safety factor. This limitation raises the issue of the optimal use of the distribution network as an essential factor to be considered when determining when the vehicles can be charged. Now, if the electric vehicle load has to be managed to efficiently use the system already in place and causing the minimum expansions possible, the question is: how can it be efficiently done in reality? The marginal price of electricity, as resulted from the settlement in the electricity market, does not reflect a marginal price for using the transmission and distribution networks. This problem could be solved by using nodal pricing (or locational marginal prices, LNP in the US terminology). Yet, nodal prices or LNP are commonly applied only to nodes in the transmission grid (Olmos and Pérez-Arriaga, 2008), and might not reflect at all technical constraints within voltage levels below 220kV.

63
Also, the use of real-time electricity price signals to shape consumer behavior can lead to confusion among consumers since marginal prices vary constantly and can differ from day to day and from season to season. This could create great difficulty in conveying to the consumer the idea that electric vehicles can be as equally available as internal combustion engines because price fluctuations might affect their charging routine. Furthermore, in many electricity systems the last unit settled in the spot market tends to be systematically the same technology throughout the day (for instance, combined cycle gas turbines being the last in the merit order). Consequently, in many countries marginal prices of electricity are not very different from hour to hour. This situation can lead to the inability of using marginal prices as a means for load shifting because of the very small values of electricity demand elasticity. Liejesen (2006) gave an approximation of -0.029 for this value. Hence, a small price difference across hours of the day would not be seen by many consumers as a high enough motivation to stop charging their vehicles at that time, and wait until the electricity price is slightly lower. This, nevertheless, does not imply that prices charged to PEVs should not consider marginal prices of electricity either as a monthly or yearly average, in rate structures, or in any other ways. If economic efficiency is to be achieved then technical constraints in low voltage networks have to be taken into account. Vehicle charging will have to jointly consider both aspects of the system. However, if marginal prices of electricity do not constitute an incentive for efficiently charging PEVs, in the absence of any coercion or special devise, consumers will tend to act in their own interest (Olson, 1982) and charge their vehicles in an uncontrolled manner. One possible way to avoid this behavior is incorporating intermediary agents that establish a link between the users and the distribution network, that manage the charging of electric vehicles. So, in order to consider technical constrains in deciding when to charge the vehicles, this management can be performed while simultaneously receiving real-time information from the distribution operation and the system operation. These agents, or electric vehicle electricity retailers (EVERs), can profit from selling electricity at a fixed price to consumers and buying electricity at the lowest possible prices. The fact that these specialized retailers would be able to manage a large fleet of vehicles would allow a multiplication of profit that otherwise would be seen as insignificant by the individual consumer, and therefore would present to the electric grid system larger overall sensitivity to electricity prices. Additionally, the storage capacity of the vehicle’s battery can be used to provide regulation services to the grid, such as primary or secondary regulation. Primary regulation controls the system’s frequency to within an established band around the nominal frequency. This service, however, is compulsory for power plants in many countries other than the US and would not be accessible to retailers in these countries without regulation changes. Secondary regulation is an ancillary service that aims to maintain the balance between generation and demand. It corrects involuntary deviations produced in the real time operation due to power exchanges with the other systems or frequency deviations from the programmed values. The
64
time scope of this service goes from 20 seconds to 15 minutes. This complementary source of revenue makes a stronger case for the need for a significant information management capacity, which could be provided by EVERs. Lastly, the deployment of charging infrastructure for the supply of electricity to PEVs will be accompanied by the upgrading of electricity installations, communication systems, and the mounting and installation of the electric vehicle supply equipment (EVSE). Specialized EVERs can provide professional expertise for this kind of installations, as well as provide with operation and maintenance services. All in all, the success of any retail competition program should be judged by the value added
it provides to consumers over and above the basic wholesale electricity service (Joskow, 2000). The existence of EVERs can be justified from this perspective. By reducing the impact of the electric vehicle load in the electricity system and making the most of the vehicle’s battery providing regulation capacity, EVERs can obtain profits that could be shared with consumers through offering more attractive tariffs than those provided by regular retailers or the electricity market. 6.2. Liberalization of the Market for Electric Vehicle Electricity Retailers In the last fifteen years, many countries have seen progressively the liberalization of their electricity sector. Vertically integrated utilities were broken up according to the different activities developed in the electricity business, namely, generation, transmission, distribution and retailing. This process of unbundling of assets and their re-allocation to independent companies led to the formation of separated businesses, in which significant cost reductions and efficiency improvements were achieved (Rothwell and Gómez, 2003). Liberalization of the electricity sector imposed that different activities were separated in independent businesses with legally separated companies and separated accounting systems. However, in practice, there are many instances in which separated businesses corresponding to different activities still remained within the same corporation. This structure favors situations in which shareholders of a distribution company are as well shareholders of the retailing company in the same corporation (Pérez-Arriaga, 2007:90-93). So, although stringent regulations are usually securing managerial independence, it is still in the interest of the distribution company that its “cousin” retailing company does well. Nevertheless, as a consequence of liberalization and enforcement of antitrust laws, new electricity retailers appeared in this market (Rothwell and Gómez, 2003). This fostered competition in this business, ultimately driving electricity prices down in the majority of the cases. Consequently, similarly to traditional retailers, competition could be fostered among EVERs. As suggested above, however, competition is not likely to appear spontaneously. Distribution companies can try to take over the retailing business and have a monopoly over it. Also,

65
specialized retailing companies can establish themselves as zonal monopolies and charge excessive connection prices. Therefore, as it will be discussed now, two sources of market power can arise in the PEV electricity supply business: distribution companies and EVERs. 6.2.1. Distribution companies’ market power
It can be expected to be against the interest of distribution companies to share the potential profits from this new business with other players that can compete with their own retailing business (or the legally independent but somehow associated retailing company mentioned above). Thus, distribution companies can be prone to exert market power usually through establishing very strict connection conditions to other retailers or simply denying them access to the distribution network. This action constitutes a case of refusal to deal (Viscusi, 2005) in which distribution companies, having monopoly over the distribution lines, would impede access to other retailers to avoid competition with their retailing business. In the US, distribution networks can be regarded as essential facilities (Pitofsky, Patterson and Hooks, 2002) and access to them has to be granted if it is proved that there exists “(1)
control of the essential facility by a monopolist; (2) a competitor’s inability practically or
reasonably to duplicate the essential facility; (3) the denial of the use of the facility to a
competitor; and (4) the feasibility of providing the facility to competitors.” (MCI Communications Co. v AT&T, 708 F.2d 1081 (7th Cir. 1982)) Therefore, in order to mitigate distribution companies’ market power, competition would need to be administered externally as well as access to the networks be secured for retailing companies. Still, utility companies are generally large well-established companies, sometimes with present or past ties with the public sector. This advantage position makes them likely to use the regulatory and coercive powers of government to shape laws and regulations in a way that is beneficial to them (Stigler, 1971). Countries with a sound Law of the Electricity Sector (LES) will encounter fewer difficulties to implement competition in this type of market than those without a well-designed regulation that clearly identifies and avoids cases of market power in the distribution business. 6.2.2. EVERs’ market power
Although apparently the activity developed by traditional retailers and EVERs is in essence the same, there are important features of electric vehicle retailing that introduces the possibility for EVERs to exert market power. One of the special characteristics of PEVs is that they constitute a “moving” load. As such, during the day electric vehicles can be parked in different places, and chances are that the charging stations used by the vehicle will belong to different retailers as locations changes. If the installation and operation of charging infrastructure is developed by different EVERs according to geographical areas (as it happens with regular electricity retailing), for each zone the corresponding specialized retailer will have a monopoly over the charging stations.

66
This situation creates a dominance position for EVERs that can lead them to practices of abuse of market power. For instance, potential actions they can take are overpricing the connection service to other retailers, or giving random access to certain retailers while restricting it to others. This action would constitute as well a case of refusal to deal (Viscusi, 2005) in which EVER companies, having monopoly over the charging infrastructure, would deny access to other retailers. 6.3. Regulation of the Market for Electric Vehicle Electricity Retailers As showed above, both distribution companies and EVERs might see an incentive to abuse their market power and benefit from the monopolistic positions they have. Therefore, the necessary rules to regulate this activity and ensure competition and non-abuse of market power in the EVER business will have characteristics similar to those of traditional retailing, but will need to account for the special features of electric vehicle electricity retailing:
• Distribution companies will have to grant access to new retailing companies to the distribution network. As previously discussed, this is one of the key issues common to traditional retailing and PEV retailing to ensure competition. Laws preventing refusal to
deal should be enforced and distribution companies should be penalized with onerous fines where non-compliance is found.
• Distribution system operators (DSOs), usually embedded in distribution companies, need to provide retailers with access to real-time network data. If EVERs are also to assume the role of managing the charging and discharging of electric vehicles depending, among others, on restrictions found in the distribution network, real-time information regarding the power flow and congestion level of each line in the network will be needed to be provided to specialized retailers. Likewise, this information will have to be accurate and true to avoid asymmetric information among competitors (Pérez-Arriaga, 2007).
• Vehicles associated with a retailing company will have to be authorized to connect to charging stations from other retailing companies. Restricting right to connection could be used as a way to attract consumers from one utility to the other. This way, retailers with a more extensive charging network would be able to provide a better service to its clients. However, if this was the case, there would always be areas where a vehicle would not be allowed to charge because the charging station or the charging spot belongs to another retailer. The fundamental service that electric vehicles provide is mobility. Thus, the right to connect should not be used as bargaining power by retailing companies to attract more consumers.
• Complementarily to the connection authorization, in order to facilitate competition, retailers will have to be able to establish a communication system that permits interoperability (remotely monitoring and operating vehicles associated to a retailer connected to other retailer’s infrastructure). One possible way of implementing such

67
system would be creating a centralized real-time database that registers where the vehicles are connected and transmits the information to the respective EVER.
• If retailing companies have a monopoly over the charging infrastructure in their own area, this gives them the freedom to set connection prices at their own arbitrage. Therefore, in order to reduce the deadweight loss produced by this situation compared to the social surplus that could be obtained if charging services were provided under competition in the same area, connection prices would need to be regulated (Viscusi, 2005). This can be done in practice by setting a price cap calculated through estimating (through benchmarking, for example) the maximum cost of providing the service and adding the expected profitability of the activity.
• Mandating that zones are served by at least two EVER companies can bring an alternative solution to avoid abuse of market power from EVERs. Having several alternatives to charge the vehicle in the same area can break the monopoly position of EVERs, as consumers would have the possibility to choose between different retailers within reasonably the same distance.
• Technical differences between charging systems can be used by EVERs to maintain their monopoly position as only vehicles with the right cable would be able to charge in the infrastructure using that system. Also, different connection systems can be perceived as an entry barrier by companies potentially interested in the EVER business. If different connection systems are used (and possibly patented), new companies would not have access to the charging infrastructure. For this reason, it is important that a connection standard is established in order to enable interoperability.
• The system operator allows participating in the regulation market according to a certain level of aggregation. If EVERs are to provide regulation services to the electricity system, EVERs will need to have access to the regulation market. However, the minimum level of aggregation shall be established in such a way that the aggregation is seen by the system operator as providing enough capacity and, at the same time, does not reduce competition among EVERs by precluding the existence of relatively small companies.
6.4. Conclusions Electric Vehicle Electricity Retailers have the potential to provide the electricity system with solutions to some of the problems that the progressive introduction of electric vehicles would bring. The EVER activity can be a profitable business that can also produce great benefits to the operation of electricity system, as well as contribute to the efficient use of the electricity grid. The adoption of this type of model can present incentives for distribution companies to try to take over the retailing business and have a monopoly over it. Also, specialized retailing

68
companies can establish themselves as zonal monopolies for supplying electricity to PEVs and abuse of their market power in their own profit. Therefore, distribution companies and EVERs themselves can arise as sources of market power ultimately impeding competition in the business. It is important that the regulator is aware of these possibilities and that he establishes the rules by which market power abuse practices in the EVER business can be avoided. Guaranteeing access to the distribution network and the recharging infrastructure and ensuring interoperability can be outlined as the fundamental targets of policies oriented to mitigate the dominant position of distribution companies and EVERs.

69

70
7. PEV Economics The objective of this section is to present different economic considerations related to the purchasing price and manufacturing costs of PEVs, and the impact that switching fuels from gasoline to electricity can have on the consumer and on the tax system. 7.1. Present market of PEVs and expected price At the present time, the auto industry and new companies specialized in battery manufacturing have plans to release new PEV models into the EU and US markets. Table 7.1 shows some of the models that are ready for sale in the dealer or that will be on-sale in the short term.
Table 7.1 Specs and expected retail price of some PEVs in the market or coming into the market
Powertrain Model Type Battery
pack (kWh) Range (mi)
Acceleration (sec/60mph)
Expected Retail Price
Tesla Model S
Sports car
42 300 5.6 $57,400
Tesla Roadster
Roadaster 53 236 3.9 $109,000
Nissan Leaf small 24 100 ~ 5.4 $32,780
Mitsubishi iMiEV
City car 16 100 13.5 $32,000
BYD e6 medium 48 200 8 $40,000
BEV
Think City small 28.3 130 20 $46,000
Prius + Hymotion
medium 5 40 9.8 $35,000 PHEV
BYD F3DM sedan 13.2 62 10.5 $21,900
Chevy Volt sedan 16 40 6 $35,000 ReEV
Opel Ampera sedan 16 37.5 9 $35,000
Comparing the expected retail price of PEVs with that of mainstream technology vehicles, one realizes that PEVs are considerably more expensive than conventional gasoline and diesel technologies. Figure 7.1 represents the cost breakdown of a PEV drive system by component and the PEV battery cost structure. Most of the additional cost is due to the high cost of the battery. This battery cost is not just the result of the material, but also capital

71
investment in battery manufacturing. Hence, battery cost depends on the production volume, and it will decrease as batteries are mass produced (Cheah and Heywood, 2010).
Fig. 7.1 Breakdown of PHEV drive system cost by component (left, F&S, 2009) and Electric
Vehicle cost structure (right, BCG 2010)
Table 7.2 and Figure 7.2 present a literature review completed by Cheah and Heywood (2010) on the additional cost of HEVs and PHEV over conventional vehicles:
Table 7.2. Hybrid/electric vehicle system cost estimates from literature. All are production cost, unless otherwise stated. Source: Cheah & Heywood (2010)
Reference Vehicle type Year Cost premium over conventional vehicle
Simpson 2006 (NREL)
PHEV10 PHEV40
“long-term” Retail price increase: +$6,300 +$11,450
Bandivadekar et al 2008 (MIT)
HEV car HEV light truck HEV car HEV light truck PHEV30 car PHEV light truck
2007 2007 2035 2035 2035 2035
+$3,500 +$4,500 +$1,800 +$2,300 +$4,200 +$5,900
Frost & Sullivan 2009 PHEV40 BEV100
2009 2009
Cost of EV drive system: $11,300-14,800 $16,900-22,300
Plotkin & Singh 2009 (Argonne)
HEV car PHEV10 car PHEV40 car HEV car PHEV10 car PHEV40 car
2015 2015 2015 2030 2030 2030
+$1,450 +$2,350 +$6,250 +$1,110 +$1,770 +$4,370
EPA/NHSTA 2009 HEV car PHEV20 car HEV light truck PHEV20 light truck
2016 2016 2016 2016
+2,760 +$16,140-16,220 +$3,280-3,460 +$14,590
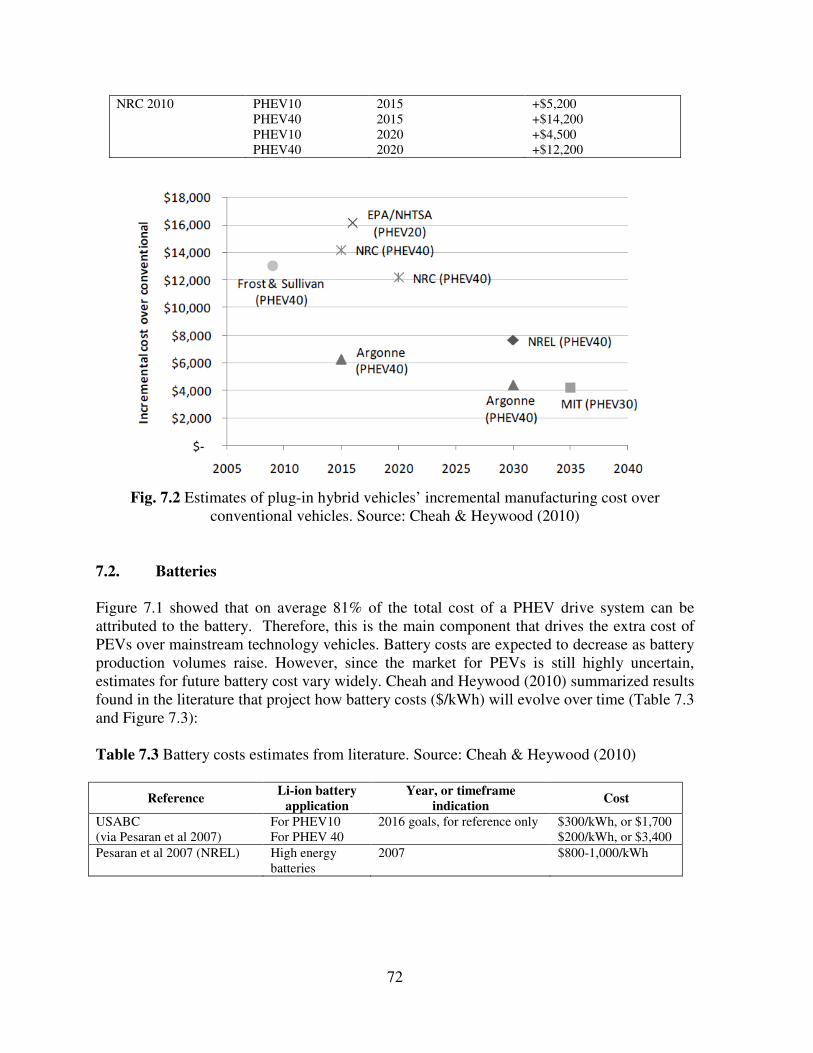
72
NRC 2010 PHEV10 PHEV40 PHEV10 PHEV40
2015 2015 2020 2020
+$5,200 +$14,200 +$4,500 +$12,200
Fig. 7.2 Estimates of plug-in hybrid vehicles’ incremental manufacturing cost over
conventional vehicles. Source: Cheah & Heywood (2010) 7.2. Batteries Figure 7.1 showed that on average 81% of the total cost of a PHEV drive system can be attributed to the battery. Therefore, this is the main component that drives the extra cost of PEVs over mainstream technology vehicles. Battery costs are expected to decrease as battery production volumes raise. However, since the market for PEVs is still highly uncertain, estimates for future battery cost vary widely. Cheah and Heywood (2010) summarized results found in the literature that project how battery costs ($/kWh) will evolve over time (Table 7.3 and Figure 7.3): Table 7.3 Battery costs estimates from literature. Source: Cheah & Heywood (2010)
Reference Li-ion battery
application Year, or timeframe
indication Cost
USABC (via Pesaran et al 2007)
For PHEV10 For PHEV 40
2016 goals, for reference only $300/kWh, or $1,700 $200/kWh, or $3,400
Pesaran et al 2007 (NREL) High energy batteries
2007 $800-1,000/kWh

73
Kalhammer et al 2007 (for ARB)
For HEV For PHEV10 For PHEV40
Low volumes (500MWh/yr) High volumes (2,500MWh/yr) Low volumes (500MWh/yr) High volumes (2,500MWh/yr) Low volumes (500MWh/yr) High volumes (2,500MWh/yr)
Ton et al 2008 (Sandia) Li-ion battery 2008 2018
$1,333/kWh $780/kWh
ARB 2009 For PHEV10 For PHEV40
Low volumes (500MWh/yr) High volumes (2,500MWh/yr) Low volumes (500MWh/yr) High volumes (2,500MWh/yr)
$480-600/kWh $340-400/kWh $450-560/kWh $320-370/kWh
Frost & Sullivan 2009 Li-ion battery 2008 2015
$700-1,000/kWh $470-510/kWh
Electrification Coalition 2009 Li-ion battery 2009 $600/kWh
Barnett 2009 (TIAX) Li-ion battery 2009 $260-700/kWh
NRC 2010 For PHEV10 For PHEV40
2010 2020 2010 2020
$1,650/kWh $1,050/kWh $1,750/kWh $1,120/kWh
BCG 2010 Li-Ni-Co-Al (NCA) battery
2009 2020
$990-1,220/kWh $360-440/kWh
Anderman 2010 For PHEVs For EVs
2015 2018-2020 2015 2018-2020
$900-1,260/kWh $675-900/kWh $500-700/kWh $375-500/kWh
Fig. 7.3 Estimates of PHEV Li-ion battery pack cost. Source: Cheah & Heywood (2010)

74
7.3. PEV sales projections The variety battery cost estimates demonstrate that the production scale for PEV is largely unknown. Sales projections also vary widely. It is out of the scope of this study to model the future uptake of PHEVs and BEVs. However, some studies have forecasted some sales figures specific to the EU in terms of sales penetration. These results are shown in Figure 7.4:
PHEV and BEV Sales Projections
0
5
10
15
20
25
30
2012 2014 2016 2018 2020 2022 2024 2026 2028 2030 2032
year
sale
s %
PHEV
BEV
Fig. 7.4 PHEVs and BEVs sales projections in the EU. Sources: BCG (2009), AEA (2009)
As it is shown in the plot, PEV adoption in the EU is not expected to start increasing until 2015 and, following this trend, in 2030 sales share of PEVs could reach roughly 21% for PHEVs and 8% for BEVs. Nevertheless, it is important to be aware that the uncertainty in PEV uptake figures is large. One important aspect to consider while developing uptake vehicle models is the fact that “consumers do not fully value the lifetime fuel expenses associated with a vehicle purchase. Instead they value fuel consumption over the first three or so years of vehicle ownership”. (Greene, German & Delucchi, 2008) Some PEV uptake forecasts use payback period models, through evaluating when the net present value (NPV) of the life of PEVs is similar to that of mainstream technology vehicles. However, consumers in general do not perform such analyses while deciding to purchase a vehicle, so it might not be the best approach to model consumer choice. On the other hand, the upfront cost of the vehicle is a very important factor that affects consumers’ final decision.

75
Figure 7.5 shows the results from a survey conducted among PEV owners and considerers performed by Element Energy (Element Energy, 2009). In this survey respondents where asked to assess the relative disutilities of PEV ownership, among which the high price of PEVs was consistently valued as the greatest uptake barrier.
Fig. 7.5 Relative importance of EV disutility factors in the UK. Source: Element Energy
2009 In a NPV analysis, the selection of one discount rate or another different will be determined by the objective of the analysis. The selection of discount rate should not be controversial as long as it is clear what the results represent (value to the consumer, change in purchase power, etc). Consequently, PEV uptake models based on NPV analyses should reflect the importance of the high upfront costs of PEVs, and carefully choose a discount rate that represents consumer behavior. 7.4. PEV pilot projects and deployment policies The higher costs of PEVs compared to gasoline technologies and the present absence of a charging infrastructure will require EU governments to support the initial deployment of PEVs. Government-supported pilot projects and tax incentives can help lower cost of ownership and build the market. Pilot projects have the potentiality to trigger a wide-scale deployment of PEVs. PEV clusters in major EU cities can demonstrate proof of concept among consumers, drive economies of scale and facilitate learning-by-doing. Table 7.4 shows a summary of the main features of some of the initiatives adopted in some EU states:
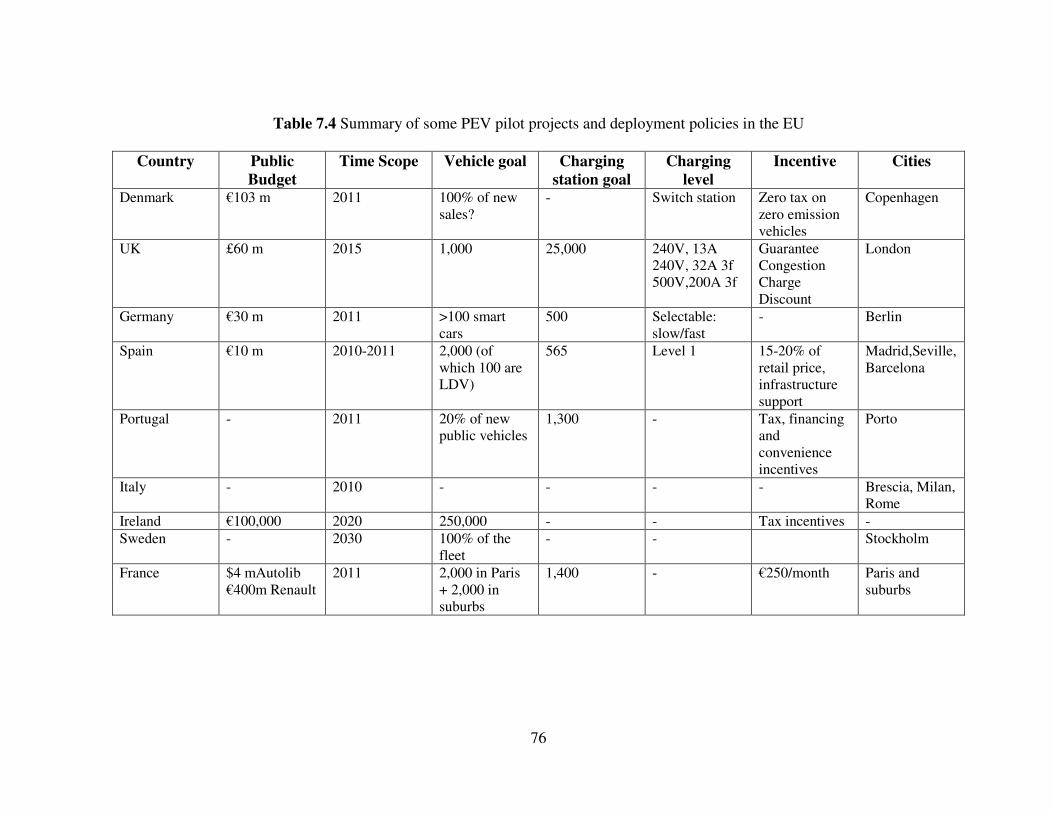
76
Table 7.4 Summary of some PEV pilot projects and deployment policies in the EU
Country Public
Budget Time Scope Vehicle goal Charging
station goal Charging
level Incentive Cities
Denmark €103 m 2011 100% of new sales?
- Switch station Zero tax on zero emission vehicles
Copenhagen
UK £60 m 2015 1,000 25,000 240V, 13A 240V, 32A 3f 500V,200A 3f
Guarantee Congestion Charge Discount
London
Germany €30 m 2011 >100 smart cars
500 Selectable: slow/fast
- Berlin
Spain €10 m 2010-2011 2,000 (of which 100 are LDV)
565 Level 1 15-20% of retail price, infrastructure support
Madrid,Seville, Barcelona
Portugal - 2011 20% of new public vehicles
1,300 - Tax, financing and convenience incentives
Porto
Italy - 2010 - - - - Brescia, Milan, Rome
Ireland €100,000 2020 250,000 - - Tax incentives -
Sweden - 2030 100% of the fleet
- - Stockholm
France $4 mAutolib €400m Renault
2011 2,000 in Paris + 2,000 in suburbs
1,400 - €250/month Paris and suburbs

77
7.5. Fuel savings Fuel cost savings over the driven lifetime of a PEV are significant. This varies by locale, depending on fuel and electricity prices. With present gasoline and electricity prices in EU27 countries, PEV adoption can bring significant economic fuel savings for consumers (Table 7.5):
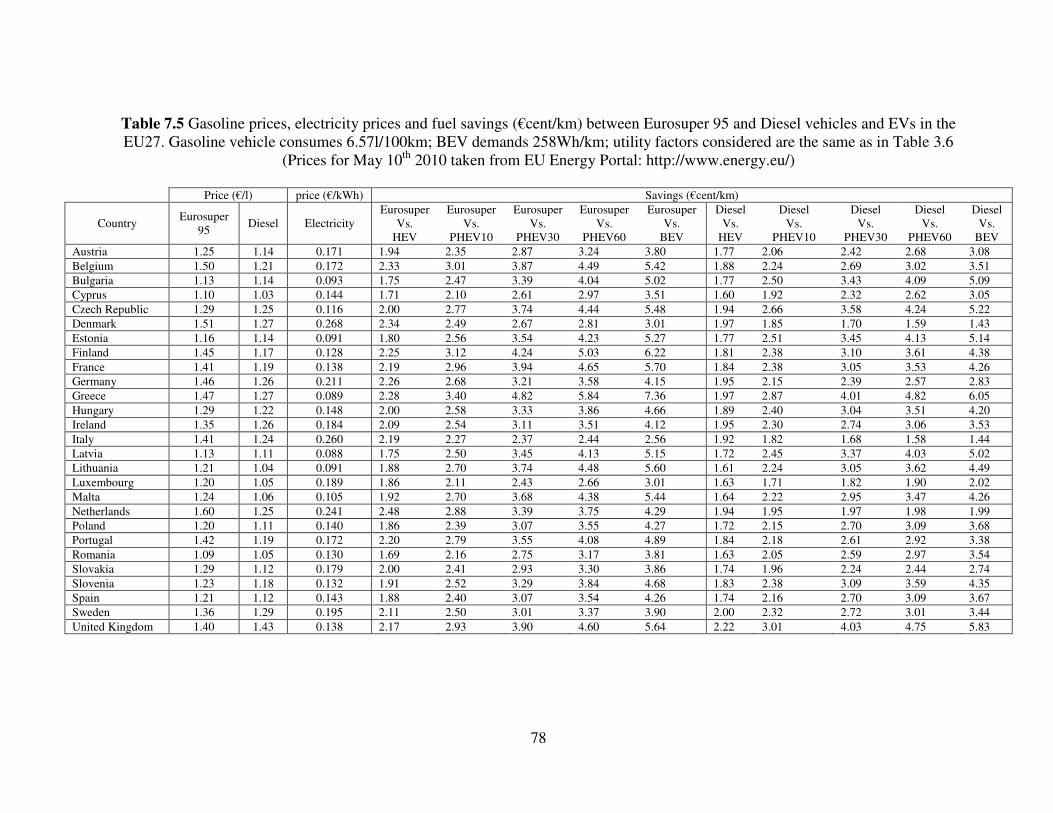
78
Table 7.5 Gasoline prices, electricity prices and fuel savings (€cent/km) between Eurosuper 95 and Diesel vehicles and EVs in the EU27. Gasoline vehicle consumes 6.57l/100km; BEV demands 258Wh/km; utility factors considered are the same as in Table 3.6
(Prices for May 10th 2010 taken from EU Energy Portal: http://www.energy.eu/)
Price (€/l) price (€/kWh) Savings (€cent/km)
Country Eurosuper
95 Diesel Electricity
Eurosuper Vs.
HEV
Eurosuper Vs.
PHEV10
Eurosuper Vs.
PHEV30
Eurosuper Vs.
PHEV60
Eurosuper Vs.
BEV
Diesel Vs.
HEV
Diesel Vs.
PHEV10
Diesel Vs.
PHEV30
Diesel Vs.
PHEV60
Diesel Vs.
BEV
Austria 1.25 1.14 0.171 1.94 2.35 2.87 3.24 3.80 1.77 2.06 2.42 2.68 3.08
Belgium 1.50 1.21 0.172 2.33 3.01 3.87 4.49 5.42 1.88 2.24 2.69 3.02 3.51
Bulgaria 1.13 1.14 0.093 1.75 2.47 3.39 4.04 5.02 1.77 2.50 3.43 4.09 5.09
Cyprus 1.10 1.03 0.144 1.71 2.10 2.61 2.97 3.51 1.60 1.92 2.32 2.62 3.05
Czech Republic 1.29 1.25 0.116 2.00 2.77 3.74 4.44 5.48 1.94 2.66 3.58 4.24 5.22
Denmark 1.51 1.27 0.268 2.34 2.49 2.67 2.81 3.01 1.97 1.85 1.70 1.59 1.43
Estonia 1.16 1.14 0.091 1.80 2.56 3.54 4.23 5.27 1.77 2.51 3.45 4.13 5.14
Finland 1.45 1.17 0.128 2.25 3.12 4.24 5.03 6.22 1.81 2.38 3.10 3.61 4.38
France 1.41 1.19 0.138 2.19 2.96 3.94 4.65 5.70 1.84 2.38 3.05 3.53 4.26
Germany 1.46 1.26 0.211 2.26 2.68 3.21 3.58 4.15 1.95 2.15 2.39 2.57 2.83
Greece 1.47 1.27 0.089 2.28 3.40 4.82 5.84 7.36 1.97 2.87 4.01 4.82 6.05
Hungary 1.29 1.22 0.148 2.00 2.58 3.33 3.86 4.66 1.89 2.40 3.04 3.51 4.20
Ireland 1.35 1.26 0.184 2.09 2.54 3.11 3.51 4.12 1.95 2.30 2.74 3.06 3.53
Italy 1.41 1.24 0.260 2.19 2.27 2.37 2.44 2.56 1.92 1.82 1.68 1.58 1.44
Latvia 1.13 1.11 0.088 1.75 2.50 3.45 4.13 5.15 1.72 2.45 3.37 4.03 5.02
Lithuania 1.21 1.04 0.091 1.88 2.70 3.74 4.48 5.60 1.61 2.24 3.05 3.62 4.49
Luxembourg 1.20 1.05 0.189 1.86 2.11 2.43 2.66 3.01 1.63 1.71 1.82 1.90 2.02
Malta 1.24 1.06 0.105 1.92 2.70 3.68 4.38 5.44 1.64 2.22 2.95 3.47 4.26
Netherlands 1.60 1.25 0.241 2.48 2.88 3.39 3.75 4.29 1.94 1.95 1.97 1.98 1.99
Poland 1.20 1.11 0.140 1.86 2.39 3.07 3.55 4.27 1.72 2.15 2.70 3.09 3.68
Portugal 1.42 1.19 0.172 2.20 2.79 3.55 4.08 4.89 1.84 2.18 2.61 2.92 3.38
Romania 1.09 1.05 0.130 1.69 2.16 2.75 3.17 3.81 1.63 2.05 2.59 2.97 3.54
Slovakia 1.29 1.12 0.179 2.00 2.41 2.93 3.30 3.86 1.74 1.96 2.24 2.44 2.74
Slovenia 1.23 1.18 0.132 1.91 2.52 3.29 3.84 4.68 1.83 2.38 3.09 3.59 4.35
Spain 1.21 1.12 0.143 1.88 2.40 3.07 3.54 4.26 1.74 2.16 2.70 3.09 3.67
Sweden 1.36 1.29 0.195 2.11 2.50 3.01 3.37 3.90 2.00 2.32 2.72 3.01 3.44
United Kingdom 1.40 1.43 0.138 2.17 2.93 3.90 4.60 5.64 2.22 3.01 4.03 4.75 5.83
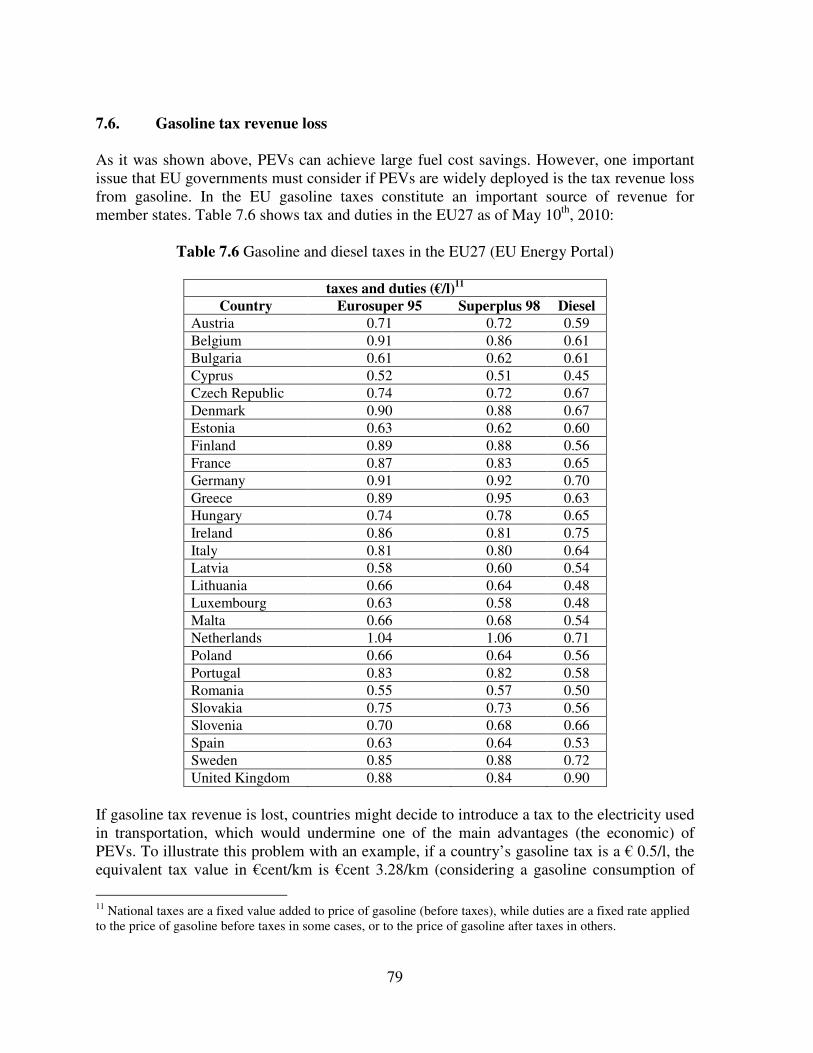
79
7.6. Gasoline tax revenue loss As it was shown above, PEVs can achieve large fuel cost savings. However, one important issue that EU governments must consider if PEVs are widely deployed is the tax revenue loss from gasoline. In the EU gasoline taxes constitute an important source of revenue for member states. Table 7.6 shows tax and duties in the EU27 as of May 10th, 2010:
Table 7.6 Gasoline and diesel taxes in the EU27 (EU Energy Portal)
taxes and duties (€/l)11 Country Eurosuper 95 Superplus 98 Diesel
Austria 0.71 0.72 0.59
Belgium 0.91 0.86 0.61
Bulgaria 0.61 0.62 0.61
Cyprus 0.52 0.51 0.45
Czech Republic 0.74 0.72 0.67
Denmark 0.90 0.88 0.67
Estonia 0.63 0.62 0.60
Finland 0.89 0.88 0.56
France 0.87 0.83 0.65
Germany 0.91 0.92 0.70
Greece 0.89 0.95 0.63
Hungary 0.74 0.78 0.65
Ireland 0.86 0.81 0.75
Italy 0.81 0.80 0.64
Latvia 0.58 0.60 0.54
Lithuania 0.66 0.64 0.48
Luxembourg 0.63 0.58 0.48
Malta 0.66 0.68 0.54
Netherlands 1.04 1.06 0.71
Poland 0.66 0.64 0.56
Portugal 0.83 0.82 0.58
Romania 0.55 0.57 0.50
Slovakia 0.75 0.73 0.56
Slovenia 0.70 0.68 0.66
Spain 0.63 0.64 0.53
Sweden 0.85 0.88 0.72
United Kingdom 0.88 0.84 0.90
If gasoline tax revenue is lost, countries might decide to introduce a tax to the electricity used in transportation, which would undermine one of the main advantages (the economic) of PEVs. To illustrate this problem with an example, if a country’s gasoline tax is a € 0.5/l, the equivalent tax value in €cent/km is €cent 3.28/km (considering a gasoline consumption of
11 National taxes are a fixed value added to price of gasoline (before taxes), while duties are a fixed rate applied to the price of gasoline before taxes in some cases, or to the price of gasoline after taxes in others.

80
6.67l/100km). If a BEV demands 258Wh/km, then electricity would need to be taxed €cent 12.73/kWh to obtain the same revenue per km as it is now obtained with gasoline. For many countries this increase would imply charging a price for electricity double to the present. It is not clear yet how this problem will be solved by EU member states, but it will have to be addressed once gasoline tax revenues reduction becomes noticeable. Ultimately, an adjustment of taxes on gasoline or electricity would change the fuel cost savings that PEVs can presently achieve.

81
82
8. Policy Recommendations This section will summarize the most important results found throughout this research, and will present a set of policy recommendations that help achieve the two primary goals of reducing GHG emissions and fuel consumption with PEVs, and deploying PEVs more effectively: GHG emissions and fuel consumption
• In order to assess the GHG emissions that can be attributed to the electricity used to charge PEVs, average emissions from electricity generation must be used, instead of marginal emissions of the electricity system.
• In the EU, PEV deployment can consistently reduce gasoline consumption and, in most cases, GHG emissions. However, PEVs will not necessarily reduce GHG emissions unless there is a less carbon intensive electricity generation portfolio. Hence, PEV deployment must be accompanied by renewable energy deployment to achieve the potential GHG emissions savings that PEVs offer.
PEV charging deployment
• Surveys and statistical analyses must be performed on driving habits, private and workplace parking availability, and travel surveys to better understand the driving patterns in a specific region to aid PEV policies, and to efficiently design the PEV charging infrastructure that best meets the requirements of a community.
• Although in regions with general access to private parking public street charging might not be the location providing the largest utility to PEV users, deploying publicly available street charging infrastructure can play an important role to encourage the uptake of PEVs.
• Interoperability should be kept as a fundamental feature of PEVs in order to enable their widespread adoption. Interoperability of charging must be guaranteed through the coordinated development of connection standards and a centralized billing system.
83
PEVs impact on the electricity system
• The assets with the lowest capacities per customer will be the most likely to be impacted by PEV adoption. This impact will most likely affect MV and LV transformers. Micro-level analysis of PEV grid impact, exploring the uptake rate of PEVs and the existing remaining capacity of assets, must be conducted to determine the impacts on specific networks.
• If PEVs reach significant volumes, management of charging time can minimize the loading effect on the transformer, minimizing the network reinforcements that would be required to avoid exceeding the thermal limits of the equipment. Joint deployment of PEVs with Smart Grid systems can optimize PEV charging avoiding potential negative impacts on the grid without the need to upgrade the infrastructure.
• Electric Vehicle Electricity Retailers (EVERs) have the potential to provide the electricity system with solutions to some of the technical problems that the progressive introduction of PEVs can bring. The electricity regulator must establish rules by which market power abuse practices in the PEV electricity retailing business can be avoided. Guaranteeing access to the distribution network and the recharging infrastructure and ensuring interoperability can be outlined as the fundamental targets of policies oriented to mitigate the dominant position of distribution companies and EVERs.
PEV economics
• PEVs’ retail prices are significantly higher than mainstream vehicles due mainly to the high cost of the battery. Moreover, PEVs require the installation of a charging infrastructure that will bring an extra cost to consumers. Government-supported tax incentives, direct subsidies and pilot projects can help lower the cost of ownership and build a market for PEVs which, in turn, can contribute to reducing costs over time.
• With present EU gasoline and electricity prices, fuel cost savings over the driven lifetime of a PEV can be significant. However, EU states can lose a significant amount of the revenue collected through gas taxes if PEVs are widely adopted. Adjustment of taxes could change this economic benefit for the consumer. Governments should take this effect into account if they decide to re-design their transportation taxation system to recover part of the revenue lost from the migration to electric powertrains.
84
References AEA Technology (2009). Market Outlook to 2022 for Battery Electric and Plug-in Hybrid
Electric Vehicles. AEA Group. AEA/ED46299/Issue 1. Didcot, Oxfordshire, UK
Autolib Project. Mairie de Paris http://www.paris.fr/portail/accueil/Portal.lut?page_id=8441&document_type_id=8&document_id=60474&portlet_id=19683
Bandivadekar, A., et al. (2008). On the Road in 2035. Reducing Transportation’s Petroleum
Consumption and GHG Emissions. Laboratory for Energy and the Environment. Cambridge, MA: MIT.
Better Place http://www.betterplace.com
Black, J. W., Ilic, M. (2002). Demand-based Frequency Control for Distributed Generation. MIT/ABB Corporation Project, Distributed Power Industry of the Future, Cambridge, MA: MIT
Black, J., & Larson, R. (2006). Strategies to Overcome Network Congestion in Infrastructure
Systems. ESD Working Paper Series, Cambridge, MA: MIT.
Bodek, C., Heywood, J. (2008). Europe’s Evolving Passenger Vehicle Fleet: Fuel Use and
GHG Emissions Scenarios through 2035. Laboratory for Energy and the Environment, MIT. Publication No. LFEE 2008-03 RP
Borenstein, S., Jaske, M., Rosenfeld, A. (2002). Dynamic Pricing, Advanced Metering and
Demand Response in Electricity Markets. Center for the Study of Energy Markets, CSEM WP 105, University of California Energy Institute, Berkeley, CA
Boston Consulting Group (BCG) (2009). The Comeback of the Electric Car? How Rea, How
Soon, and What Must Happen Next. Focus BCG. The Boston Consulting Group
Boston Consulting Group (BCG) (2010). Batteries for Electric Cars. Challenges,
Opportunities, and the Outlook to 2020. Focus BCG. The Boston Consulting Group
Bradley, S. P., Hax, A. C., Magnanti T. L. (1977). Applied Mathematical Programming. Addison-Wesley. ISBN: 978-0201004649
Caramanis, M., Foster, J. (2009). Management of Electric Vehicle Charging to Mitigate
Renewable Generation Intermittency and Distribution Network Congestion. Boston University Working Paper. Boston University, Division of Systems Engineering, Boston, MA
85
Cheah, L., Heywood, J. (2010). The Cost of Vehicle Electrification: A Literature Review. Sloan Automotive Laboratory, MIT. March 17, 2010
ChargePoint Network http://www.coulombtech.com/subscribers/
Concawe et al. (2007). Well-to-Wheels Analysis of Future Automotive. Fuels and
Powertrains in the European Context. Well-to Wheels Report, Version 2c. May 2007. http://ies.jrc.ec.europa.eu
Coulomb Technologies http://www.coulombtech.com/
Drive for Zero. Electric Vehicles are a Winning Proposition. http://www.scribd.com/doc/17341506/Drive-for-Zero-Report-on-Electric-Vehicles
Enel E-mobility http://www.enel.it/azienda_en/sala_stampa/comunicati/ss_comunicatiarticolo.asp?IdDoc=1594880
EPRI (2001). Comparing the Benefits and Impacts of Hybrid Vehicle Options. Electric Power Research Institute (EPRI), Palo Alto, CA. July 2001. Report 1000349
EPRI, NRDC (2007). Environmental Assessment of Plug-In Hybrid Electric Vehicles.
Volume 1: Nationwide Greenhouse Gas Emissions. Electric Power Research Institute (EPRI), Final Report, July 2007
EPRI (2010) Discussion of the Benefits and Impacts of Plug-In Hybrid and Battery Electric
Vehicles. Electric Power Research Institute. Massachusetts Institute of Technology, Energy Initiative symposium: “The Electrification of the Transportation System. Issues and Opportunities”. Cambridge, MA April 2010
EU Commission (2008a), Green Cars Initiative http://ec.europa.eu/research/transport/info/green_cars_initiative_en.html
EU Commission (2008b), Energy Sources, Production Costs and Performance of
Technologies for Power Generation, Heating and Transport. Commission Staff Working Document accompanying the Communication from the Commission to the European Parliament, The Council, The European Economic and Social Committee and the Committee of the Regions. Second Strategic Energy Review. An EU Energy Security and Solidarity Action Plan. Brussels, 13.11.2008 SEC(2008) 2872
EU Commission (2010). Report from the Commission to the European Parliament and the
Council. Monitoring the CO2 emissions from new passenger cars in the EU: data for
the year 2008. Brussels, 12.1.2010 COM(2009)713 final
Fink, S., Mudd, C., Porter, K., Morgenstern, B. (2009). Wind Energy Curtailment Case
Studies. National Renewable Energy Laboratory (NREL)
Greene, D.L., German, J., Delucchi, M.A. (2008). Fuel economy: The case for market failure. In: Cannon, J. & Sperling, D. (Eds.), Reducing climate impacts in the
transportation sector. Amsterdam, Netherlands: Springer
Hadley, S. W., Tsvetkova A. A. (2009). Potential Impacts of Plug-in hybrid electric Vehicles
on Regional Power Generation. The Electricity Journal 1040-6190. Elsevier
86
Heywood, J. (1988). Internal Combustion Engine Fundamentals. McGraw-Hill ISBN: 978-0070286375
Heywood, J., et al. (2009). An Action Plan for Cars: The Plocies Needed to Reduce U.S.
Petroleum Consumption and Greenhouse Gas Emissions. MIT Energy Initiative. Cambridge, MA: MIT. Library of Congress Control Number: 2009943458. ISBN: 978-0-615-34325-9
Hogan, William W. (2008). Energy in ‘Hedging Against Uncertainty: US Strategy in an
Interdependent World,’ National Strategy Forum Review, Vol. 17, No. 3. Pages 24-27.
IEA (2006), Statistics and Balances. International Energy Agency http://www.iea.org/stats/index.asp
IEA (2009), World Energy Outlook 2009. International Energy Agency. ISBN: 9789264061309
IPCC (2007). Climate Change 2007: Synthesis Report. Intergovernmental Panel on Climate Change. http://www.ipcc.ch/publications_and_data/ar4/syr/en/contents.html
Irish Department of Transport http://www.transport.ie/pressRelease.aspx?Id=30
Joskow, P., Schmalensee, R. (1983). Markets for Power, MIT Press
Joskow, P., (2005). Markets for Power in the United States: An Interim Assessment, MIT CEEPR Working Paper 2005-012
Joskow, P. (2000). Why Do We Need Electricity Retailers? or, Can You Get It Cheaper
Wholesale?, MIT
Kahn, A.E. (1988). The Economics of Regulation, MIT Press
Kromer, M., Heywood, J. (2007). Electric Powertrains: Opportunities and Challenges in the
U.S. Light-Duty Vehicle Fleet. Sloan Automotive Laboratory. Laboratory for Energy and the Environment, MIT. Publication No. LFEE 2007-03 RP
Lijesen, M. G. (2006). The Real-Time Price Elasticity of Electricity. Energy Economics, 29(2), 249-258. Elsevier
Livengood, D., Larson, R. (2009). The Energy Box: Locally Automated Optimal Control of
Residential Electricity Usage, Service Science, 2009
London Electric Vehicle Delivery Plan. Mayor of London (2009). http://www.london.gov.uk/mayor/publications/2009/docs/electric-vehicles-plan.pdf
Markel, T., Simpson, A. (2006). Plug-In Hybrid Electric Vehicle Energy Storage System
Design. Advanced Automotive Battery Conference. May 2006
Markel, T. (2010). Plug-in Electric Vehicle Infrastructure: A Foundation for Electrified
Transportation. National Renewable Energy Laboratory. MIT Energy Initiative, Transportation Electrification Symposium. Cambridge, MA, April 8, 2010.
MIT (2007). The Future of Coal. Options for a Carbon-Constrained World. An
Interdisciplinary MIT Study. Cambridge, MA. ISBN: 978-0-615-14092-6. http://web.mit.edu/coal/
87
MIT (2003). The Future of Nuclear Power. An Interdisciplinary MIT Study. MIT Energy Initiative, MIT Center for Energy and Environmental Policy Research (CEEPR). http://web.mit.edu/nuclearpower/
MIT Electric Vehicle Team (MIT EVT): http://web.mit.edu/evt/
Momoh, J. A. (2008). Electric Power System Applications of Optimization. CRC Press. ISBN: 978-1420065862
NY Times (2009). http://green.blogs.nytimes.com/2009/05/13/better-place-unveils-battery-swap-station/
Oak Ridge National Laboratory (ORNL) (2004). 2001 National Household Travel Survey. Oak Ridge National Laboratory. January 2004. http://nhts.ornl.gove/publications.shtml
Olmos, L., Pérez-Arriaga, I. (2008). A comprehensive approach for computation and
implementation of efficient electricity transmission network charges. Instituto de Investigación Tecnológica (IIT)
Olson, M. (1982). The Rise and Decline of Nations. Economic Growth, Stagflation, and Social Rigidities. Yale University Press
Parks, K., Denholm, P., Markel, T. (2007). Costs and Emissions Associated with Plug-In
Hybrid Electric Vehicle Charging in the Xcel Energy Colorado Service Territory. National Renewable Energy Laboratory (NREL). Technical Report NREL/TP-640-41410 May 2007. Golden, CO
Peças Lopes, J. A., Soares, F. J., Rocha Almeida, P. M. (2008). Identifying Management
Procedures to Deal with Connection of Electric Vehicles in the Grid. Instituto de Engenharia De Sistemas e Computadores do Porto (INESC Porto) and Facultade de Engenharia da Universidade do Porto (FEUP), Porto, Portugal
Pérez-Arriaga, I. (2007). Libro Blanco sobre la reforma del marco regulatorio de la
generación eléctrica en España, Instituto de Investigación Tecnológica (IIT), Universidad Pontificia Comillas de Madrid.
Pitofsky, R., Patterson, D., Hooks, J. (2002). The Essential Facilities Doctrine under U.S.
Antitrust Law. Untitrust Law Journal 70
Raymond, L. R. (2007). Hard Truths. Facing the Hard Truths About Energy. A
Comprehensive View to 2030 of Global Oil and Natural Gas. National Petroleum Council. US Department of Energy
Rothwell G., Gómez T. (2003). Electricity Economics. Regulation and Deregulation, IEEE Series on Power Engineering.
RWE e-mobility: http://www.rwe-mobility.com
SAEJ1711 Technical Standard. Recommended Practice for Measuring the Exhaust Emissions and Fuel Economy oh Hybrid-Electric Vehicles. Society of Automotive Engineers. March 1999 Standards.
Schäfer, A., Heywood, J., Jacoby, H., Waitz, I. A. (2009). Transportation in a Climate-
constrained World. Cambridge, Mass.: MIT Press.

88
Schweppe, F. C., Tabors, R. D., Kirtley, J. L., Outhred, H. R., Pickel, F. H., & Cox, A. J. (1980). Homeostatic utility control. Power Apparatus and Systems, IEEE Transactions on Power Apparatus and Systems, PAS-99(3), 1151-1163. Cambridge, MA
Simpson, A. (2006). Cost-Benefit Analysis of Plug-In Hybrid Electric Vehicle Technology. NREL. Conference Paper NREL/CP-540-40485. November 2006
Slater, S., et al. (2009). Strategies for the Uptake of Electric Vehicles and Associated Infrastructure Implications for the Committee on Climate Change Final Report October 2009. Element Energy. Cambridge, UK
Stigler, G. (1971). The Theory of Economic Regulation. The Bell Journal of Economics and Management Science, Vol. 2, No. 1, 1971
Storm, J.W., Smith, P. (2008). Nuclear Power : the energy balance. Available at http://www.stormsmith.nl/
Sustainable Energy Ireland http://www.sei.ie/Grants/Electric_Vehicle_R_D/
Think City (2010). http://www.thinkev.com/Press-Material/Press-releases/Zero-to-80-Percent-in-15-minutes-New-Benchmark-for-EV-Fast-charging
Vasconcelos, J. (2008). Survey of Regulatory and Technological Developments Concerning
Smart Metering in the European Union Electricity Market. Robert Schuman Center for Advanced Studies, European University Institute. Florence School of Regulators. RSCAS Policy Papers, RSCAS PP 2008/01
Viscusi, W., et al. (2005). Economics of Regulation and Antitrust. MIT Press
Webster, M., et al. (2009). Analysis of Climate Policy Targets under Uncertainty. MIT Joint Program on the Science and Policy of Global Change. Report No. 180, September 2009. Cambridge, MA
World Nuclear Association (2009). Energy Analysis of Power Systems. http://www.world-nuclear.org/info/inf11.html
http://appropriations.house.gov/pdf/PressSummary01-15-09.pdf