pluckhahn, thomas j., victor d. thompson, nicolas laracuente, sarah mitchell, amanda roberts, and...
DESCRIPTION
This report describes recent archaeological investigations of the Crystal River site (8CI1) in Citrus County, Florida. Crystal River is among the most famous sites of the Middle Woodland period (ca. 300 B.C. to A.D. 500) in the southeastern United States. However, it remains poorly understood. Investigations of the site in the early twentieth century (Moore 1903, 1907, 1918) were unsystematic and poorly documented. Subsequent work (Bullen 1951, 1953, 1965, 1966; Weisman 1985, 1987, 1995; Ellis 1999, 2004; Ellis and Martin 2003) has been more systematic, but of limited scope and in some cases also under-reported. Given the limitations of previous research, the purpose of this present study was to provide new information about the internal structure and chronology of Crystal River, while respecting the need to minimize disturbance to the site. The investigations consisted primarily of detailed topographic mapping and geophysical survey. Limited, minimally-invasive coring was also conducted to “ground truth” the geophysical data and to provide materials for relative and radiometric dating. The fieldwork for this project was conducted between June 9 and 19, 2008 under the direction of Principal Investigator Dr. Thomas Pluckhahn (University of South Florida) and Dr. Victor Thompson (University of West Florida), with the able assistance of University of West Florida graduate students and report co-authors Nick Laracuente, Sarah Mitchell, Amanda Roberts, and Adrianne Sams. The field crew included undergraduate students from the University of South Florida, the University of West Florida, Florida Gulf Coast University, and Florida State University. Chapter 1 provides context for the project. We review the environmental setting, cultural historical context, and the history of research at Crystal River. Much of this discussion is drawn from Weisman’s (1995) thorough synthesis, but we also provide new insights drawn from the reexamination of published and unpublished primary sources. In Chapter 2, we present new maps of Crystal River based on detailed topographic mapping. We also describe the grid system that was created to track past, present, and possible future investigations. Comparison of our map to those that have been produced by C.B. Moore, Ripley Bullen, and others reveals both points of similarity and difference. The results of the geophysical survey are summarized in Chapter 3. Briefly, the geophysical survey provides new insight into the composition, construction, and use of several of the mounds and off-mound areas. Mound H, for example, appears to have been expanded at least twice, each time retaining the same basic shape and proportions. In contrast, Mound K appears to have been constructed in a single episode. The geophysical survey data also confirm the presence of a plaza between Mounds G and H and the Main Burial Complex. Resistance data demonstrate that this area was kept free of the shell debris so common elsewhere on the site. Nevertheless, we noted several intriguing anomalies in the plaza that could represent features. Finally, the geophysical survey data reveal (with varying degrees of confidence) the locations of several test units excavated by Ripley Bullen, Hale Smith, and Brent Weisman. As summarized in Chapter 4, five small-diameter cores were excavated in off-mound areas of the site. These cores help clarify the nature of the Area B Midden and produced materials for relative and chronometric dating. Although the artifact assemblage from the cores is limited, they produced an extensive faunal assemblage, including a modified tooth from a large mammal (as yet unidentified to species at the time this report was completed). In the final chapter, we summarize our and previous work at Crystal River into a narrative history of the site. We also present the results of recent radiocarbon dating of materials from the site. Much remains to be learned about Crystal River, so thisTRANSCRIPT

ARCHAEOLOGICAL INVESTIGATIONS ATTHE FAMOUS CRYSTAL RIVER SITE (8CI1)
(2008 FIELD SEASON), CITRUS COUNTY, FLORIDA
by
Thomas J. Pluckhahn, Victor D. Thompson, Nicolas Laracuente, Sarah Mitchell, Amanda Roberts, and Adrianne Sams

ARCHAEOLOGICAL INVESTIGATION ATTHE FAMOUS CRYSTAL RIVER SITE (8CI1)
(2008 FIELD SEASON), CITRUS COUNTY, FLORIDA
Prepared for:
Bureau of Natural & Cultural ResourcesDivision of Recreation and Parks
Florida Department of Environmental Protection3900 Commonwealth Blvd. MS # 530
Tallahassee, Florida 32399
by
__________________Thomas J. Pluckhahn, Ph.D.
Principal Investigator
and
Victor D. Thompson, Ph.D.Nicolas Laracuente
Sarah MitchellAmanda RobertsAdrianne Sams
Department of AnthropologyThe University of South Florida4202 E. Fowler Ave, SOC 107
Tampa, FL 33620
February 19, 2009

i
ABSTRACT
This report describes recent archaeological investigations of the Crystal River site (8CI1) inCitrus County, Florida. Crystal River is among the most famous sites of the Middle Woodlandperiod (ca. 300 B.C. to A.D. 500) in the southeastern United States. However, it remains poorlyunderstood. Investigations of the site in the early twentieth century (Moore 1903, 1907, 1918) wereunsystematic and poorly documented. Subsequent work (Bullen 1951, 1953, 1965, 1966; Weisman1985, 1987, 1995; Ellis 1999, 2004; Ellis and Martin 2003) has been more systematic, but of limitedscope and in some cases also under-reported. Given the limitations of previous research, thepurpose of this present study was to provide new information about the internal structure andchronology of Crystal River, while respecting the need to minimize disturbance to the site. Theinvestigations consisted primarily of detailed topographic mapping and geophysical survey. Limited,minimally-invasive coring was also conducted to “ground truth” the geophysical data and to providematerials for relative and radiometric dating.
The fieldwork for this project was conducted between June 9 and 19, 2008 under thedirection of Principal Investigator Dr. Thomas Pluckhahn (University of South Florida) and Dr.Victor Thompson (University of West Florida), with the able assistance of University of WestFlorida graduate students and report co-authors Nick Laracuente, Sarah Mitchell, Amanda Roberts,and Adrianne Sams. The field crew included undergraduate students from the University of SouthFlorida, the University of West Florida, Florida Gulf Coast University, and Florida State University.
Chapter 1 provides context for the project. We review the environmental setting, culturalhistorical context, and the history of research at Crystal River. Much of this discussion is drawnfrom Weisman’s (1995) thorough synthesis, but we also provide new insights drawn from thereexamination of published and unpublished primary sources.
In Chapter 2, we present new maps of Crystal River based on detailed topographic mapping. We also describe the grid system that was created to track past, present, and possible futureinvestigations. Comparison of our map to those that have been produced by C.B. Moore, RipleyBullen, and others reveals both points of similarity and difference.
The results of the geophysical survey are summarized in Chapter 3. Briefly, the geophysicalsurvey provides new insight into the composition, construction, and use of several of the moundsand off-mound areas. Mound H, for example, appears to have been expanded at least twice, eachtime retaining the same basic shape and proportions. In contrast, Mound K appears to have beenconstructed in a single episode. The geophysical survey data also confirm the presence of a plazabetween Mounds G and H and the Main Burial Complex. Resistance data demonstrate that this areawas kept free of the shell debris so common elsewhere on the site. Nevertheless, we noted severalintriguing anomalies in the plaza that could represent features. Finally, the geophysical survey datareveal (with varying degrees of confidence) the locations of several test units excavated by RipleyBullen, Hale Smith, and Brent Weisman.
As summarized in Chapter 4, five small-diameter cores were excavated in off-mound areasof the site. These cores help clarify the nature of the Area B Midden and produced materials forrelative and chronometric dating. Although the artifact assemblage from the cores is limited, theyproduced an extensive faunal assemblage, including a molar from a Florida panther that was heavilyground for use as an ornament or tool.
In the final chapter, we summarize our and previous work at Crystal River into a narrativehistory of the site. We also present the results of recent radiocarbon dating of materials from thesite. Much remains to be learned about Crystal River, so this reconstruction is subject to revision. We hope that it provides a series of working hypotheses for future investigations at the site.
ii
ACKNOWLEDGMENTS
The successful completion of this project owes much to the help of a number of individualsand organizations. First and foremost, we thank Nick Robins (Park Manager, Crystal RiverArchaeological State Park) for his support of the research. For permission to work at the park, wealso thank Parks Small (Chief, Bureau of Natural and Cultural Resources), Dr. Ryan J. Wheeler(Chief, Bureau of Archaeological Research and State Archaeologist), Louis Tesar (Archaeologist,Bureau of Archaeological Research), and William Stanton (Archaeologist, Bureau of Natural &Cultural Resources).
Our stay at Crystal River was greatly facilitated by the staff of Crystal River StateArchaeological Park. We are particularly indebted to Chris (Paula) Carpenter, Jamie Gridwain, MikePetellat, and Leroy Smith. Rich Estabrook of the Crystal River office of the Florida PublicArchaeology Network provided crucial logistical support.
Grateful appreciation is also extended to the sponsors of the testing. This work wassupported, in part, by the University of South Florida Office of Research through the NewResearcher Grant Program. Additional support was provided by the Departments of Anthropologyof the University of South Florida and the University of West Florida. The Bureau of Natural andCultural Resources of the Florida Department of Environmental Protection provided space for us tocamp, for which we are also grateful.
Advice and encouragement were extended by a number of colleagues, including BrentWeisman, Nancy White, Lori Collins, and Gary Ellis. Laboratory assistance was provided by JanaFutch and Shannon McVey, graduate students at the University of South Florida.
Donna Ruhl and Irv Quitmyer were instrumental in the retrieval of radiocarbon dates frommaterial curated at the Florida Museum of Natural History. Donna was additionally helpful inproviding access to unpublished notes, photographs, and other documentation.
Finally, we are indebted to the students on the field school for their hard work and formaking our stay at Crystal River a fun and rewarding experience. Keyed to their order of appearancein the photograph on the front cover, the field crew included, on the front row, from left to right:Victor Thompson and Tom Pluckhahn; on the second row, from left to right: Adrianne Sams, SarahMitchell, Amanda Roberts, Nick Laracuente, and Brett Briggs; on the third row, from left to right:Joseph McCormack, Michelle Moretz, Stephanie Lonergan, Stephanie Nelson, and Janna Clevinger;on the fourth row, from left to right: Daniel Lowery, Shawn Westerman, Kristopher Head, and ErinRosenthal; on the fifth row, from left to right: Daren Hoffman, Jessica Stanton, and KevinHageman; and on the top row, from left to right: Robert Taylor, Jacob Rouden, and TimothyAvalos.
iii
TABLE OF CONTENTS
ABSTRACT . . . . . . . . . . . . . . . . . . . . . . . . . . . . . . . . . . . . . . . . . . . . . . . . . . . . . . . . . . . . . . . . . . . . . . i
ACKNOWLEDGMENTS . . . . . . . . . . . . . . . . . . . . . . . . . . . . . . . . . . . . . . . . . . . . . . . . . . . . . . . . . . ii
LIST OF FIGURES . . . . . . . . . . . . . . . . . . . . . . . . . . . . . . . . . . . . . . . . . . . . . . . . . . . . . . . . . . . . . . iv
LIST OF TABLES . . . . . . . . . . . . . . . . . . . . . . . . . . . . . . . . . . . . . . . . . . . . . . . . . . . . . . . . . . . . . . . vi
CHAPTER 1: INTRODUCTION . . . . . . . . . . . . . . . . . . . . . . . . . . . . . . . . . . . . . . . . . . . . . . . . . . 1Environmental Setting . . . . . . . . . . . . . . . . . . . . . . . . . . . . . . . . . . . . . . . . . . . . . . . . . . . . . . 1Culture History . . . . . . . . . . . . . . . . . . . . . . . . . . . . . . . . . . . . . . . . . . . . . . . . . . . . . . . . . . . . 5Previous Research . . . . . . . . . . . . . . . . . . . . . . . . . . . . . . . . . . . . . . . . . . . . . . . . . . . . . . . . . 14Theoretical Perspective . . . . . . . . . . . . . . . . . . . . . . . . . . . . . . . . . . . . . . . . . . . . . . . . . . . . . 16
CHAPTER 2: TOPOGRAPHIC MAPPING . . . . . . . . . . . . . . . . . . . . . . . . . . . . . . . . . . . . . . . . . 17Methods . . . . . . . . . . . . . . . . . . . . . . . . . . . . . . . . . . . . . . . . . . . . . . . . . . . . . . . . . . . . . . . . . 17Results . . . . . . . . . . . . . . . . . . . . . . . . . . . . . . . . . . . . . . . . . . . . . . . . . . . . . . . . . . . . . . . . . . . 21Summary . . . . . . . . . . . . . . . . . . . . . . . . . . . . . . . . . . . . . . . . . . . . . . . . . . . . . . . . . . . . . . . . . 35
CHAPTER 3: GEOPHYSICAL SURVEY . . . . . . . . . . . . . . . . . . . . . . . . . . . . . . . . . . . . . . . . . . . 36Methods . . . . . . . . . . . . . . . . . . . . . . . . . . . . . . . . . . . . . . . . . . . . . . . . . . . . . . . . . . . . . . . . . 36Results . . . . . . . . . . . . . . . . . . . . . . . . . . . . . . . . . . . . . . . . . . . . . . . . . . . . . . . . . . . . . . . . . . . 38Summary . . . . . . . . . . . . . . . . . . . . . . . . . . . . . . . . . . . . . . . . . . . . . . . . . . . . . . . . . . . . . . . . . 55
CHAPTER 4: CORING . . . . . . . . . . . . . . . . . . . . . . . . . . . . . . . . . . . . . . . . . . . . . . . . . . . . . . . . . . 56Methods . . . . . . . . . . . . . . . . . . . . . . . . . . . . . . . . . . . . . . . . . . . . . . . . . . . . . . . . . . . . . . . . . 56Results . . . . . . . . . . . . . . . . . . . . . . . . . . . . . . . . . . . . . . . . . . . . . . . . . . . . . . . . . . . . . . . . . . . 57Summary . . . . . . . . . . . . . . . . . . . . . . . . . . . . . . . . . . . . . . . . . . . . . . . . . . . . . . . . . . . . . . . . . 64
CHAPTER 5: SUMMARY . . . . . . . . . . . . . . . . . . . . . . . . . . . . . . . . . . . . . . . . . . . . . . . . . . . . . . . . . 66
REFERENCES CITED . . . . . . . . . . . . . . . . . . . . . . . . . . . . . . . . . . . . . . . . . . . . . . . . . . . . . . . . . . . 75

iv
LIST OF FIGURES
Figure 1-1. Location of the Crystal River site . . . . . . . . . . . . . . . . . . . . . . . . . . . . . . . . . . . . . . . . 2Figure 1-2. Location of Crystal River in relation to major physiographic sections
of the Coastal Plain . . . . . . . . . . . . . . . . . . . . . . . . . . . . . . . . . . . . . . . . . . . . . . . . . . . 3Figure 1-3. Typical vegetation in a “Shell Mound” area . . . . . . . . . . . . . . . . . . . . . . . . . . . . . . . . 4Figure 1-4. Crystal River and an Estuarine Tidal Marsh area . . . . . . . . . . . . . . . . . . . . . . . . . . . . 4Figure 1-5. Portion of the original 1847 survey plat map showing house and field immediately
east of the Crystal River site . . . . . . . . . . . . . . . . . . . . . . . . . . . . . . . . . . . . . . . . . . . 11Figure 1-6. Comparison of 1952 (top) and 1969 (bottom) aerial photographs
of Crystal River . . . . . . . . . . . . . . . . . . . . . . . . . . . . . . . . . . . . . . . . . . . . . . . . . . . . . 13Figure 2-1. Topographic mapping of Mound A at Crystal River, view to the
west-northwest . . . . . . . . . . . . . . . . . . . . . . . . . . . . . . . . . . . . . . . . . . . . . . . . . . . . . 18Figure 2-2. Topographic map of Crystal River based on total station survey . . . . . . . . . . . . . . 19Figure 2-3. “Three-dimensional” view of topography at Crystal River . . . . . . . . . . . . . . . . . . . 20Figure 2-4. Comparison of Moore's (1903) sketch of Crystal River with our
recent topographic map. . . . . . . . . . . . . . . . . . . . . . . . . . . . . . . . . . . . . . . . . . . . . . . 22Figure 2-5. Comparison of Bullen's (1966) sketch of Crystal River with our recent
topographic map. . . . . . . . . . . . . . . . . . . . . . . . . . . . . . . . . . . . . . . . . . . . . . . . . . . . 23Figure 2-6. Possible astronomical alignments of mounds at Crystal River . . . . . . . . . . . . . . . . 24Figure 2-7. Possible patterns in the alignment and spacing of mounds at Crystal River. . . . . . 25Figure 2-8. Locations of previous excavations at Crystal River . . . . . . . . . . . . . . . . . . . . . . . . . 27Figure 2-9. Topographic map of Mound A . . . . . . . . . . . . . . . . . . . . . . . . . . . . . . . . . . . . . . . . . 28Figure 2-10. Topographic map of Area B Midden . . . . . . . . . . . . . . . . . . . . . . . . . . . . . . . . . . . . 29Figure 2-11. Topographic map of the Main Burial Complex . . . . . . . . . . . . . . . . . . . . . . . . . . . . 30Figure 2-12. Topographic map of the Mound G . . . . . . . . . . . . . . . . . . . . . . . . . . . . . . . . . . . . . 31Figure 2-13. Topographic map of Mound H . . . . . . . . . . . . . . . . . . . . . . . . . . . . . . . . . . . . . . . . 32Figure 2-14. Topographic mapping of Mound H . . . . . . . . . . . . . . . . . . . . . . . . . . . . . . . . . . . . . 32Figure 2-15. Topographic map of Mounds J and K . . . . . . . . . . . . . . . . . . . . . . . . . . . . . . . . . . . 33Figure 2-16. Topographic map of the presumed plaza . . . . . . . . . . . . . . . . . . . . . . . . . . . . . . . . . 34Figure 3-1. Resistance survey in the “plaza” northwest of the Main Burial Mound
Complex, view to the southeast . . . . . . . . . . . . . . . . . . . . . . . . . . . . . . . . . . . . . . . . 37Figure 3-2. GPR survey on the summit of Mound H, view to the east-southeast . . . . . . . . . . 38Figure 3-3. Composite map of resistivity survey grids . . . . . . . . . . . . . . . . . . . . . . . . . . . . . . . . 39Figure 3-4. Resistance data from Mound G . . . . . . . . . . . . . . . . . . . . . . . . . . . . . . . . . . . . . . . . 40Figure 3-5. Resistance data from the plaza area . . . . . . . . . . . . . . . . . . . . . . . . . . . . . . . . . . . . . 41Figure 3-6. Resistance data from the area of the Main Burial Complex . . . . . . . . . . . . . . . . . . 41Figure 3-7. Resistance data from the area of Mounds J and K . . . . . . . . . . . . . . . . . . . . . . . . . 42Figure 3-8. Resistance data from the Feature B Midden area . . . . . . . . . . . . . . . . . . . . . . . . . . . 43Figure 3-9. View to the southwest of GPR Grid 5 . . . . . . . . . . . . . . . . . . . . . . . . . . . . . . . . . . . 44Figure 3-10. Locations of GPR collection grids . . . . . . . . . . . . . . . . . . . . . . . . . . . . . . . . . . . . . . 45Figure 3-11. GPR data from Grid 1, on the eastern half of the summit of Mound H . . . . . . . . 46Figure 3-12. GPR data from Grid 2, on the western half of the summit of Mound H . . . . . . . 47Figure 3-13. GPR data from Grid 3, on the ramp of Mound H . . . . . . . . . . . . . . . . . . . . . . . . . 49Figure 3-14. GPR data from Grid 4, on the summit of Mound K . . . . . . . . . . . . . . . . . . . . . . . 50Figure 3-15. GPR data from Grid 5, east of Mound A . . . . . . . . . . . . . . . . . . . . . . . . . . . . . . . . 52Figure 3-16. GPR data from Grid 6, in the Feature B Midden north of Mound A . . . . . . . . . . 53Figure 3-17. View to the north-northeast of GPR Grid 7, on the slope of Mound A . . . . . . . . 54Figure 3-18. GPR data from Grid 7, on the slope of Mound A . . . . . . . . . . . . . . . . . . . . . . . . . 54Figure 4-1. Excavation and screening of Core Sample 1, view to the north . . . . . . . . . . . . . . . 56Figure 4-2. Example of a core section . . . . . . . . . . . . . . . . . . . . . . . . . . . . . . . . . . . . . . . . . . . . . 57Figure 4-3. Locations of core samples . . . . . . . . . . . . . . . . . . . . . . . . . . . . . . . . . . . . . . . . . . . . . 58Figure 4-4. Excavation of Core Sample 3, view to the west . . . . . . . . . . . . . . . . . . . . . . . . . . . . 61

v
LIST OF FIGURES (CONTINUED)
Figure 4-5. Three views of modified mammal tooth recovered from Section 6 of Core 5 . . . 63Figure 4-6. Selected lithics and ceramics from core samples . . . . . . . . . . . . . . . . . . . . . . . . . . . 65Figure 5-1. Plot of radiocarbon dates from Crystal River . . . . . . . . . . . . . . . . . . . . . . . . . . . . . 68

vi
LIST OF TABLES
Table 2-1. Grid Locations and Elevations for Datums Employed at Crystal River . . . . . . . . . 18Table 2-2. Summary Data for Previous Excavations at Crystal River . . . . . . . . . . . . . . . . . . . 26Table 4-1. Grid Locations and Elevations for Core Samples Excavated at Crystal River . . . . 57Table 4-2. Material Recovered from the One-Quarter Inch Screening of Core 1 . . . . . . . . . . 59Table 4-3. Material Recovered from the Fine Screening of Core 1 . . . . . . . . . . . . . . . . . . . . . 59Table 4-4. Material Recovered from Fine Screening of Core 2 . . . . . . . . . . . . . . . . . . . . . . . . 60Table 4-5. Material Recovered from the One-Quarter Inch Screening of Core 3 . . . . . . . . . . 60Table 4-6. Material Recovered from the Fine Screening of Core 3 . . . . . . . . . . . . . . . . . . . . . 61Table 4-7. Material Recovered from the One-Quarter Inch Screening of Core 4 . . . . . . . . . . 62Table 4-8. Material Recovered from the Fine Screening of Core 4 . . . . . . . . . . . . . . . . . . . . . 62Table 4-9. Material Recovered from the One-Quarter Inch Screening of Core 4 . . . . . . . . . . 63Table 4-10. Material Recovered from the Fine Screening of Core 5 . . . . . . . . . . . . . . . . . . . . . 64Table 5-1. Radiocarbon Dates from the Crystal River Site . . . . . . . . . . . . . . . . . . . . . . . . . . . . 68
1
CHAPTER 1INTRODUCTION
This report summarizes recent archaeological investigations of the Crystal River site (8CI1)in Citrus County, Florida. Crystal River is among the most famous sites of the Middle Woodlandperiod (ca. 300 B.C. to A.D. 500) in the southeastern United States. The site has produced exotictrade goods in greater numbers, and of a greater variety, than any other Middle Woodland site in theregion (Brose 1979; Greenman 1938; Milanich 2007; Ruhl 1981; Seeman 1979; Weisman 1987, 1995;Willey 1966). It was also home to one of the largest civic-ceremonial constructions of this timeperiod—Mound A rises almost 10 m, with a summit once measuring more than 30 m long.
The importance of Crystal River is widely recognized—the site is designated as a NationalHistoric Landmark and preserved as a Florida State Park. However, it remains poorly understood. Early investigations by C.B. Moore (1903, 1907, 1918) were unsystematic and poorly documented. Later work by Ripley Bullen (1951, 1953, 1965, 1966) was more systematic, but also under-reported. Contemporary investigations by Weisman (1985, 1987, 1995) and Ellis (1999, 2004; Ellis et al. 2003)have contributed significant new information but have been limited in scope.
Given the limitations of previous research, the purpose of this present study was to providenew information about the internal structure and chronology of Crystal River, while respecting theneed to minimize disturbance to the site. The investigations consisted primarily of detailedtopographic mapping and geophysical survey. Limited, minimally-invasive coring was alsoconducted to “ground truth” the geophysical data and to provide materials for relative andchronometric dating.
The fieldwork for this project was conducted between June 9 and 19, 2008 under thedirection of Principal Investigator Dr. Thomas Pluckhahn (University of South Florida) and Dr.Victor Thompson (University of West Florida), with the assistance of University of West Floridagraduate students Nick Laracuente, Sarah Mitchell, Amanda Roberts, and Adrianne Sams.
The testing, which was conducted by field schools from the University of South Florida andthe University of West Florida, was sponsored by a grant from the University of South Florida NewFaculty Research Program. Institutional support was provided by the Department of Anthropologyof the University of South Florida, the Department of Anthropology of the University of WestFlorida, and the Bureau of Natural and Cultural Resources of the Florida Department ofEnvironmental Protection (FDEP). This was not a Section 106 project, since no federal monieswere expended on the research and no federal permits were required.
The remainder of this chapter is devoted to a brief sketch of the physiographic setting of theCrystal River and an outline of previous research conducted at the site. Chapter 2 describes themapping of the site . Chapters 3 and 4 describe the geophysical survey and coring, respectively. Finally, Chapter 5 syntheses these investigations and a series of new radiocarbon dates from CrystalRiver into a narrative history of the site.
Environmental SettingThe Crystal River archaeological site is located in Citrus County, Florida, approximately 3
km west and 1.5 km north of the town of Crystal River (Figure 1-1). The Crystal River, whichdirectly borders the site to the south, originates a short distance to the southeast at a series of springsin Kings Bay (FDEP 2000:14). It flows northwest for about 8 km before emptying in the Gulf ofMexico.

Figure 1-1. Location of the Crystal River site. Map source: USGS 7.5' Series Red Level and CrystalRiver, reproduced from National Geographic TOPO!.
2
¢0 2
Kilometers
Crystal River (8CI1)

3
The Crystal River site lies within whathas been described as the “Coastal Lowlands”(Cooke 1945) or “Terraced Coastal Lowlands”(Vernon 1951:17) section of the Coastal PlainProvince. These lowlands, which border theentire Florida Coast at elevations of less than30.5 m (100 ft), are widest in southern Floridabut narrow somewhat in Citrus and HernandoCounties (Cooke 1945:10). To the east of theCoastal Lowlands in the vicinity of the CrystalRiver site is the Brooksville Ridge section. Tothe west is the Coastal Swamps section.
Composed of a series of marineterraces formed as Pleistocene shorelines, theCoastal Lowlands can be described as verygently sloping plains with escarpments thatface seaward (Cooke 1945:11; FDEP 2000:10). The Crystal River site lies on the Pamlicoterrace, found at elevations less than 7.6 m (25ft) above sea level. This is the most extensiveplain in Florida, covering most of southernFlorida, as well as broad strips along bothcoasts to the north.
The Pamlico terrace is composed of sand and clayey sand, and is underlain by limestone anddolomite of Eocene and Oligocene age (FDEP 2000:10). Eight soil types have been mapped withinthe boundaries of Crystal River Archaeological State Park (FDEP 2000:10; Pliny et al. 1988). Thesecan be generally described as poorly drained to very poorly drained sands and mucks. The dominantmapped soil type on the archaeological site is Quartzipsamments, which is usually attributed tomodern earthmoving operations. While this interpretation may be partially correct, most of the soilsat the Crystal River site were created by the activities of native people during the prehistoric era(FDEP 2000:10-14).
The archaeological state park consists of 50.37 upland acres and 10.77 acres of wetlands(FDEP 2000:1). The upland environment within the park has been characterized as “shell mound”under the Florida Natural Areas Inventory System (FDEP 2000:18). This “natural” community,which is obviously anthropogenic in origin, consists of an elevated mound of mollusk shells andother aboriginal garbage on which a hardwood, closed-canopy forest develops (FDEP2000:Addendum 4) (Figure 1-3). Typical plants include cabbage palm, red cedar, hackberry, live oak,coral bean, coontie, and sageteria, among others.
The shell mounds at Crystal River, which are now covered by exotic turfgrass, were probablycreated within hydrick hammock or prairie hammock communities (FDEP 2000:18). Hydrickhammocks, examples of which still survive in the northern limits of the archaeological park, arecharacterized by a well-developed hardwood and cabbage palm forest with a variable understorygenerally dominated by palms and ferns (FDEP 2000:Addendum 4). Typical plants include cabbagepalm, diamond-leaf oak, red cedar, red maple, swamp bay, sweet bay, water oak, southern magnolia,wax myrtle, and saw palmetto. Hydrick hammocks are found on low, flat sites. Limestone outcropsare frequent. Soils are generally sandy with considerable organic material.
The extreme southwestern portion of the archaeological park is comprised of estuarine tidalmarsh (FDEP 2000:18) (Figure 1-4). These natural areas are comprised of expanses of grasses,rushes, and sedges along coastlines of low wave-energy rivers (FDEP 2000:Addendum 4). Typicalplants include saltgrass, cordgrass, rushes, marsh elder, cattail, and bulrushes. Animals characteristic
Figure 1-2. Location of Crystal River in relation tomajor physiographic sections of the Coastal Plain.

4
Figure 1-3. Typical vegetation in the “Shell Mound” area. View to the north in the vicinity of MainBurial Complex.
Figure 1-4. Crystal River and an Estuarine Tidal Marsh area. View is to the west-southwest fromthe top of Mound A.
5
of these environments include marsh snail, periwinkle, fiddler and marsh crabs, diamondbackterrapins, osprey, rails, marsh wrens, seaside sparrows, muskrat, and raccoon. Various types offishes are also common in tidal marshes.
Temperatures in Citrus County range from an average of 81/ F in summer to an average of58/ F in winter (Vernon 1951:10). High relative humidity combined with high temperature canmake for a physiological effect described as “close and muggy” (Vernon 1951:10), although this isoften moderated by afternoon rains and coastal winds. Vernon (1951:9) suggests that sharp changesin climate occur at about the latitude of the Citrus-Levy county line. Citrus County enjoys a moretropical climate, averaging about 7 in more rain per year and 20-30 additional days each year withouta killing frost.
Culture HistoryFlorida has a long history of human occupation, beginning at least 14,000 years ago. This
section provides a very general overview of human settlement in the region, beginning with theearliest definitive evidence for occupation and continuing to the historic era.
The Paleoindian Period (ca. 12,000-8000 B.C.)
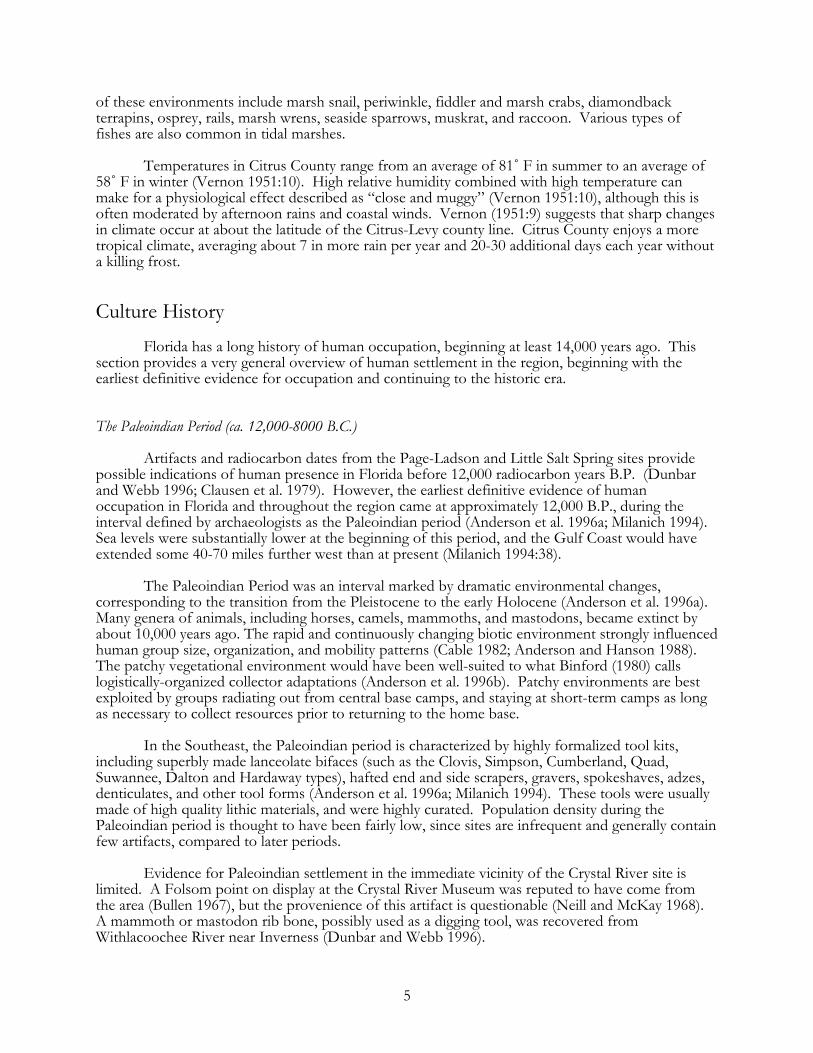
Artifacts and radiocarbon dates from the Page-Ladson and Little Salt Spring sites providepossible indications of human presence in Florida before 12,000 radiocarbon years B.P. (Dunbarand Webb 1996; Clausen et al. 1979). However, the earliest definitive evidence of humanoccupation in Florida and throughout the region came at approximately 12,000 B.P., during theinterval defined by archaeologists as the Paleoindian period (Anderson et al. 1996a; Milanich 1994). Sea levels were substantially lower at the beginning of this period, and the Gulf Coast would haveextended some 40-70 miles further west than at present (Milanich 1994:38).
The Paleoindian Period was an interval marked by dramatic environmental changes,corresponding to the transition from the Pleistocene to the early Holocene (Anderson et al. 1996a). Many genera of animals, including horses, camels, mammoths, and mastodons, became extinct byabout 10,000 years ago. The rapid and continuously changing biotic environment strongly influencedhuman group size, organization, and mobility patterns (Cable 1982; Anderson and Hanson 1988). The patchy vegetational environment would have been well-suited to what Binford (1980) callslogistically-organized collector adaptations (Anderson et al. 1996b). Patchy environments are bestexploited by groups radiating out from central base camps, and staying at short-term camps as longas necessary to collect resources prior to returning to the home base.
In the Southeast, the Paleoindian period is characterized by highly formalized tool kits,including superbly made lanceolate bifaces (such as the Clovis, Simpson, Cumberland, Quad,Suwannee, Dalton and Hardaway types), hafted end and side scrapers, gravers, spokeshaves, adzes,denticulates, and other tool forms (Anderson et al. 1996a; Milanich 1994). These tools were usuallymade of high quality lithic materials, and were highly curated. Population density during thePaleoindian period is thought to have been fairly low, since sites are infrequent and generally containfew artifacts, compared to later periods.
Evidence for Paleoindian settlement in the immediate vicinity of the Crystal River site islimited. A Folsom point on display at the Crystal River Museum was reputed to have come fromthe area (Bullen 1967), but the provenience of this artifact is questionable (Neill and McKay 1968). A mammoth or mastodon rib bone, possibly used as a digging tool, was recovered fromWithlacoochee River near Inverness (Dunbar and Webb 1996).
6
The Archaic Period (8000-1000 B.C.)
The Archaic period, which begins with the onset of the Holocene and post-glacial climaticconditions, is characterized as a long and successful adaptation based on collecting wild foods,hunting and fishing. Technology became more diversified, possibly in response to the uncertaintiesof a changing environment (Anderson et al. 1996a). Ground stone woodworking and plantprocessing implements, carved and polished stone bowls, atlatl weights, and stone pipes and beadsappear for the first time during the Archaic period. Regional differentiation in projectile points andother tool styles also occurred, suggesting territorial conscription.
The transitional period from late Pleistocene to early Holocene brought changes insubsistence strategies, which are marked archeologically by the appearance of new diagnosticprojectile point types, including many corner notched and side notched varieties such as Kirk,Wacissa, Hamilton, and Arredondo (Anderson et al. 1996a; Milanich 1994). While the increase inthe number of sites and density of artifacts on Early Archaic sites suggests an increase in populationfrom the earlier Paleoindian period, it is thought that social structure did not change significantly.
The Middle Archaic period (6000-3000 B.C.) corresponds roughly with a period of warmer,drier climate in the southeastern United States, an interval which lasted approximately 2000 years(Milanich 1994:75). In the Eastern Woodlands, subsistence strategies became increasinglydiversified, incorporating more aquatic food sources and a greater variety of small game. Populationcontinued to increase, while settlement range decreased. The transition from Early Archaic to theMiddle Archaic is characterized by an increase in the occurrence of stemmed points, and by anincreased incidence of bone and ground stone tools, including atlatl weights, axes, and grindingimplements (Chapman 1975, 1977; Coe 1964; Milanich 1994). Projectile points diagnostic of theMiddle Archaic in Florida include the Newnan, Putnam, Levy, Marion, and Alachua types (Bullen1975; Daniel and Wisenbacker 1987; Milanich 1994:76)
During the Late Archaic period (3000-1000 B.C.), regional population appears to havegrown markedly. By the end of this interval essentially modern vegetational conditions hadappeared. Shifts in subsistence and technology continue to be evident during the Late Archaicperiod. The first evidence of horticulture (including the cultivation of squash, sunflower, andchenopodium) appears in Late Archaic contexts in some parts of the Southeast (Cowan 1985;Gremillon 2002, 2003; Scarry 2003). In Florida, however, subsistence focused primarily on marineand riverine resources such as mollusks and fish, supplemented by hunting and gathering ofterrestrial resources. Large shell midden complexes are found in many areas of the state (Milanich1994:85; Russo 1991).
Grinding implements and polished stone tools are more common in Late Archaicassemblages, suggesting increased use of plant resources, possible changes in cooking technologies,and increased sedentism. The range and diversity in projectile point forms are greatest during theLate Archaic and Early Woodland periods, possibly reflecting dramatic changes occurring insubsistence technologies and social structure. Projectile point forms include an assortment of largepoints with straight, contracting, or expanding stems, as well as smaller stemmed and side-notchedtypes (Milanich 1994:85-104).
The first pottery in North America, consisting of crude bowls, was produced in some partsof the Southeast around 2500 B.C. (Claflin 1931; Sassaman 1993). Fiber tempered pottery appearsfor the first time in the archaeological record for Florida around 2000 B.C. (Milanich 1994:86). Inthe Tampa Bay area, both plain and decorated fiber tempered pottery occur in Late Archaic contextsin association with Culbreath and Lafayette points (Daniel 1982; Milanich 1994:100-101)

7
The Woodland Period (1000 B.C.-A.D. 900)
The Woodland period in the Southeast is generally characterized by increased use ofceramics, greater reliance on horticulture, widespread ceremonialism, and increased permanence ofoccupation (Anderson and Mainfort 2002). As with the Archaic, the Woodland is typically dividedinto Early, Middle, and Late sub-periods.
The Early Woodland period (1000 - 200 B.C.) represents a transition from the Archaicperiod (Anderson and Mainfort 2002). Horticulture was practiced on a small scale in much of theSoutheast, but the gathering of wild foods (especially marine fish and shellfish) continued todominate subsistence strategies in Florida. The replacement of fiber with sand and grit for temperenabled potters to create larger vessels that were better suited to direct cooking. Pottery of theDeptford series, which is found in the earliest occupation levels at Crystal River, first appearedaround 500 B.C. and continued in use until around A.D. 200 (Milanich 1994:114).
During the Middle Woodland period, the decorations on pottery grew more elaborate.Pottery of the Santa Rosa-Swift Creek series gradually replaced Deptford during the MiddleWoodland period on the Gulf Coast (Milanich 1994; Willey 1949a). Swift Creek pottery is, in turn,gradually replaced by the Weeden Island series. Ceramics of all of these series are found at theCrystal River site, suggesting intensive occupation over the course of the Middle Woodland period.
Economic and religious influence from Hopewell cultures of the Mississippi and Ohio Rivervalleys entered portions of the Southeast during the Middle Woodland period (Caldwell 1958;Jefferies 1976). Small villages—often with burial mounds—are found along the Gulf Coast and themajor streams of the interior (Willey 1949a). Crystal River is the largest Hopewell-related settlementin Florida, and one of the largest in the Southeast.
A new cultigen, maize, was introduced sometime during the Woodland period (Gremillon2002, 2003; Scarry 2003). However, there is no definitive evidence for maize in Woodland contextsin Florida. The crop apparently did not gain prominence until the Mississippian period, and thenonly in the northern part of the state.
Our knowledge about life during the Late Woodland period (A.D. 500-1000) is limited bythe general sparsity of sites and the additional scarcity of investigations focusing on this period(Anderson and Mainfort 2002). This lack of information affects our understanding of subsistence,ceremonial life, social and political structure. In much of the Southeast, the Late Woodland wasmarked by a decline in mound construction and a deterioration of long distance trade. However,such does not appear to have been the case with the Weeden Island cultures of the Gulf Coast,where mound construction continued into the Late Woodland.
Weeden Island pottery continued to be manufactured into the Late Woodland period alongthe Gulf Coast. The Weeden Island phase on the northern peninsular Gulf Coast remainsundefined (Milanich 1994:205-215). In contrast with Weeden Island cultures immediately to thesouth (Manasota) (Luer and Almy 1982) and to the interior (Cades Pond) (Milanich 1994:228), thepottery from Weeden Island sites in this area (including Crystal River) is primarily limestonetempered (Bullen 1953).
The Mississippian Period (A.D. 1000-1540)
Of all the Native American societies that were present before the arrival of Europeans, thoseof the late prehistoric period in the American South are widely acknowledged by archaeologists asthe most socially and politically complex (Hudson 1976). Archaeologists refer to this era of politicaldevelopment as the Mississippian period (A.D. 1000 to 1540) and to these societies as chiefdoms. Mississippian chiefdoms were characterized by a ranked social hierarchy, in which social status was

8
determined largely by the closeness of relation to the chief. Chiefs themselves inherited theirpositions and were considered semi-divine, a belief they reinforced through the manipulation oficonographic symbols inscribed on exotic materials. Commoners paid tribute to the chief, in theform of labor, staple goods, or craft items. At world-famous archaeological sites such as Cahokia inIllinois, Moundville in Alabama, and Etowah in Georgia, enormous earthen mound complexes builta basketful of dirt at a time stand as testament to the power of generations of Mississippian chiefs(Hudson et al. 1985).
The Mississippian period on the Peninsular Gulf Coast is defined as the Safety Harborcomplex, after a site on Tampa Bay (Griffin and Bullen 1950; Willey 1949a). Mitchem (1989) hasmore recently divided the Safety Harbor period into two prehistoric phases: Englewood (A.D. 900-1100) and Pinellas (A.D. 1100-1500). Ceramics associated with these phases are primarily limestone-tempered plain, along with some sand tempered plain, St. Johns Plain and Check Stamped, and cord-marked pottery (Milanich 1994:392). In contrast with elsewhere in the Mississippian Southeast, andeven with the Safety Harbor complex in the Tampa Bay region, settlement during this period invicinity of Crystal River was relatively dispersed and included little mound construction. Subsistencecontinued to favor the gathering of wild resources over horticulture.
The Historic Period (1492-present)
After Columbus “discovered” the New World in 1492, the conquest of Hispaniola, Cuba,and other Caribbean Islands was completed in roughly another twenty years (Hudson 1997:32). Juan Ponce de León sighted the eastern coast of the continent of North America on Easter (PascuaFlorida) of 1513, and thus named the land “La Florida.” León returned to La Florida in 1521 andattempted to found a colony somewhere in the vicinity of Charlotte Harbor. However, the colonyquickly failed and León was mortally wounded.
As the native populations of the Caribbean colonies declined due to the introduction of OldWorld diseases, the Spanish looked north to La Florida for slave labor (Hudson 1997:32). In 1528,Pánfilo de Narváez led another effort to establish a colony in La Florida. Narváez’s fleet overshotthe entrance of Tampa Bay and landed near present-day John’s Pass (Hudson 1997:37). He and hisarmy of 40 horsemen and 260 footmen marched northward, paralleling the Gulf Coast until theyeventually reached the Apalachee chiefdom in northern Florida. After encountering fierce resistancefrom the Apalachee, Narvaez and his men retreated again to the coast and built boats to sail toMexico. Several of the boats were lost at sea, but others eventually made it as far as the Texas coast. Cabeza de Vaca and three others managed to walk west to Mexico, enduring years of extremehardship.
Spanish explorer Hernando de Soto landed on the south side of Tampa in 1539 (Hudson1997). His expedition of about 600 men (as well as a number of horses, dogs, and pigs) passed wellto the east of Crystal River as it moved north into the interior of the Southeast. Soto movedbetween many of the larger chiefdoms in the Southeast in search of riches and, more practically,food to feed his army. The expedition ended in failure in 1542 when Soto died somewhere near theMississippi River. The remaining members of the expedition (about half of the original party) builtboats and sailed down the Mississippi River and across the Gulf of Mexico to the Spanishsettlements in Mexico.
Spanish interest in the colonization of La Florida declined sharply following the failure ofthe Soto expedition (Tebeau 1971:25). Finally, in 1559, Tristán de Luna y Arellano led an attempt toestablish a colony near present-day Pensacola (Tebeau 1971:26). The attempt was marked bycalamity almost from its inception, as several ships were lost in stormy seas en route to La Florida. The colony lasted only a few short years before it was abandoned.
9
French attempts at establishing a settlement in La Florida faired little better than those of theSpanish. In 1562, Jean Ribault established a small garrison (Fort Charlotte) on a bluff above the St.Johns River (Tebeau 1971:29). Fire and mutiny destroyed the fort and foiled this attempt. Twoyears later, the French founded another garrison under the leadership of René Goulaine deLaudonniére. Fort Caroline lasted only about a year before it was attacked by Spanish forces led byPedro de Menéndez de Avilés (Tebeau 1971:32). Menéndez renamed the fort San Mateo.
Menéndez was charged with establishing Spanish settlements in strategic locations in LaFlorida and with Christianizing the natives (at least partly for the purpose of making allies of them)(Tebeau 1971:32). However, of the settlements founded under the direction of Menéndez, only St. Augustine would survive.
Florida’s Mission era lasted from 1567 to 1705 (Hann 1996:78). Over the course of thisperiod, missions were attempted or established among at least 11 distinct Native American peoplesat about 80 mission centers. The mission system peaked by the mid 1630s, when 44 missions wereactive across northern Florida and southern Georgia. The lack of settlers at most of the Floridamissions, coupled with the absence of close supervision by the Crown, spared the native peoples ofFlorida from some of Spain’s most expoitative colonial institutions. Nevertheless, the nativepopulations of Florida and most of the Southeast experienced dramatic declines in population soonafter European contact (Smith 1987). Mitchem (1989) has defined the Tatham (1500-1567) andBayview (1567-1725) phases of the Safety Harbor period to describe the material culture of thenative peoples who remained in the Tampa Bay area.
Many of the missions were abandoned in the 1650s, when a series of epidemics struck thenative peoples of the region (Hann 1996:92). Indian revolts in 1656 dealt a further blow to themissions. The establishment of Charleston in 1670 brought a new threat from Indian groups alliedwith the British, culminating with the complete destruction of the Spanish mission system in 1704-1705.
With the settlement of Georgia in the contested lands between Florida and Carolina in 1733,the English seriously challenged Spanish control of Florida (Arnade 1996:109-111; Tebeau 1971:67). General James Oglethorpe led intermittent attacks against the Spanish settlements along the AtlanticCoast, but never managed to take St. Augustine (Tebeau 1971:67-70). However, in 1763 the Britishachieved through diplomacy what they had been unable to accomplish through direct military action. Under the terms of the Treaty of Paris negotiated to conclude the French and Indian War, Spainceded Florida in exchange for Havana, which had been captured by the British (Tebeau 1971:72-73).
Anxious to attract settlers, the British government quickly began issuing land grants of up to20,000 acres (Tebeau 1971:80). Development was generally slow, however, as many of the grantswere obtained for speculation rather than settlement. In addition, there was competition for settlersfrom other, more favored, areas like Carolina and Georgia (Fabel 1996:136; Tebeau 1971:80). Nevertheless, large and prosperous plantations were established in eastern Florida (Tebeau 1971:81). With the support of slave labor, these plantations produced rice, indigo, oranges, and turpentine.
Hitchiti-speaking Lower Creek Indians from southern Georgia and Alabama began movinginto Florida in the 1700s, first at the invitation of the Spanish and later as allies of the English(Mahon and Weisman 1996:187-188; Tebeau 1971:152). Muscogean-speaking Upper Creeks firstmigrated to the region in 1767. In the period of British rule, these disparate groups came to bereferred to as Seminoles, but they retained many Creek traditions.
The conclusion of the American Revolution in 1783 returned Florida to Spain (Tebeau1971:89). However, the second Spanish occupation, lasting from 1784 to 1821, was only nominally Spanish. English influence was difficult to remove, and land-hungry citizens of the United Statesmoved into Florida with the expectation that it would eventually become part of that country (Coker
10
and Parker 1996:161; Tebeau 1971:89). In addition, Spain was distracted by both wars in Europeand among its colonies in the Americas (Tebeau 1971:103).
Under the ineffectual rule of the Spanish, Florida became a refuge for runaway slaves,renegade white Americans and Indians, and foreign adventurers and pirates (Tebeau 1971:115). The situation precipitated General Andrew Jackson’s invasion of Spanish Florida in 1817-1818, nowknown as the First Seminole War (Tebeau 1971:151). In an attempt to recapture slaves living amongthe Seminole, Jackson and his men burned a number of villages. They also seized Pensacola fromthe Spanish.
In 1821, Spain ceded Florida to the United States. President James Monroe offered thegovernorship of the Florida territory to Andrew Jackson (Tebeau 1971:117). Although a singleterritory, administration was divided between Pensacola and St. Augustine until a new capitol wascreated between the two cities at Tallahassee in 1824 (Schafer 1996:210; Tebeau 1971:122). The siteof a former Indian town, there were few or no whites living at Tallahassee at the time.
Acquisition of Florida by the United States led to increased conflict between white settlersand Indians, especially in north-central Florida (Tebeau 1971:151). Under the terms of the Treaty ofMoultrie Creek negotiated in 1823, four million acres north of Charlotte Harbor and south of Ocalawere set aside for the Seminoles (Tebeau 1971:154). The Indians received compensation for thelands they abandoned in northern Florida. For their part, the Seminoles agreed to prevent thereservation from becoming a haven for runaway slaves.
Even before the treaty went into effect, the U.S. government had begun moving toward aposition favoring general Indian removal to lands west of the Mississippi (Tebeau 1971:151). Withthe election of Andrew Jackson to the presidency in 1829, proposals for Indian removal receivedofficial support (Tebeau 1971:156). Under the terms of the Treaty of Payne’s Landing, the Seminolesagreed to move west. However, the treaty was signed by only a small number of Seminole chiefs,and several of these later repudiated their action.
Small-scale skirmishes between Seminoles and white settlers began in earnest in 1835. TheSecond Seminole War, lasting from 1835 to 1842, was fought principally in eastern and centralFlorida (Tebeau 1971:125). Osceola emerged as the leader of the Seminoles, but was captured undera flag of truce in 1837 (Mahon and Weisman 1996:193; Tebeau 1971:125). Osceola died of malaria inconfinement at Fort Sumter, South Carolina, the following year (Tebeau 1971:164). Fightingdragged on until an informal truce was negotiated in 1842. While most of the surviving Seminoleswere removed to Indian territories in the West, a number disappeared into the Everglades and theBig Cypress swamp (Mahon and Weisman 1996:201; Tebeau 1971:170).
A bill to admit Florida as a state was passed by Congress and signed by President Tyler in1845 (Tebeau 1971:131). It was only 16 years, however, before Florida seceded from the Union andentered the Civil War on the side of the Confederacy. Although a sizable proportion of Floridiansopposed the War, and although desertion had become very common by 1864, Florida provided theConfederacy with two important commodities—salt and cattle (Brown 1996:239-241; Tebeau1971:232). Although military actions in Florida were limited, the state suffered many of the samedeprivations as the rest of the Confederacy during the war and throughout Reconstruction (Brown1996; Shofner 1996).
Settlement of Florida by non-native peoples increased after statehood and accelerated greatlyafter the Civil War (Kendrick and Walsh 2007:5). There was initially little or no industry in the state,so early settlers began clearing the forests for farming and cattle raising. Turpentine operators andloggers arrived gradually.

11
The 1847 survey plat map shows afew houses and fields in the vicinity ofCrystal River (Figure 1-5) (FDEP 2003;Dunn 1977:25). Several of the landownersare identified by name, including PatrickMcFeely, Neil Ferguson, and John Beggs. The latter appears to have owned theproperty immediately east of the CrystalRiver site. The survey plat shows a houseand field that probably stood somewherein the vicinity of the park ranger’s home.
By 1870, the population of CitrusCounty reached 2098 (Dunn 1977:74). By1885, the population had expanded to4260. An 1882 guide to Florida notedCrystal River as one of the principal “littlefarming or lumbering settlements” of theGulf Coast (Barbour 1964 [1882]:147). Cotton, vegetables, and cedar pencil woodwere the principal exports from CrystalRiver in the later 1880s (Dunn 1977:92).
Citrus County was created by the Legislature on June 2, 1887 (Vernon 1951:11). Thecounty, which was formed from a part of Hernando County, reportedly took its name from anabundance of fruit groves in the area, particularly in the northern latitudes along the coast. After ahard freeze in the winter of 1894-1895 dealt a serious blow to the burgeoning citrus industry(Hughes n.d.), the dead trees were removed to make more room for cattle.
Mannfield (south of present-day Lecanto), named for State Senator Austin Mann, served as atemporary county seat (Hughes n.d.). After some debate, the county seat was moved to Inverness in1891. In 1889, a railroad line was built from Ocala through Crystal River to Homosassa (Dunn1977:30). The town of Crystal River was officially incorporated in 1903 (Hughes n.d.).
As described in more detail in the section that follows, C.B. Moore visited the Crystal Rivermounds for the first time in 1903. The property was then “...on property under the control of Mr.R.J. Knight of Crystal River” (Moore 1903:379). Dunn (1971:91) mentions that Knight purchasedproperty in the town of Crystal River in 1900. Knight’s wife was the daughter of Dr. and Mrs. J.B.Bennet, who built the Crystal River Inn in 1898.
Hard rock phosphate was discovered near Dunnellon in 1889 (Dunn 1977:109-113). Overthe next two decades, phosphate mining became one of the principal industries in the area. By 1909,there were 34 phosphate plants operating in Citrus County. The new communities that formedaround this industry were said to resemble the gold-rush towns of the western U.S. in regard tolawlessness and vice. Much of the phosphate mined in the region was exported to Germany for useas fertilizer (Hughes n.d.). The industry declined with the outbreak of World War I, when trade withGermany was suspended. The later discovery of phosphate near Tampa furthered this decline.
Tourism began to increase in Florida after World War I, when more automobiles becameavailable (Wynne 1999). The Tin Can Tourists Association formed in Tampa in 1919. The Dixie(or “Miami to Montreal”) Highway was completed in 1915, and the Tamiami Trail was finished in1928. By 1930, Florida had 3000 miles of paved roads. New hotels appeared in Crystal River in the1920s to serve the tourist industry, including the Dixon Hotel, the Willis House, and the CrystalRiver Inn (Hughes n.d.).
Figure 1-5. Portion of the original 1847 survey platmap showing house and field immediately east of theCrystal River site. Reproduced from FDEP (2003).

12
By the late 1920s, however, the boom was over in Citrus County and Florida in general(Tebeau 1971:385). During the Great Depression, as much as 40 percent of the population of someFlorida counties was receiving direct relief (Tebeau 1971:401). On the bright side, New Dealprograms led to dramatic improvements in infrastructure, including the construction of over 800public buildings, as well as numerous roads, and bridges (Rogers 1996:317). World War II hastenedthe end of the Depression in Florida. Thanks to political fortunes and pleasant weather, the statebecame popular for military training; 172 military installations were present in Florida during the war(Mormino 1996:323-324).
With the end of World War II, the population of Florida expanded dramatically (Tebeau1971:431). Citrus County, however, remained sparsely populated into the 1950s (Vernon 1951:11). The average population for the period from 1900 to 1950 was only 5811, with a peak of populationin 1905. Vernon (1951:11) notes that although the population of Florida increased by 417 percentfrom 1900 to 1950, that of Citrus County increased by only 12.9 percent. Employment in the regioncentered primarily on phosphate mining, timber cutting, and the raising of livestock, crops, fruittrees and nuts. A 1945 agricultural census listed the dominant fruit crops as oranges, grapefruit andtangerines (Vernon 1951:Table 4). Tung nuts appear to have been an important nut crop. Rowcrops were dominated by corn, peanuts, and sweet potatoes. Sugarcane syrup was also important. Cattle, hogs and chickens were the most important livestock.
In 1951, Vernon (1951:6) described Crystal River as “a small port for pleasure boats.” Likemany of the towns in Citrus County, Crystal River grew rapidly after U.S. Highway 19 wasconstructed as the coastal route to St. Petersburg in response to the demands of the growing touristindustry (Vernon 1951:6-7). Vernon (1951:7) wrote glowingly of the landscape along the highway inthe vicinity of Crystal River:
This highway passes through very beautiful, flat land and skirts a jungle of highlandswamps, called hammocks, that teem with bear, turkey, wild hogs, mink, otter, andother game. The trees are majestic hardwoods and the hammocks are truly tropicaland preserve much of the wild beauty typical of Florida. Several large springs areeasily reached from U.S. 19. The springs of Crystal River well up from deep canyonsand fissures to make Crystal River and may be seen from glass-bottomed boats.
Nevertheless, by this time most of the uplands in the county had been stripped of their large pineforests and were covered by scrub oak and young slash pines (Vernon 1951:10-11). Further, whileVernon observed that the coastal areas were still “choked with hardwoods,” most of the large treeshad been cut for timber.
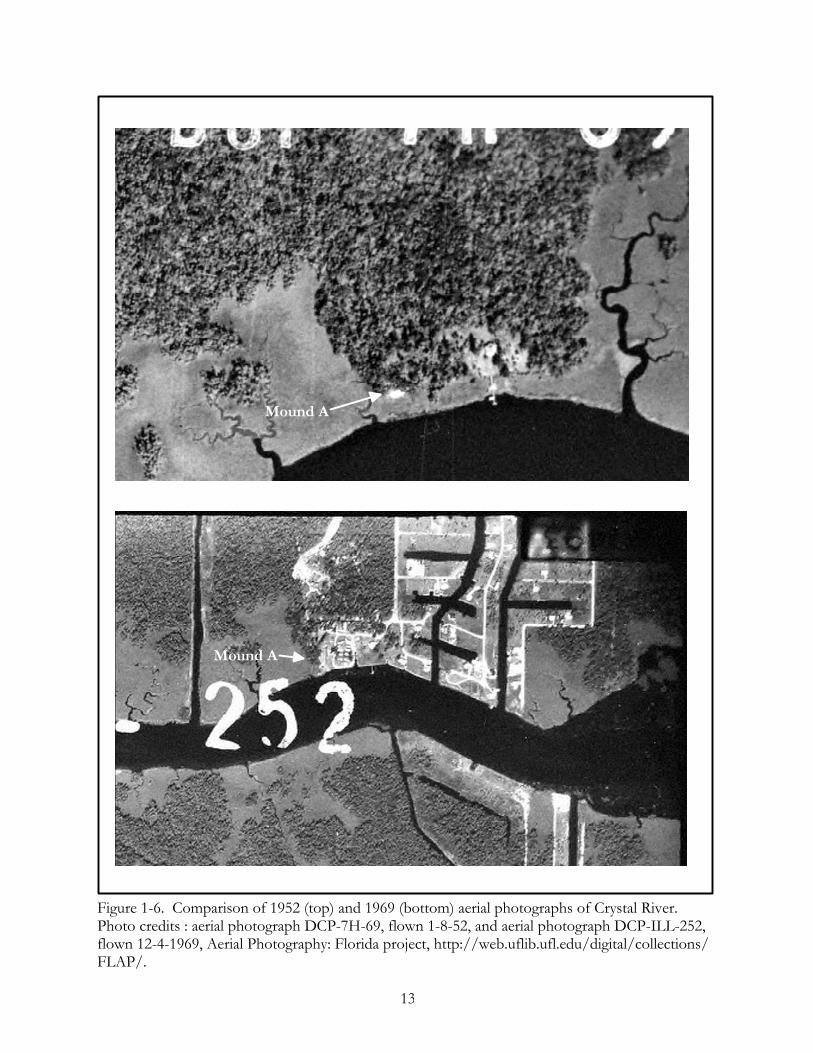
Citrus County began to boom in the 1960s. In 1970, the population of the county was19,196, up more than 100 percent from 1960 (Dunn 1977:430). The effects of this growth areevident in aerial photographs of the Crystal River site and adjoining properties (Figure 1-6). A 1952aerial photograph shows minimal development. By the time of the 1969 aerial photograph, newcanals had been excavated and a housing subdivision was completed to the east of the site. Inaddition, a mobile home park was constructed directly on top of the site, east of Mound A.
The state of Florida commenced acquisition of the Crystal River site in 1962, with thedonation of 14.5 acres by S.M. and E.A. Whitcraft and G.C. and I. Dyer (FDEP 2000:1, Addendum1). The archaeological site, as defined by the limits of the archaeological park, was listed on theNational Register of Historic Places in 1970 (FDEP 2000:7). The property was designated as aNational Historic Landmark in 1990. The White property (the mobile home park) was added to thepark in 1997 (FDEP 2000:20).
Mound A
Mound A
13
Figure 1-6. Comparison of 1952 (top) and 1969 (bottom) aerial photographs of Crystal River.Photo credits : aerial photograph DCP-7H-69, flown 1-8-52, and aerial photograph DCP-ILL-252,flown 12-4-1969, Aerial Photography: Florida project, http://web.uflib.ufl.edu/digital/collections/FLAP/.

14
Previous ResearchWeisman (1987, 1995) has admirably summarized the long and complicated history of
archaeological investigations at Crystal River. The brief outline that follows draws primarily fromhis overview, but also from Milanich (1999) and primary published and unpublished sources.
The earliest published description of Crystal River dates to 1859 (Brinton 1859; Weisman1995:19). This account, by F.L. Dancy of the U.S. Coast Survey, describes the largest mound at thesite (what would later be designated Mound A or the “Spanish Mound”) as 12.2 m (40 ft) high, witha nearly level summit about 9.1 m (30 ft) across.
C.B. Moore (1903, 1907, 1918) conducted the earliest archaeological excavations at CrystalRiver. Despite the limitations in his field methods and reporting, Moore’s excavations remain themost intensive work ever conducted at Crystal River, and the baseline for all subsequentinterpretations of the site (Weisman 1995:12-14).
Moore began work at Crystal River in the spring of 1903, as part of a season of field workon the Gulf Coast that began in Tampa and extended as far west as Mississippi (Moore 1903,Weisman 1995:12). As was noted above, the property was then under the control of Mr. R.J. Knightof Crystal River. Moore (1903:382) reported that “though the shell-heap [Mound A] on CrystalRiver is a famous one, the sand mound [the Main Burial Complex, as described below] wasunknown to the inhabitants of the town of Crystal River, even the owner being unaware of theexistence of this mound.”
Moore spent a week at the site in 1903, focusing his excavations on the Main BurialComplex, which he labeled Mounds C-F (Moore 1903). While work was conducted in all parts ofthe complex, he concentrated on the central sand mound (Mound F). The excavations hereproduced many of the exotic artifacts for which the Crystal River site has become famous. Moorealso produced the first map of the site, assigning the letter designations that are still used today forthe major features of the site (Moore 1903; Weisman 1995:12-13). Notably, Moore’s map does notmention the two earthworks known today as Mounds J and K, nor any of the presumed stelae.
Moore returned to Crystal River in 1906 (Moore 1907; Weisman 1995:13). As before, hefocused on the main burial complex, but this time directed his efforts to the “elevation” or platform(Mound E) surrounding the central burial mound (Mound F), and to a lesser extent the circularembankment (Mound C). He found a number of burials in both locations, but most here lacked theexotic artifacts of copper and quartz crystal found in Mound F.
Moore made his final visit to the site about a dozen years later (Moore 1918). Weisman1995:13) puts the last season of fieldwork in 1917, while Milanich (1999:7) reports that it took placefrom April 9-12, 1918. Given that Milanich examined the field notes firsthand, a 1918 date seemsmore likely. Whatever the precise year, Moore continued working in the circular embankment(Mound C), where he identified a number of burials with shell and limestone. He also investigated amound to the north of the present-day state park.
In all, Moore and his crew spent 34 days at Crystal River, about 25 of which were likelyspent conducting excavations (Milanich 1999:7). Despite this relatively limited amount of time, theyrecovered the skeletal remains of at least 429 individuals. As Milanich notes, this would beimpossible employing modern standards of excavation. Human remains and artifacts must havebeen removed very quickly. Moore did not keep detailed field drawings, and no grid system wasemployed. Nevertheless, it is reasonable to suggest that Moore’s work at Crystal River may havespared the site from destruction through looting or development, by making its importance evidentto a later generation of archaeologists.

15
There were no archaeological investigations at Crystal River for more than three decadesfollowing Moore’s final field season in 1918. Nevertheless, the site was occasionally visited andmentioned in print. In 1924, botanist John Small toured Crystal River and described the “SpanishMound” (Mound A) as between 25 and 30 ft tall (Small 1924; Weisman 1995:25). More importantly,during the 1930s and 1940s archaeologists began assessing the significance of the site throughstudies of its material culture, chronology, and apparent connections with the Hopewellphenomenon. Greenman (1938) recognized the affinities between artifacts from Crystal River (asreported by Moore) and those from Hopewell sites in Ohio. Willey (1948a; Willey and Phillips 1944)puzzled over the pottery from Crystal River and its relationship to Mississippian types. After someconfusion, he eventually concluding that the pottery from Crystal River was ancestral toMississippian types (Willey 1948c). In 1949, Willey published his landmark synthesis of thearchaeology of the Florida Gulf Coast, in which he identified the pottery from Crystal River asbelonging to the Deptford, Santa-Rosa Swift Creek, and Weeden Island complexes (Willey 1949a).
Also in 1949, Willey visited Crystal River for a day with Antonio Waring, Jr., and RufusNightingale. Willey’s investigations were limited to a surface collection of Mounds C and F(Milanich 2007:22; Weisman 1995:28; Willey 1949b). In his report of this work, Willey described thesherds as belonging to the Weeden Island, Pasco, and St. Johns series. Willey pointed out that thedating of Mound A was still unresolved, but suggested the possibility that the mound could date tothe Santa Rosa-Swift Creek or Weeden Island I periods.
A complicating factor in these early attempts to situate Crystal River in the prehistory of theSoutheast was the shortened chronology of the day and the related assumption that Weeden Islandwas contemporaneous with fully developed Mississippian cultures in the interior. Indeed, as Knightand Schnell (2004:3-4) have pointed out, in the 1940s the Woodland and Mississippian sequence forthe Gulf Coast was compressed into the interval after A.D. 500: Fort Walton was posited to havebeen essentially protohistoric in age (ca. A.D. 1500 to 1650), late Weeden Island (or Weeden IslandII) was assumed to date as late as A.D. 1500, early Weeden Island (Weeden Island I) was thought topost-date A.D. 1000, and Swift Creek culture was assumed to have a long duration that beganaround A.D. 500 and extended as late as A.D. 1250 or 1300.
A second complicating factor in the dating of Crystal River was the presence of flat-toppedmounds. The thinking of the day was that such mounds dated predominantly or exclusively to theTemple Mound, or Mississippian period (Phillips et al. 1951). Only within the last twenty years hasthe existence of pre-Mississippian platform mound construction become widely accepted (e.g.,Jefferies 1994; Knight 1990; Pluckhahn 1996, 2003).
To resolve questions about the relative ordering of the pottery series and moundconstruction at Crystal River, Hale Smith conducted limited work at the site in February, 1951(Smith 1951; Weisman 1995:14, 28-29). His investigations included one 2 foot by 2 foot test in themidden area (Mound B), another test of equal size in Mound H, several test in Mounds C and E, anda surface collection of Mound A. Smith’s analysis suggested that at least a portion of the Mound Cembankment was constructed late in the Weeden Island period, refining Willey’s earlier temporalassignment.
A short time later, in June, 1951, Ripley Bullen initiated the first of several seasons of fieldwork at Crystal River (Bullen 1953; Weisman 1995:28-29). The 1951 investigations included twostratigraphic excavations in the midden (Mound B) to test his idea that the site (and particularly theburial mound complex) was in use for more than one period (Bullen 1951) . On the basis of thiswork, Bullen postulated three periods of occupation and mound construction: Santa-Rosa SwiftCreek (lower levels of Mound F), Weeden Island (the Mound E platform and Mound Cembankment), and late Weeden Island or Safety Harbor (the upper levels of Mound F).
Bullen completed extensive excavations at Crystal River in 1960 (Weisman 1995:37-38). Perhaps most significantly, these investigations included topographic mapping that led to the

16
identification of two additional mounds and an extension of the midden area (Mound B) to thenorth of Mound A. Bullen described Mound J as an “irregularly shaped imminence of shell”(Weisman 1995:37), while Mound K was described as a flat-topped deposit resembling a smalltemple mound. Tests were excavated into these two mounds. Another test was excavated intoMound G, where 35 burials were identified in a 10 foot by 20 foot trench. Finally, Bullen identifiedundisturbed burials in the Mound F platform and Mound C embankment. Unfortunately, the 1960 investigations by Bullen have never been thoroughly reported.
As was previously noted, the state of Florida commenced acquisition of the Crystal River sitein 1962 (FDEP 2000:1, Addendum 1). In 1964, as the site was being cleared for the creation of thestate park, two limestone stelae were discovered (Bullen 1966; Weisman 1995:31-32). Bullenexcavated the area around Stela 1 (south and east of the main burial complex), which is pecked andincised with a representation of a human face. The identification of these two, plus a third possiblestela (Hardman 1971) have fueled speculation about connections between Crystal River andMesoamerica (Bullen 1966, Ford 1966, 1969; Hardman 1971).
Contemporary fieldwork at Crystal River has been limited. In 1985, Brent Weisman andJeffrey Mitchem excavated core samples and two 2-x-2-m test units in the midden north of MoundA, with the goal of obtaining samples from the Safety Harbor component on the site (Weisman1995:35-36). These excavations have never been thoroughly reported.
More recently, Gary Ellis has conducted work at Crystal River in response to naturaldisasters and general park maintenance (Ellis 1999, 2004; Ellis and Martin 2003). Perhaps mostsignificantly, Ellis has identified intact midden deposits buried below fill in the area east of MoundA.
Theoretical PerspectiveTechnical reports are, by definition, comprised mainly of data and generally contain little in
the way of theory. This technical report will be no exception. However, we feel it important tobriefly outline the theoretical perspective that we bring to our investigations of Crystal River.
Much of the previous work at Crystal River can be characterized as either diffusionist orneo-evolutionary in perspective. Under the former, the mounds, stelae, and non-local goods wereinterpreted as evidence of the movement of people or ideas from Mesoamerica (Ford 1966, 1969;McMichael 1960, 1964). The neo-evolutionary perspective, on the other hand, downplayed thepossibility of influences from Mesoamerica, as well as contact with Hopewellian societies in theMidwest. Instead, similarities between Crystal River and sites elsewhere were viewed as the productof concordant evolutionary change and similarities in socioeconomic adaptation. Perhaps moredamaging for ongoing attempts to interpret Crystal River, the pyramidal mounds were taken asevidence of a Mississippian occupation and a chiefdom level of sociopolitical development (Bullen1951, 1953; Smith 1951).
Our work is guided by the view that monuments of earth and shell such as those at CrystalRiver—as well as less monumental material remains such as artifacts and features—representcultural practices not reducible to general evolutionary types and not explainable through broad-brushed, cross-cultural comparisons. Instead, we follow a line of thinking termed “historicalprocessualism” (Pauketat (2001a, 2001b) that emphasizes the value of considering “genealogies ofcultural practices” (Pauketat 2004:38-39) within specific localities. The limited scope of our andprevious investigations at Crystal River restricts our ability to describe specific cultural practices.Nevertheless, we see our work at Crystal River as the first step toward such a genealogy of place andpractice.

17
CHAPTER 2TOPOGRAPHIC MAPPING
Almost sixty years ago, Gordon Willey (1949b:45) noted the need for a detailed topographic mapof the Crystal River site to supplement the original sketch map by C.B. Moore (1903:Figure 17):
The Crystal River site is an ideal spot for intensive research at our present stage ofknowledge in Floridian and Southeastern archaeology. First, a new map of the siteshould be made. As we have stated, the Moore map seems to be correct as to thefeatures we were able to check; but even if it is perfectly accurate it is not sufficientlydetailed.
Despite Willey’s plea, Moore’s sketch provided the foundation for most of the later maps of the site,with additions and relatively slight modifications by Bullen (1966). Comprehensive mapping of the siteusing modern mapping methods would not take place until 2007, when Weisman and colleagues (2007)conducted a High Definition Documentation Survey (HDDS). The HDDS mapping employed acombination of three-dimensional laser scanners, global position systems, and total stations. While thework by Weisman and colleagues (2007) has the potential to provide highly detailed representations ofthe topography of the Crystal River site, the site maps included in the report still lack significant detail.
The lack of detailed topographic mapping at Crystal River has created another, related problem:the lack of a site-specific grid system. Previous investigations by Bullen and Smith, while referenced torelatively permanent site features such as the corners of mounds, were apparently not placed withrespect to a grid system. More recent excavation units by Weisman and Mitchem were placed on a gridrelative to a transit station near Mound K (Weisman 1995:51), but the precise location of this stationis now unknown. Thus, previous excavations at Crystal River can only be relocated very generally.
Although maps are valuable for descriptive purposes, they also have the potential to testinterpretive hypotheses and to guide the development of new research questions. In the Southeast, thisis exemplified by the recent mapping of the famous Poverty Point site in Louisiana by Kidder (2002).Kidder’s work demonstrated that previous maps of the site had over-emphasized the symmetry of theearthworks, which had been used to bolster claims for the presence of a large and sedentary communitywith centralized leadership.
The principal goals of our mapping were, therefore, three-fold. First, we wanted to create adetailed topographic map that could be used to describe important site features, as well as the overallplan of the site. Secondarily, we wanted to create a site-specific grid system to reference previousexcavations and to guide our present and future investigations at the site. Finally, we hoped ourmapping would provide a basis for testing previous hypotheses regarding the Crystal River site.
MethodsDetailed topographic mapping of the Crystal River site was accomplished using three laser
total stations, including one Leica and two Sokkia models (Figure 2-1). First, however, we used anoptical Sokkia transit with a compass to establish a grid system oriented with magnetic north. Theoptical transit was set up over a control point established by Wesiman and colleagues (2007). Thispoint, marked by a nail in the parking lot of the museum, is located at East 454944.5 and North1663963 on the Florida State Plane HARN grid system, and has an elevation of 5.434 ft above meansea level (amsl) (Lori Collins, personal communication, 2008).

18
For the purposes of our mapping and subsequent investigations, the control point in theparking lot of the museum was given the arbitrary grid designation East 1000.000 m North 1000.000m. Grid locations increased to the east and north of this point, and decreased to the west and south.Elevations were taken in meters amsl relative to this control point. Both horizontal locations andelevations were measured to the nearest millimeter. However, in this report we generally presentmeasurements to the nearest centimeter.
Using the three total stations, wecollected approximately 18,000elevations across the site. The surveydata was downloaded from the totalstations daily. Maps were created usingArcGIS 9.1 (ESRI, Inc.) and SURFER(Golden Software, Inc.) GIS andmapping software.
Figure 2-2 is the detailedtopographic map created as a result ofour survey work. This map documentsthe location of the control pointestablished by Weisman and colleagues,as well as several other permanentdatums that we placed on the site tofacilitate any future reconstructions of the grid system. These points, which are fully documented inTable 2-1, were marked with iron spikes so that they may be more easily relocated with a metaldetector. Figure 2-3 presents the same elevation data in “three-dimensional form,” with modernfeatures such as roads removed and with a 2X vertical exaggeration.
Figure 2-1. Topographic mapping of Mound A at Crystal River, view to the west-northwest.
Datum #(see Figure 2-2)
East North Elevation
1 1000.000 1000.000 1.656
2 980.000 1000.000 1.271
3 1000.000 980.000 1.371
4 1035.072 776.553 2.175
5 1020.860 852.296 1.479
6 1098.710 830.646 1.310
Table 2-1. Grid Locations and Elevations for DatumsEmployed at Crystal River.

#*#*
#*
#*
#*
#*
$
$
$
6
5
4
3
2 1
3
2
1
Ñ0 45 m
contour interval = 20 cm
C r y s t a l R i v e r
Mound H
Mound G
Mounds C-F
Mound A
Mound K
Mound J
Feature B
Feature B (Midden)
plaza
Figure 2-2. Topographic map of Crystal River based on total station survey. See Table 2-1 for thegrid coordinates and elevations of datum points.
19
#* = datum$ = stele
fenc
e

Figure 2-3. "Three-dimensional" view of topography at Crystal River. Vertical exaggeration is 2x. View is to the northeast.
20

21
ResultsTopographic mapping presents new insights into size and configuration of features at Crystal
River, as well as the spatial relationships between features. We begin with general observationsregarding the general layout of the site and the locations of previous excavations before turning tomore detailed descriptions of individual features.
The Crystal River Site Plan
As noted above, Moore’s (1903:Figure 16) sketch map has long served as the principal basemap for Crystal River, with only slight modifications and additions by later investigators. It istherefore instructive to compare Moore’s map with the topographic map we completed in 2008. Using a GIS, we scanned Moore’s map, reproduced it at approximately the same scale as our own,and made it 20 percent transparent so that the two maps could be more easily compared. To anchorthe two maps, we focused on Moore’s depiction of the northern slope and summit of Mound A,given that these features are reasonably well-preserved (in contrast with Mounds C-F, which werecompletely excavated and rebuilt). We then rotated Moore’s map to get a “best fit” with our own.
Figure 2-4 shows the results of this analysis. What is immediately apparent is the degree towhich Moore’s map must be rotated to bring the major site features into alignment with our ownmap. Only after Moore’s map is rotated about 9/ east of north do the two maps roughly coincide. The reasons for this discrepancy are unclear. Certainly, some variation in north might be expectedin the more than 100 years between Moore’s mapping and our own. According to the NationalOceanic and Space Administration Satellite Information Service (2008), the current magneticdeclination at Crystal River is 4/ 42' West, while in 1903 the magnetic declination was 2/ 18' East. Thus, a difference of approximately 6/ might be expected.
Notwithstanding the orientation of Moore’s map, it is otherwise remarkably in agreementwith our own. Our mapping indicates that the main burial mound complex (Mounds C-F), as wellas Mounds G and H, are located slightly further west (relative to Mound A) then as mapped byMoore. Perhaps the greatest discrepancies between Moore’s map and our own are, first, in theplacement and orientation of the shell midden he designated as “B” (particularly along its easternend), and, second, in the depiction of the topography immediately north of Mound A. In general,however, Moore mapped the relative distances and orientations of these mounds with astonishingaccuracy, given the simple mapping technology of the day, as well as the dense vegetation thatcovered the site at the time of his visit.
We can also compare our map against one completed by Bullen (1966:Figure 2) (Figure 2-5). This is the most detailed of several maps completed by Bullen, in that it includes Stelae 1 and 2,Mounds J and K, and the causeway connecting Mounds G and H. Not surprisingly, given thatBullen appears to have based this site map on Moore’s, it also needs to be rotated significantly tobring it into alignment with our own. Once this is done, however, the two maps correspond nicely,particularly in regard to Mounds J and K. Bullen may have corrected the locations of Mounds Gand H, given the closer correspondence of these features to our map (vis-a-vis Moore’s sketch).
Two major discrepancies standout in the comparison of our map with Bullen’s. The first ishis placement of Stela 2, which he depicts about 12 m south of its current location, as documentedby our mapping. Some of this discrepancy may be attributed to errors in scale and orientation. Thesecond major discrepancy is in the placement of the eastern end of the shell midden (Feature B). Itis notable that Bullen considerably revised the appearance of this end of the shell midden fromMoore’s original sketch. Modern house construction may have altered the shape of the midden inthis area after Bullen’s map was completed.

C r y s t a l R i v e r
Figure 2-4. Comparison of Moore's (1903) sketch of Crystal River with our recent topographic map.
22

C r y s t a l R i v e r
Figure 2-5. Comparison of Bullen's (1966) sketch of Crystal River with our recent topographic map.
23

24
Our recent mapping casts doubt onsome of the assertions put forth by Hardman(1971) and Williamson (1984) (Figure 2-6)concerning the alignments of several of the keyfeatures of the site with the cardinal directionsand solar events such as the solstices andequinoxes. For example, these authors claimthat a line between Stela 2 and the top of MoundF is oriented due east (90/), the direction of therising sun at the equinox. Our map shows theactual alignment at 96/. Of course, in judgingthe veracity of this and previous analyses, it mustbe kept in mind that the burial mound complexwas completely excavated and rebuilt. It shouldalso be kept in mind that the dense vegetationthat surrounds the site now—and presumablyalso in the past—would have obscured the viewof the sun along the horizon unless specialsighting lines were cleared.
Hardman (1971) and Williamson (1984)also claim significance to the alignment betweenStela 2 and the top of Mound J, and againbetween Stela 2 and the northern end of theMound C embankment. They associate thesewith the setting sun at the winter solstice and therising sun at the summer solstice, respectively. According to our map, these three features donot form a straight line, and thus at the very leastcannot represent both of the phenomena theydescribe (the angle from Stela 2 to Mound J is 246/, while the angle from Stela 2 to northern end ofMound C is 72/).
Some of the presumed solar observations at Crystal River come closer to the mark. Forexample, Hardman (1971) and Williamson (1984) suggest that a line between Stelae 2 and 1 could beutilized to mark the position of the rising sun at the winter solstice. Our calculations place the anglebetween the two stelae at around 119/. This is about 2-3/ from actual azimuth of the sun at dawnon the winter solstice today (Hardman 1971:155; National Oceanic and AtmosphericAdministration, Earth System Research Laboratory 2009), but close enough for a generalobservation of this solar phenomenon (bearing in mind the same caveats we raised above).
While the two stelae could conceivably have been important for observations of the wintersunrise, our map casts serious doubt on the purported alignments of Mound F and Stela 2 with thewestern and eastern ends of the Mound H platform, respectively (Hardman 1971; Williamson 1984). In fact, a line extending north from Mound F passes near the base of the slope at the western edgeof Mound H, while a line north from Stela 1 intersects Mound H near the top of the ramp.
Bullen’s (1966:233) observations on the relationships between Stela 1 and Mound A andagain between Stela 2 and Mound H are also at least partially challenged by our map. Bullensuggested that the ramps of these mounds pointed “a little east” of the corresponding stela. Whilethis is true of Mound H and Stela 2, the ramp of Mound A appears to have pointed substantially eastof Stela 1. Our mapping also suggests that the distances between mounds and stelae are further thandescribed by Bullen. Nevertheless, Bullen’s general point—that the two platform mounds eachroughly face a stela and that the distances between the mounds and stelae are comparable—is valid.
Figure 2-6. Potential astronomical alignments ofmounds at Crystal River. Reproduced fromWilliamson (1984:261).

25
While our mapping does not supportseveral of the astronomical alignments ofmounds and stelae described by previousresearchers, we agree with Hardman(1971:138) that the placement of thesefeatures was probably not random. Indeed,we believe that there are several elements ofthe site plan at Crystal River that can—withperhaps a certain amount of imagination—betaken as possible indications of deliberate,grand design in the placement of mounds atCrystal River (Figure 2-7). First, a linebetween Mounds F and G is more or lessparallel with a line between Mounds A and Kon an azimuth of 142/ (Stela 1 also falls inalignment with Mounds G and F). A linebetween Mounds K and F is roughly at aright angle to these at 62/—the approximatebearing of the rising sun at the summersolstice (Hardman 1971:146). The distancesbetween the tops of these mounds may havealso been comparable; it is roughly 110 mbetween Mounds G and F, andapproximately 100 m from the top of MoundK to the former center of Mound A.
Of course, analyses such as this—aswell as those of Hardman (1971) andWilliamson (1984)—are fraught withdifficulties. As Vogel (2006) notes in hiscritique of similar studies, the mounds have changed appearance since they were in use, and theprecise points of measurement that are utilized by contemporary investigators are often arbitrarilydetermined. Moreover, as Weisman (1995:34) points out, demonstrating that mounds and otherfeatures could have functioned in the manner proposed does not necessarily mean that they did sofunction. Nevertheless, as noted above, it seems reasonable to suppose that the spatial arrangementof mounds and stelae at Crystal River was not random.
Locations of Previous Excavations
As noted at the beginning of this chapter, previous excavations at Crystal River havegenerally not been placed with respect to a permanent grid system, and are thus very difficult toprecisely relocate. One exception is the work by Weisman and Mitchem (Weisman 1995:51). Theseunits were placed on a grid relative to a transit station north of Mound K, but the precise location ofthis station is now unknown. Thus, these units too can only be relocated very generally.
By georeferencing previous maps of Crystal River to our own, it is possible to approximatethe locations of many of the earlier excavations. Figure 2-8 maps the locations of all previousexcavation units that can be determined with some degree of accuracy. Table 2-2 provides summarydata for the size of these units and the sources for our placement of them. The primary sources forthese data include maps by Moore (1903:Figure 16) and Bullen (1966:Figure 2), as well as a variety ofpublished and unpublished descriptions (Bullen 1953; Smith 1951; Weisman 1995). Another usefulsource—albeit of unknown accuracy—is a map on display at the Crystal River Museum. RipleyBullen was responsible for many of the displays at the museum (Brent Weisman,
Figure 2-7. Possible patterns in the alignment andspacing of mounds at Crystal River.

26
Table 2-2. Summary Data for Previous Excavations at Crystal River.Investigator, Year Unit Designation/Description Size Source
Moore, 1903 Mounds C-F - Moore (1903) and park map1
Moore, 1906 Mounds C, E - Moore (1907) and park map1
Moore, 19182 Mound C - Moore (1918) and park map1
Smith, 1951 excavation in Area B Midden 5 x 5 ft1 Smith (1951)
Mound H excavation 2 x 2 ft location undetermined
Mound C-F excavation ? location undetermined
Bullen, 1951 Test I 5 x 5 ft Bullen (letter to G.L. King, June 6, 1951,on file at the FMNH; 1953) and park map1
Test II 3 x 7 ft3 Bullen (1953) and park map1
Bullen, 1960 Mound G excavation 10 x 20 ft?4 park map1
Mound G excavation 5 x 5 ft5 location undetermined6
Mound H excavation (summit) 5 x 5 ft?7 park map1
Bullen, 1964 Test 1 or 2? (northern-most) 5 x 5 ft?8 park map1
Test 1 or 2? (southern-most)includes C14 dates R2 and R3
5 x 5 ft?8 park map1
C14 date R1 - park map1
Mound H excavation (ramp) ? park map1
Location I ? Bullen’s 1960 sketch map9
Location II 8 x 8 ft Bullen’s 1960 sketch map9
Bullen, 1965 Mounds C-F excavation ? park map1
Weisman andMitchem 1985
510N/498E 2 x 2 m Weisman 1995:51
500N/535E 2 x 2 m Weisman 1995:51
Weisman, 1993 unidentified test in Mound K ? park map1
Location B-1 ? Weisman’s field map
Location B-2 ? Weisman’s field map
Notes
1. Map on display at the Crystal River Museum.2. Weisman (1995:13) puts the last season of Moore’s fieldwork in 1917, while Milanich (1999:7) reports that it was April 9-12, 1918. Given that Milanich examined the field notes firsthand, a 1918 date seems more likely.3. Bullen also described this as 7 x 4 ft (letter to Hale G. Smith, June 22, 1951, on file at the FMNH). 4. Bullen (letter to George Dyer, November 11, 1960, on file at the FMNH; see also Weisman 1995:59) described this as 10 x 20 ft. However, in an unpublished manuscript he noted the dimensions as 15 x 15 ft (Bullen 1960). Our geophysical survey suggests it may have measured 20 x 20 ft (see Chapter 3). 5. Wesiman (1995) describes this as a 2 x 2 ft test, but Smith (1951) states that it was 5 x 5 ft.6. In a 1960 letter to George Dyer, Bullen reported this was located to east of the larger cut (see Weisman 1995:59)7. Weisman’s (1995:60) estimate based on a photograph of the excavation (see Weisman 1995:Figure 16). A 5 x 10 ft trench also seems plausible.8. Weisman (1995:50) estimated this at 4 x 5 ft based on examination of photos at the FMNH. A 5 x 5 ft test, similar to those of Smith (1951) and Bullen’s elsewhere on the site (Weisman 1995:59), seems more likely. 9. See Weisman (1995:Figure 7).

Ñ0 50 m
contour interval = 20 cm
C r y s t a l R i v e r
Figure 2-8. Locations of previous excavations at Crystal River. Units not shown to scale (see Table2-2 for actual sizes). Locations are approximate.
27
Mound H (summit)excavation
Mound H (ramp)excavation
Mound G excavation
Stela 1 excavation
Mound C-F excavations
Test I
Unit B
500N/535E
Location B-1
Test II
Test 1 or 2
Test 1 or 2Location B-2
Mound K test
Mound K test
C14 date R1
Moore's 1903 and 1906 seasons
Moore's 1918 season
Smith's 1951 season
Bullen's 1951 season
Bullen's 1960 season
Bullen's 1964 season
Bullen's 1965 season
Weisman and Mitchem's 1985 season
Weisman's 1993 storm assessment
510N/498E

28
personal communication, 2008) and this map may be based at least in part on his first-handknowledge. However, the map also contains more recent data, such as the locations of unitsexcavated after the 1993 tornado. The 1985 excavations by Weisman and Mitchem are not depicted.
The locations of some of the older units can be pin-pointed with a high degree of accuracy. For example, Weisman’s “Location B-1" (where a tree was uprooted during a 1993 tornado) is stillvisible. Unfortunately, most of the other previous excavations can only be located to withinapproximately 10 m. However, the fact that these can now be tied to a grid system should facilitatetheir relocation with additional field investigations. In Chapter 3, we describe specific grid locationsfor several older excavations that we relocated with the geophysical survey.
Mound A
Figure 2-9 presents theresults of our mapping ofMound A at Crystal River. Asnoted in Chapter 1, Mound Ahas been described a number oftimes, beginning in 1859(Brinton 1859; Weisman1995:19). This account, by F.L.Dancy, describes the mound as12.8 m (40 ft) high, with a nearlylevel summit about 9.1 m (30 ft)across. Subsequent accountshave tended to revise theestimates of the height ofMound A downward, and thewidth of the summit upward. Moore (1903:379), for example,described Mound A as 8.7 m (28ft 8 in) high, with a summit 32.6x 15.2 m (107 by 50 ft). Heestimated the basal diameter as55.5 m (182 ft) by 30.5 m (100ft). Moore also described agraded way or ramp 24.4 m (80ft) long and from 4.3 to 6.4 m(14 to 21 ft) wide.
Willey (1949b:41) notedthe general accuracy of Moore’s description. He described the summit as “exceedingly levelalthough not well squared.” At that time, the ramp approach was still “perfectly preserved” andWilley noted that the only comparably well-preserved ramp was at the largest mound at Moundville.A few years later, Bullen (1953:11) observed that Mound A remained as described and illustrated byMoore and Willey, “except for a small hole in the top and some erosion by the river at its southerncorner.” Adding to the previous descriptions of the ramp, Bullen noted the presence of a “clearlydefined ridge or walkway of shells and midden material extending northeasterly towards the easternend of the shell ridge or midden.” Unfortunately, the southeastern two-thirds of the Mound A(including the ramp) were removed for construction fill in 1960 (Weisman 1995:45). The removedmaterial was redeposited to the east of the mound to fill in a lagoon-like area.
Figure 2-9. Topographic map of Mound A. Red lines indicateformer outline of mound and ramp as described by Moore(1903)

29
Our mapping demonstrates a maximum elevation of 9.39 m amsl for Mound A. This isabout 8.2 m above the ground surface to the east and about 7.9 m above the ground surface to thenorth, consistent with Moore’s (1903) description. The better-preserved, northwestern end of thesummit is about 12 m wide (northeast-southwest), within approximately 3 m of Moore’s description. The mound is about 28 m wide at its base at the northwestern end, about 2 m off Moore’s estimate. The consistency of our measurements with Moore’s general estimates suggests that at least thenorthwestern end of the mound was little disturbed by the 1960s borrowing.
The Area B Midden
Perhaps no other feature at Crystal River has been so variously described as the shell middenreferred to by Moore (1903) as “B” (Figure 2-10). Moore (1903:379) described it as a “low, irregularshell deposit,” beginning at the northwest corner of Mound and extending north before curvingeast and “extending for some distance along the riverbank.” Willey (1949b:41) concurred withMoore’s description of this mound as over 304.8 m (1000 ft) in length and 30.5 m (100 ft) in width. He noted the height as 0.6 to 0.9 m (2 to 3 ft) in some places. Willey described the composition ofthe midden as “shells and rich black midden” and suggested that “it undoubtedly represented therefuse remains of prehistoric houses or occupation.”
Bullen (1951) provided the most literary description of the Area B Midden with his commentthat it was “...a curving shell ridge, shaped like a fishhook with a temple mound where the barb ofthe fishhook would be...” He reported that the shell midden did not seem as wide as Moore hadindicated, attributing this discrepancy to the “...natural growth of soil, muck, humus, etc, over the
Figure 2-10. Topographic map of Area B Midden. Red lines show Moore’s (1903) depiction, bluelines show Bullen’s (1966) plan.

30
lower portions of the sides of this midden...” Bullen also described for the first time a ridge“extending nearly 200 feet northward from the bend of the shell midden.” He described this as “alow, irregular ridge, wider towards the north” ending at low area filled with standing water. Hereportedly excavated a small test at the northern end of this ridge that demonstrated it to be a shellmidden deposit covered with 15 to 23 cm (6 to 9 in) of dirt.
As noted in Chapter 1, much of the Area B Midden was at least partially destroyed for theconstruction of a mobile home park in the 1960s. The former boundaries of the mobile home parkare visible in our map as the sharp contour break extending north from Mound A to a point justsouth of a park road, and from there continuing east-southeast to an existing fence. However, areasof higher elevation within the former boundaries of the mobile home park, particularly in thenorthwestern corner, suggest that some portions of the Area B Midden may survive even here.
Outside of the limits of the former mobile home community, the Area B Midden appears tobe reasonably intact. The northern extension of the midden is elevated approximately 1.8 m abovethe wetlands to the west, making it somewhat higher than described by Moore and Willey. Theeastern end of the midden has been impacted by the construction of several homes (the parksupervisor’s home is shown on our map) and was the focus of only relatively limited mapping in2008. However, the elevation here (about 60 cm above the surrounding ground surface) suggeststhat portions of the midden may be intact. Inspection of soil profiles below the park supervisor’shome by archaeologist Gary Ellis provides some corroboration for this observation (Nick Robbins,personal communication, 2008).
The Main Burial Complex (Mounds C-F)
Given that they have been completelyexcavated and were partially reconstructed in1964-65 (Weisman 1995:53), Mounds C-F(Figure 2-11) were not a high priority for the2008 mapping program. Nevertheless, we willconsider briefly the correspondence betweenearly accounts of these earthworks and theirpresent states.
The only detailed description of theMain Burial Complex was provided by Moore(1903:379). He described Mound C as a circularembankment 1.8 m (6 ft) high and 22.9 m (75ft) wide. Within this was an area denoted as“D” and described as “territory on the generallevel,” meaning the same elevation as theoriginal ground surface. In its current, partiallyreconstructed form, the Main Burial Complexmeasures approximately 86 m east-west and 92m north-south. The embankment (Mound C)reaches a height of about 1.4 m above thesurrounding ground surface on its southernend, somewhat lower than described by Moore. It is about 27 m wide, within a few meters ofMoore’s estimate.
Figure 2-11. Topographic map of the MainBurial Complex. Red lines indicate Moore’s(1903) depiction.

31
Moore (1903:379) described Mound E as “an artificial elevation of sand, irregularly sloping.”No doubt for the sake of brevity, he often shortened this to simply “the elevation” (1903:382), “theslope” (Moore 1907:407) or “the rise” (1918:571). Later observers referred to this feature as a“platform,” “annex,” or “apron” (Bullen 1953:12; Willey 1949b:42). Although Moore did notprovide a height for Mound E, Bullen (1953) estimated this at about 1.1 m (3.5 ft), based onMoore’s profile of the complex. The Mound E platform currently measures about 38 m north-south and 40 m east-west. We estimate the height at around 1.2 m relative to the ground surfacewithin the enclosure, very close to that suggested by Bullen.
Mound F, the main burial mound, was built on the Mound E platform. According to Moore(1903:379), Mound F was about 21.3 m (70 ft) across at its base. He estimated the height at 3.3 m(10 ft 8 in). These figures correspond closely with the reconstruction of the mound. Our mappingdemonstrates a diameter of around 21 m, and a height of approximately 3.8 m measured relative tothe ground surface to the west.
Mound G
Although it was noted by Moore (1903:379) and partially excavated by Bullen (1965), MoundG has been minimally described in published sources. Moore described it only as a low and irregularridge of shell. Willey (1949b:43) reported being unable to find the mound due to the heavyvegetation that covered the area at the time of his visit, but nevertheless repeated and augmentedMoore’s description of this feature as a “...low irregular shell mound about 100 by 150 feet [30.5 by45.7 m] in extent.” Bullen almost completely omitted Mound G from his early publications onCrystal River, describing it only in passing as a “....shell deposit mentioned by Moore...” (Bullen1953:11). His later excavations revealed the presence of a number of burials and a shell causewayconnecting Mound G to Mound H (Bullen 1965).
We were fortunate to conductmapping soon after park personnel hadcleared the remaining vegetation from MoundG. Perhaps as a result of our unobstructedaccess, the resulting map (Figure 2-12) differsfrom previous accounts (surprisingly, thepreviously-published rendition that comesclosest to our own is the otherwise cartoon-ishmap of the site by Williamson (1984)). Specifically, the mound summit appearsroughly triangular, with a long axis orientedroughly east-west. The slopes to the north(toward the marsh) and southeast (toward theplaza) are relatively clearly defined, while theslope to the southwest is more gradual. Themound trails gradually to the northwest in amanner vaguely suggestive of a ramp. Basedon our mapping, Mound G measures roughly51 m east-west and 34 m north-south at itsbase. This is considerably larger thanestimated by Willey based on Moore’s map. The mound’s height, which has never beendescribed in print before, is approximately 1.5m measured relative to the plaza to the east.
Figure 2-12. Topographic map of Mound G.

32
Mound H
Mound H (Figures 2-13, 2-14) hasalso been only minimally described inprevious accounts of Crystal River. This issurprising, given that it is a well-preservedexample of a type of prehistoricconstruction that is rare in central and southFlorida, particularly on sites dating primarilyto the Woodland period. As with MoundG, Moore (1903:379) expressed little interestin Mound H, describing it only as a ridge ofshell “...12 feet in height, with a gradedway.” This disinterest can probably berelated to the Moore’s recognition thatplatform mounds generally held few or noburials, and thus little of the exotic items inwhich he was most interested.
Subsequent accounts of CrystalRiver also generally neglected Mound H. Willey (1949b:42) was unable to find themound, noting that “the whole site arealying back inland from the big mound, A, Figure 2-13. Topographic map of Mound H.
Figure 2-12. Topographic mapping of Mound H, view to the northeast from plaza.

33
and the riverbank is an extremely dense, mucky swamp.” Bullen (1953:12) was also unable to findthe mound at the time of his first visits to the site. Smith (1951) was apparently more successful,having excavated a 2-ft-square test on the summit. Unfortunately, however, Smith provides noadditional description of the mound. Bullen later excavated tests on the summit and ramp ofMound H (Weisman 1995:60). He described a causeway linking Mound H to Mound G (Bullen1965), but—like Smith—provided no additional details about the mound itself.
Based on our mapping, Mound H measures about 73 m by 25 m at its base (not includingthe ramp). The mound has a well-defined, rectangular summit approximately 55 m long and 8 mwide, and about 3.7 m above the plaza area to the southwest. On the northern flank of the moundopposite the plaza there is a small but distinct apron extending into the adjacent marsh. The rampon Mound H, which is almost equally as well-defined as the summit, extends about 31 m southwestfrom the summit to the plaza. It measures about 6 m wide.
Mounds J and K
Mounds J and K (Figure 2-15) arethe only mounds at Crystal River thatwere never mentioned by Moore (1903). Weisman (1995:60) reports that this hasprompted some speculation that themounds could have been constructedrecently, perhaps using a bulldozer. However, as Weisman also notes, thelarge trees that appear on the mounds inphotographs taken in the 1960s wouldseem to argue against modernconstruction of these features. It seemsmore likely Moore simply missed themounds due to the heavy vegetation thatthen covered this portion of the site. Some support for this interpretationcomes from the fact that Moore alsomissed the northern extension of theArea B Midden, on which these moundsreside (Weisman 1995:62).
Curiously, however, both Bullen(1951, 1953) and Smith (1951) also failedto mention Mounds J and K in theirinitial published reports of Crystal River, despite the fact that both archaeologists excavated unitsnearby. Weisman (1995:60) reports that the mounds were first noted by Bullen in 1960. A sketchmap completed by Bullen that year shows the two mounds in minimal detail (Weisman 1995:Figure7). In the version of this map that was later published, Bullen (1966) labeled the southernmost ofthe two mounds as “J”, the reverse of his earlier designation (as well as the accepted designationtoday). Bullen never described these mounds in print.
Mound J, the northernmost of the two mounds, by our calculations measures approximately27 m northeast-southwest by 12 m northwest-southeast at its base. It must be noted, however, thatthe base of this mound is somewhat in distinct and the mound could be said to extend farther on thenortheast-southwest line. The same can be said for the summit, which we measured at roughly 12by 4 m. The top of the mound is elevated about 1.7 m from the ground surface to the south.
Figure 2-15. Topographic map of Mounds J and K.

34
As Weisman (1995:62) has noted, Mound K is considerably more regular in shape thanMound J. The mound is nearly square at its base, measuring about 21 m north-south and 19 m east-west. The summit is more rectangular, extending about 12 m north-south and 7 m east-west. Mound K is about 40 cm taller than Mound J, measuring about 2.1 m high relative to the groundsurface to the north. There are few or no indications of the ramp extending northeast, as drawn byBullen (1966). Weisman (1995:62) suggests that the ramp might have been added to bolster Bullen’scase that this mound, as well as Mound J, were substructures for buildings associated with chiefs orpriests.
The Plaza
Bullen was the first to note thatthe relatively flat area bounded byMounds G and H and the Main BurialComplex resembles a plaza, asdocumented on his 1960 sketch map(Weisman 1995:Figure 7). In his 1965note on the site, Bullen described this asan area “...where people could assembleto watch ceremonies conducted on thetop of Temple Mound H” (Bullen1965:225). However, the plaza hasnever been described in more specificterms.
Today, the plaza appears as anarea of relatively uniform, low elevationbetween Mounds C-F, G, and H (Figure2-16). The plaza-like effect is enhancedby the shell causeway linking Mounds Gand H (first noted by Bulen), whichappears to frame the northern end of theplaza in a roughly rectangular fashionextending south to the Main BurialComplex. So interpreted, the plazawould measure about 88 m long (north-south) and 57 m wide (east-west). This is a substantial plaza, although not as large as the plazas atseveral other Middle Woodland mound sites. For comparison, the plaza areas at the Kolomoki andMcKeithen sites measure 200 to 300 m long (Milanich et al. 1997; Pluckhahn 2003). Nevertheless, one can easily imagine the plaza at Crystal River extending much further along anortheast-southwest axis from Mound H to Stela 2, or perhaps even as far as Mounds J and K andthe Area B Midden. However, the southwestern end of this longer “plaza” is today low andswampy.
The plaza is now broken and bounded by a number of paved park trails, most of whichappear to have been constructed in fill. One section has been built on top of the causeway betweenMounds G and H. The remnants of an old road are also visible as a finger of slightly higherelevation extending northwest from a point near the northern end of the Main Burial Complex. Theground surface becomes slightly elevated near the Main Burial Complex. As discussed in thefollowing chapter, the geophysical data suggest that this slight increase in elevation could reflect theaddition of backdirt from the excavations of the burial complex.
Figure 2-14. Topographic map of the presumed plaza.

35
SummaryConsidering the fame of Crystal River among archaeologists of the Southeast, the published
descriptions of the site are surprisingly brief and incomplete. Many of the site’s basic features,including Mounds G, H, J, and K, have been only minimally detailed in previous publications andreports. Much of this relates to the paucity, until very recently, of detailed topographic mapping ofthe site. As Milanich (1999:14) has noted, Moore’s (1903) map of Crystal River has served as thebasis of most of the later maps that have been published. While the accuracy of Moore’s map iscommendable (particularly considering the technology of the day and the condition of the site at thetime of his visits) it is lacking in detail. Thus, a significant contribution of the mapping conductedduring the 2008 field season is the creation of detailed topographic maps and descriptions of someof the site’s principal features.
As was noted at the beginning of this chapter, previous work at Crystal River has generallynot been conducted with reference to a site-specific grid system. As a result, many of the previousexcavations at the site can only be very generally relocated. A second significant contribution of ourmapping was thus the creation of a grid system. This grid system can be used to reference past,present, and future investigations of the site.
Our mapping demonstrates that the site plan at Crystal River is both more, and less,complex than envisioned by previous commentators. Many of the hypotheses regarding thepresumed solar alignments of features do not stand up to closer scrutiny. However, there are clearlyother elements of the site that argue for deliberate planning. As the focus of this report is primarilydescriptive, we will withhold speculation regarding the social implications of this planning.

36
CHAPTER 3GEOPHYSICAL SURVEY
As noted several times in preceding chapters, contemporary archaeological investigations atthe Crystal River site have been limited in both number and scope. Sampling of the off-moundareas has been less than systematic. In addition, in many cases the results have never beenadequately reported.
Geophysical survey provides a means to achieve a greater understanding of the site, while atthe same time recognizing the need for site preservation. More specifically, we initiated thegeophysical survey with three goals in mind. First, we hoped to identify the internal structure of themounds, including basic methods and materials of construction. Next, we planned to delineate thespatial extent of the domestic occupation, focusing mainly of the horizontal distribution of themidden deposits. Finally, we intended to locate previous excavation units.
MethodsDetailed descriptions of geophysical equipment and techniques are found in numerous
sources (Clark 1990; Dalan et al. 1992; Gater and Gaffney 2003; contributors to Johnson 2006;Kvamme 2003). Briefly, many of these machines work in similar ways by detecting local physicaldifferences in the soil. These differences, termed “anomalies” by geophysicists, may or may notrepresent human-induced disturbances (e.g., hearths, structures, walls, pits etc.). While each of thesemachines works to characterize those physical changes in the soil, they do so in distinctive ways.Therefore, each of these instruments provides a different perspective of the archaeological depositsat a given site. Ideally, researchers should use a variety of archaeological instruments on a site as theyoffer complementary ways to evaluate near-surface geophysical data (Clay 2001:42). As Clay(2001:42 a 42) states, ‘‘the use of multiple techniques on a given site can vastly expand ourunderstanding of its geophysical characteristics and its archaeological structure.’’ The geophysicalprogram at Crystal River included resistance and ground penetrating radar (GPR) surveys.
Resistivity Survey
Resistance surveys induce a known electrical current to measure ease of flow or resistance(Somers 2006:113). Archaeological features, such as pits, house basins, etc., can either be of higheror lower resistance than the surrounding soil matrix, thus allowing detection. In this case, the shelldeposited as midden or used as a construction material at the site should impede the flow and thushave higher resistance values (Dalan et al. 1992:51; Thompson 2007; Thompson et al. 2004:195).
We used a Geoscan RM RM-15 Advanced Resistance Meter to conduct the resistancesurvey. Resistance data were collected in 50 cm intervals along transects spaced 1 m apart using atwin electrode array (Clark 1990:44). The twin electrode array uses two pairs of current andpotential electrodes; one pair of probes was mobile, and the other was inserted in the ground 20 to30 m away from the survey grid. The instrument’s mobile probes were mounted 50 cm apart on asingle frame. This arrangement recorded information up to a depth of approximately 50 cm belowsurface.
Resistivity collection grids generally measured 20 x 20 m. However, in some cases weimposed smaller grids (10 x 20 m) to conform to site features or to avoid obstacles. The resistivitygrids were oriented with grid north (and thus also magnetic north).

37
The project used ArcheoSurveyor® to process all resistance data. Following the procedureoutlined in Gater and Gaffney (2003:104, Figure 49), we first reviewed the raw resistance data. Next, we used a high pass filter and de-spiked the readings. Finally, we enhanced the data bysmoothing and interpolating the values. Although a number of operations were performed,processing did not significantly alter the raw data.
GPR Survey
GPR survey was used to complement the resistance survey. Unlike the resistance survey, theGPR survey provided information on both the horizontal and vertical distribution of archaeologicaldeposits at the site (see Conyers 2004, 2007 for an in-depth discussion of GPR in archaeology). Essentially, GPR propagates a series of radar pulses from a surface antenna. These waves travelthrough the near surface and then are reflected back to the antenna upon encountering a physicalchange in the medium. Buried objects, features, and differences in soil characteristics are allexamples of things that might cause reflections (Conyers 2007).
We used the Geophysical Survey Systems, Inc. (GSSI) SIR-3000 GPR with a 400 MHzantenna to complete the survey (Figure 3-2). As with the resistivity survey, we collected the GPRdata in transect lines spaced 50 cm apart. However, the GPR collection grids were selectively sizedand oriented according to the feature being surveyed. For example, grids on the summit of MoundH were oriented with the long axis of the mound, and sized to cover the platform.
Following collection, GPR data were processed using GPR-SLICE ® software. Radar dataare presented either as individual time slices or as a series of time slices showing how anomalies varyaccording to depth. Time slices are shown as plan view images that are based on the thickness ofanomalies and the radar wave travel time.
Figure 3-1. Resistance survey in the “plaza” northwest of the Main Burial Complex, view to thesoutheast.

38
ResultsThe resistance and GPR surveys provide complementary, but varying data. We thus
consider the results separately before integrating them in a final summary section.
Resistance Survey
The resistance survey covered 49 20-x-20-m collection grids and two 10-x-20-m collectiongrids, resulting in coverage of 2 ha (about 4.9 ac). We estimate this covers approximately one-half ofthe site’s core area. In placing the collection grids, we emphasized areas and features that have beenless intensively excavated and which are not obviously constructed of shell, thus excluding for themost part the Main Burial Complex and Mound A, respectively . Our survey blocks were generallycontiguous, allowing for a broad view of the distribution of archaeological deposits at the site.
Figure 3-3 is a composite map showing the locations of all of the resistivity survey gridssuperimposed over our topographic map. Even at this relatively broad scale of analysis,comparisons between the resistance survey and topographic maps show a striking correspondence;topographic relief generally corresponds with higher resistance readings (i.e., the dark grey to blackareas). This generally reflects the use of shell as a building material, and as principal component inthe accretion of middens. However, there are some exceptions to this pattern. In addition, there area number of anomalies that bear closer scrutiny at fine scales.
Figure 3-2. GPR survey on the summit of Mound H, view to the east-southeast.
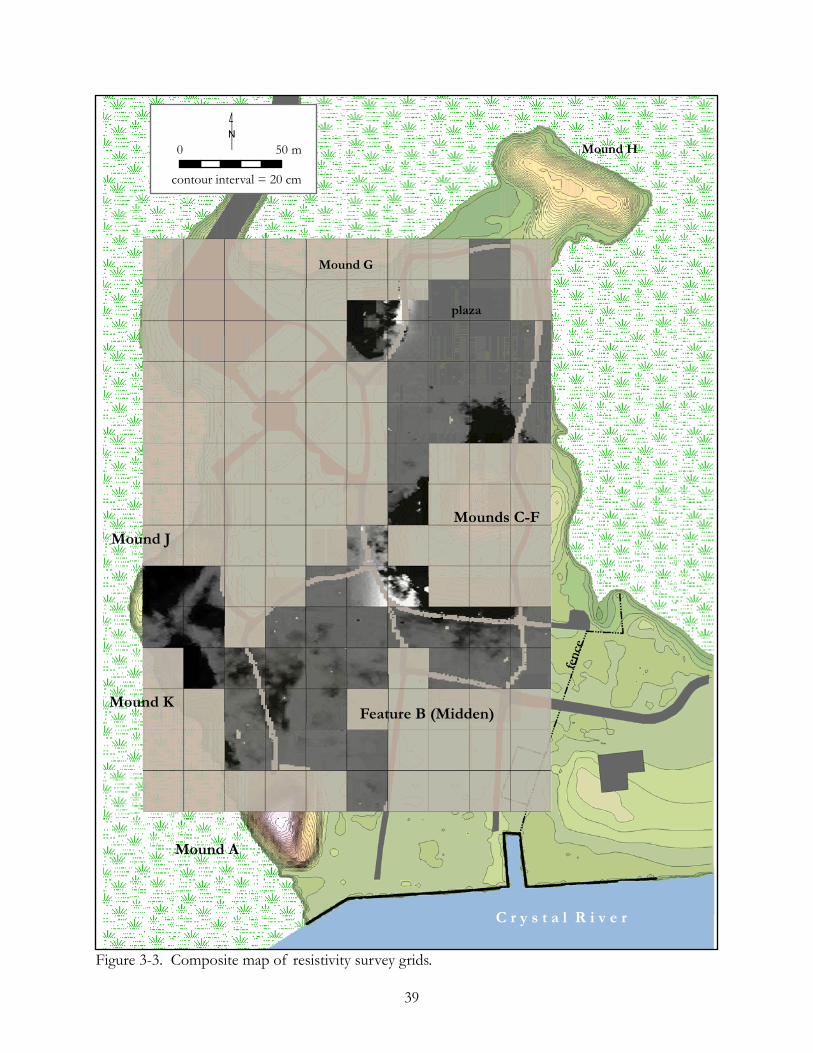
Ñ0 50 m
contour interval = 20 cm
C r y s t a l R i v e r
Mound H
Mound G
Mounds C-F
Mound A
Mound K
Mound J
Feature B (Midden)
plaza
fenc
e
Figure 3-3. Composite map of resistivity survey grids.
39

40
Perhaps some of the mostinteresting resistance data comes from theMound G area (Figure 3-4). The westernhalf of this mound appears as an area ofvery high resistance, no doubt reflectingthe use of shell as building material (recallthat Moore (1903:379) described MoundG as a low and irregular ridge of shell). More notable is the sharp break betweenthese high resistance values and the lowerresistance values to the east (Anomaly 1in Figure 3-4). The latter undoubtedlyreflects the bulldozing of this portion ofthe mound in 1960 (Weisman 1995:37-38). Bullen’s 1960 sketch map of the site(see Weisman 1995:Figure 7) shows apath—possibly the bulldozercut—running almost directly north-southacross Mound G. It seems possible, giventhe strong north-south orientation, thatBullen cleaned the profile of thebulldozer cut. We can place this linebetween the apparent disturbed andundisturbed portions of Mound G at East1084.30 on our grid system.
Even more intriguing is the square-shaped area of lower resistance that extends to the westof this line (Anomaly 2 in Figure 3-4). This area measures almost exactly 20 x 20 ft. Bullen’sexcavation into the undisturbed portions of Mound G has been reported as measuring 10 x 20 ft(letter of Bullen to George C. Dyer, November 11, 1960, on file at the FMNH; Weisman 1995:37-38). However, in several unpublished manuscripts, Bullen (1960, 1965) referred to this as a 15 x 15ft hole. Assuming this anomaly does indeed represent Bullen’s excavation, the pit obviouslymeasured larger than has been reported in any of the previous accounts. We can place the cornersof this presumed excavation unit approximately as follows: 1) Northeast: East 1084.31, North1003.05; 2) Northwest: East 1078.42, North 1003.24; 3) Southwest: East 1078.42, North 996.46; and4) Southeast: East 1084.12, North 996.65.
Resistance data from the presumed plaza also merits closer examination. In the Southeast,plazas are identified as flat areas that evidence no domestic occupation and are usually flanked bysome form of architecture (domestic or monumental) (Kidder 2004:515-516). As was noted in theprevious chapter, Bullen (1965:225) referred to the low, flat area southwest of Mound H and flankedby Mound G and the Main Burial Mound Complex (Mounds C-F) as a plaza. This area is obviouslywell-defined architecturally, but the lack of domestic occupation has been assumed, rather thandemonstrated.
The resistance data lend support for the assumption of a plaza (Figure 3-5). The area isremarkably free of anomalies indicative of shell middens or other domestic features. This stronglysuggests that it is not merely an empty space, but rather “one of the central design elements ofcommunity planning and intrasite spatial organization” (Kidder 2004:515). Plazas have beenidentified at a number of Middle Woodland sites in the region, perhaps most notably at McKeithen(Milanich et al. 1994) and Kolomoki (Pluckhahn 2003; Sears 1956). However, the plaza at CrystalRiver differs from these in that is offset from the most prominent architectural element at the site,Mound A. While unusual, an offset plaza such as this is without precedent. Fort Center, anotherMiddle Woodland center, also has an offset plaza (see Sears 1982).
Figure 3-4. Resistance data from Mound G. Red arrowrefer to anomalies discussed in the text.

41
While the plaza at Crystal Riverdisplays homogeneously low resistancevalues, there is one small, butnevertheless very intriguing, anomalypresent (Anomaly 3 in Figure 3-5). This area of relatively higher resistanceis positioned midway between MoundG and the Main Burial Complex. Further, it aligns relatively closely witha line between the ramp to Mound Hand Stela 2. We are unable to interpretthis anomaly, but it is not unreasonableto suggest that it could represent acultural feature such as a large post orperhaps even another stela. Largeposts are frequent features on MiddleWoodland mounds in the region(Jefferies 1994; Knight 1990, 2001). AtKolomoki, Sears (1956:10) identified anumber of postholes on the edge ofthe plaza below Mound B. Posts werecommonly placed at the centers ofplazas at Mississippian sites (e.g.,Boudreaux 2007; Hally 2008).
Several other small areas in the plaza that display slightly higher relative resistance (such asAnomaly 4 in Figure 3-5) could also represent cultural features. However, most of these correspondwith areas of slightly higher topographic relief, perhaps as a result of trees or other naturaldisturbances. The much larger anomaly (5 in Figure 3-5), corresponds with the northern portion ofMound C, the circular embankment of the Main Burial Complex. In this case, however, it is difficultto determine if the higher resistance values are indicative of shell or simply of disturbed fill, whichwould produce a similar signature. The latter might be more likely, given that the Main BurialComplex was almost completely excavated by Moore and Bullen. The trailing edge of this anomalyleading northwest from the Main Burial Complex corresponds with an old road bed.
As was noted above, we did not make theMain Burial Complex a primary target forgeophysical survey, due to the fact that it has beenextensively excavated and rebuilt. Nevertheless, it isinstructive to look at the resistance grids thatoverlapped the mound (Figure 3-6). As with severalof the mounds, the Main Burial Mound Complex isgenerally marked by high resistance values. In thiscase, however, we believe that these higher valuesrepresent disturbed fill used to recreate the mound,rather than high shell content. Photographs ofBullen’s excavations in Mounds C and F showrelatively little shell in the soil profiles (FMNHnegatives no. 889, 1466, 1262). The diffuse edges ofthese areas of high resistance would also seem to beconsistent with disturbance.
Figure 3-5. Resistance data from the plaza area. Redarrows refer to anomalies discussed in the text.
Figure 3-6. Resistance data from the area ofthe Main Burial Complex.

42
We devoted greater attention tosurveying Mounds J and K, given that theywent untouched by Moore and havewitnessed only limited excavations by laterarchaeologists. As indicated in Figure 3-7,both mounds show up as areas of highresistance. In the case of Mound K, theresistance values are almost uniformlystrong, and also discrete relative tosurrounding areas. This suggests to us thatat least the upper levels of this mound arecomprised of dense shell (see furtherdiscussion below in the context of the GPRdata) and that the mound is well-preserved. Notably, the resistance data suggest a moredirect north-south orientation to Mound Kthan is apparent today.
The sloping sides of Mound Kdisplay distinctly less resistance (less shell?)than the mound summit. Bullen depicted aramp on this eastern slope of the mound inhis 1960 sketch map (see Weisman1995:Figure 7). The low resistance valuesfor this area would seem to cast doubt on this interpretation, although it is possible that such a rampwas a later addition constructed from different, less resistant, fill.
Surprisingly, Bullen’s test in Mound K is not obvious in our resistance data. It is possiblethat his test was located on the western portion of the summit, in the area we did not survey. However, the map of previous excavations on display at the Crystal River Museum places Bullen’sexcavation almost dead-center on the summit. Two factors may be at work. First, the unit wasterminated at a depth of only five feet (Weisman 1995:60). Second, probably very little of the shellfrom Bullen’s excavation was kept. Assuming the unit was backfilled thoroughly, it would thus notbe surprising if the unit did not stand out against the undisturbed portion of the mound.
Mound J displays uneven resistance values. This suggests either that the mound wasconstructed of less homogenous fill (perhaps growing more by accretion than by deliberateconstruction) or that the mound has been disturbed. The undulating appearance of the surface ofthe mound could be consistent with either of these interpretations. In possible support of thenotion that this mound has undergone some disturbance, it is worth noting the depression to thesouth of the mound.
It is also possible—although perhaps not likely—that some of the areas of low resistance inMound J (e.g., Anomaly 6 in Figure 3-7) represent old archaeological excavations. Although Weisman (1995:62) reports that there have been no excavations in Mound J, it is worth noting thatBullen (1953) reportedly excavated a small test at the northern end of the shell ridge extending northfrom Mound A. The reported location would seem to place this test in the vicinity of Mound J.
An area of slightly higher resistance (Anomaly 7 in Figure 3-7) runs between Mounds J andK. This could represent a scatter of shell near the surface associated with the Area B Midden orperhaps some modern-era disturbance associated with the depression to the west. There is also amuch stronger anomaly (8 in Figure 3-7) to the east of these mounds. This anomaly, whichcorresponds to a slight rise in elevation, could represent a denser concentration of shell near thesurface, perhaps a relatively discrete midden pile within the larger Area B Midden, or perhapsformerly buried material pushed nearer to the surface by bioturbation. It could also represent the
Figure 3-7. Resistance data from the area of MoundsJ and K. Arrows refer to anomalies discussed in text.

43
location of a former archaeological excavation; our calculations place Weisman and Mitchem’s unit510N 498E in this area. While the anomaly is larger than the 2 x 2 m excavation unit, it seemspossible that the dispersal of backdirt could create a broader anomaly such as this one.
Mounds J and K and the previously described anomalies are located on top of the northernextension of Area B Midden. It is worth also examining the resistance data for the main section ofthe Area B Midden to the east of these mounds and Mound A. As was noted in the previouschapters, the integrity of this area of the site was seriously compromised by the creation of a mobilehome park in the 1960s. However, surface topography suggests that a number of small areas of themidden may remain intact (as could much larger areas of subsurface midden).
The resistance data from the Area B Midden lend support to the hypothesis that portions ofthe midden remain intact (Figure 3-8). The largest of such areas is located along the former propertyline that extends north from Mound A (see Anomaly 9 in Figure 3-8). Higher resistance values justwest of the property line correspond to greater topographic relief, and suggest the presence of intactshell midden near the surface. These resistance values continue east of the property line in thecorner of the former mobile home park, suggesting that shell midden may survive in this area too.
There are a number of smaller, discrete areas of high resistance within the former limits ofthe mobile home park (see, for examples, Anomalies 10 and 11 in Figure 3-8). Almost withoutexception, these also correspond to areas of higher topographic relief. As with the anomalydescribed above, we suggest that these too may represent intact shell midden deposits.
Figure 3-8. Resistance data from the Feature B Midden area. Arrows refer to anomalies discussedin the text.

44
GPR Survey
We completed seven GPR gridsat Crystal River in 2008 (more precisely,six grids and one single transect “grid”). In contrast with resistivity survey,which moves quickly and permits broadareal coverage, the GPR investigationsare relatively slow. Thus, our GPR gridswere smaller and more targeted. Wefocused particular attention on severalof the mounds that have been lessintensively excavated and thus remainlittle known, in order to gain insightinto the methods and materials ofconstruction, as well as an enhancedunderstanding of how the moundswere used. However, we alsoconducted several GPR grids in off-mound areas (Figure 3-9). Figure 3-10documents the locations of the sevenGPR grids.
The first three GPR grids wereplaced on Mound H. As was noted inChapter 1, limited excavations werecompleted on the summit and ramp ofMound H, but the results have neverbeen reported. As a result, little isknown of the timing or method ofconstruction of this mound. Grids 1and 2 focused on the eastern andwestern halves of the summit platformof Mound H, respectively. Figure 3-11presents vertical profile “slices” fromGrid 1, which measured approximately19.5 x 7 m. Vertical profiles from Grid2, which measured roughly 18 x 5 m,are displayed in Figure 3-12.
The radiogram profiles from both of these grids indicate a highly reflective layer at around50 cm below the surface of the mound. Yet another highly reflective layer is indicated in Grid 2 ataround 90 cm. This layer is also present in the Grid 1, but is less clear due to the presence of otherhighly reflective anomalies just above this layer. Although we cannot say for sure at this time, wesuggest on the basis of these data that Mound H was constructed in at least three stages. The highlyreflective layers represented in the GPR data likely represent construction fill containing higherquantities of shell and/or limestone boulders. This interpretation in based on our knowledge of shelllayering at other shell bearing sites (e.g., Thompson et al. 2004) and photographs at the FMNH ofBullen’s excavation that clearly show layers of dense shell deposits in this mound (see also Weisman1995:Figure 16). Layers containing less reflective material probably represent stages of constructionor use composed of greater amounts of sand than shell. The fact that these levels are represented inthe profiles from both collection grids support a view that, in terms of the length of the platform,Mound H was conceived as we see it today and expanded twice in the same general shape andproportions.
Figure 3-9. View to the southwest of GPR Grid 5.
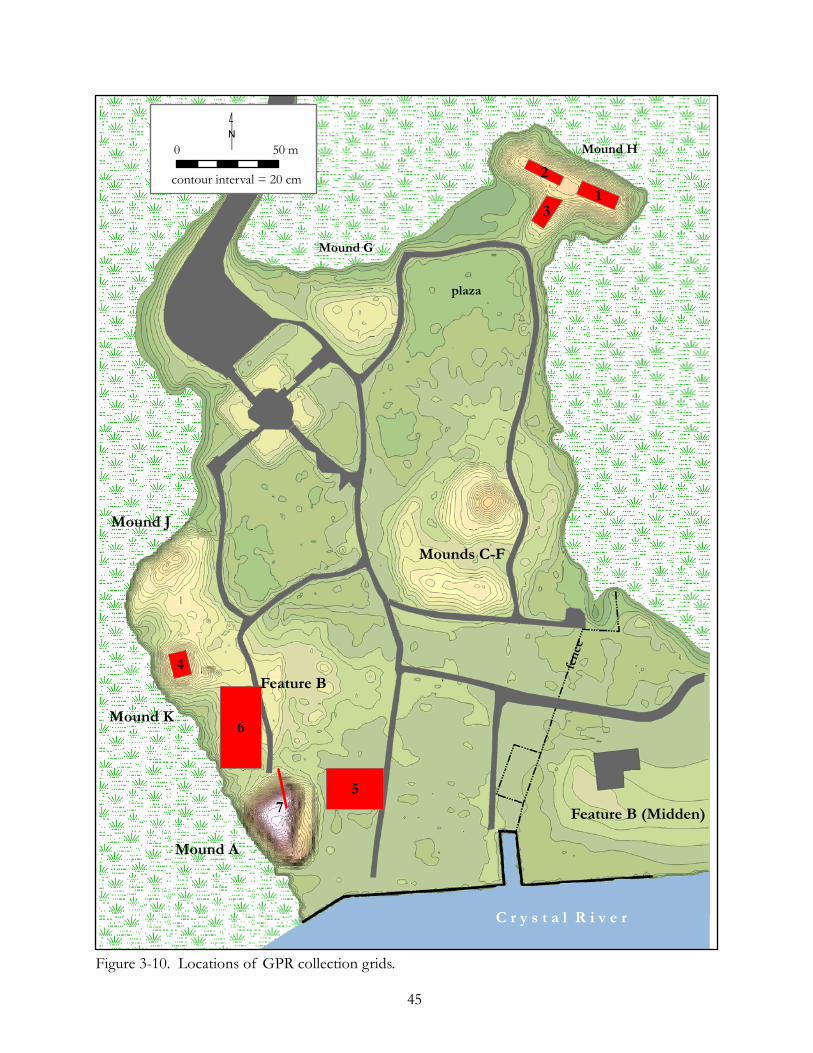
6
5
4
13
2
Ñ0 50 m
contour interval = 20 cm
C r y s t a l R i v e r
Mound H
Mound G
Mounds C-F
Mound A
Mound K
Mound J
Feature B
Feature B (Midden)
plaza
Figure 3-10. Locations of GPR collection grids.
45
fenc
e
7

Figure 3-11. GPR data from Grid 1, on the eastern half of the summit of Mound H. These arevertical profile "slices" oriented east-west (east is to the right). The profiles progress from northto south down the first column, and then continuing down the second column (i.e., the northern-most profile is at top left, the middle profiles are at bottom left and top right, and the southern-most profile is at bottom right).
46

Figure 3-12. GPR data from Grid 2, on the western half of the summit of Mound H. These arevertical profile "slices" oriented east-west (east is to the right). The profiles progress from northto south down the first column, and then continuing down the second column (i.e., the northern-most profile is at top left, the middle profiles are at bottom left and top right, and the southern-most profile is at bottom right).
47

48
Other anomalies can be discerned in the profiles from Grids 1 and 2. As noted above,several highly reflective anomalies are apparent in the profiles from Grid 1, in the area just above thelower-most highly reflective surface that we have tentatively identified as the first construction layer. These anomalies could represent structural remains on this lowermost mound surface or perhapsfeatures such as pits or posts extending down from the later, higher mound surface. However, theycould also represent construction fill, as the fill in this mound was said to include large limestoneboulders (Bullen 1953).
Visible on the easternmost portion of the radiogram profiles from Grid 2 is a stronganomaly that extends from the surface of the mound to a depth of over a meter. We suggest thatthis represents Bullen's excavation on the mound summit, as the anomaly falls in the general vicinityof his test, as indicated on a map at the Crystal River Museum and in photographs of the excavationon file at the FMNH (see also Weisman 1995:Figure 16). A slight depression is apparent on thesurface of the mound in this area today, as indicated also on our topographic map (see Figure 2-13).
Grid 3, which was placed on the ramp to Mound H and measured approximately 16.5 x 7.5m, lends additional credence to some of our interpretations concerning the construction of MoundH. Specifically, the profiles from this grid (Figure 3-13) again display two buried reflective surfaces. The first begins near the current ground surface at the base of the ramp (to the right in Figure 3-13). Near the mound summit, it is buried about 40-50 cm below the surface. A second reflective surfaceparallels this one at greater depth, beginning around 45 cm below the modern ground surface at thebase of the ramp and continuing upwards to the summit where it has an apparent depth of around60-80 cm. Thus, we suggest that, like the mound summit, the ramp of Mound H was constructed inat least three stages, each retaining the same general shape and proportions.
The last five Grid 3 profiles show a very prominent anomaly beginning approximately 2 mfrom the western end of the ramp (near the summit) and continuing about 3-4 m to the east (downslope). The strength of this anomaly, combined with its very regular shape, strongly suggest that thisrepresents the test pit that Bullen excavated in the ramp in 1964. If this is correct, Bullen’s unitwould be positioned within the range of East 1169-1174 and North 1053-1058 on our grid system. This is slightly further north of, and upslope on the ramp from, the position indicated on the mapon display at the Crystal River Museum. As Weisman (1995:60) notes, however, the exact locationof this test is unknown.
The data from Grid 4, placed on the summit of Mound K, provides an interesting contrastwith the results from Mound H. As indicated in Figure 3-14, the profiles from this ca. 12 x 8.5 mgrid reveal that with the exception of the uppermost 40-50 cm of soil, it is composed almostexclusively of highly reflective materials, which we interpret to be high-density shell deposits. Theabsence of any layering suggests to us that this mound, rather than being constructed in stages, wasbuilt in a single episode. The less reflective layer at the top of the profiles could represent thebuildup of soil on the surface of the mound during the period of use, or after use through thedecomposition of organic matter. Alternatively, and perhaps less likely, it could represent thedeliberate addition of a capping layer of relatively shell-free soil. In any case, if our interpretation iscorrect, this mound was constructed using a different technique—and perhaps also under differentcircumstances—than Mound H.
As with the resistance survey, we see no anomalies in the GPR data from Mound K that canbe definitively associated with Bullen’s excavation into the mound. As discussed above, the unit wasterminated at a relatively shallow depth, and we suspect that much of the shell was backfilled. It isalso possible that Bullen’s excavation was located just to the west of our grid, on the western edge ofthe mound summit. In potential support of this explanation, there does appear to be one sharpanomaly in the southern-most edge of the western-most profile (see Figure 13-14, upper left). However, the map display at the Crystal River Museum places Bullen’s excavations near the centerof the summit. We have not identified any photographs of Bullen’s excavation in Mound K in theFMNH that could be used to more closely pinpoint the location of his test.

Figure 3-13. GPR data from Grid 3, on the ramp of Mound H. These are vertical profile "slices" oriented roughly north-south with thelong axis of the ramp (north is to the left). The profiles progress from east to west down the first column, and continuing down thesecond and third columns (i.e., the eastern-most profile is at top left and the southern-most profile is at bottom right). Note that the datahas not been corrected for topography.
49

Figure 3-14. GPR data from Grid 4, on the summit of Mound K. These are vertical profile "slices"oriented north-south (north is to the right). The profiles progress from west to east down the firstcolumn, and then continuing down the second column (i.e., the western-most profile is at top left,the middle profiles are at bottom left and top right, and the eastern-most profile is at bottom right).
50
51
Grid 5, measuring 30 x 20 m, was positioned immediately to the east of Mound A, in thearea where the ramp formerly stood. As noted in previous chapters, the ramp was mined away inthe early 1960s and used to fill a low-lying, lagoon-like area. We hoped to determine if any vestigesof the ramp remain buried beneath the fill.
The data from Grid 5, presented in Figure 3-15 as a series of horizontal planview “slices,”are difficult to interpret. The first four slices seem to indicate a number of disturbances in the upper40 cm, as might be expected given the grading of the ramp and subsequent use of this area as amobile home park. Higher reflective values below around 40 cm suggest the presence of asomewhat more homogenous, denser stratigraphic layer. This would seem consistent with a shelldeposit, as corroborated by coring described in the chapter that follows. Whether this shell depositrepresents a surviving basal portion of the ramp to Mound A or simply shell midden associated withMidden B is impossible to determine.
We are also unable to positively interpret the linear feature that appears along the left(western) edge of the four lowermost slices. This north-south oriented anomaly runs along theformer property line separating the state park from the mobile home park. It is possible that thisanomaly represents some type of buried utility (sewer and water hook-ups are visible on the surfacein this general area of the site), although its depth (beginning around 60 cm below the groundsurface) would seem to cast doubt on this interpretation.
Grid 6, the largest of the seven GPR grids at 40 x 20 m, was located immediately north ofMound A in the northern extension of the Feature B Midden. As with Grid 5, the data here (Figure3-16) are difficult to interpret. The high reflectivity in the uppermost planview slices is consistentwith a midden with a heavy shell content within 40 cm of the surface. This finding is corroboratedby our coring (described in the next chapter).
Below around 40 cm, the planviews display more isolated areas of greater reflectivity. Onepossibility is that the lower levels of the midden in this area are comprised of discrete piles or lensesof shell, rather than the more continuous sheet midden suggested by the uppermost planview slices.
However, several of the anomalies that are visible in the lower planviews begin at or near thesurface. This suggests that these anomalies might instead represent test units, several of which wereplaced in this general vicinity. More specifically, we propose that the anomaly in the southwesternportion of Grid 6 may represent one of the two tests units excavated by Bullen in 1964. If thishypothesis is correct, and if we assume that the sharpest area of reflectivity represents the location ofthe unit, this test would be located somewhere in the range of East 1010-1018, North 782-790 onour grid system.
A second strong anomaly near the northeastern corner of Grid 6 could represent either thesecond of the two test units Bullen excavated in 1964 or one of the units excavated by Smith in 1951(both were in this general vicinity). If so, this unit would fall at approximately East 1025-1028 andNorth 810-813 on our grid.
The final GPR “grid” consisted of a single transect from the summit to the toe of Mound A. Modern obstacles prevented us from expanding this into a larger grid. The Grid 7 transect waspositioned on the better-preserved, northern side of the mound. The transect began about 2 m onto the summit, east of the wooden observation platform and continued down the slope east of thesteps (Figure 3-17). The transect measured about 18 m long, extending from East 1042.64 North760.63 to East 1038.11 North 779.04.
Given that no professional excavations have ever been conducted in Mound A, the radarprofile from the Grid 7 transect (Figure 3-18) provides our only indication of the stratigraphy of themound. Not surprisingly—given that the exposed areas of Mound A show fill containing high shell

Figure 3-15. GPR data from Grid 5, east of Mound A. These are horizontal planview "slices"oriented with north to top. The planviews increase in depth left to right and down, as notedin the caption above each.
52

Figure 3-16. GPR data from Grid 6, in the Area B Midden north of Mound A. These arehorizontal planview "slices" oriented with north to top. The planviews increase in depth left toright and down, as noted in the caption above each.
53

54
Figure 3-17. View to the north-northeast of GPR Grid 7, on the slope of Mound A.
Figure 3-18. GPR data from Grid 7, on the slope of Mound A. This is a vertical profile "slice"oriented roughly south-west (left) to north-east (right). Note that the data has not been correctedfor topography.
55
content—the radar data demonstrates highly reflective fill within the depth of the radar signal (about1.5 m). What is more intriguing, although difficult to interpret from the radar data alone, is the areaof less reflective fill toward the base of the mound (the area to the right in the profile in Figure 3-18). This area, defined by a thin, curving lens of more reflective material (probably shell), could beinterpreted as evidence of an earlier, dome- or conically-shaped mound stage composed mainly ofless reflective materials. Obviously, however, this interpretation must remain very tentative untilfurther investigations can be conducted.
SummaryGeophysical survey provides new insights into the Crystal River site. We can now say with
some confidence that Mound H was constructed in two or three stages but always retained the samebasic shape, with a long, narrow, flat summit and a graded ramp. Some of these mound stages werecomprised of dense shell, while others appear to have had distinctly less shell content. We see noevidence for the three structures that are reported in park interpretive materials to have stood on thesummit (Weisman 1995:60). However, there is some tentative evidence that features such as postsor pits may have been present on one of the earlier mound stages.
We have also identified possible evidence for an earlier stage in Mound A. However, in thiscase the evidence comes from a single radar profile, and thus must be considered preliminary. Likewise, we can tentatively suggest that a portion of the ramp to Mound A may also be preservedbelow the present ground surface. Additional GPR surveys should be conducted to test thesehypotheses.
In contrast with the results from Mounds A and H, the GPR data from Mound K indicatesthat this mound was likely constructed in a single episode from fill composed primarily of shell. Thedata do not provide any definitive support that this mound served as a platform for an eliteresidence as Bullen suggested (letter to George Dyer, November 11, 1960, on file at the FMNH; seealso Weisman 1995:60-62). However, the strongly reflective shell layer may obscure otheranomalies.
The geophysical data also provide new information regarding off-mound areas at CrystalRiver. The existence of a plaza between the Main Burial Complex and Mounds G and H isconfirmed by resistivity data. We cannot say what sort of activities took place in this plaza, but thereis little of the shell debris so prominent in other areas of the site, suggesting that this area wasdeliberately maintained. Nevertheless, the resistivity data also point to several small anomalies in theplaza that might be indicative of features. The most intriguing of these is a small area of highresistance midway between the Main Burial Complex and Mound G, and roughly in line between theramp to Mound H and Stela 2. It is tempting to suggest that this could represent a posthole orperhaps even a buried stela, but such suggestions are obviously conjectural.
The resistivity data demonstrate that the Area B Midden is largely intact in the area north ofMound A. The data also suggest that small areas of intact deposits remain even within the limits ofthe former mobile home park. These findings are supported by coring in these areas, as described inthe following chapter.
The geophysical survey also allows us to place the locations of some of the earlier test unitsat Crystal River, most of which are previously undocumented. We can fix the location of Bullen’sexcavations in Mounds G and H with a fair degree of precision and confidence. Test pits excavatedin the Area B Midden by either Bullen or Smith can be more generally located based on anomalies inthe geophysical data.

56
CHAPTER 4CORING
Our goals in 2008 were to find out as much as possible regarding the internal structure andchronology of Crystal River, while respecting the need for site conservation. For this reason, themajority of our efforts were devoted to topographic mapping and geophysical survey, as detailed inthe two preceding chapters. Geophysical survey data is frequently ambiguous, however. Limited,small-diameter coring provided a means to check the geophysical data with only minimal disturbanceto the site. Secondarily, coring was initiated to provide materials for dating, including both artifacts(for relative dating) and charcoal and bone (for possible radiometric dating).
MethodsCore sampling locations were determined largely with respect to the geophysical survey data.
However, no coring was conducted in mounds or other sensitive areas. Once a suitable coringlocation was chosen, the grid coordinates and surface elevation were recorded with the total station. Core sampling locations were numbered sequentially.
We utilized a core or auger measuring 8 cm (3.2 in) in diameter (Figure 4-1). The coreaccepts a removable transparent plastic liner that can be capped, so that when the core and liner areremoved the soil profile can be observed and recorded. The core measures about 30 cm long. When the depth of the core was reached, the sample was removed and the profile of the section wasrecorded on project specific forms and photographed (Figure 4-2). The core sections were
Figure 4-1. Excavation and screening of Core Sample 1, view to the north.

57
numbered sequentially with increasing depth;Section 1 extended from the ground surface to 30cm below surface, Section 2 from 30 to 60 cmbelow surface, and so on.
Soil samples were collected from the coresections that retained sufficient volume ofundisturbed soil (i.e., soil that was not obviouslyredeposited fill). The remaining soil from eachcore section was screened in the field throughone-quarter inch (0.64 cm) mesh. Artifacts andbone were bagged and labeled by the appropriateprovenience. Shell from the one-quarter inchscreening was weighed in the field and thenbackfilled with the screened soil.
Artifacts and soil samples weretransported to the Department of Anthropologyat the University of South Florida for processing (washing, sorting, counting, weighing, andidentification). Soil samples were transferred to 800 micron mesh bags and subject to running waterto remove the soil from artifacts. The remaining materials were passed through 1 mm mesh andsorted to separate artifacts, bone, shell, charcoal, and other materials. USF graduate students JanaFutch and Shannon McVey processed and sorted the soil samples.
Lithic debitage was sorted by raw material, the presence or absence of cortex, and size. Onlyone stone tool—a chert biface or core tool—was recovered. Pottery was examined forcharacteristics of paste, temper, and surface treatment. Pottery types were identified with referenceto established chronologies for the region (e.g., Willey 1948b, 1949a). Sherds smaller than 1 cmwere classified only as “residual.” The senior author analyzed lithics and ceramics. Shell andcharcoal were weighed and retained but have not been further analyzed. Faunal remains from theone-quarter inch samples were identified by Matthew Compton using the comparative collections atthe University of Georgia Museum of Natural History. Analysis of faunal materials from the fine-screened samples was ongoing at the time this report was completed.
All artifacts, notes, photographs, analysis forms, and other information from this project willbe submitted to the Bureau of Archaeological Research in Tallahassee for final curation. Theartifacts from each provenience were repackaged in acid free plastic bags with acid free paper tagsidentifying provenience.
ResultsWe excavated five core
samples at Crystal River in 2008. Thelocations of these samples areindicated in Figure 4-3. Table 4-1presents the grid coordinates andsurface elevations of the five coresamples. Brief descriptions of thestratigraphy and artifacts recoveredfrom cores follow.
Figure 4-2. Example of a core section.
Core # East North Elevation atsurface
1 1062.08 762.33 1.12
2 1110.25 781.11 1.13
3 1010.87 790.53 1.70
4 1016.91 816.16 1.81
5 989.96 860.03 2.42
Table 4-1. Grid Locations and Elevations for CoreSamples Excavated at Crystal River (see also Figure 4-3).
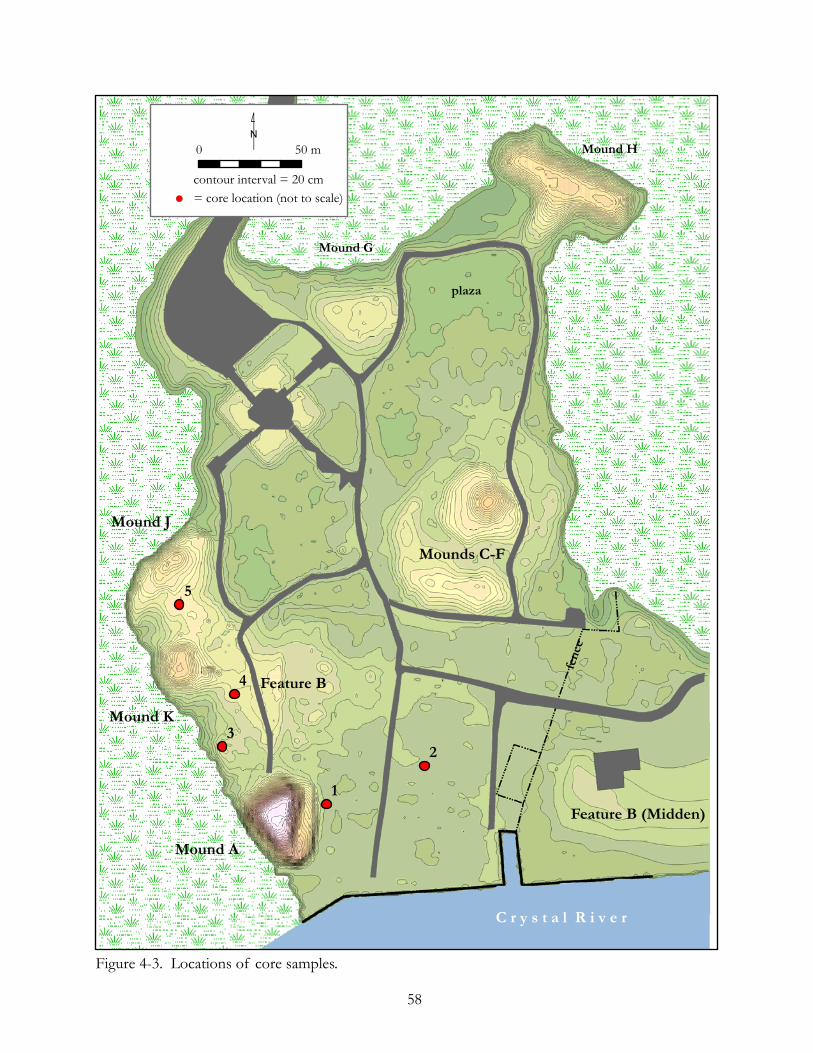
5
4
32
1
Ñ0 50 m
contour interval = 20 cm
C r y s t a l R i v e r
Mound H
Mound G
Mounds C-F
Mound A
Mound K
Mound J
Feature B
Feature B (Midden)
plaza
Figure 4-3. Locations of core samples.
58
fenc
e
!( = core location (not to scale)
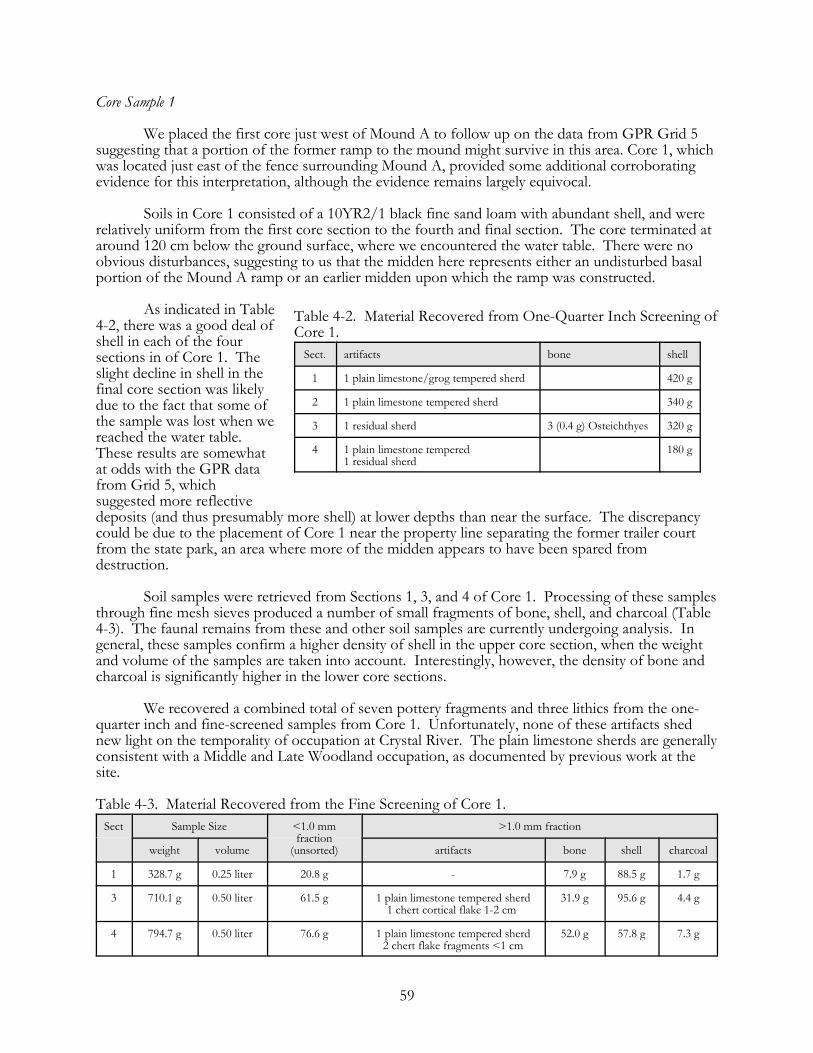
59
Core Sample 1
We placed the first core just west of Mound A to follow up on the data from GPR Grid 5suggesting that a portion of the former ramp to the mound might survive in this area. Core 1, whichwas located just east of the fence surrounding Mound A, provided some additional corroboratingevidence for this interpretation, although the evidence remains largely equivocal.
Soils in Core 1 consisted of a 10YR2/1 black fine sand loam with abundant shell, and wererelatively uniform from the first core section to the fourth and final section. The core terminated ataround 120 cm below the ground surface, where we encountered the water table. There were noobvious disturbances, suggesting to us that the midden here represents either an undisturbed basalportion of the Mound A ramp or an earlier midden upon which the ramp was constructed.
As indicated in Table4-2, there was a good deal ofshell in each of the foursections in of Core 1. Theslight decline in shell in thefinal core section was likelydue to the fact that some ofthe sample was lost when wereached the water table. These results are somewhatat odds with the GPR datafrom Grid 5, whichsuggested more reflectivedeposits (and thus presumably more shell) at lower depths than near the surface. The discrepancycould be due to the placement of Core 1 near the property line separating the former trailer courtfrom the state park, an area where more of the midden appears to have been spared fromdestruction.
Soil samples were retrieved from Sections 1, 3, and 4 of Core 1. Processing of these samplesthrough fine mesh sieves produced a number of small fragments of bone, shell, and charcoal (Table4-3). The faunal remains from these and other soil samples are currently undergoing analysis. Ingeneral, these samples confirm a higher density of shell in the upper core section, when the weightand volume of the samples are taken into account. Interestingly, however, the density of bone andcharcoal is significantly higher in the lower core sections.
We recovered a combined total of seven pottery fragments and three lithics from the one-quarter inch and fine-screened samples from Core 1. Unfortunately, none of these artifacts shednew light on the temporality of occupation at Crystal River. The plain limestone sherds are generallyconsistent with a Middle and Late Woodland occupation, as documented by previous work at thesite.
Table 4-3. Material Recovered from the Fine Screening of Core 1.Sect Sample Size <1.0 mm
fraction(unsorted)
>1.0 mm fraction
weight volume artifacts bone shell charcoal
1 328.7 g 0.25 liter 20.8 g - 7.9 g 88.5 g 1.7 g
3 710.1 g 0.50 liter 61.5 g 1 plain limestone tempered sherd1 chert cortical flake 1-2 cm
31.9 g 95.6 g 4.4 g
4 794.7 g 0.50 liter 76.6 g 1 plain limestone tempered sherd2 chert flake fragments <1 cm
52.0 g 57.8 g 7.3 g
Sect. artifacts bone shell
1 1 plain limestone/grog tempered sherd 420 g
2 1 plain limestone tempered sherd 340 g
3 1 residual sherd 3 (0.4 g) Osteichthyes 320 g
4 1 plain limestone tempered1 residual sherd
180 g
Table 4-2. Material Recovered from One-Quarter Inch Screening ofCore 1.

60
Core Sample 2
Following up on the results of the first core sample, we elected to excavate a second core inthe area east of Mound A that was formerly used as a trailer park. Core Sample 2 was placed well tothe east of the first core.
The soils in Core 2 differed from those in the first core. The soil was lighter in color,consisting of a 10YR3/1 fine sand loam. It was also significantly more compacted, so much so thatwe were forced to terminate the sample at around 50 cm below surface, before the second coresection could be completed excavated. Shell was present, but was largely broken up into smallerpieces. Based on these observations, we believe that Core 2 intercepted a layer of fill that wasdeposited when the area was leveled to create the trailer park. While it is possible that undisturbedsoils lie below this fill, we were unable to reach them with our coring tool. The contrast with Core 1reinforces our view that the soils there are relatively undisturbed by modern development.
We recovered no artifacts from the one-quarter inch screening of the two sections of Core 2. A few small artifacts, as well as bone, charcoal, and shell, were recovered from the fine screening oftwo soil samples, as indicated in Table 4-4.
Table 4-4. Material Recovered from Fine Screening of Core 2.Sect Sample Size <1.0 mm
fraction(unsorted)
>1.0 mm fraction
weight volume artifacts bone shell charcoal
1 504.0 g 0.50 liter 48.2 g 1.6 g 91.5 g 0.2 g
2 674.9 g 0.50 liter 68.7 g 1 residual sherd1 chert flake fragment <1 cm
1.8 g 315.2 g 0.2 g
Core Sample 3
The third core sample was positioned in the Feature B Midden north of Mound A. Asdescribed in the previous chapter, a prominent anomaly is visible in the GPR data from Grid 7 inthis area. We suspect that this anomaly could represent the location of a test unit excavated byBullen in 1964.
Core 3 was excavated to a depth of six coresections. Soils in the first five cores consisted of a10YR3/1 very dark grey fine sand loam. We reachedthe water table near the bottom of Section 5, at a depthof around 150 cm below the ground surface. Anadditional section was attempted. The soil in Section 6consisted of a 10YR3/2 dark greyish brown,waterlogged sandy silt. Shell was present in all of thesections of Core 3, although this is not reflected in theone-quarter inch samples (Table 4-5) because portionsof Section 5 were lost in the water and because all ofsoil that was retrieved from Section 6 was retained forfine screening.
Sect. artifacts shell
1 1 chert biface/core tool 180 g
2 200 g
3 320 g
4 280 g
5
6
Table 4-5. Material Recovered from theOne-Quarter Inch Screening of Core 3.

61
An increase in shell in the lowermost depths of the core is indicated by the data from thefine-screened samples (Table 4-6). The sample from Section 6 indicates that the shell middencontinues below the water table. Section 1 of Core 3 produced the only artifacts of note. Werecovered a chert biface or core tool from the one-quarter inch screening, and a few very small chertlithics from the fine screening.
We saw no evidence of disturbances in Core 3 that could be considered indicative of an oldtest unit. It is possible that our core missed whatever soil conditions produced the anomaly that isvisible in GPR Grid 6—particularly since the core was positioned in the extreme northwestern limitsof the range of grid coordinates we suggested in the previous chapter for the location of thispresumed test pit.
Table 4-6. Material Recovered from the Fine Screening of Core 3.Sect Sample Size <1.0 mm
fraction(unsorted)
>1.0 mm fraction
weight volume artifacts bone shell charcoal
1 397.2 g 0.25 liter 31.8 g 4 chert flake fragments <1 cm 0.4 g 138.1 g 0.1 g
2 395.0 g 0.50 liter 29.9 g <0.1 g ferruginous stone 0.8 g 251.9 g 0.1 g
3 398.7 g 0.25 liter 39.6 g 0.5 g 237.1 g <0.1 g
4 497.0 g 0.50 liter 41.1 g 0.4 g 318.3 g <0.1 g
6 103.5 g 0.10 liter 10.4 g 0.1 g 51.8 g 0.2 g
Figure 4-4. Excavation of Core Sample 3, view to the west.

62
Core Sample 4
Core Sample 4 was also located in the Area B Midden north of Mound A. This wassomething of a “control” sample, in that it was positioned in an area that did not correspond to anymajor anomalies in the GPR and resistance data. It was, however, located on a slight rise inelevation. The core was located about 15 m east-southeast of Mound K.
Soils from Core 4 proved generally comparable to those in other cores in this area. Sections1-3 consisted of a 10YR2/1 black or 10YR3/1 very dark grey fine sand loam. In Section 4, thedarker soil became mottled with a lighter (10YR6/6 brownish yellow) sand. We terminated thiscore sample with Section 4 at a depth of about 123 cm below the ground surface, due to thepresence of an impenetrable root. Although the bottom of the core had not reached the water table,the soil at the base of the last section had become distinctly wetter.
The density of shell and bonegenerally increased with depth inCore 4, as indicated in the materialrecovered from the one-quarter inchscreening (Table 4-7). Several of thebones were identifiable to the ordersof turtles (Testudines) and bonyfishes (Osteichthyes). One bone wasidentifiable as belonging to the genusMugil, which includes various speciesof mullet. Artifacts were limited to asingle chert flake and a plain sherdfrom the uppermost core sections.
The material from the fine-screened samples lends additional credence to our fieldobservations regarding an increase in bone and shell in the earlier, deeper levels of the midden(Table 4-8), with the greatest density occurring in Section 4. As was previously noted, the faunalremains from the fine-screened samples were still undergoing analysis when this report wascompleted. The species list from Core 4 should be much more extensive when this analysis iscompleted.
The large number of sherds in the sample from Section 2 is misleading. One sherd appearsto have broken into a number of very small pieces.
Table 4-8. Material Recovered from the Fine Screening of Core 4.Sect Sample Size <1.0 mm
fraction(unsorted)
>1.0 mm fraction
weight volume artifacts bone shell charcoal
1 209.1 g 0.25 liter 31.9 g 0.4 g 2.5 g
2 349.6 g 0.25 liter 45.3 g 14 residual sherds1 plain limestone tempered sherd1 chert non-cortical flake <1 cm
8.5 g 46.4 g 0.6 g
3 460.5 g 0.50 liter 50.3 g 8.8 g 87.8 g 0.2 g
4 457.8 g 0.50 liter 42.7 g 13.8 g 116.9 g 1.5 g
Sect. artifacts bone shell
1 1 chert cortical flake 1-2 cm 100 g
2 1 plain sand tempered sherd 320 g
3 1 (0.2 g) Testudines1 (0.4 g) Osteichthyes
1 (0.2 g) Mugil sp.
260 g
4 4 (0.6 g) Osteichthyes 260 g
Table 4-7. Material Recovered from the One-Quarter InchScreening of Core 4.

63
Core Sample 5
The fifth and final core sample was in several ways the most successful. First, we were ableto retrieve six core sections and accompanying soil samples. Next, the core produced a number ofartifacts, including one very unusual bone tool or ornament.
Core Sample 5 was excavated in the low area between Mounds J and K. As discussed inChapter 3, the resistivity data showed somewhat higher resistance values here relative to surroundingoff-mound areas. We wondered if represented shell displaced from one of the nearby mounds(most likely Mound J) due to modern disturbances (as the surface topography seems to suggest) or ifinstead there was simply denser shell midden near the surface in this location.
We saw no obvious signs of disturbance in the soils from Core 5. As elsewhere, the soilthroughout the core consisted principally of a 10YR2/1 black fine sand loam. We noted somemottling with a lighter colored (10YR7/2 light grey) sand in Section 4, as was also the case in Core 4. Excavation of the core was discontinued in Section 6, where we intercepted the water table ataround 180 cm below surface.
Contrary to the resistancedata, the density of shell wasactually lighter in the first fewsections of Core 5 than in severalof the other cores that weexcavated (Table 4-9). Thedensity of shell increaseddramatically in the last two coresections, however. The one-quarter inch screening of Core 5also produced bones identifiableas belonging to the genuses ofturtles and bony fish. We alsorecovered plain sand andlimestone tempered pottery.
By far the most interestingartifact recovered from the screening ofCore 5, however, consists of a modifiedmolar from a Florida panther (Pumaconcolor couguar) from Section 6 (Figure4-5). The surface of the tooth has beenextensively ground, perhaps as a resultof its use as a tool or in preparation forits use as a pendant. The bone socketalso appears to have been ground. However, neither the tooth nor thebone socket have been drilled. Moore(1918) recovered the lower jaw of a“puma” (presumably also a panther)from his work at the site.
Sect. artifacts bone shell
1 1 (0.1 g) Osteichthyes 100 g
2 2 residual sherds 80 g
3 1 plain sand tempered sherd 80 g
4 4 plain limestone tempered sherd 160 g
5 1 plain sand tempered sherd 1 (0.1 g) Testudines1 (0.1 g) Osteichthyes
320 g
6 1 modified panther molar 2 (0.2 g) Osteichthyes 320 g
Table 4-9. Material Recovered from the One-Quarter InchScreening of Core 5.
Figure 4-5. Three views of modified panther molarrecovered from Section 6 of Core 5. Shownapproximately actual size.
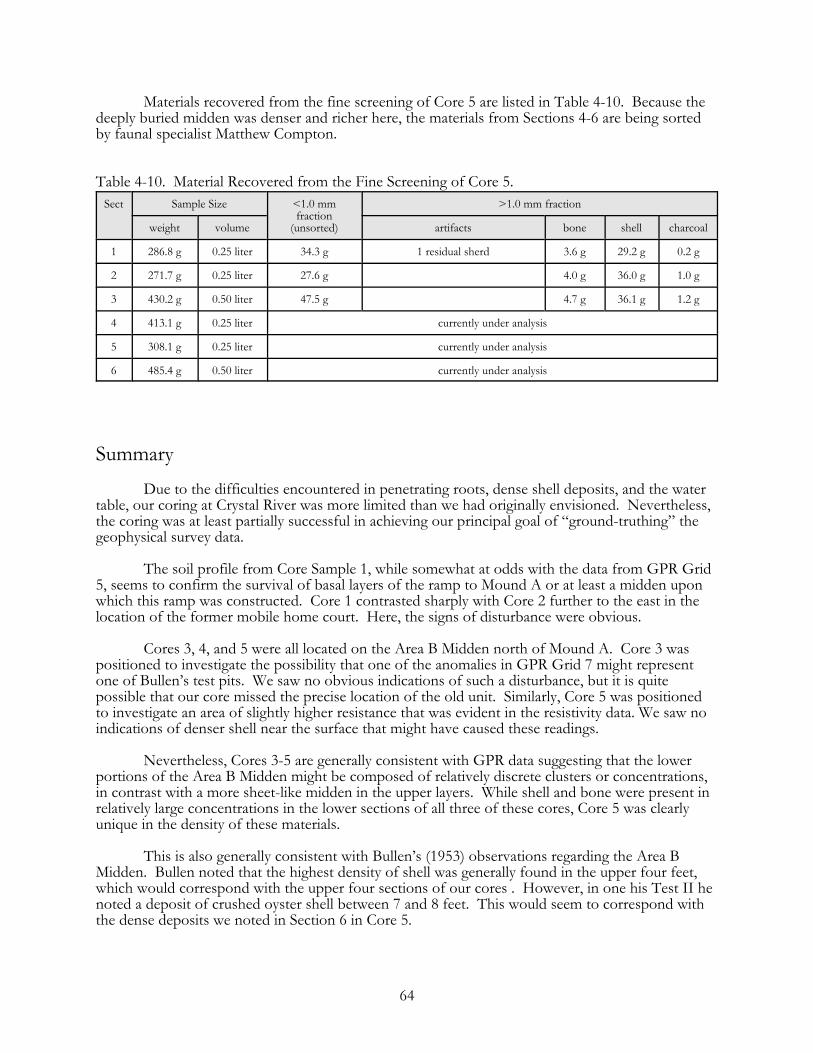
64
Materials recovered from the fine screening of Core 5 are listed in Table 4-10. Because thedeeply buried midden was denser and richer here, the materials from Sections 4-6 are being sortedby faunal specialist Matthew Compton.
Table 4-10. Material Recovered from the Fine Screening of Core 5.Sect Sample Size <1.0 mm
fraction(unsorted)
>1.0 mm fraction
weight volume artifacts bone shell charcoal
1 286.8 g 0.25 liter 34.3 g 1 residual sherd 3.6 g 29.2 g 0.2 g
2 271.7 g 0.25 liter 27.6 g 4.0 g 36.0 g 1.0 g
3 430.2 g 0.50 liter 47.5 g 4.7 g 36.1 g 1.2 g
4 413.1 g 0.25 liter currently under analysis
5 308.1 g 0.25 liter currently under analysis
6 485.4 g 0.50 liter currently under analysis
SummaryDue to the difficulties encountered in penetrating roots, dense shell deposits, and the water
table, our coring at Crystal River was more limited than we had originally envisioned. Nevertheless,the coring was at least partially successful in achieving our principal goal of “ground-truthing” thegeophysical survey data.
The soil profile from Core Sample 1, while somewhat at odds with the data from GPR Grid5, seems to confirm the survival of basal layers of the ramp to Mound A or at least a midden uponwhich this ramp was constructed. Core 1 contrasted sharply with Core 2 further to the east in thelocation of the former mobile home court. Here, the signs of disturbance were obvious.
Cores 3, 4, and 5 were all located on the Area B Midden north of Mound A. Core 3 waspositioned to investigate the possibility that one of the anomalies in GPR Grid 7 might representone of Bullen’s test pits. We saw no obvious indications of such a disturbance, but it is quitepossible that our core missed the precise location of the old unit. Similarly, Core 5 was positionedto investigate an area of slightly higher resistance that was evident in the resistivity data. We saw noindications of denser shell near the surface that might have caused these readings.
Nevertheless, Cores 3-5 are generally consistent with GPR data suggesting that the lowerportions of the Area B Midden might be composed of relatively discrete clusters or concentrations,in contrast with a more sheet-like midden in the upper layers. While shell and bone were present inrelatively large concentrations in the lower sections of all three of these cores, Core 5 was clearlyunique in the density of these materials.
This is also generally consistent with Bullen’s (1953) observations regarding the Area BMidden. Bullen noted that the highest density of shell was generally found in the upper four feet,which would correspond with the upper four sections of our cores . However, in one his Test II henoted a deposit of crushed oyster shell between 7 and 8 feet. This would seem to correspond withthe dense deposits we noted in Section 6 in Core 5.
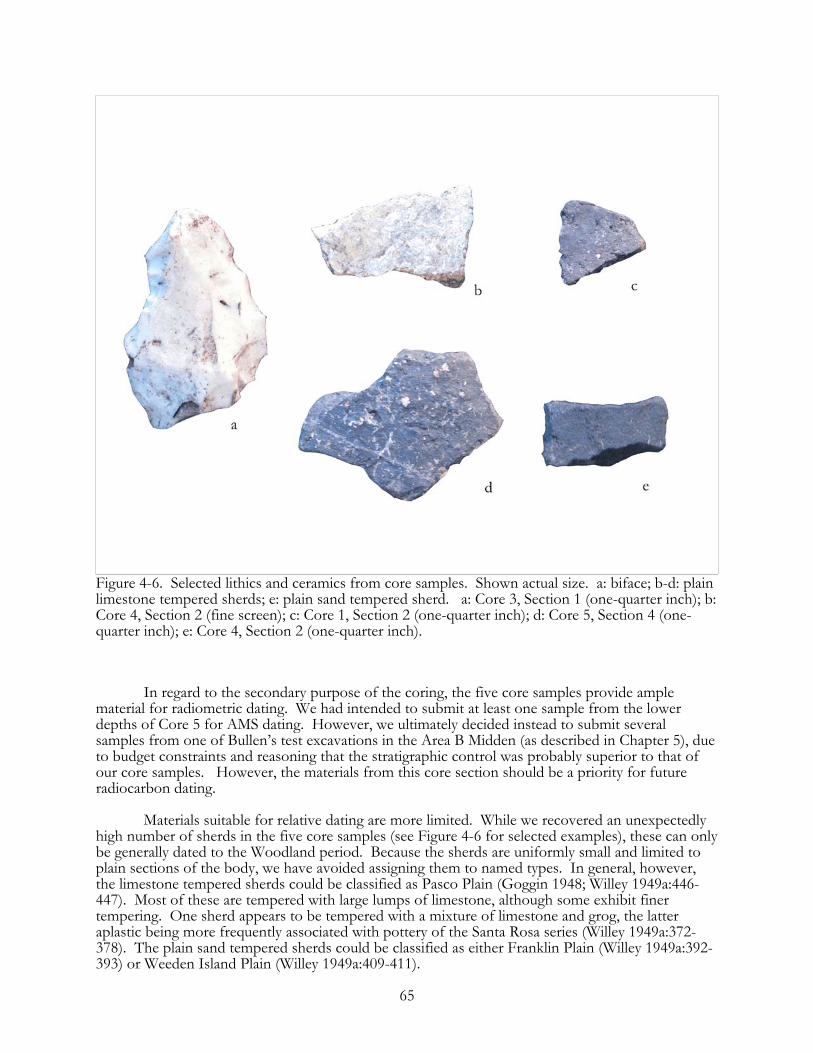
65
In regard to the secondary purpose of the coring, the five core samples provide amplematerial for radiometric dating. We had intended to submit at least one sample from the lowerdepths of Core 5 for AMS dating. However, we ultimately decided instead to submit severalsamples from one of Bullen’s test excavations in the Area B Midden (as described in Chapter 5), dueto budget constraints and reasoning that the stratigraphic control was probably superior to that ofour core samples. However, the materials from this core section should be a priority for futureradiocarbon dating.
Materials suitable for relative dating are more limited. While we recovered an unexpectedlyhigh number of sherds in the five core samples (see Figure 4-6 for selected examples), these can onlybe generally dated to the Woodland period. Because the sherds are uniformly small and limited toplain sections of the body, we have avoided assigning them to named types. In general, however,the limestone tempered sherds could be classified as Pasco Plain (Goggin 1948; Willey 1949a:446-447). Most of these are tempered with large lumps of limestone, although some exhibit finertempering. One sherd appears to be tempered with a mixture of limestone and grog, the latteraplastic being more frequently associated with pottery of the Santa Rosa series (Willey 1949a:372-378). The plain sand tempered sherds could be classified as either Franklin Plain (Willey 1949a:392-393) or Weeden Island Plain (Willey 1949a:409-411).
Figure 4-6. Selected lithics and ceramics from core samples. Shown actual size. a: biface; b-d: plainlimestone tempered sherds; e: plain sand tempered sherd. a: Core 3, Section 1 (one-quarter inch); b:Core 4, Section 2 (fine screen); c: Core 1, Section 2 (one-quarter inch); d: Core 5, Section 4 (one-quarter inch); e: Core 4, Section 2 (one-quarter inch).

66
CHAPTER 5SYNTHESIS OF THE 2008 INVESTIGATIONS
As stated in the introduction to this report, the principal goal of the 2008 investigations atCrystal River was to define more clearly the internal structure and chronology of the site. Previouschapters have summarized each phase of our investigations. Instead of restating these summarieshere, we instead take a synoptic approach that draws together the findings of this and previousinvestigations into a narrative history of the site.
Of course, there are many gaps in our knowledge of the archaeology of Crystal River. Despite a long history of archaeological investigations, the sequences of mound construction andoccupation at Crystal River remain largely obscure. Although excavations have been conducted inmost of the mounds and scattered off-mound locations, these investigations have generally beeninadequately analyzed and reported.
Our investigations shed new light on the history of Crystal River. Detailed topographicmapping (Chapter 2) provides a context for this and previous investigations. The geophysical survey(Chapter 3) helps illuminate the composition, construction, and use of several of the mounds andmidden areas. The coring (Chapter 4) refines some of the insights from geophysical surveyregarding the midden areas, and provides material for dating.
Nevertheless our work, like most of the previous investigations at Crystal River, is alsolimited in scope. Thus, the narrative history we present in this chapter should be considered a seriesof working hypotheses for future research, rather than a definitive statement.
This and previous investigations of the Crystal River site have resulted in a total of 12radiocarbon dates. This total includes five dates retrieved by Bullen (Bullen 1966; Ford 1969;Weisman 1995:Table 2), three dates reported by Katzmarzyk (1998); and four dates obtained inassociation with this project and reported for the first time here. Table 5-1 lists these dates,including both the uncalibrated radiocarbon years before present and the one sigma calibrated datesand ranges in calendar years. The latter were obtained using the OxCal 4.0 calibration program andthe IntCal04 calibration dataset (Reimer et al. 2004; Stuiver and Reimer 1993). Figure 5-1 presentsthis information in graphical form. The plotted areas in this figure represent the probabilitydistributions for the dating results. The brackets below the dates indicate the one sigma ranges forthese distributions. In the discussion that follows, we focus on these one sigma calibrated dateranges, which have a probability of approximately 95 percent.
The earliest radiocarbon date from Crystal River comes from Mound G. This date, with a calibrated range of 800 to 420 cal BC, was retrieved from Bullen’s Burial 1 and previously reportedby Katzmarzyk (1998). As Jerald Milanich (Katzmarzyk’s major professor) noted in emails to BetaAnalytic (on file at the FMNH), this date is problematic for several reasons. First, the date isinconsistent with the pottery from the mound—which consists primarily of Middle Woodland typessuch as Pasco Plain and Saint Johns Check Stamped (Katzmarzyk 1998)—and also from the site as awhole. Next, it supercedes two other dates from the Mound G by at least 400 years when thecalibrated ranges are considered. This would also contradict Bullen’s (1965) hypothesis that MoundG was the result of a mass burial episode, and thus should not have a long time span. This interpretation is obviously questionable given the radiocarbon evidence. The early date fromMound G is also surprising because Bullen (1965) believed that this feature dated late in the site’shistory, perhaps even to the Safety Harbor period. However, based on his examination of theartifacts, Weisman (1995:58-59) argues that there is little reason to believe that the mound dates aslate as Bullen surmised.

67
Table 5-1. Radiocarbon Dates from the Crystal River Site. Calibrated dates were computed with theCalib 5.0 calibration program and the IntCal04 calibration dataset (Reimer et al. 2004; Stuiver andReimer 1993), and rounded to the nearest decade.
Sample # Context RadiocarbonYears BP
1 Sigma Calibrated Date Range Reference(s)
Beta-98043 bone from Bullen’s Burial 1 inMound G
2520+/-60 800 to 420 cal B.C. Katzmarzyk 1998:33Milanich 1999:23
Beta-254521 human bone from the circularembankment
2490+/-40 780 to 420 cal B.C. this report
I-1916 unidentified material fromMound B midden
1980+/-100 350 cal B.C. to cal A.D. 250 Ford 1969:29Weisman 1995:Table 2
I-1366 unidentified material fromMound B midden, “depositsfrom the Deptford period,but...not from the lowest partof these deposits”
1870+/-130 200 cal B.C. to cal A.D. 430 Bullen 1966:861Weisman 1995:Table 2
Beta-97072 bone from Bullen’s Burial 2 inMound G
1990+/-40 90 cal B.C. to cal A.D. 120 Katzmarzyk 1998:33Milanich 1999:23
I-1464 first of two dates from samecharcoal sample from cache offood remains associated withStele 1 (this sample was treatedwith hot caustic soda toremove contaminants and wasrun in small counter)
1600+/-210 40 cal B.C. to cal A.D. 870 Bullen 1966:864Weisman 1995:Table 2
I-1367 unidentified material fromMound B midden, “depositsfrom the Deptford period,but...not from the lowest partof these deposits”
1750+/-130 20 cal B.C. to cal A.D. 570 Bullen 1966:861Weisman 1995:Table 2
Beta-98044 bone from Bullen’s Burial 35in Mound G
1620+/-40 cal A.D. 340 to 540 Katzmarzyk 1998:33Milanich 1999:23
I-1464 second of two dates fromsame charcoal sample fromcache of food remainsassociated with Stele 1 (thissample was not treated andwas run in larger counter)
1420+/-125 cal A.D. 350 to 890 Bullen 1966:864Weisman 1995:Table 2
Beta-254523 deer bone from Bullen’s (1951)Test 2 in the Area B Midden,72-78"
1580+/-40 cal A.D. 400 to 570 this report
Beta-254520 worked deer bone fromBullen’s Test 1 in Mound H(1960), 1-2'
1550+/-40 cal A.D. 420 to 600 this report
Beta-254522 deer bone from Bullen’s (1951)Test 2 in the Area B Midden,24-30"
1460+/-40 cal A.D. 540 to 660 this report
I-1365 charcoal lens found in profileof Mound A, 19 ft belowsummit
1310+/-100 cal A.D. 560 to 970 Bullen 1966:865Weisman 1995:Table 2
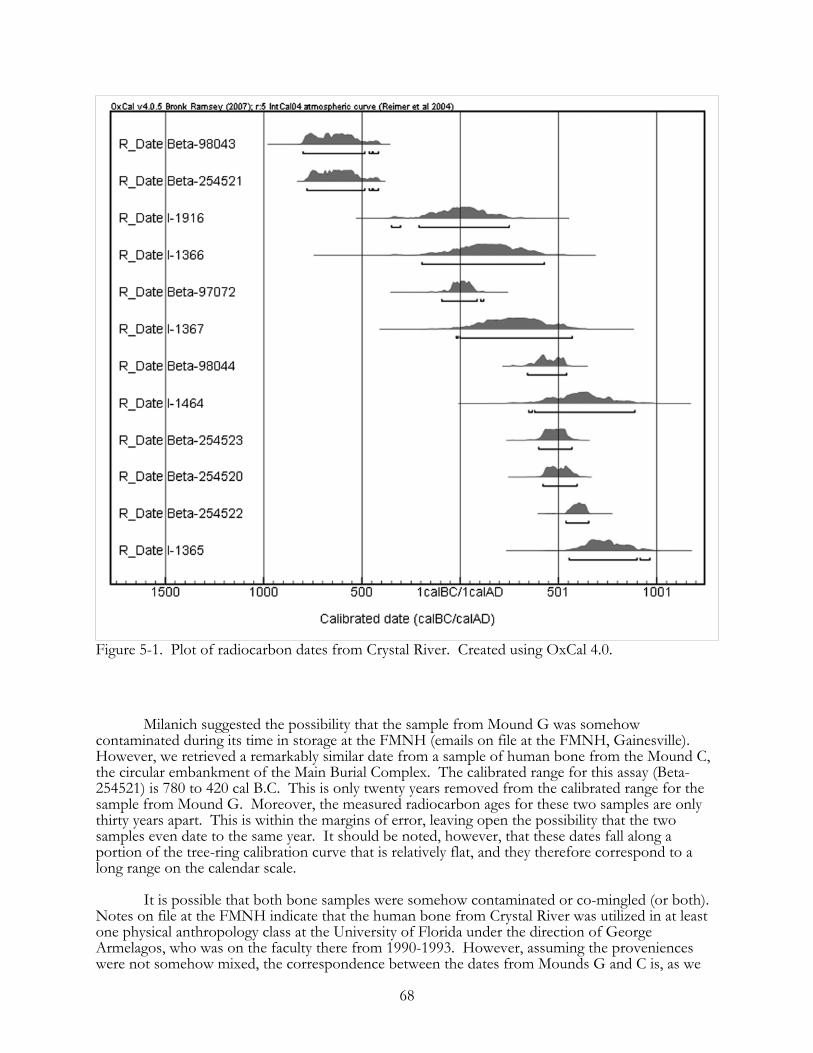
68
Milanich suggested the possibility that the sample from Mound G was somehowcontaminated during its time in storage at the FMNH (emails on file at the FMNH, Gainesville). However, we retrieved a remarkably similar date from a sample of human bone from the Mound C,the circular embankment of the Main Burial Complex. The calibrated range for this assay (Beta-254521) is 780 to 420 cal B.C. This is only twenty years removed from the calibrated range for thesample from Mound G. Moreover, the measured radiocarbon ages for these two samples are onlythirty years apart. This is within the margins of error, leaving open the possibility that the twosamples even date to the same year. It should be noted, however, that these dates fall along aportion of the tree-ring calibration curve that is relatively flat, and they therefore correspond to along range on the calendar scale.
It is possible that both bone samples were somehow contaminated or co-mingled (or both). Notes on file at the FMNH indicate that the human bone from Crystal River was utilized in at leastone physical anthropology class at the University of Florida under the direction of GeorgeArmelagos, who was on the faculty there from 1990-1993. However, assuming the provenienceswere not somehow mixed, the correspondence between the dates from Mounds G and C is, as we
Figure 5-1. Plot of radiocarbon dates from Crystal River. Created using OxCal 4.0.

69
stated above, remarkable. Further, other samples of human bone from Crystal River have produceddates more in keeping with expectations of an occupation in the Middle Woodland period (as notedbelow), arguing against some type of contamination of the collections at the FMNH.
Assuming the two dates are correct, the implications for the history of Crystal River areprofound. First, the dates suggest that at least two individuals were interred on the site during theEarly Woodland period, rather than the Middle Woodland period as has long been assumed. Perhaps more important, it suggests that the site may have been used as a burial ground before therewas any domestic occupation, given that the earliest calibrated date from the midden is at least 70years more recent (of course, it is possible that additional dating of the midden will somedayproduce correspondingly early dates). Finally, it suggests that the construction of Mounds C andG—or at least mortuary activities in the areas where these mounds were later built—began aroundthe same time, perhaps even at precisely the same moment. This would suggest a greater degree ofplanning and complexity from the founding of the community than has heretofore been imagined. Clearly, additional dating of materials from these mounds is called for to resolve this issue.
Early in his work at Crystal River, Bullen suggested that the site was probably first occupiedaround A.D. 200 (letter of Bullen to G.L. King, June 22, 1951, on file at the FMNH). He lateramended his estimate to “...a little before the time of Christ” (Bullen 1965). Radiocarbon dates fromthe site are more consistent with his second estimation. The calibrated ranges for a number ofradiocarbon assays from the Area B Midden suggest that people began living at the site sometimeduring the third to first centuries B.C. The earliest of these samples (I-1916) has a calibrated rangebeginning at 350 cal B.C. Unfortunately, we have little information regarding the context for thisdate; it was omitted from Bullen’s (1966) publication and only subsequently reported by Ford(1969:29) (see also Weisman 1995:Table 2). The range for a second date from the Area B Midden(I-1366) begins at 200 cal B.C. Bullen (1966:861) noted that this date was associated with depositsfrom the Deptford period, although not the lowest (earliest) such strata. A third date from themidden (I-1367), also obtained by Bullen and described in the same manner, has a range beginningat 20 cal B.C.
All of these early dates from the Area B Midden have relatively large uncertainty valuesrelative to most radiocarbon dates processed using contemporary protocols. For this reason, wesubmitted two samples from the Area B Midden for AMS dating. Both of these samples wereobtained from Bullen’s Test 2, excavated in 1951. We chose one sample from the lower levels ofthis unit, at a depth of 183 to 198 cm (72-78 in). Bullen associated the deposits from this depth withthe Deptford/Santa Rosa-Swift Creek occupation. This sample (from a deer bone) produced a datewith a calibrated range from cal A.D. 400 to 570 (Beta-254523). This is somewhat more recent thanexpected. However, Unit 2 was excavated to a depth of 213 cm (84 in) and Bullen indicated that themidden deposits continued still deeper, below the water table. Thus, we clearly did not date theearliest occupation of the site.
Our second sample (also from a deer bone) was obtained from a depth of 61 to 76 cm (24 to30 in), within the stratum Bullen associated with the later Weeden Island occupation. This yielded adate with a calibrated range of cal A.D. 540 to 660 (Beta-254522). Although the calibrated rangesfor the two dates from this unit overlap, the later date from this sample is consistent with its higherstratigraphic position, lending an additional measure of confidence.
Taken together with those obtained by Bullen, our dates from the Area B Midden suggest along span of domestic occupation at the site. We would suggest that people began living at CrystalRiver by around 100 B.C., and perhaps even 200 or 300 B.C., near the beginning of the Deptfordperiod (Milanich 1994:114). The occupation of the site probably continued until at least the A.D.600s.
The starting date that we have suggested for the village occupation is somewhat earlier thanhas been proposed by several of our contemporaries (e.g., Milanich 1999:20; Weisman 1995:5-6). In

70
addition to the radiocarbon dates, we think that there is other evidence to support ourinterpretation. The Area B Midden deposits extend below the current water table, as indicated bothby our coring and by Bullen’s test units. While some subsidence has undoubtedly taken place overthe course of the last two millennia, it is reasonable to assume from this evidence that sea levels werelower than at present at the time the site was initially occupied. Archaeological and geologicalevidence from the southwestern coast of Florida is consistent with this hypothesis. Walker andcolleagues (1994) suggest that sea levels were 30-60 cm below their present levels from 1050 to 50B.C. Beginning around A.D. 100, sea levels rose to 70-80 cm above their current levels, andremained high until around A.D. 600. Thus, our argument that the earliest occupation of CrystalRiver took place in the first century B.C. would seem consistent with the sea level data (c.f. Milanich1999:20).
If this interpretation is correct, the initial settlement at Crystal River would have been locatedfurther from the Gulf of Mexico, and presumably also from shellfish beds. As sea levels rose overthe course of the site’s occupation, Crystal River may have become better positioned economicallyand ecologically. Milanich (1999:20) suggests that, as a result of higher sea levels, the residents ofCrystal River would have been able to gather shellfish from the adjacent estuary, rather than havingto canoe to shellfish beds located closer to the Gulf of Mexico.
We find some evidence for this historical reconstruction in the limited data that is availablefor the composition of the Area B Midden. Bullen (1953), summarizing his own stratigraphicexcavations and earlier work by Hale Smith, described the upper 1.2 m (4 ft) of the midden asconsisting of black dirt and shells. He estimated that shell represented about 40 percent of thedebris, and that about 70 percent of the shell was oyster. Below 1.2 m, Bullen noted that shelldeclined to about 15 percent by volume. However, some concentrations of shell were noted in thelower, earlier levels of the midden; in Test II, Bullen encountered a deposit of crushed oyster shellbetween 2.1 and 2.4 m (7 and 8 ft) below the modern ground surface.
Our data from the Area B Midden are generally consistent with Bullen’s observations. Asnoted in Chapter 3, the resistance and GPR data suggest the presence of a sheet midden with a highshell composition in the upper levels of the midden. The GPR data, although far from conclusive,suggest that the lower levels of the midden may be composed of more discrete clusters of shell. Wenoted a similar trend in the core samples, as described in Chapter 4. In the fine screened samplesfrom cores in the Area B midden, the shell content generally increased as we progressed deeper in Sections 1 to 4 (to a depth of 120 cm). The shell content then generally declined in Sections 5 and 6(120 to 180 cm). However, we noted a possible increase in shell in Section 6 of Core 5 (these dataare still being processed), perhaps corresponding with the concentration noted by Bullen in thelowermost levels of his Test II.
In sum, we suggest that the domestic occupation of Crystal River likely began in the firstcentury B.C. or slightly earlier, at a time when sea level was lower and the Gulf of Mexico waslocated further away from the site. The earliest occupants of Crystal River probably practiced asubsistence regimen focused primarily on terrestrial animals and fish caught in the adjacent river. Canoe trips would have been necessary to gather oysters. The shells were probably discarded inrelatively discrete piles around the settlements on the low sand ridge adjacent to the Crystal River. As sea levels rose after around A.D. 100, shellfish beds may have been established nearer the site. The residents of Crystal River took increasing advantage of these readily available resources,resulting in a midden with a higher and more continuous shell content. As discussed in greater detailbelow, the increasing availability of shell would have also facilitated the construction of monuments.

71
In a unpublished manuscript on file at the FMNH, Bullen (n.d.), imagined the earlycommunity at Crystal River as probably consisting “...of a small shell-ridge village and itsaccompanying small burial mound (part of the main burial mound).” As noted above, if the earlydates from Mounds C and G can be trusted, than Bullen’s reconstruction will need to be amended to reflect the fact that burials may have been placed on the site several centuries earlier. Nevertheless, we agree with Bullen that the much of the construction of the Main Burial MoundComplex probably took place after the earliest occupation in the village, perhaps sometime in thefirst century A.D. We have no dates yet from Mounds E and F of the Main Burial Complex tosupport this assumption. Instead, this interpretation is based on the types of pottery found in thesemounds. Hopewellian artifacts recovered by Moore (1903, 1917, 1918) and identified by Sears(1962) as markers of the Yent Complex also suggest a date in the range of one or two centuries A.D. Such is indicated by a number of radiocarbon dates from Mound B at the Mandeville site insouthwestern Georgia, which shares many traits with Mounds E and F at Crystal River (Kellar et al.1962a, 1962b; Smith 1979). Knight and Mistovich (1984:219) place the Mandeville phase betweenA.D. 1 and 300. Finally, but more tentatively, we suggest that the lack of shell in the fill composingthe Main Burial Complex reflects construction before around A.D. 100, when sea levels began torise and shellfish beds were established in closer proximity to the site.
Milanich (1999:14) suggests that Mound E probably began as “...a platform moundcontaining burials, perhaps with a ramp on the southeast side.” Mound F was subsequently addedon the northeast side of this platform (Milanich 1999:14; Willey 1949:316-323). Both Moore andBullen believed that Mounds E and F dated earlier than the surrounding circular embankment(Mound C). However, later work in the embankment divulged the presence of ceramics as early asthose from Mounds E and F (Bullen 1965; Milanich 1999:18). This suggests, as Weisman (1995:56,58) has pointed out, that these mounds form a complex, in the sense of “a set of associated featuresthat had been constructed according to some kind of design” (see also Milanich 1999:18). In fact, itmay even be reasonable to suppose that the embankment was constructed first, given ourradiocarbon date (described above) and the relative lack of Hopewellian items.
Our geophysical work adds no new information regarding the construction and use of theMain Burial Complex, which was thoroughly excavated by Moore and Bullen. Milanich (1999:21)interprets the burial mound complex as a lineage facility—a recognizable symbol of lineagemembership associated with ceremonies performed by lineage members and led by elders or priests. As the lineage became more wealthy over the course of several decades (or even centuries), themound may have been enlarged and elaborated with the construction of the embankment (Milanich1999:22). We generally concur with this interpretation, although we believe that the mound complexmay have been symbolic of a larger corporate identity.
The Main Burial Complex may not have been the only monument at Crystal River to beconstructed during the first and second centuries A.D. We have already mentioned an earlyradiocarbon date from Mound G, suggesting at least the presence of some burials in this area at anearly date. A second, more precise date from Mound G has a one-sigma calibrated range from 90cal B.C. to cal A.D. 120. This would seem indicate that this burial mound was in use as the sametime as Mounds E and F of the Main Burial Complex. A third date from Mound G has a calibratedrange from cal A.D. 340 to 540, suggesting that the mound was in use for a few centuries.
A relatively early date for Mound G may also be supported by the relative paucity of shell inthe mound fill. As we noted above, shell might have been easier to obtain later in the site’s history,when sea levels were higher. It follows that mounds with less shell—like the Main Burial Complexand Mound G—might be reasonably dated to earlier periods of occupation. Our resistivity datashowed strong reflective values for Mound G, indicating that shell is present near the surface. However, photographs of Bullen’s excavations in this mound (on file at the FMNH) indicate thatshell was not a principal component of the fill, as Weisman (1995:59) has also noted. It is alsoworth pointing out that stable carbon isotope values from burials in Mound G suggest a diet focusedmore on mixed terrestrial and freshwater resources than marine species (Katzmarzyk 1998:37).
72
The resistance survey allows us to pinpoint the location of Bullen’s excavation in Mound Gwith a high degree of accuracy, as described in Chapter 3. Re-excavation of this unit, or at least aportion of it, would allow an appraisal of the stratigraphy of the mound and Bullen’s interpretationregarding its construction history. For the moment, however, we must defer to the evidencesuggesting that Mound G and the Main Burial Complex were in use at the same time. How do weexplain the contemporaneity of these mounds? It seems possible that these mounds were burialfacilities for different corporate groups within the community that lived at Crystal River, perhapsdistinct lineages or moieties. Their opposition across the plaza would seem to symbolically reinforcea dual social organization along the lines of the latter. It is also possible that these burial moundsreflects some larger social division recognized by people who came to the site on ceremonialoccasions from further flung settlements. For a clearly conjectural example, we can imagine thatvisitors from outlying communities to the north and south of Crystal River maintained distinct burialfacilities that reflected their geographical division.
As alluded to above and previously summarized in Chapter 3, our geophysical investigationslend additional support to the interpretation of the area between Mound G and the Main BurialComplex as a deliberately maintained plaza. The resistivity data demonstrates conclusively that thisarea is almost entirely free of the shell midden so pervasive across much of the rest of the site. Although we cannot date the plaza directly, it is indirectly dated to the same interval as the featuresthat define it, including Mound G and the Main Burial Complex.
We obtained a radiocarbon date with a calibrated range of cal A.D. 420 to 600 (Beta-254520)from the third feature that defines the plaza, Mound H. This date was taken on a small sample of aworked deer bone recovered by Bullen in his Test 1, excavated on the summit of Mound H in 1960. The bone was recovered from a depth of 31 to 61 cm (1-2 ft). The GPR data from the summit andramp of Mound H suggests that this mound was expanded at least twice. Our radiocarbon assaydated that last mound construction stage, so it reasonable to assume that construction of Mound Hmight have begun as early as A.D. 300 or 400. The high density of shell in the fill of the mound, asindicated by the GPR data and by photographs of Bullen’s excavation, is consistent with a period ofconstruction after shellfish beds became established nearby.
The GPR data suggest that each time Mound H was expanded, it retained the same basicshape and proportions. This is a significant new insight. As with the Main Burial Complex, itsuggests continuity in the conception, if not also the use, of this mound. It further suggests that, likethe Main Burial Complex, Mound H and the adjoining were conceived of and used as a complex. We would note here Bullen’s (1965) suggestion that the plaza was a space for watching ritualperformances on Mound H.
As was noted in Chapter 3, GPR survey on the summit of Mound H revealed possibleevidence for the excavation unit that produced the bone sample submitted for radiocarbon dating. We are able to pinpoint the location of Bullen’s excavation unit in the ramp of Mound H with ahigher degree of confidence, given its strong signature in the GPR data. Re-excavation of one orboth of these old excavations would help better interpret the geophysical data, and thus also theconstruction and use of Mound H.
In Chapter 2, we noted that the ramp from Mound H is roughly oriented to face Stela 2, onthe opposite side of the plaza. In the resistivity data from the plaza, we also observed a smallanomaly in line with the features and midway between the Main Burial Complex and Mound G. Wecan only speculate on the nature of this anomaly, but it is interesting to suppose that it couldrepresent a post mold or perhaps even a buried stela.
There are no radiocarbon dates for Stela 2. However, Bullen (1966) retrieved tworadiocarbon dates on material associated with Stela 1, the more elaborately carved limestone slabsouth of the Main Burial Complex. The two assays were conducted on the same sample of charcoalfrom a cache of food remains. One portion of the sample was reportedly treated with hot caustic

73
soda to remove contaminants and was run in a smaller (and presumably less accurate) counter. Thisdate has a very large margin of error and thus also a very broad range in calibrated calendar years. The second portion of the sample was not treated and was run in a larger (presumably moreaccurate) counter. This date is at least somewhat more precise, and has a calibrated range extendingfrom cal A.D. 350 to 890.
The stelae at Crystal River remain difficult to interpret. Bullen (1966) was convinced that thestelae were deliberately erected, and that at least the face on Stela 1 had been carved in antiquity (hesuggested that the arms were more recent additions). He pointed to similarities with stelae in theMaya area. Weisman (1995:62-65) rightly dismisses the latter speculations, but suggests that thereare stylistic similarities between the carved face on Stela 1 and representations of human and animalfigures elsewhere in the prehistoric Southeast. Milanich (1999:23) favors the view that the stelae are“...simply limestone slabs that eroded up from the surface of the limestone stratum that underlies thesite.” He withholds judgement on the question of whether the carving on Stela 1 was completedrelatively recently or instead is of greater antiquity.
Our coring and geophysical investigations did not extend to the area near Stela 1. However,coring elsewhere indicated that the Area B Midden extended to a depth of more than 2 m, wellbelow the bottom of Stela 1 as indicated by Bullen’s (1966) excavations. This would seem to suggestthat the stela was deliberately erected on top of previous midden layers. In this light, theradiocarbon date for food remains associated with Stela 1 seems reasonable.
Bullen (1966) posited a relationship between Stela 1 and Mound A, pointing out that theformer ramp to the mound was oriented roughly toward the limestone monument. Our mappingindicates that the alignment is less straightforward than indicated by Bullen—in fact the rampappears to have pointed substantially east of Stela 1. Our mapping also suggests that the distancesbetween mounds and stelae are further than described by Bullen. Nevertheless, Bullen’s generalpoint—that the two platform mounds at Crystal River each roughly face a stela and that thedistances between the mounds and stelae are comparable—appears valid.
Bullen’s suggestion of a relationship between Stela 1 and Mound A was bolstered by aradiocarbon date (I-1365) he obtained from a charcoal lens found in the profile of Mound A, 5.8 m(19 ft) below the summit. This sample is calibrated to the interval from cal A.D. 560 to A.D. 970. This suggests that at least the upper portions of Mound A—like Stela 1—date relatively late in thehistory of the site, albeit not as late as A.D. 1200 as Bullen (1953, 1965) sometimes suggested.
Our geophysical investigations of Mound A were limited to a single GPR transect, and ourobservations must therefore be considered tentative. However, the data seem to indicate thepresence of an earlier, dome-shaped construction sequence within the mound. This layer displaysless reflective values than the upper surface, which is obviously comprised primarily of shell. Weoffer as a hypothesis for future research the notion that a small sand mound was constructed early inthe occupational sequence of Crystal River, before sea level rose and shellfish beds were establishednear the site. Later in the history of the site, at a time when shellfish was more easily obtained fromthe adjacent estuary, the mound was significantly enlarged to form a flat-topped pyramid with agraded ramp.
We have no new definitive evidence for the dating of Mounds J and K. Resistivity datasuggests that the upper surfaces of both mounds are composed primarily of shell, as is readilyapparent from the surface. GPR data further suggest that Mound K was erected in a single stage,with shell as the primary constituent of the fill. Following the logic we have developed above, thesemounds would date relatively late in the history of Crystal River.
Bullen (1965) suggested that Mound K may have served “...as a foundation for a chief’s orhigh priest’s home.” We see no evidence in the GPR data for the presence of a structure on top of
74
the mound. However, we were also unable to positively relocate Bullen’s test pit on the summit. Additional geophysical survey may be called for.
The latest radiocarbon date thus far obtained from Crystal River has a calibrated rangeextending to cal A.D. 970. It is therefore possible that the occupation of the site lasted as late as theWeeden Island-Safety Harbor period transition or even the early Safety Harbor period, as Bullen(1953) suggested. However, the bulk of the archaeological evidence clearly suggests that thefluorescence of Crystal River was a Middle Woodland phenomenon, falling primarily in the periodfrom a century or two B.C. to 600 or 700 A.D.
We hope this report serves as the beginning of a more enlightened genealogy of culturalpractice for Crystal River. Nevertheless, as we noted at the beginning of this chapter, the historicalreconstruction we offer here should be taken as a series of hypotheses for future research, ratherthan a definitive statement. In a brief, unpublished manuscript laying out his notions regarding thehistory of Crystal River, Bullen (n.d.) humbly concluded that “...it will require more archaeologicalwork to make a complete and authoritative interpretation.” We find Bullen’s caveat an equallyappropriate conclusion to this report summarizing our own work at the site.

75
REFERENCES CITED
Anderson, David G., and Robert C. Mainfort, Jr.2002 An Introduction to Woodland Archaeology in the Southeast. In The Woodland Southeast,
edited by D.G. Anderson and R.C. Mainfort, Jr., pp. 1-19. University of Alabama Press,Tuscaloosa.
Anderson, David G., Lisa D. O’Steen, and Kenneth E. Sassaman1996a Environmental and Chronological Concerns. In The Paleoindian and Early Archaic Southeast,
edited by D.G. Anderson and K.E. Sassaman, pp. 3-28. University of Alabama Press,Tuscaloosa.
1996b Models of Paleoindian and Early Archaic Settlement. In The Paleoindian and Early ArchaicSoutheast, edited by D.G. Anderson and K.E. Sassaman, pp. 29-57. University of AlabamaPress, Tuscaloosa.
Anderson, David G., and Glen T. Hanson1988 Early Archaic Settlement in the Southeastern United States: A Case Study from the Savannah
River Valley. American Antiquity 53:262-286.
Arnade, Charles W. 1996 Raids, Sieges, and International Wars. In The New History of Florida, edited by Michael
Gannon, pp. 100-116. University Press of Florida, Gainesville.
Barbour, George M.1964 Florida for Tourists, Invalids, and Settlers. Originally published 1882. Fascimile edition,
University of Florida Press, Gainesville.
Binford, Lewis R.1980 Willow Smoke and Dog's Trails: Hunter-Gatherer Settlement System and Archaeological Site
Formation. American Antiquity 45:4-20.
Boudreaux, Edmond A.2007 The Archaeology of Town Creek. University of Alabama Press, Tuscaloosa.
Brinton, Daniel G.1859 Notes on the Florida Peninsula: Its Literary History, Indian Tribes and Antiquities. Joseph Sabin,
Philadelphia.
Brose, David S.1979 An Interpretation of the Hopewellian Traits in Florida. In Hopewell Archaeology: The Chillicothe
Conference, edited by D.S. Brose and N. Greber, pp. 141-49. Kent State University Press,Kent, Ohio.
Brown, Canter, Jr. 1996 The Civil War, 1861-1865. In The New History of Florida, edited by Michael Gannon, pp. 231-
248. University Press of Florida, Gainesville.
Bullen, Ripley P.n.d. Suggestions for the Development of the Crystal River Site as an On-Location Exhibit Area.
Manuscript on file at the Florida Museum of Natural History, Gainesville.
1951 The Enigmatic Crystal River Site. American Antiquity 17:142-143.

76
1953 The Famous Crystal River Site. The Florida Anthropologist 6:9-37.
1960 The Famous Crystal River Site: Its Potentialities as a Florida State Park. Manuscript on fileat the Florida Museum of Natural History, Gainesville.
1965 Recent Additional Information. An addendum to a brochure from the Crystal River IndianMound Museum. Reproduced in Famous Florida Sites: Crystal River and Mount Royal, edited byJerald T. Milanich, pp. 225-226. University Press of Florida, Gainesville.
1966 Stelae at the Crystal River Site, Florida. American Antiquity 31(6):861-865.
1967 A Florida Folsom (?) Point from the Crystal River Mounds Museum. The FloridaAnthropologist 20:2.
1975 A Guide to the Identification of Florida Projectile Points. Kendall Books, Gainesville, Florida.
Cable, John S.1982 Organizational Variability in Piedmont Hunter-Gatherer Assemblages. In The Haw River
Sites: Archaeological Investigations at Two Stratified Sites in the North Carolina Piedmont, edited byS.R. Claggett and J.S. Cable, pp. 637-688. Commonwealth Associates, Report R-2386,Jackson, Michigan.
Caldwell, Joseph R.1958 Trend and Tradition in the Prehistory of the Eastern United States. American Anthropological
Association, Memoir 88.
Chapman, J.1975 The Icehouse Bottom Site, 40MR23. University of Tennessee Department of Anthropology
Report of Investigations No. 14, Knoxville.
1977 Archaic Period Research in the Lower Little Tennessee River Valley, 1975: Icehouse Bottom HarrisonBranch, Thirty Acre Island, Calloway Island. University of Tennessee Department ofAnthropology Report of Investigations No. 18.
Claflin, William H., Jr.1931 The Stalling's Island Mound, Columbia County, Georgia. Papers of the Peabody Museum of
American Archaeology and Ethnology, Vol. 19, No. 1. Harvard University, Cambridge,Massachusetts.
Clark, Anthony1990 Seeing Beneath the Soil: Prospecting Methods in Archaeology. Second edition. B. T. Batsford,
London.
Clausen, , C.J., A.D. Cohen, C. Emeliani, J.A. Holman, and J.J. Stipp1979 Little Salt Spring, Florida: A Unique Underwater Site. Science 203:609-614.
Clay, R. Berle2001 Complementary Geophysical Survey Techniques. Southeastern Archaeology 20:31-43.
Coe, Joffre L.1964 The Formative Cultures of the Carolina Piedmont. Transactions of the American Philosophical
Society 54(5).

77
Coker, William S., and Susan R. Parker1996 The Second Spanish Period in the Two Floridas. In The New History of Florida, edited by
Michael Gannon, pp. 150-166. University Press of Florida, Gainesville.
Conyers, Lawrence B.2004 Ground-Penetrating Radar for Archaeology. AltaMira, Walnut Creek.
2007 Ground-Penetrating Radar. In Remote Sensing in Archaeology: An Explicitly North AmericanPerspective, edited by Jay K. Johnson, pp. 131-160. University of Alabama Press, Tuscaloosa.
Cooke, Charles Wythe1945 Geology of Florida. Geological Bulletin No. 29, Florida Geological Survey, Tallahassee.
Cowan, C. W.1985 Understanding the Evolution of Plant Husbandry in Eastern North America: Lessons from
Botany, Ethnology, and Archaeology. In Prehistoric Food Production in North America, edited byR.I. Ford, pp 205-224. Anthropological Papers, University of Michigan, Museum ofAnthropology, Ann Arbor.
Dalan, Ranita A., John M. Musser, Jr., and Julie K. Stein1992 Geophysical Exploration of a Shell Midden. In Deciphering a Shell Midden Midden, edited by
Julie K. Stein, pp. 43-59. Academic Press, San Diego
Daniel, Randy1982 Test Excavations at the Deer Stand Site (8HI483A) in Hillsborough County, Florida. Interstate 75
Highway Phase II Archaeological Reports 2, Bureau of Historic State Properties, Tallahassee.
Daniel, I. Randolph, Jr., and Michael Wisenbaker1987 Harney Flats: A Florida Paleo-Indian Site. Baywood, Farmingdale, N.Y.
Dunbar, James S., and S. David Webb1996 Bone and Ivory Tools from Submerged Paleoindian Sites. In The Paleoindian and Early
Archaic Southeast, edited by D.G. Anderson and K.E. Sassaman, pp. 331-353. University ofAlabama Press, Tuscaloosa.
Dunn, Hampton1977 Back Home: A History of Citrus County, Florida. Citrus County Bicentennial Steering
Committee, Inverness, Florida.
Ellis, Gary D.1999 Crystal River State Archaeological Site, Seawall Restoration Project, Summary Report. Gulf
Archaeology Research Institute, Crystal River, Florida. Submitted to Crystal River PreserveState Park, Crystal River, Florida.
2004 Storm Damage Assessment on Mound G, Crystal River State Archaeological Park, Crystal River, Florida.Gulf Archaeological Research Institute, Crystal River, Florida. Submitted to Crystal RiverPreserve State Park, Crystal River, Florida.
Ellis, G.D., J. Dean, and R. Martin2003 Displaced Midden Recovery Project, Crystal River Mounds State Park. Gulf Archaeological Research
Institute, Crystal River, Florida. Submitted to Crystal River Preserve State Park, CrystalRiver, Florida.
78
Fabel, Robin F.A. 1996 British Rule in the Floridas. In The New History of Florida, edited by Michael Gannon, pp.
134-150. University Press of Florida, Gainesville.
Florida Department of Environmental Protection 2000 Crystal River State Archaeological Site: Unit Management Plan. Florida Department of
Environmental Protection, Division of Recreation and Parks, Tallahassee, Florida.
2003 Land Boundary and Information Service, General Land Office Records. http://data.labins.org/2003/SurveyData/LandRecords/GLO/search.cfm. AccessedJanuary, 2009.
Ford, James A.1966 Early Formative Cultures in Georgia and Florida. American Antiquity 31:781-799.
1969 A Comparison of Formative Cultures in the Americas. Smithsonian Contributions toAnthropology, Volume 11. Smithsonian Institution Press, Washington, D.C.
Gater, John, and Chris Gaffney2003 Revealing the Buried Past: Geophysics for Archaeologists. Tempus, Wiltshire.
Goggin, John M.1948 Some Pottery Types from Central Florida. Gainesville Anthropological Association Bulletin No. 1.
Greenman, E.F.1938 Hopewellian Traits in Florida. American Antiquity 3:327-332.
Gremillion, K.2002 The Development and Dispersal of Agricultural Systems in the Woodland Period Southeast.
In The Woodland Southeast, edited by D.G. Anderson and R.C. Mainfort, Jr., pp. 483-501.University of Alabama Press, Tuscaloosa.
2003 Eastern Woodlands Overview. In People and Plants in Eastern North America, edited by P.E.Minnis, pp. 17-49. Smithsonian Institution Press, Washington, D.C.
Griffin, James B., and Ripley P. Bullen1950 The Safety Harbor Site, Pinellas County, Florida. Florida Anthropological Society Publication No.
2., Gainesville.
Hally, David2008 King: The Social Archaeology of a Late Mississippian Town in Northwestern Georgia. University of
Alabama Press, Tuscaloosa.
Hann, John H. 1996 The Missions of Spanish Florida. In The New History of Florida, edited by Michael Gannon,
pp. 78-99. University Press of Florida, Gainesville.
Hardman, Clark, Jr.1971 The Primitive Solar Observatory at Crystal River and Its Implications. The Florida
Anthropologist 24:135-168.
Hudson, Charles1976 The Southeastern Indians. University of Tennessee Press, Knoxville.
1997 Knights of Spain, Warrior of the Sun. University of Georgia Press, Athens.

79
Hudson, C., M.T. Smith, D.J. Hally, R. Polhemus and C. DePratter1985 Coosa: A Chiefdom in the Sixteenth Century Southeastern United States. American Antiquity
50:723-737.
Hughes, D. Dalen.d. A Glimpse of Citrus County History. Citrus County Historical Society, Inverness, Florida.
Jefferies, Richard W.1976 The Tunacunnhee Site: Evidence of Hopewell Interaction in Northwest Georgia. Anthropological
Papers of the University of Georgia No. 1., Athens.
1994 The Swift Creek Site and Woodland Platform Mounds in the Southeastern United States. InOcmulgee Archaeology 1936-1986, edited by D.J. Hally, pp. 71-83. University of Georgia Press,Athens.
Johnson, Jay K. (editor) 2006 Remote Sensing in Archaeology: An Explicitly North American Perspective. University of Alabama
Press, Tuscaloosa.
Katzmarzyk, Cheryl1998 Evidence of Stress in a Precolumbian Population from Mound G at the Crystal River Site,
Florida. Unpublished Master’s thesis, Department of Anthropology, University of Florida,Gainesville.
Kellar, J.H., A.R. Kelly, and E.V. McMichael1962a Final Report on Archaelolgical Explorations at the Mandeville Site, 9 Cla 1. Laboratory of
Archaeology Report No. 8, University of Georgia, Athens.
1962b The Mandeville Site in Southwest Georgia. American Antiquity 27(3):336-355.
Kendrick, Baynard, and Barry Walsh2007 A History of Florida Forests. University Press of Florida, Gainesville.
Kidder, Tristram R. 2002 Mapping Poverty Point. American Antiquity 67(1):89-101.
2004 Plazas as Architecture: An Example from the Raffman Site in Northeast Louisiana. AmericanAntiquity 69:513-532.
Knight, Vernon J., Jr.1990 Excavation of the Truncated Mound at the Walling Site: Middle Woodland Culture and Copena in the
Tennessee Valley. Report of Investigations 56. Division of Archaeology, Alabama StateMuseum of Natural History, University of Alabama, Tuscaloosa.
2001 Feasting and the Emergence of Platform Mound Ceremonialism in Eastern North America. In Feasts: Archaeological and Ethnographic Perspectives on Food, Politics, and Power, edited by MichaelDietler and Brian Hayden, pp. 311-333. Smithsonian Institution Press, Washington.
Knight, Vernon J., Jr., and Tim S. Mistovich1984 Walter F. George Lake: Archaeological Survey of Fee Owned Lands, Alabama and Georgia. Report of
Investigations 42, Office of Archaeological Research, the University of Alabama, Tuscaloosa.

80
Knight, Vernon James, Jr., and Frank T. Schnell2004 Silence Over Kolomoki: A Curious Episode in the History of Southeastern Archaeology.
Southeastern Archaeology 23(1):1-11.
Kvamme, Kenneth L.2003 Geophysical Surveys as Landscape Archaeology. American Antiquity 68(3):435-457.
Luer, George M., and Marion M. Almy1982 A Definition of the Manasota Culture. Florida Anthropologist 35:34-58.
McMichael, Edward V.1960 The Anatomy of a Tradition: A Study of Southeastern Stamped Pottery. Ph.D. dissertation,
Department of Anthropology, Indiana University, Bloomington. University Microfilms,Inc., Ann Arbor.
1964 Veracruz, the Crystal River Complex, and the Hopewellian Climax. In Hopewellian Studies,edited by Joseph R. Caldwell and Robert L. Hall, pp. 123-132. Illinois State MuseumScientific Papers, Volume 12, Springfield, Illinois.
Mahon, John K., and Brent R. Weisman 1996 Florida’s Seminole and Miccosukee Peoples. In The New History of Florida, edited by Michael
Gannon, pp. 183-206. University Press of Florida, Gainesville.
Milanich, Jerald T.1994 Archaeology of Precolumbian Florida. University Press of Florida, Gainesville.
1999 Introduction. In Famous Florida Sites: Crystal River and Mount Royal, edited by Jerald T.Milanich, pp. 1-28. University Press of Florida, Gainesville.
2007 Gordon R. Willey and the Archaeology of the Florida Gulf Coast. In Gordon R. Willey andAmerican Archaeology: Contemporary Perspectives, edited by Jeremy A. Sabloff and William L.Fash, pp. 15-25. University of Oklahoma Press, Norman.
Milanich, Jerald T., Ann S. Cordell, Vernon J. Knight, Jr., Timothy A. Kohler, and Brenda J. Sigler-Lavelle1997 Archaeology of Northern Florida, A.D. 200-900. Academic Press, New York. Originally
published 1984.
Mitchem, Jeffrey M.1989 Redefining Safety Harbor: Late Prehistoric/Protohistoric Archaeology in West Peninsular
Florida. Unpublished Ph.D. dissertation, Department of Anthropology, University ofFlorida, Gainesville.
Moore, Clarence Bloomfield1903 Certain Aboriginal Mounds of the Central Florida West-Coast. Journal of the Academy of
Natural Sciences of Philadelphia 12:361-438.
1907 Crystal River Revisited. Journal of the Academy of Natural Sciences of Philadelphia, Second Series13(3):406-25.
1918 The Northwestern Florida Coast Revisited. Journal of the Academy of Natural Sciences ofPhiladelphia, Second Series 16(4):514-81.

81
Mormino, Gary R.1996 World War II. In The New History of Florida, edited by Michael Gannon, pp. 323-343.
University Press of Florida, Gainesville.
National Oceanic and Atmospheric Administration, Earth System Research Laboratory 2009 Solar Position Calculator. Electronic document,
http://www.srrb.noaa.gov/highlights/sunrise/azel.html, accessed January 12, 2009.
National Oceanic and Space Administration Satellite Information Service2008 Historical Declination Calculator. Electronic document,
http://www.ngdc.noaa.gov/geomagmodels/USHistoric.jsp, accessed November 3, 2008.
Neill, Wilfred T., and James C. McKay1968 A Supposed “Florida Folsom” Point: A Refutation. The Florida Anthropologist 21(4):122-124.
Pauketat, Timothy R.2001a A New Tradition in Archaeology. In The Archaeology of Traditions: Agency and History Before and
After Columbus, edited by T.R. Pauketat, pp. 1-16. University Press of Florida, Gainesville.
2001b Practice and History in Archaeology: An Emerging Paradigm. Anthropological Theory 1(1):73-98.
2004 The Economy of the Moment: Cultural Practices and Mississippian Chiefdoms. InArchaeological Perspectives on Political Economies, edited by Gary M. Feinman and Linda M.Nicholas, pp. 25-39. University of Utah Press, Salt Lake City.
Phillips, Phillip, James A. Ford, and James B. Griffin1951 Archaeological Survey in the Lower Mississippi Alluvial Valley, 1940-1947. Papers of the Peabody
Museum of American Archaeology and Ethnology, Harvard University, Volume 25,Cambridge, Massachusetts.
Pliny, P.E., C.T. Grantham, J.N. Schuster, D.L. Stankey1988 Soil Survey of Citrus County, Florida. USDA Soil Conservation Service, Washington, D.C.
Pluckhahn, Thomas J.1996 Joseph Caldwell’s Summerour Mound and Late Woodland Platform Mounds in the
Southeastern United States. Southeastern Archaeology 15(2):191-210.
2003 Kolomoki: Settlement, Ceremony, and Status in the Deep South, A.D. 350 to 750. University ofAlabama Press, Tuscaloosa.
Reimer, P. J., Baillie, M. G. L., Bard, E., Bayliss, A., Beck, J. W., Bertrand, C. J. H., Blackwell, P. G.,Buck, C. E., Burr, G. S., Cutler, K. B., Damon, P. E., Edwards, R. L., Fairbanks, R. G., Friedrich,M., Guilderson, T. P., Hogg, A. G., Hughen, K. A., Kromer, B., McCormac, F. G., Manning, S. W.,Ramsey, C. B., Reimer, R. W., Remmele, S., Southon, J. R., Stuiver, M., Talamo, S., Taylor, F. W.,van der Plicht, J., and Weyhenmeyer, C. E.2004 IntCal04 Terrestrial radiocarbon age calibration, 26 - 0 ka BP. Radiocarbon 46:1029-1058.
Rogers, William W. 1996 The Great Depression. In The New History of Florida, edited by Michael Gannon, pp. 304-
322. University Press of Florida, Gainesville.

82
Ruhl, Donna1981 An Investigation into the Relationships Between Midwestern Hopewell and Southeastern
Prehistory. Unpublished M.A. thesis, Department of Anthropology, Florida AtlanticUniversity, Boca Raton.
Russo, Michael1991 Archaic Sedentism on the Florida Coast: A Case Study from Horr’s Island. Unpublished Ph.D.
dissertation, Department of Anthropology, the University of Florida, Gainesville.
Sassaman, Kenneth E.1993 Early Pottery in the Southeast: Tradition and Innovation in Cooking Technology. University of
Alabama Press, Tuscaloosa.
Scarry, C. Margaret2003 Patterns of Wild Plant Utilization in the Prehistoric Eastern Woodlands. In People and Plants
in Eastern North America, edited by P.E. Minnis, pp. 50-104. Smithsonian Institution Press,Washington, D.C.
Schafer, Daniel L. 1996 U.S. Territory and State. In The New History of Florida, edited by Michael Gannon, pp. 207-
230. University Press of Florida, Gainesville.
Sears, William H.1956 Excavations at Kolomoki: Final Report. University of Georgia Press, Athens.
1982 Fort Center: An Archaeological Site in the Lake Okeechobee Basin. University Presses of Florida.Seeman, Mark F.1979 The Hopewell Interaction Sphere: The Evidence for Inter-Regional Trade and Structural Complexity.
Ph.D. dissertation, Department of Anthropology, University of Indiana, Bloomington. University Micro films, Ann Arbor.
Shofner, Jerrell H.1996 Reconstruction and Renewal, 1865-1877. In The New History of Florida, edited by Michael
Gannon, pp. 249-265. University Press of Florida, Gainesville.
Small, John K.1924 The Land Where Spring Meets Autumn. Journal of New York Botanical Garden 25:62.
Smith, Betty A.1979 The Hopewell Connection in Southwest Georgia. In Hopewell Archaeology: The Chillicothe
Conference, edited by D.S. Brose and N. Greber, pp. 181-87. Kent State University Press,Kent, Ohio.
Smith, Hale G.1951 Crystal River Revisited, Revisited, Revisited. American Antiquity 17:143-144.
Smith, Marvin T.1987 Archaeology of Aboriginal Culture Change in the Interior Southeast: Depopulation During the Early
Historic Period. University of Florida Presses, Gainesville.
Somers, Lewis2006 Resistivity Survey. In Remote Sensing in Archaeology: An Explicitly North American Perspective,
edited by Jay K. Johnson, pp. 109-130. University of Alabama Press, Tuscaloosa.

83
Stuiver, M., and Reimer, P. J.1993 Extended 14C Database and Revised CALIB Radiocarbon Calibration Program. Radiocarbon
35:215-230.
Tebeau, Charlton W.1971 A History of Florida. University of Miami Press, Coral Gables.
Thompson, Victor D.2007 Articulating Activity Areas and Formation Processes at the Sapelo Island Shell Ring
Complex. Southeastern Archaeology 26(1):91-107.
Thompson, Victor D., Matthew D. Reynolds, Bryan Haley, Richard Jefferies, Jay K. Johnson andLaura Humphries2004 The Sapelo Shell Rings: Shallow Geophysics on a Georgia Sea Island Island. Southeastern
Archaeology 23:192-201.
Vernon, Robert O.1951 Geology of Citrus and Levy County Florida. Geological Bulletin No. 33, Florida Geological
Survey, Tallahassee.
Vogel, Gregory2006 Historical Metrology and a Reconsideration of the Toltec Module. Southeastern Archaeology
25:6-19.
Walker, Karen J., Frank W. Stapor Jr., and William H. Marquardt1994 Episodic Sea Levels and Human Occupation at Southwest Florida's Wightman Site. The
Florida Anthropologist 47:161-179.Weisman, Brent R.1985 WRAC at Crystal River Archaeological Site. Withlacoochee River Archaeology Council News 2(3)
(March/April):9-10.
1987 A Cultural Resource Inventory of the Crystal River Archaeological Site (8Ci-1), Citrus County, Florida. Report submitted to the Florida Division of Natural Resources, Bureau of Land and AquaticResources Management, Tallahassee, Florida.
1995 Crystal River: A Ceremonial Mound Center on the Florida Gulf Coast. Florida Archaeology SeriesNo 8, Division of Historical Resources, Florida Department of State, Tallahassee.
Weisman, Brent R., Lori Collins, and Travis Doering2007 Mapping the Moundbuilders: Revisiting the National Landmark Site of Crystal River (8CI1), Florida,
Using Integrated Spatial Technologies. University of South Florida, Tampa. Submitted toDivision of Historic Resources Grants in Aid, Survey and Planning Program, Tallahassee.
Willey, Gordon R.1948a The Cultural Context of the Crystal River Negative-Painted Style. American Antiquity 13:325-
328.
1948b Cultural Sequence in the Manatee Region of West Florida. American Antiquity 13:209-218. 1948c A Prototype for the Southern Cult. American Antiquity 13:328-330.
1949a Archeology of the Florida Gulf Coast. Smithsonian Miscellaneous Collections 113, Washington,D.C.
1949b Crystal River, Florida: A 1949 Visit. The Florida Anthropologist 2:41-46.
84
1966 An Introduction to American Archaeology, Volume One: North and Middle America. Prentice-Hall,Inc., Englewood Cliffs, New Jersey.
Willey, Gordon R., and Philip Phillips1944 Negative Painted Pottery from Crystal River, Florida. American Antiquity 10:173-185.
1958 Method and Theory in American Archaeology. University of Chicago Press, Chicago.
Williamson, Ray A.1984 Living the Sky. Houghton Mifflin Co., Boston.
Wynne, Nick1999 Tin Can Tourists in Florida, 1900-1970. Arcadia Publishing Co., Charleston.