plotqa: reasoning over scientific plots
TRANSCRIPT

PlotQA: Reasoning over Scientific Plots
Nitesh Methani ∗ Pritha Ganguly* Mitesh M. Khapra Pratyush Kumar
Department of Computer Science and EngineeringRobert Bosch Centre for Data Science and AI (RBC-DSAI)
Indian Institute of Technology Madras, Chennai, India{nmethani, prithag, miteshk, pratyush}@cse.iitm.ac.in
Abstract
Existing synthetic datasets (FigureQA, DVQA) for rea-soning over plots do not contain variability in data labels,real-valued data, or complex reasoning questions. Con-sequently, proposed models for these datasets do not fullyaddress the challenge of reasoning over plots. In particu-lar, they assume that the answer comes either from a smallfixed size vocabulary or from a bounding box within the im-age. However, in practice, this is an unrealistic assumptionbecause many questions require reasoning and thus havereal-valued answers which appear neither in a small fixedsize vocabulary nor in the image. In this work, we aim tobridge this gap between existing datasets and real-worldplots. Specifically, we propose PlotQA with 28.9 millionquestion-answer pairs over 224,377 plots on data from real-world sources and questions based on crowd-sourced ques-tion templates. Further, 80.76% of the out-of-vocabulary(OOV) questions in PlotQA have answers that are not in afixed vocabulary. Analysis of existing models on PlotQA re-veals that they cannot deal with OOV questions: their over-all accuracy on our dataset is in single digits. This is notsurprising given that these models were not designed forsuch questions. As a step towards a more holistic modelwhich can address fixed vocabulary as well as OOV ques-tions, we propose a hybrid approach: Specific questions areanswered by choosing the answer from a fixed vocabularyor by extracting it from a predicted bounding box in the plot,while other questions are answered with a table question-answering engine which is fed with a structured table gen-erated by detecting visual elements from the image. On theexisting DVQA dataset, our model has an accuracy of 58%,significantly improving on the highest reported accuracy of46%. On PlotQA, our model has an accuracy of 22.52%,which is significantly better than state of the art models.
∗The first two authors have contributed equally
1. IntroductionData plots such as bar charts, line graphs, scatter plots,
etc. provide an efficient way of summarizing numericalinformation. Recently, in [13, 12] two datasets contain-ing plots and deep neural models for question answeringover the generated plots have been proposed. In both thedatasets, the plots are synthetically generated with data val-ues and labels drawn from a custom set. In the FigureQAdataset [13], all questions are binary wherein answers are ei-ther Yes or No, (see Figure 1a for an example). The DVQAdataset [12], generalizes this to include questions which canbe answered either by (a) fixed vocabulary of 1000 words,or (b) extracting text (such as tick labels) from the plot. Anexample question could seek the numeric value representedby a bar of a specific label in a bar plot (see Figure 1b).Given that all data values in the DVQA dataset are chosento be integers and from a fixed range, the answer to thisquestion can be extracted from the appropriate tick label.
While these datasets have initiated the research questionson plot reasoning, realistic questions over plots are muchmore complex. For instance, consider the question in Fig-ure 1c, where we are to compute the average of floatingpoint numbers represented by three bars of a color speci-fied by the label. The answer to this question is neither in afixed vocabulary nor can it be extracted from the plot itself.Answering such questions requires a combination of per-ception, language understanding, and reasoning, and thusposes a significant challenge to existing systems. Further-more, this task is harder if the training set is not synthetic,but instead is sourced from real-world data with large vari-ability in floating-point values, large diversity in axis andtick labels, and natural complexity in question templates.
To address this gap between existing datasets and real-world plots, we introduce the PlotQA1 dataset with 28.9million question-answer pairs grounded over 224,377 plots.PlotQA improves on existing datasets on three fronts. First,
1Dataset can be downloaded from bit.ly/PlotQA
arX
iv:1
909.
0099
7v3
[cs
.CV
] 1
Feb
202
0

Q: Is Light Green the minimum?A: 1
(a) FigureQA
Q: What is the value of mad in drop?A: 7
(b) DVQA
Q: What is the average number of Hispanic stu-dents in schools? A: 51.67
(c) PlotQA
Figure 1: A sample {plot, question, answer} triplet from FigureQA, DVQA, and PlotQA (our) datasets.
Question TypeAnswer Type Structure Data Retrieval Reasoning
Yes/NoDoes the graphcontain grids?
Does the price of diesel inBarbados monotonicallyincrease over the years?
Is the difference between the price of diesel in Angola in 2002 and 2004greater than the difference between the price of dieselin Lebanon in 2002 and 2004?
Fixed vocabularyHow are the legendlabels stacked?
What is the label or title ofthe X-axis ? In how many years, is the price of diesel greater than 0.6 units?
Open vocabulary -What is the price of diesel inLebanon in the year 2008? What is the ratio of the price of diesel in Lebanon in 2010 to that in 2014?
Table 1: Sample questions for 9 different question-answer types in PlotQA. The example questions are with respect to theplot in Figure 2b. Note that there are no open vocabulary answers for Structural Understanding questions.
roughly 80.76% of the questions have answers which arenot present in the plot or in a fixed vocabulary. Second, theplots are generated from data sourced from World Bank,government sites, etc., thereby having a large vocabulary ofaxis and tick labels, and a wide range in data values. Third,the questions are complex as they are generated based on74 templates extracted from 7,000 crowd-sourced questionsasked by workers on a sampled set of 1,400 plots. Questionsare categorized into 9 (=3x3) cells based on the questiontype: ‘Structural Understanding’, ‘Data Retrieval’, or ‘Rea-soning’ and and the answer type: ‘Yes/No’, ‘From FixedVocabulary’, or ‘Out Of Vocabulary (OOV)’ (see Table 1).
We first evaluate three state of the art models on PlotQA,viz., SAN-VQA[36], Bilinear attention network (BAN) [16]and LoRRA [33]. Note that, by design none of these mod-els are capable of answering OOV questions. In particular,SAN-VQA and BAN treat plot reasoning as a classifica-tion task and expect the answer to lie in a small vocabu-lary whereas in our dataset the answer vocabulary is pro-hibitively large (∼5M words). Similarly, LoRRA assumesthat the answer is present in the image itself as a text andthe task is to just extract this region containing the text fol-lowed by OCR (optical character recognition). Again, such
a model will be unable to answer questions such as the oneshown in Figure 1c, which form a significant segment ofreal-world use-cases and our dataset. As a result, these thesemodels give an accuracy of less than 8% on our dataset. Onthe other hand, existing models (in particular, SAN) per-form well on questions with answers from a fixed vocabu-lary, which was the intended purpose of these models.
Based on the above observations, we propose a hybridmodel with a binary classifier which given a question de-cides if the answer would lie in a small top-k vocabulary orif the answer is OOV. For the former, the question is passedthrough a classification pipeline which predicts a distribu-tion over the top-k vocabulary and selects the most proba-ble answer. For the latter (arguably harder questions), wepass the question through a pipeline of four modules: Vi-sual element detection, Optical character recognition, Ex-traction into a structured table, and Structured table ques-tion answering. This proposed hybrid model significantlyoutperforms the existing models and has an aggregate accu-racy of 22.52% on the PlotQA dataset. We also evaluate ourmodel on the DVQA dataset where it gives an accuracy of58%, improving on the best-reported result of SANDY [12]of 46%. In summary, we make two major contributions:

Datasets #Plottypes
#Plotimages
#QApairs Vocabulary Avg. question
length #Templates #Uniqueanswers
Openvocab.
FigureQA 4 180,000 2,388,698100 colours from
X11 colour set 7.515
(no variations) 2 Not present
DVQA 1 300,000 3,487,1941K nouns fromBrown corpus 12.30
26(without paraphrasing) 1576 Not present
PlotQA 3 224,377 28,952,641Real-world axes variablesand floating point numbers 43.54
74(with paraphrasing) 5,701,618 Present
Table 2: Comparison between the existing datasets (FigureQA and DVQA) and our proposed dataset (PlotQA).
(1) We propose PlotQA dataset with plots on data sourcedfrom the real-world and questions based on templatessourced from manually curated questions. The dataset ex-poses the need to train models for questions that have an-swers from an Open Vocabulary.(2) We propose a hybrid model with perception and QAmodules for questions that have answers from an Open Vo-cabulary. This model gives the best performance not onlyon our dataset but also on the existing DVQA dataset.
2. Related WorkDatasets: Over the past few years several large scaledatasets for Visual Question Answering have been released.These include datasets such as COCO-QA [28], DAQUAR[23], VQA [1, 7] which contain questions asked over natu-ral images. On the other hand, datasets such as CLEVR [11]and NVLR [35] contain complex reasoning based questionson synthetic images having 2D and 3D geometric objects.There are some datasets [14, 15] which contain questionsasked over diagrams found in text books but these datasetsare smaller and contain multiple-choice questions. Fig-ureSeer [31] is another dataset which contains images ex-tracted from research papers but this is also a relativelysmall (60,000 images) dataset. Further, FigureSeer focuseson answering questions based on line plots as opposed toother types of plots such as bar charts, scatter plots, etc. asseen in FigureQA [13] and DVQA [12]. There is also the re-cent TextVQA [33] dataset which contains questions whichrequire models to read the text present in natural images.This dataset does not contain questions requiring numericreasoning. Further, the answer is contained as a text in theimage itself. Thus, no existing dataset contains plot imageswith complex questions which require reasoning and haveanswers from an Open Vocabulary.Models: The availability of the above mentioned datasetshas facilitated the development of complex end-to-end neu-ral network based models ([36], [22], [37], [25], [30], [12],[33]). These end-to-end networks contain (a) encoders tocompute a representation for the image and the question,(b) attention mechanisms to focus on important parts of thequestion and image, (c) interaction components to capturethe interactions between the question and the image, (d)
OCR module to extract the image specific text and (e) aclassification layer for selecting the answer either from afixed vocabulary or from a OCR appended vocabulary.
3. The PlotQA datasetIn this section, we describe the PlotQA dataset and the
process to build it. Specifically, we discuss the four mainstages, viz., (i) curating data such as year-wise rainfallstatistics, country-wise mortality rates, etc., (ii) creating dif-ferent types of plots with a variation in the number of ele-ments, legend positions, fonts, etc., (iii) crowd-sourcing togenerate questions, and (iv) extracting templates from thecrowd-sourced questions and instantiating these templatesusing appropriate phrasing suggested by human annotators.
3.1. Data Collection and Curation
We considered online data sources such as World BankOpen Data, Open Government Data, Global TerrorismDatabase, etc. which contain statistics about various indica-tor variables such as fertility rate, rainfall, coal production,etc. across years, countries, districts, etc. We crawled datafrom these sources to extract different variables whose rela-tions could then be plotted (for example, rainfall v/s yearsacross countries, or movie v/s budget, or carbohydrates v/sfood item). There are a total of 841 unique indicator vari-ables (CO2 emission, Air Quality Index, Fertility Rate, Rev-enue generated, etc.) with 160 unique entities (cities, states,districts, countries, movies, food, etc.). The data rangesfrom 1960 to 2016, though not all indicator variables havedata items for all years. The data contains positive integers,floating point values, percentages, and values on a linearscale. These values range from 0 to 3.50e+15.
3.2. Plot Generation
We included 3 different types of plots in this dataset,viz., bar plots, line plots, and scatter plots. Within barplots, we have grouped them by orientation as either hor-izontal or vertical. Figure 2 shows one sample of eachplot type. Each of these plot types can compactly repre-sent 3-dimensional data. For instance, in Figure 2b, the plotcompares the diesel prices across years for differ-ent countries. To enable the development of supervised

(a) Horizontal bar graph (b) Line plot (c) Dot-Line graph
Figure 2: Sample plots of different types in the PlotQA dataset.
modules for various sub-tasks, we provide bounding boxannotations for legend boxes, legend names, legend mark-ers, axes titles, axes ticks, bars, lines, and title. By usingdifferent combinations of indicator variables and entities(years, countries, etc.) we created a total of 224, 377 plots.
To ensure variety in the plots, we randomly chose thefollowing parameters: grid lines (present/absent), font size,notation used for tick labels (scientific-E notation or stan-dard notation), line style (solid, dashed, dotted, dash-dot),marker styles for marking data points (asterisk, circle,diamond, square, triangle, inverted triangle), position oflegends (bottom-left, bottom-centre, bottom-right, center-right, top-right), and colors for the lines and bars from a setof 73 colors. The number of discrete elements on the x-axisvaries from 2 to 12 and the number of entries in the legendbox varies from 1 to 4.
3.3. Sample Question Collection by Crowd-sourcing
As the source data of PlotQA dataset is significantlyricher in comparison to FigureQA and DVQA, we foundit necessary to ask a larger set of annotators to create ques-tions over these plots. However, creating questions for allthe plots in our dataset would have been prohibitively ex-pensive. We sampled 1, 400 plots across different types andasked workers on Amazon Mechanical Turk to create ques-tions for these plots. We showed each plot to 5 differentworkers resulting in a total of 7, 000 questions. We specifi-cally instructed the workers to ask complex reasoning ques-tions which involved reference to multiple plot elements inthe plots. We paid the workers USD 0.1 for each question.
3.4. Question Template Extraction & Instantiation
We manually analyzed the questions collected by crowd-sourcing and divided them into a total of 74 templates.These templates were divided into 3 question categories.These question categories along with a few sample tem-plates are shown below. See Table 4 for statistics of dif-
ferent question and answer types in our dataset (please referto the Supplementary material for further details).Structural Understanding: These are questions about theoverall structure of the plot and do not require any quanti-tative reasoning. Examples: “How many different colouredbars are there?”, “How are the legend labels stacked?”.Data Retrieval: These questions seek data item for a singleelement in the plot. Examples: “What is the number of taxpayers in Myanmar in 2015?”.Reasoning: These questions either require numeric reason-ing over multiple plot elements or a comparative analysisof different elements of the plot, or a combination of bothto answer the question. Examples: “In which country is thenumber of threatened bird species minimum?”, “What is themedian banana production?”,
We abstracted the questions into templates such as “Inhow many <plural form of X label>, is the <Y label>of/in <legend label> greater than the average <Y label>of/in <legend label> taken over all <plural form ofX label>?”. We could then generate multiple questions foreach template by replacing X label, Y label, legend label,etc. by indicator variables, years, cities etc. from our cu-rated data. However, this was a tedious task requiring a lotof manual intervention. For example, consider the indica-tor variable “Race of students” in Figure 1c. If we substitutethis indicator variable as it is in the above template, it wouldresult in a question, “In how many cities, is the race of thestudents(%) of Asian greater than the average race of thestudents (%) of Asian taken over all cities?”, which soundsunnatural. To avoid this, we asked in-house annotators tocarefully paraphrase these indicator variables and questiontemplates. The paraphrased version of the above examplewas “In how many cities, is the percentage of Asian stu-dents greater than the average percentage of Asian studentstaken over all cities?”. Such paraphrasing for every questiontemplate and indicator variable required significant manualeffort. Using this semi-automated process we generated

DatasetSplit
Plot Types Question Types Answer Typesvbar hbar line dot-line Structural Data-Retrieval Reasoning Yes/No Fixed vocab. Open vocab.
Train 52,463 52,700 25,897 26,010 871,782 2,784,041 16,593,656 784,115 3,095,774 16,369,590Validation 11,249 11,292 5,547 5,571 186,994 599,573 3,574,081 167,871 600,424 3,592,353Test 11,242 11,292 5,549 5,574 186,763 596,359 3,559,392 167,727 667,742 3,507,045
Table 3: Detailed Statistics for different splits of the PlotQA dataset.
Question (Q) TypeAnswer (A) Type Structure Data Retrieval ReasoningYes/No 36.99% 5.19% 2.05%Fixed vocabulary 63.01% 18.52% 15.92%Open vocabulary 0.00% 76.29% 82.03%
Table 4: Overall distribution of Q and A types in PlotQA.
a total of 28, 952, 641 questions. This approach of creat-ing questions on real-world plot data with carefully curatedquestion templates followed by manual paraphrasing is akey contribution of our work. The resultant PlotQA datasetis much closer to the real-world challenge of reasoning overplots, significantly improving on existing datasets. Table 2summarizes the differences between PlotQA and these ex-isting datasets such as FigureQA and DVQA. Note that (a)the number of unique answers in PlotQA is very large, (b)the questions in PlotQA are much longer, and (c) the vocab-ulary of PlotQA is more realistic than FigureQA or DVQA.
4. Proposed ModelExisting models for VQA are of two types: (i) read the
answer from the image (as in LoRRA) or (ii) pick the an-swer from a fixed vocabulary (as in SAN and BAN). Suchmodels work well for datasets such as DVQA where indeedall answers come from a fixed vocabulary (global or plotspecific) but are not suited for PlotQA with a large num-ber of OOV questions. Answering such questions involvesvarious sub-tasks: (i) detect all the elements in the plot(bars, legend names, tick labels, etc), (ii) read the values ofthese elements, (iii) establish relations between the plot el-ements, e.g., creating tuples of the form {country=Angola,year=2006, price of diesel = 0.4 }, and (iv) reason over thisstructured data. Expecting a single end-to-end model to beable to do all of this is unreasonable. Hence, we propose amulti-staged pipeline to address each of the sub-tasks.
We further note that for simpler questions which do notrequire reasoning and can be answered from a small fixedsize vocabulary, such an elaborate pipeline is an overkill.As an illustration consider the question “How many bars arethere in the image?”. This does not require reasoning andcan be answered based on visual properties of the image.For such questions, we have a simpler QA-as-classificationpipeline. As shown in Figure 3, our overall model is thus
Dataset Split #Images #QA pairsTrain 157,070 20,249,479Validation 33,650 4,360,648Test 33,657 4,342,514Total 224,377 28,952,641
Table 5: PlotQA Dataset Statistics
a hybrid model containing the following elements: (i) a bi-nary classifier for deciding whether the given question canbe answered from a small fixed vocabulary or needs morecomplex reasoning, and (ii) a simpler QA-as-classificationmodel to answer questions of the former type, and (iii)a multi-staged model containing four components as de-scribed below to deal with complex reasoning questions.
4.1. Visual Elements Detection (VED)
The data bearing elements of a plot are of 10 distinctclasses: the title, the labels of the x and y axes, the ticklabels or categories (e.g., countries) on the x and y axis,the data markers in the legend box, the legend names, andfinally the bars and lines in the graph. Following existingliterature ([4], [12]), we refer to these elements as the visualelements of the graph. The first task is to extract all thesevisual elements by drawing bounding boxes around themand classifying them into the appropriate class. To this end,we can either apply object detection models such as RCNN,Fast-RCNN [6], YOLO [27], SSD [21], etc. or instance seg-mentation models such as Mask-RCNN [9]. Upon compar-ing all methods, we found that Faster R-CNN [29] modelalong with Feature Pyramid Network(FPN) [20] performedthe best and hence we used it as our VED module.
4.2. Object Character Recognition (OCR)
Some of the visual elements such as title, legends, ticklabels, etc. contain numeric and textual data. For extractingthis data from within these bounding boxes, we use a state-of-the-art OCR model [34]. We crop the detected visualelement to its bounding box, convert the cropped textualimage into gray-scale, resize and deskew it, and then passit to an OCR module. Existing OCR modules perform wellfor machine-written English text, and indeed we found thata pre-trained OCR module2 works well on our dataset.
2https://github.com/tesseract-ocr/tesseract

Visual Elements Detection (VED)
Optical Character Recognition (OCR)
Semi-structured information
extraction (SIE)
Table Question Answering (QA)
Q: What is the average percentage of imports from different countries
in Thailand per year?
A: 9.008
Figure 3: Our proposed multi-staged modular pipeline for QA on scientific plots.
4.3. Semi-Structured Information Extraction (SIE)
The next stage of extracting the data into a semi-structured table is best explained with an example shownin Figure 3. The desired output of SIE is shown in the tablewhere the rows correspond to the ticks on the x-axis (1996,1997, 1998, 1999), the columns correspond to the differentelements listed in the legend (Brazil, Iceland, Kazakhstan,Thailand) and the i,j-th cell contains the value correspond-ing to the x-th tick and the y-th legend. The values of the x-tick labels and the legend names are available from the OCRmodule. The mapping of legend name to legend marker orcolor is done by associating a legend name to the marker orcolor whose bounding box is closest to the bounding boxof the legend name. Similarly, we associate each tick la-bel to the tick marker whose bounding box is closest to thebounding box of the tick label. For example, we associatethe legend name Brazil to the color “Dark Cyan” and thetick label 1996 to the corresponding tick mark on the x-axis. With this we have the 4 row headers and 4 columnheaders, respectively. To fill in the 16 values in the table,there are again two smaller steps. First we associate each ofthe 16 bounding boxes of the 16 bars to their correspondingx-ticks and legend names. A bar is associated with an x-ticklabel whose bounding box is closest to the bounding box ofthe bar. To associate a bar to a legend name, we find thedominant color in the bounding box of the bar and match itwith a legend name corresponding to that color. Second, weneed to find the value represented by each bar. We extractthe height of the bar using bounding box information fromthe VED module and then search for the y-tick labels im-mediately above and below that height. We then interpolatethe value of the bar based on the values of these boundingticks. With this we have the 16 values in the cells and thushave extracted all the information from the plot into a semi-
structured table. The output of each stage is discussed in thesupplementary material.
4.4. Table Question Answering (QA)
The final stage of the pipeline is to answer questionson the semi-structured table. As this is similar to answer-ing questions from the WikiTableQuestions dataset [26],we adopt the same methodology as proposed in [26]. Inthis method, the table is converted to a knowledge graphand the question is converted to a set of candidate logicalforms by applying compositional semantic parsing. Theselogical forms are then ranked using a log-linear model andthe highest ranking logical form is applied to the knowl-edge graph to get the answer. Note that with this approachthe output is computed by a logical form that operates onthe numerical data. This supports complex reasoning ques-tions and also avoids the limitation of using a small answervocabulary for multi-class classification as is done in ex-isting work on VQA. There are recent neural approachesfor answering questions over semi-structured tables such as[24, 8]. Individually these models do not outperform therelatively simpler model of [26], but as an ensemble theyshow a small improvement of only (1-2%). To the best ofour knowledge, there is only one neural method [19] whichoutperforms [26], but the code for this model is not avail-able which makes it hard to reproduce the results.
5. Experiments
5.1. Train-Valid-Test Splits
By using different combinations of 841 indicator vari-ables and 160 entities (years, countries, etc), we created atotal of 224, 377 plots. Depending on the context and typeof the plot, we instantiated the 74 templates to create mean-

Q:Howmanybarsarethereintheimage?
Q:WhatistheaveragenumberofneonataldeathsinCubaperyear?
QuestionEmbeddings
A:8
VisualElementsDetection(VED)
OpticalCharacterRecognition(OCR)
Semi-structuredinformationextraction
(SIE)
TableQuestionAnswering
(QA)
A:514.95
ATTN
SOFTMAX
LSTM
Questionclassifier
CNN
ImageFeatureVectorsQAasclassification
Multi-stagedmodel
Figure 4: Our proposed model containing (i) a question classifier for deciding whether the question can be answered from afixed vocabulary (orange) or needs more complex reasoning (green), (ii) QA-as-classification model to answer questions ofthe former type, and (iii) multi-staged model as a pipeline of perception and QA modules for answering complex questions.
ingful {question, answer} pairs for each of the plots. Wecreated train (70%), valid (15%) and test (15%) splits (Ta-ble 5). The dataset and the crowd-sourced questions can bedownloaded from the link: bit.ly/PlotQA
5.2. Models Compared
We compare the performance of the following models:- IMG-only: This is a simple baseline where we just passthe image through a VGG19 and use the embedding of theimage to predict the answer from a fixed vocabulary.- QUES-only: This is a simple baseline where we just passthe question through a LSTM and use the embedding of thequestion to predict the answer from a fixed vocabulary.- SAN [36]: This is an encoder-decoder model with a multi-layer stacked attention [2] mechanism. It obtains a repre-sentation for the image using a deep CNN and a representa-tion for the query using LSTM. It then uses the query rep-resentation to locate relevant regions in the image and usesthis to pick an answer from a fixed vocabulary.- SANDY [12]: This is the best performing model on theDVQA dataset and is a variant of SAN. Unfortunately, thecode for this model is not available and the description inthe paper was not detailed enough for us to reimplementit.3 Hence, we report the numbers for this model only onDVQA (from the original paper).- LoRRA [33]: This is the recently proposed model on theTextVQA dataset. It concatenates the image features ex-tracted from pre-trained ResNet-152 [10] model with the re-
3We have contacted the authors and while they are helpful in sharingvarious details, they do not have access to the original code now.
gion based features extracted from Faster-RCNN [5] model.It then reads the text present in the image using a pre-trainedOCR module and incorporates an attention mechanism toreason about the image and the text. Finally, it does multi-class classification where the answer either comes from afixed vocabulary or is copied from the text in the image.- BAN [16]: This model exploits bilinear interactions be-tween two groups of input channels, i.e., between everyquestion word (GRU [3] features) and every image region(pre-trained Faster-RCNN [29] object features). It then useslow-rank bilinear pooling [17] to extract the joint distribu-tion for each pair of channels. BAN accumulates 8 suchbilinear attention maps which are then fed to a two-layerperceptron classifier to get the final joint distribution overanswers from a fixed vocabulary.- Our Model: This proposed model shown in Figure 4 withtwo model paths. The training data for the binary classi-fication is generated by comparing the performance of theindividual models: For a given question, the label is set to1 if the performance of QA-as-classification model is bet-ter than the multi-stage pipeline, and 0 otherwise. We usean LSTM to represent the input question and then performbinary classification on this representation.
5.3. Training Details
SAN: We used an existing implementation of SAN4 for theinitial baseline results. Image features are extracted fromthe last pooling layer of VGG19 network. Question fea-tures are the last hidden state of the LSTM. Both the LSTM
4https://github.com/TingAnChien/san-vqa-tensorflow
hidden state and 512-d image feature vector at each locationare transferred to a 1024-d vector by a fully connected layer,and added and passed through a non-linearity (tanh). Themodel was trained using Adam [18] with an initial learningrate of 0.0003 and a batch size of 128 for 25,000 iterations.Our model: The binary question classifier in the proposedmodel contains a 50-dimensional word embedding layerfollowed by an LSTM with 128 hidden units. The outputof the LSTM is projected to 256 dimensions and this is thenfed to the output layer. The model is trained for 10 epochsusing RMSProp with an initial learning rate of 0.001. Ac-curacy on the validation set is 87.3%. Of the 4 stages of themulti-stage pipeline, only two require training, viz., VisualElements Detection (VED) and Table Question Answering(QA). As mentioned earlier, for VED we train a variant ofFaster R-CNN [20] with FPN using the bounding box an-notations available in PlotQA. We trained the model with abatch size of 32 for 200, 000 steps. We used RMSProp withan initial learning rate of 0.004. For Table QA, we trainedthe model proposed in [26] using questions from our datasetand the corresponding ground truth tables.
5.4. Evaluation Metric
We used accuracy as the evaluation metric. Specifically,for textual answers (such as India, CO2, etc.) the model’soutput was considered to be correct only if the predictedanswer exactly matches the true answer. However, for nu-meric answers with floating point values, an exact match isa very strict metric We relax the measure to consider an an-swer to be correct as if it is within 5% of the correct answer.
5.5. Human Accuracy on PlotQA dataset
To assess the difficulty of the PlotQA dataset, we reporthuman accuracy on a small subset of the Test split of thedataset. With the help of in-house annotators, we were ableto evaluate 5, 860 questions grounded in 160 images. Hu-man accuracy on this subset is found to be 80.47%. We usedthe evaluation metric as defined in section 5.4. Most humanerrors were due to numerical precision as it is difficult tofind the exact value from the plot even with a 5% margin.
6. Observations and Results1. Evaluating models on PlotQA dataset (Table 7):The baselines IMG-only and QUES-only performed poorlywith an accuracy of 4.84% and 5.35% respectively. Exist-ing models (SAN, BAN, LoRRA) perform poorly on thisdataset. In particular, BAN and LoRRA have an abysmalaccuracy of less than 1%. This is not surprising giventhat both models are not designed to answer OOV ques-tions. Further, the original VQA tasks for which BAN wasproposed does not have any complex numerical reasoningquestions as found in PlotQA. Similarly, LoRRA was de-signed only for text based answers and not for questions
requiring numeric reasoning. Note that we have used theoriginal code [32] released by the authors of these models.Given the specific focus and limited capabilities of theseexisting models it may even seem unfair to evaluate thesemodels on our dataset but we still do so for the sake ofcompleteness and to highlight the need for better models.Lastly, our model gives the best performance of 22.52% onthe PlotQA dataset.Ablation Study of proposed method: Table 8 presents thedetails of the ablation study of the proposed method foreach question type (structural, data retrieval, reasoning) andeach answer type (binary, fixed vocabulary, OOV). QA-as-classification performs very well on Yes/No questions andmoderately well on Fixed vocab. questions with a goodbaseline aggregate accuracy of 7.76%. It performs poorlyon Open vocab. question, failing to answer almost all the3,507,045 questions in this category. On the other hand, theQA-as-multi-stage pipeline fails to answer correctly any ofthe Yes/No questions, performs moderately well on Fixedvocab. questions, and answers correctly some of the hardOpen vocab. questions. Our model combines the comple-mentary strengths of QA-as-classification and QA-as-multi-stage pipeline achieving the highest accuracy of 22.52%.In particular, the performance improves significantly for allFixed Vocab. questions, while retaining the high accuracyof QA-as-classification on Yes/No questions and QA-as-multi-stage pipeline’s performance on Open vocab. We ac-knowledge that the accuracy is significantly lower than hu-man performance. This establishes that the dataset is chal-lenging and raises open questions on models for visual rea-soning.
2. Analysis of the pipeline We analyze the performance ofVED, OCR and SIE modules in the pipeline.VED: Table 9 shows that the VED module performs reason-ably well at an Intersection Over Union (IOU) of 0.5. Forhigher IOUs of 0.75 and 0.9, the accuracy falls drastically.For instance, at IOU of 0.9, dotlines are detected with anaccuracy of under 20%. Clearly, such inaccuracies wouldlead to incorrect table generation and subsequent QA. Thisbrings out an interesting difference between this task andother instance segmentation tasks where the margin of er-ror is higher (where IOU of 0.5 is accepted). A small errorin visual element detection as indicated by mAP scores of75% is considered negligible for VQA tasks, however forPlotQA small errors can cause significantly misaligned ta-ble generation and subsequent QA. We illustrate this withan example given in Figure 5. The predicted red box hav-ing an IOU of 0.58 estimates the bar size as 760 as opposedto ground truth of 680, significantly impacting downstreamQA accuracy.OCR: We evaluate the OCR module in standalone/oraclemode and pipeline mode in Table 10. In the oracle mode,we feed ground truth boxes to the OCR model whereas in

Figure 5: Ground-truth (cyan) and predicted (red) boxes.
Model DVQA (TEST) DVQA (TEST-NOVEL)SAN 32.1% 30.98%SANDY-OCR 45.77% 45.81%Our Model 57.99% 59.54%
Table 6: Accuracy of different models on DVQA dataset.
Models IMG QUES BAN LoRRA SAN OurModel
Accuracy 4.84 5.35 0.01 0.02 7.76 22.52
Table 7: Accuracy (in %) of different models on PlotQA.
the pipeline model we perform OCR on the output of theVED module. We observe only a small drop in performancefrom 97.06% (oracle) to 93.10% (after VED), which indi-cates that the OCR module is robust to the reduction in VEDmodule’s accuracy at higher IOU as it does not depend onthe class label or the exact position of bounding boxes.SIE: We now evaluate the performance of the SIE module.We consider each cell in the table to be a tuple of the form{row header, column header, value } (e.g., {Poland, 1964,10000 tractors). We consider all the tuples extracted by theSIE module with the tuples present in the ground truth ta-ble to compute the F1-score. Even though Table 9 suggeststhat the VED model is very accurate with a [email protected] of96.43%, we observe that the F1-score for table extractionis only 0.68. This indicates that many values are not be-ing extracted accurately due to the kind of errors shown inFigure 5 where the bounding box has a high overlap withthe true box. We thus need better plot VED modules whichcan predict tighter bounding boxes (higher mAP at IOU of0.9) around the plot’s visual and textual elements. Inaccu-rate VED module leads to erroneous tables which furtheraffects the downstream QA accuracy.- In summary, a highly accurate VED for structured imagesis an open challenge to improve reasoning over plots.3. Evaluating new models on the existing DVQA dataset(Table 6): The proposed model performs better than the ex-isting models (SAN and SANDY-OCR) establishing a newSOTA result on DVQA. The higher performance of the pro-posed hybrid model in comparison to SAN (in contrast tothe PlotQA results) suggests that the extraction of the struc-tured table is more accurate on the DVQA dataset. This isbecause of the limited variability in the axis and tick labelsand shorter length (one word only) of labels.
Accuracy (in %)Model(Agg. acc.)
Q Type\A type Structural Data Retrieval Reasoning
HumanBaseline(80.47)
Yes/No 99.77 100 76.51Fixed vocab. 99.29 83.31 59.97Open vocab. NA 87.58 58.01
QA as clas-sification(7.76)
Yes/No 91.12 97.32 62.75Fixed vocab. 66.85 30.76 16.03Open vocab. NA 0.00 0.00
MultistagePipeline(18.46)
Yes/No 0.00 0.00 0.00Fixed vocab. 42.12 16.07 7.24Open vocab. NA 57.39 14.95
Our Model(22.52)
Yes/No 91.12 97.32 62.75Fixed vocab. 66.86 22.64 7.95Open vocab. NA 57.39 14.95
Table 8: Ablation study of proposed method on PlotQA.Note that there are no open vocab. answers for StructuralUnderstanding question templates (see Table 1).
Class [email protected] [email protected] [email protected] 100.00% 78.83% 0.22%Bar 95.84% 94.30% 85.54%Line 72.25% 62.04% 37.65%Dotline 96.30% 95.14% 18.07%X-axis Label 99.99% 99.99% 99.09%Y-axis Label 99.90% 99.90% 99.46%X-tick Label 99.92% 99.74% 96.04%Y-tick Label 99.99% 99.97% 96.80%Legend Label 99.99% 99.96% 93.68%Legend Preview 99.95% 99.94% 96.30%mAP 96.43% 92.98% 72.29%
Table 9: VED Module’s Accuracy on PlotQA dataset
Oracle After VEDTitle 99.31% 94.6%X-axis Label 99.94% 95.5%Y-axis Label 98.43% 97.07%X-tick Label 94.8% 91.38%Y-tick Label 93.38% 88.07%Legend Label 98.53% 91.99%Total 97.06% 93.10%
Table 10: OCR Module Accuracy on the PlotQA dataset.
7. Conclusion
We introduce the PlotQA dataset to reduce the gap be-tween existing synthetic plot datasets and real-world plotsand question templates. Analysis of existing VQA modelson PlotQA reveals that they perform poorly for Open Vo-cabulary questions. This is not surprising as these modelswere not designed to handle complex questions which re-quire numeric reasoning and OOV answers. We propose ahybrid model with separate pipelines for handling (i) sim-pler questions which can be answered from a fixed vocab-ulary and (ii) complex questions with OOV answers. For

OOV questions, we propose a pipelined approach that com-bines visual element detection and OCR with QA over ta-bles. The proposed model gives state-of-the-art results onboth the DVQA and PlotQA datasets. Further analysis ofour pipeline reveals the need for more accurate visual ele-ment detection to improve reasoning over plots.
References[1] S. Antol, A. Agrawal, J. Lu, M. Mitchell, D. Batra, C. L.
Zitnick, and D. Parikh. VQA: visual question answering. InICCV, 2015.
[2] D. Bahdanau, K. Cho, and Y. Bengio. Neural machinetranslation by jointly learning to align and translate. CoRR,abs/1409.0473, 2014.
[3] K. Cho, B. van Merrienboer, C. Gulcehre, D. Bahdanau,F. Bougares, H. Schwenk, and Y. Bengio. Learning phraserepresentations using RNN encoder-decoder for statisticalmachine translation. In Proceedings of the 2014 Confer-ence on Empirical Methods in Natural Language Processing,EMNLP 2014, October 25-29, 2014, Doha, Qatar, A meet-ing of SIGDAT, a Special Interest Group of the ACL, pages1724–1734, 2014.
[4] M. Cliche, D. S. Rosenberg, D. Madeka, and C. Yee. Scat-teract: Automated extraction of data from scatter plots. InECML PKDD, 2017.
[5] R. Girshick, I. Radosavovic, G. Gkioxari, P. Dollar,and K. He. Detectron. https://github.com/facebookresearch/detectron, 2018.
[6] R. B. Girshick. Fast R-CNN. CoRR, abs/1504.08083, 2015.[7] Y. Goyal, T. Khot, D. Summers-Stay, D. Batra, and
D. Parikh. Making the V in VQA matter: Elevating therole of image understanding in visual question answering.In CVPR, 2017.
[8] T. Haug, O. Ganea, and P. Grnarova. Neural multi-step rea-soning for question answering on semi-structured tables. InAdvances in Information Retrieval - 40th European Confer-ence on IR Research, ECIR 2018, Grenoble, France, March26-29, 2018, Proceedings, pages 611–617, 2018.
[9] K. He, G. Gkioxari, P. Dollar, and R. B. Girshick. MaskR-CNN. In IEEE International Conference on Computer Vi-sion, ICCV 2017, Venice, Italy, October 22-29, 2017, pages2980–2988, 2017.
[10] K. He, X. Zhang, S. Ren, and J. Sun. Deep residual learningfor image recognition. In 2016 IEEE Conference on Com-puter Vision and Pattern Recognition, CVPR 2016, Las Ve-gas, NV, USA, June 27-30, 2016, pages 770–778, 2016.
[11] J. Johnson, B. Hariharan, L. van der Maaten, L. Fei-Fei, C. L.Zitnick, and R. B. Girshick. CLEVR: A diagnostic datasetfor compositional language and elementary visual reasoning.In CVPR, 2017.
[12] K. Kafle, S. Cohen, B. L. Price, and C. Kanan. DVQA:understanding data visualizations via question answering.CoRR, abs/1801.08163, 2018.
[13] S. E. Kahou, A. Atkinson, V. Michalski, A. Kadar,A. Trischler, and Y. Bengio. Figureqa: An annotated figuredataset for visual reasoning. CoRR, abs/1710.07300, 2017.
[14] A. Kembhavi, M. Salvato, E. Kolve, M. J. Seo, H. Hajishirzi,and A. Farhadi. A diagram is worth a dozen images. InECCV, 2016.
[15] A. Kembhavi, M. J. Seo, D. Schwenk, J. Choi, A. Farhadi,and H. Hajishirzi. Are you smarter than a sixth grader? text-book question answering for multimodal machine compre-hension. In CVPR, 2017.
[16] J. Kim, J. Jun, and B. Zhang. Bilinear attention networks.In Advances in Neural Information Processing Systems 31:Annual Conference on Neural Information Processing Sys-tems 2018, NeurIPS 2018, 3-8 December 2018, Montreal,Canada, pages 1571–1581, 2018.
[17] J. Kim, K. W. On, W. Lim, J. Kim, J. Ha, and B. Zhang.Hadamard product for low-rank bilinear pooling. In 5th In-ternational Conference on Learning Representations, ICLR2017, Toulon, France, April 24-26, 2017, Conference TrackProceedings, 2017.
[18] D. P. Kingma and J. Ba. Adam: A method for stochasticoptimization. CoRR, abs/1412.6980, 2014.
[19] J. Krishnamurthy, P. Dasigi, and M. Gardner. Neural se-mantic parsing with type constraints for semi-structured ta-bles. In Proceedings of the 2017 Conference on EmpiricalMethods in Natural Language Processing, pages 1516–1526,Copenhagen, Denmark, Sept. 2017. Association for Compu-tational Linguistics.
[20] T. Lin, P. Dollar, R. B. Girshick, K. He, B. Hariharan, andS. J. Belongie. Feature pyramid networks for object detec-tion. In 2017 IEEE Conference on Computer Vision andPattern Recognition, CVPR 2017, Honolulu, HI, USA, July21-26, 2017, pages 936–944, 2017.
[21] W. Liu, D. Anguelov, D. Erhan, C. Szegedy, S. E. Reed,C. Fu, and A. C. Berg. SSD: single shot multibox detector.In ECCV, 2016.
[22] J. Lu, J. Yang, D. Batra, and D. Parikh. Hierarchicalquestion-image co-attention for visual question answering.In NIPS, 2016.
[23] M. Malinowski and M. Fritz. A multi-world approach toquestion answering about real-world scenes based on uncer-tain input. In NIPS, 2014.
[24] A. Neelakantan, Q. V. Le, M. Abadi, A. McCallum, andD. Amodei. Learning a natural language interface with neu-ral programmer. CoRR, abs/1611.08945, 2016.
[25] H. Noh and B. Han. Training recurrent answering units withjoint loss minimization for VQA. CoRR, abs/1606.03647,2016.
[26] P. Pasupat and P. Liang. Compositional semantic parsing onsemi-structured tables. In ACL, 2015.
[27] J. Redmon and A. Farhadi. YOLO9000: better, faster,stronger. In 2017 IEEE Conference on Computer Vision andPattern Recognition, CVPR 2017, Honolulu, HI, USA, July21-26, 2017, pages 6517–6525, 2017.
[28] M. Ren, R. Kiros, and R. S. Zemel. Image question answer-ing: A visual semantic embedding model and a new dataset.CoRR, abs/1505.02074, 2015.
[29] S. Ren, K. He, R. B. Girshick, and J. Sun. Faster R-CNN:towards real-time object detection with region proposal net-works. In Advances in Neural Information Processing Sys-

tems 28: Annual Conference on Neural Information Process-ing Systems 2015, December 7-12, 2015, Montreal, Quebec,Canada, pages 91–99, 2015.
[30] A. Santoro, D. Raposo, D. G. T. Barrett, M. Malinowski,R. Pascanu, P. Battaglia, and T. Lillicrap. A simple neuralnetwork module for relational reasoning. In NIPS.
[31] N. Siegel, Z. Horvitz, R. Levin, S. K. Divvala, andA. Farhadi. Figureseer: Parsing result-figures in researchpapers. In ECCV, 2016.
[32] A. Singh, V. Natarajan, Y. Jiang, X. Chen, M. Shah,M. Rohrbach, D. Batra, and D. Parikh. Pythia-a platform forvision & language research. In SysML Workshop, NeurIPS,volume 2018, 2018.
[33] A. Singh, V. Natarajan, M. Shah, Y. Jiang, X. Chen, D. Batra,D. Parikh, and M. Rohrbach. Towards vqa models that canread. In Proceedings of the IEEE Conference on ComputerVision and Pattern Recognition, 2019.
[34] R. Smith. An overview of the tesseract ocr engine. In ICDAR,2007.
[35] A. Suhr, M. Lewis, J. Yeh, and Y. Artzi. A corpus of naturallanguage for visual reasoning. In ACL, 2017.
[36] Z. Yang, X. He, J. Gao, L. Deng, and A. J. Smola. Stackedattention networks for image question answering. In 2016IEEE Conference on Computer Vision and Pattern Recogni-tion, CVPR 2016, Las Vegas, NV, USA, June 27-30, 2016,pages 21–29, 2016.
[37] Z. Yang, X. He, J. Gao, L. Deng, and A. J. Smola. Stackedattention networks for image question answering. In CVPR,2016.
Pass

Appendices
The supplementary material is organised in the followingmanner: Section 8 describes the methodology of knowledgegraph creation from structured data. In Section 9, we fur-ther analyse our proposed pipeline and discuss the errors ineach stage. In Section 10, we provide sample plots fromthe PlotQA dataset. In Section 11, we list all the 74 ques-tion templates that were formulated from the crowd sourcedquestions.
8. Construction of knowledge graph fromstructured data
Following [26], we convert the semi-structured table intoa knowledge graph which has two types of nodes viz. rownodes and entity nodes. The rows of the table becomerow nodes, whereas the cells of each row become the en-tity nodes in the graph. Directed edges exist from the rownodes to the entity nodes of that column and the correspond-ing table column header act as edge-labels. An example ofknowledge graph of the semi-structured table given in Fig-ure 6a is shown in Figure 6b. For reasoning on the knowl-edge graph, we adopted the same methodology as givenin [26]. The questions are converted to a set of candidatelogical forms by applying compositional semantic parsing.Each of these logical forms is then ranked using a log-linearmodel and the highest ranking logical form is applied to theknowledge graph to get the final answer.
(a) Semi-Structured Table
1996 13.174405 7.895492
1997 11.680978 7.642265
Index
Index
Next
Next
Years
Years
Brazil
Brazil
Iceland
Iceland
...
...
...0
1
RowNode
EntityNode: : : Directed
edge
(b) Knowledge Graph
Figure 6: An example of the knowledge graph constructedfrom the semi-structured table.
9. Some failure cases
In this section, we visualize the output of each stage inour multistage pipeline and show some interesting failurecases with the help of an example.
- VED Stage: Although the bounding boxes predictedby Faster R-CNN coupled with Feature Pyramid Network(FPN) fit reasonably well at an IOU of 0.5, it is not ac-ceptable as the values extracted from these bounding boxeswill lead to incorrect table generation and subsequent QA.Example: In Figure 7b, consider the bar representing the“Indoor User Rating” value for “Vodafone”. The overlapbetween the ground-truth box (blue) and the predicted box(red) is higher than 0.5 but the values extracted from thedetected box is 4.0 as opposed to the actual value whichis 3.73. Another interesting failure case is shown in Fig-ure 9b. There are multiple overlapping data points and themodel is able to detect only one of the points. This leads toincomplete table generation as shown in Figure 10b wherethe values for Liberia for the years 2008, 2009 and 2010could not be extracted. This small error might be accept-able for other VQA tasks but for PlotQA these small errorswill escalate to multiple incorrect answers.
- OCR stage: A slight misalignment in the boundingboxes predicted by VED module causes significant errorswhile extracting the text. Example: In Figure 7b, considerthe box enclosing the legend label “Indoor”. The rightmostedge of the predicted bounding box is drawn over the letter“r”, which makes the OCR module incorrectly recognize thetext as “Indoo”. A similar error is made while performingOCR on the X-axis title which is read as “Dperator” insteadof “Operator”. Consider another example where there aremisaligned bounding boxes on axes tick-labels as shown inFigure 9b. The values extracted are 200B, -2009 and -100as opposed to the ground-truth values 2008, 2009 and 100.This slight error leads to incorrect column name in the sub-sequent generated tables (Figure 8b and Figure 10b) andincorrect answers to all the questions pertaining to these la-bels as shown in Table 11 and Tale 12.
- SIE stage: Figure 8a shows the oracle table which isgenerated by using the ground-truth annotations and Fig-ure 8b shows the table generated after passing the plot im-age through the different stages of our proposed multistagepipeline. It is evident from the generated table that the er-rors propagated from the VED and the OCR stage has leadto an incorrect table generation.
- QA stage: In Table 11 and Table 12 we compare the an-swer predictions made by different models with the ground-truth answer on randomly sampled questions. Note that, ourproposed model combines the complementary strengths ofboth, QA-as-classification and QA as multistage pipeline,models.

(a) Input plot image (b) Few examples of the predicted bounding boxes
Figure 7: Errors made by the VED stage (highlighted in red).
(a) Oracle table generated using ground-truth annotations (b) Generated Semi-Structured Table
Figure 8: Errors made by the OCR and SIE stage (highlighted in red). Note that most of these errors have been propagatedfrom the VED stage.
Question GroundTruth
QA asclassification
MultistagePipeline
OurModel
Q1. What is the average indoor user rating per operator? 3.62 500 3.54 3.54Q2. What is the total user rating for Vodafone in the graph? 7.24 5 7.35 7.35Q3. What is the label or title of the X-axis? Operator Years Dperator DperatorQ4. What is the indoor user rating of Airtel? 3.62 0 3.60 3.60Q5. How many groups of bars are there? 4 4 4 4Q6. What is the ratio of indoor user rating of Airtel to thatof the outdoor user rating of Vodafone? 1.03 No 3.35 3.35
Q7. What is the difference between the highest and lowestoutdoor user rating? 0.13 1.5 0.10 0.10
Q8. Does “Indoor” appear as one of the legend-labels inthe graph? Yes Yes 1.0 Yes
Q9. For how many operators are the indoor user ratinggreater than the average outdoor user rating takenover all operators?
4 4 3.4 4
Q10. Is the sum of outdoor user rating in Reliance andIdea greater than the maximum outdoor user ratingacross all operators?
Yes Yes 6.85 Yes
Table 11: Answers predicted by different models on the sample questions.

(a) Input plot image (b) Few examples of the predicted bounding boxes
Figure 9: Errors made by the VED stage (highlighted in red).
(a) Oracle table generated using ground-truth annotations (b) Generated Semi-Structured Table
Figure 10: Errors made by the OCR and SIE stage (highlighted in red). Note that most of these errors have been propagatedfrom the VED stage.
Question GroundTruth
QA asclassification
MultistagePipeline
OurModel
Q1. How are the legend-labels stacked? horizontal horizontal horizontal horizontalQ2. What is the time (in hours) required toprepare and pay taxes in Kuwait in 2008? 98 100 100- 100-
Q3. What is the difference between in time (inhours) required to prepare and pay taxes inKuwait in 2009 and the time (in hours) requiredto prepare and pay taxes in Liberia in 2008?
-52 -0.5 100- 100-
Q4. What is the difference between the highestand the lowest time (in hours) required toprepare and pay taxes in Peru?
131 500 125 125
Q5. Is it the case that every year the sum of time(in hours) required to prepare and pay taxes inPeru and Kuwait is greater than the sum of thetime (in hours) required to prepare and paytaxes in Liberia and Malaysia?
Yes Yes 320 Yes
Table 12: Answers predicted by different models on the sample questions.
10. Samples from the PlotQA dataset
Few examples of the {plot, question, answer} tripletsfrom the PlotQA dataset are shown in Figure 12. For eachof the plots, most of the question templates discussed in sec-tion 11 are applicable but depending on the context of theplot, their language varies from it’s surface form.
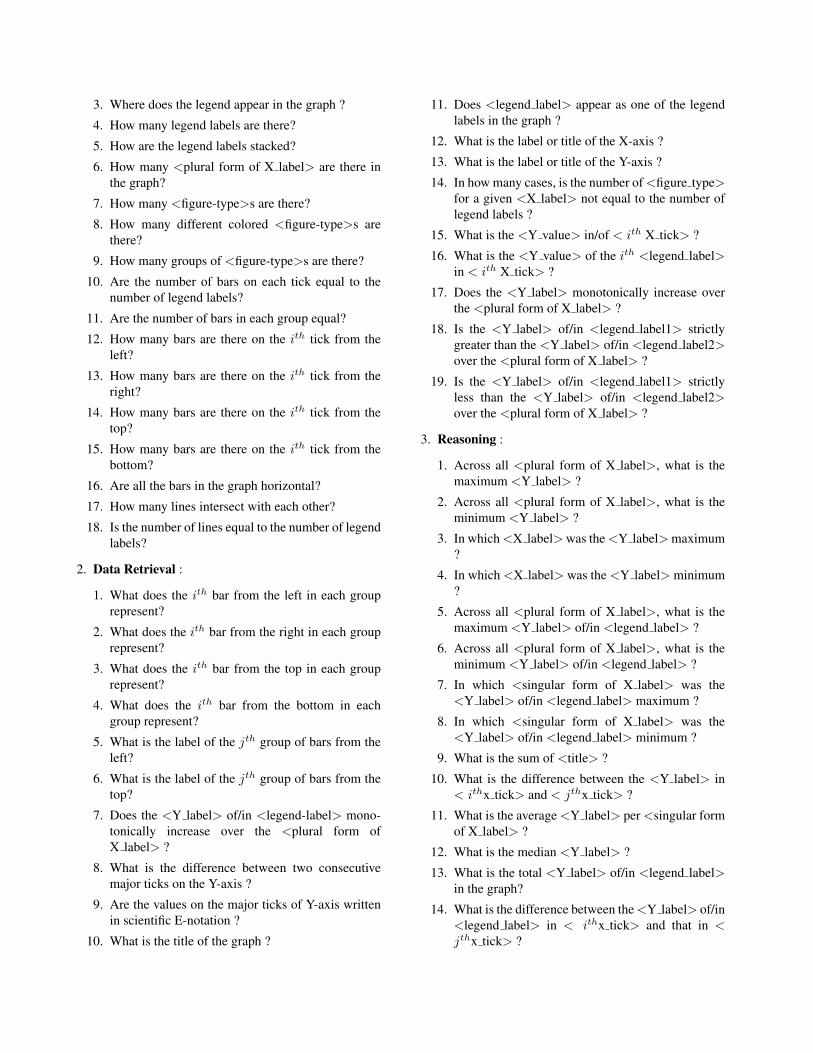
11. Question Templates
In this section, we present the 74 question templateswhich we have used for the question generation. Note that,not all question templates are applicable to each and everytype of plot. Also depending on the context of the plot, thequestion varies from the template’s surface form.

Q1: What is the difference between price of gasoline inSwitzerland and price of gasoline in Macedonia in 2008?A: 0.15
Q2: In how many years is the number of neonatal deaths inCuba greater than 500?A: 2
Q3: What is the difference between the highest and the secondhighest amount of earnings from goods?A: 0.9e + 5
Q4: What is the ratio of the sodium content in Sample 37 tothat in Sample 33?A: 1.086
Q5: What is the average air quality index value for NHMC perhour?A: 0.167
Q6: Does the amount of banana production monotonically in-crease over the years?A: Yes

Q7: What is the difference between two consecutive majorticks on the Y-axis?A: 2.000e + 5
Q8: In how many cases, is the number of bars for a given yearnot equal to the number of legend labels?A: 0
Q9: In how many countries, is the mineral rent (as % of GDP)in 1970 greater than the average mineral rent (as % of GDP) in1970 taken over all countries?A: 1 Q10: What is the total tuberculosis detection rate in Indonesia?
A: 101
Q11: Is it the case that in every year, the sum of the numberof tourists in Costa Rica and Serbia greater than the number oftourists in Bhutan?A: Yes Q12: How many bars are there on the 2nd tick from the top?
A: 2
Figure 12: Sample {plot, question, answer} triplet present in the PlotQA dataset.
1. Structural Understanding : 1. Does the graph contain any zero values?
2. Does the graph contain grids ?
3. Where does the legend appear in the graph ?
4. How many legend labels are there?
5. How are the legend labels stacked?
6. How many <plural form of X label> are there inthe graph?
7. How many <figure-type>s are there?
8. How many different colored <figure-type>s arethere?
9. How many groups of <figure-type>s are there?
10. Are the number of bars on each tick equal to thenumber of legend labels?
11. Are the number of bars in each group equal?
12. How many bars are there on the ith tick from theleft?
13. How many bars are there on the ith tick from theright?
14. How many bars are there on the ith tick from thetop?
15. How many bars are there on the ith tick from thebottom?
16. Are all the bars in the graph horizontal?
17. How many lines intersect with each other?
18. Is the number of lines equal to the number of legendlabels?
2. Data Retrieval :
1. What does the ith bar from the left in each grouprepresent?
2. What does the ith bar from the right in each grouprepresent?
3. What does the ith bar from the top in each grouprepresent?
4. What does the ith bar from the bottom in eachgroup represent?
5. What is the label of the jth group of bars from theleft?
6. What is the label of the jth group of bars from thetop?
7. Does the <Y label> of/in <legend-label> mono-tonically increase over the <plural form ofX label> ?
8. What is the difference between two consecutivemajor ticks on the Y-axis ?
9. Are the values on the major ticks of Y-axis writtenin scientific E-notation ?
10. What is the title of the graph ?
11. Does <legend label> appear as one of the legendlabels in the graph ?
12. What is the label or title of the X-axis ?
13. What is the label or title of the Y-axis ?
14. In how many cases, is the number of <figure type>for a given <X label> not equal to the number oflegend labels ?
15. What is the <Y value> in/of < ith X tick> ?
16. What is the <Y value> of the ith <legend label>in < ith X tick> ?
17. Does the <Y label> monotonically increase overthe <plural form of X label> ?
18. Is the <Y label> of/in <legend label1> strictlygreater than the <Y label> of/in <legend label2>over the <plural form of X label> ?
19. Is the <Y label> of/in <legend label1> strictlyless than the <Y label> of/in <legend label2>over the <plural form of X label> ?
3. Reasoning :
1. Across all <plural form of X label>, what is themaximum <Y label> ?
2. Across all <plural form of X label>, what is theminimum <Y label> ?
3. In which <X label> was the <Y label> maximum?
4. In which <X label> was the <Y label> minimum?
5. Across all <plural form of X label>, what is themaximum <Y label> of/in <legend label> ?
6. Across all <plural form of X label>, what is theminimum <Y label> of/in <legend label> ?
7. In which <singular form of X label> was the<Y label> of/in <legend label> maximum ?
8. In which <singular form of X label> was the<Y label> of/in <legend label> minimum ?
9. What is the sum of <title> ?
10. What is the difference between the <Y label> in< ithx tick> and < jthx tick> ?
11. What is the average <Y label> per <singular formof X label> ?
12. What is the median <Y label> ?
13. What is the total <Y label> of/in <legend label>in the graph?
14. What is the difference between the <Y label> of/in<legend label> in < ithx tick> and that in <jthx tick> ?

15. What is the difference between the <Y label>of/in <legend label1> in < ithx tick> andthe <Y label> of/in <legend label2> in <jthx tick> ?
16. What is the average <Y label> of/in<legend label> per <singular form of X label> ?
17. In the year < ithx tick>, what is the difference be-tween the <Y label> of/in <legend label1> and<Y label> of/in <legend label2> ?
18. What is the difference between the <Y label>of/in <legend label1> and <Y label> of/in<legend label2> in < ithx tick> ?
19. In how many <plural form of X label>, is the<Y label> greater than <N> units ?
20. Do a majority of the <plural form of X label>between < ith x tick> and < jth x tick¿ (in-clusive/exclusive) have <Y label> greater than N<units> ?
21. What is the ratio of the <Y label> in < ith x tick>to that in < jth x tick> ?
22. Is the <Y label> in < ith x tick> less than that in< jth x tick> ?
23. In how many <plural form of X label>, isthe <Y label> of/in <legend label> greater than<N> <units>?
24. What is the ratio of the <Y label> of/in<legend label1> in < ith x tick> to that in <jthx tick>?
25. Is the <Y label> of/in <legend label> in < ith
x tick> less than that in < jth x tick> ?
26. Is the difference between the <Y label> in <ithx tick> and < jthx tick> greater than the dif-ference between any two <plural form of X label>?
27. What is the difference between the highest and thesecond highest <Y label> ?
28. Is the sum of the <Y label> in < ithx tick> and< (i + 1)thx tick> greater than the maximum<Y label> across all <plural form of X label> ?
29. What is the difference between the highest and thelowest <Y label> ?
30. In how many <plural form of X label>, is the<Y label> greater than the average <Y label>taken over all <plural form of X label> ?
31. Is the difference between the <Y label>of/in <legend label1> in < ithx tick> and< jthx tick> greater than the difference be-tween the <Y label> of/in <legend label2> in< ithx tick> and < jthx tick> ?
32. What is the difference between the highest and thesecond highest <Y label> of/in <legend label> ?
33. What is the difference between the highest and thelowest <Y label> of/in <legend label> ?
34. In how many <plural form of X label>, is the<Y label> of/in <legend label> greater than theaverage <Y label> of/in <legend label> takenover all <plural form of X label> ?
35. Is it the case that in every <singular formof X label>, the sum of the <Y label> of/in<legend label1> and <legend label2> is greaterthan the <Y label> of/in <legend label3> ?
36. Is the sum of the <Y label> of/in<legend label1> in < ithx tick> and< jthx tick> greater than the maximum<Y label> of/in <legend label2> across all<plural form of X label>?
37. Is it the case that in every <singular formof X label>, the sum of the <Y label> of/in<legend label1> and <legend label2> is greaterthan the sum of <Y label> of <legend label3>and <Y label> of <legend label4> ?