please note: this manuscript is in press
TRANSCRIPT

page 1
Please Note: This manuscript is in press.
It has been accepted for publication in:
Whitmeyer, Steven, De Paor, Declan, Bailey, John, and Ornduff, Tina, editors., in press, Google Earth and virtual visualizations in geoscience education and research: Boulder, CO, Geological Society of America Special Paper XXX.

page 2
Google Earth and geologic research in remote regions of the developing world: an example from the Western Desert of Egypt
Barbara J. Tewksbury, Hamilton College, Clinton, NY
Asmaa A. K. Dokmak, Alexandria University, Alexandria, Egypt Elhamy A. Tarabees, Damanhour University, Damanhour, Egypt
Ahmed S. Mansour, Alexandria University, Alexandria, Egypt
ABSTRACT Remote sensing is an important option for finding interesting research problems in remote regions of the world, but existing freely available imagery, such as Landsat imagery, has limitations in terms of resolution. In some remote areas, recently available high resolution imagery in Google Earth has the potential to revolutionize the kind of research that can be initiated and carried out. This paper details an example from a remote region of Egypt’s Western Desert. Work by others on Eocene carbonates of the Drunka and El Rufuf Formations has focused on lithologic and paleontologic aspects, and previous mapping of the contact between the two formations in the Western Desert using early Landsat imagery (69 m/pixel) shows a simple contact. High resolution imagery in Google Earth (~1 m/pixel) shows, however, that the contact is both folded and faulted. We used high resolution images in Google Earth to define mappable subunits and to do detailed mapping of folds and faults in a 400 km2 study area. Subsequent field work confirmed the accuracy of lithologic and structural mapping in Google Earth, targeted critical areas for field data collection, and provided ground truth for extending mapping into remote areas. Freely available, high resolution satellite imagery in Google Earth not only allows identification of research questions but is also critical in pre-fieldwork mapping, targeting sites for field work, and disseminating research results in areas of the world where field work is difficult, funding is poor, and access to dissemination of research results outside the region is limited. INTRODUCTION Remote regions of the world have literally millions of square kilometers of inaccessible terrain. Remote sensing is one of the only options for finding interesting research problems in such areas and for carrying out research both at reconnaissance and detailed levels. Desert areas in particular are ideal for remote sensing analysis because they have essentially no obscuring vegetation, water, ice, or cultural features. In many of these remote areas, satellite images are, in fact, the only imagery available for use in remote sensing analyses, as aerial photography has never been flown or is unavailable. Research in such areas bears striking similarities to research on other planets, both in terms of types of data and extremely limited access for ground truthing. Egypt is a country with vast tracts of inaccessible desert that have comparatively little sand cover to obscure interesting bedrock features, and satellite imagery and data from orbit have been used successfully for studying geology in Egypt for over 30 years. Previous workers have used Landsat, ASTER, SIR-C, MODIS, and SRTM data to investigate topics ranging from bedrock structure (e.g., Abdelsalam et al., 2008; Abdelsalam, et al., 2000; Alfarhan et al., 2006; El-Baz and El-Etr, 1979; El-Etr and El-Baz, 1979; El-Etr and Moustafa, 1981 and 1980; Stern et al., 1996) to surface processes (e.g., Luo, 1997), Nile evolution (e.g., Gani et al., 2009), and water

page 3
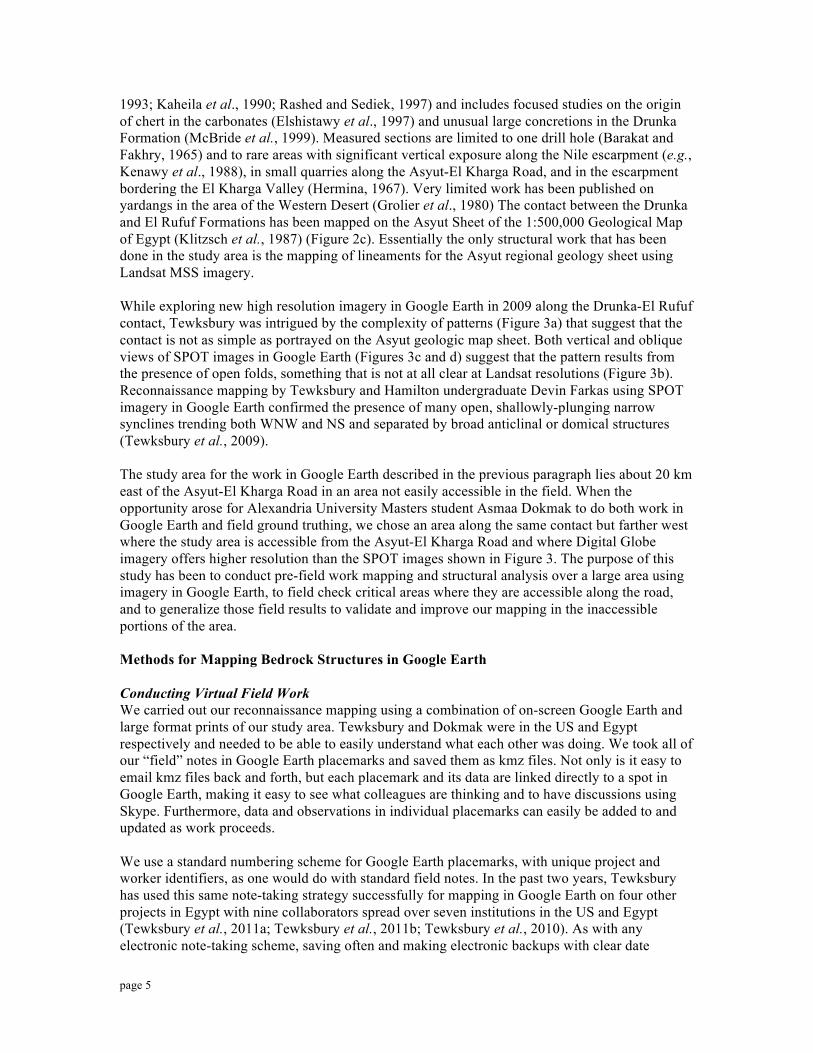
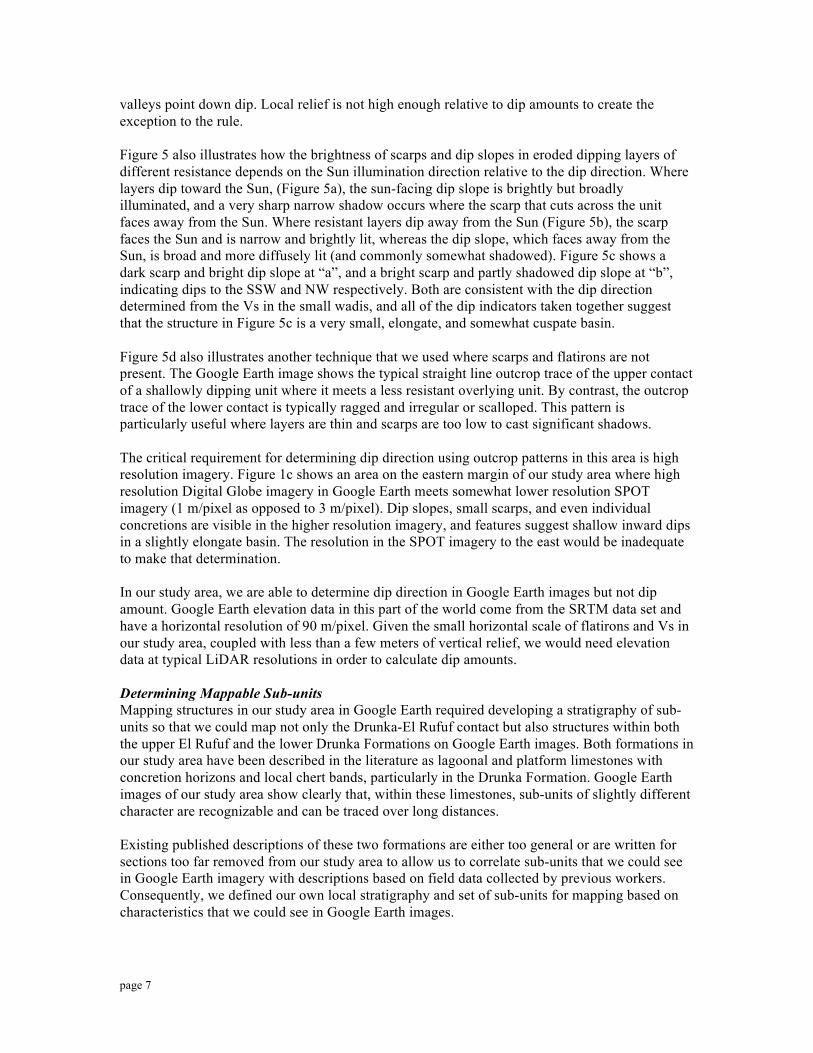
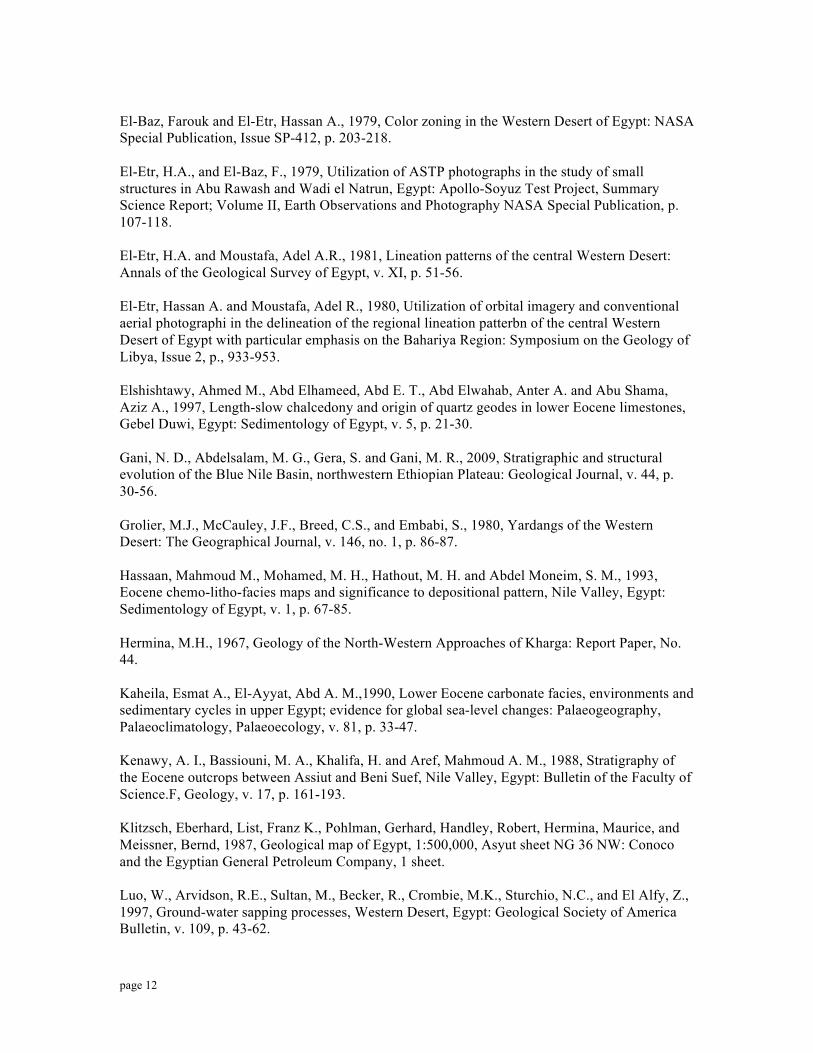
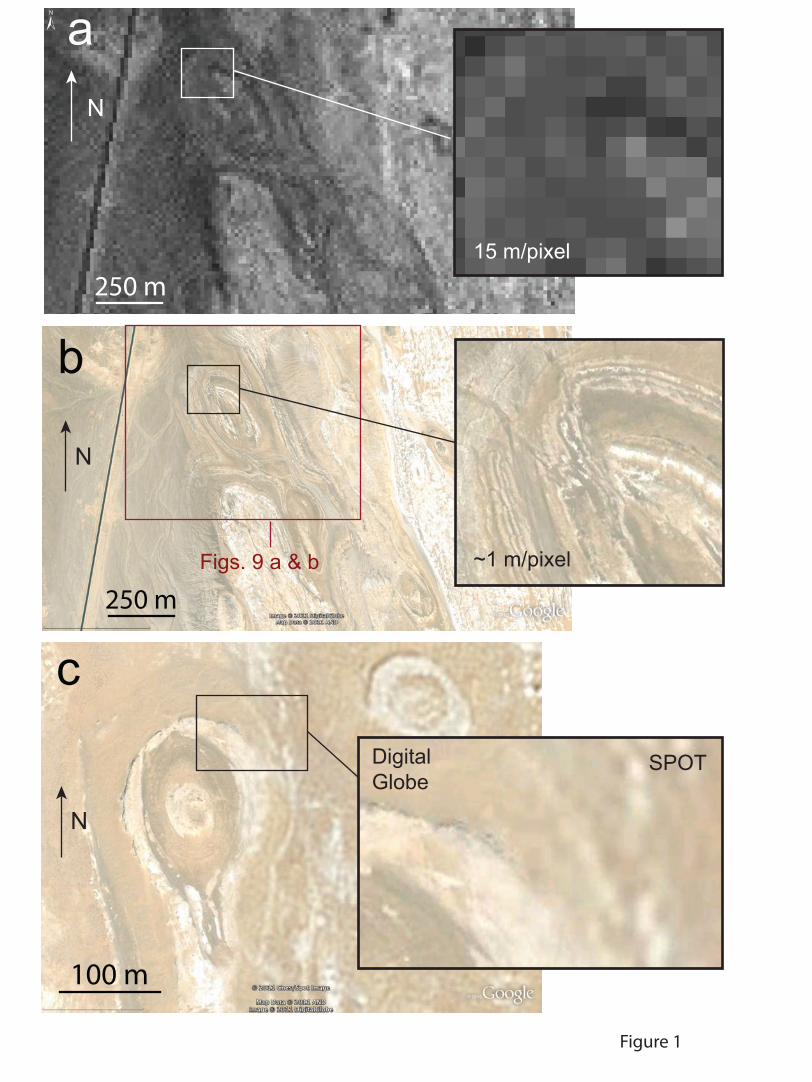
resources (e.g., Masoud and Koike, 2006). In addition, the current 1:500,000 geologic map sheets of Egypt relied heavily on Landsat MSS images from the 1970s (Klitzsch et al., 1987). Resolution of satellite imagery used in previous studies ranges from about 15 m/pixel (Landsat ETM panchromatic band) to about 250 m/pixel (MODIS). Despite the progress that has been made in using satellite imagery to study bedrock geology in Egypt, the comparatively low resolution of the imagery has limited research to features that can be successfully studied in images with a maximum resolution of about 15 m/pixel. Until recently (late 2008), Google Earth displayed images at these lower resolutions. As Google has replaced older Landsat imagery in Egypt with high resolution commercial satellite imagery, it has become possible to study a whole host of features that were too small to be resolved at Landsat resolutions. High resolution satellite imagery is now available in Google Earth for all of Egypt. Google Earth offers a unique combination of freely available, high resolution imagery. This paper focuses on an example of research on previously unrecognized bedrock structures in the Western Desert of Egypt that escaped previous study because they are too small for study in the Landsat, ASTER, and other imagery that has been used previously to study remote areas of the Western Desert. THE NEED FOR HIGH RESOLUTION IMAGERY The structures of interest in this study range in scale from under 100 m to about 1 km in size, and features that are critical for analyzing these structures are typically a few meters to tens of meters in size. Figure 1 illustrates the crucial difference that high resolution images make in study of these structures. Figure 1a shows a portion of our study area at the best available Landsat resolution (15 m/pixel, Landsat ETM panchromatic band). The patterns suggest that something interesting might be there, but the resolution is inadequate for analysis. Figure 1b shows the same area in Google Earth with Digital Globe imagery at about 1 m/pixel. Not only are the patterns recognizable as bedrock structures, but the structures can be analyzed in the satellite imagery. Features that were unrecognizable when represented by 100 pixels in a 10x10 pixel square are clear when represented in Google Earth by 10,000 pixels in a 100 x 100 pixel square. Not all high resolution images of Egypt in Google Earth are currently at a resolution of 1 m/pixel. SPOT imagery at about 3 m/pixel is the best that is available in some places. Although this is a significant improvement over Landsat resolutions, the contrast between what can be seen in Google Earth’s highest resolution imagery from Digital Globe vs what can be seen in the slightly lower resolution SPOT images (Figure 1c) is striking and underscores why structures such as these have not been studied previously – they have simply been “invisible” at the resolution of previous imagery. THE ROLE OF GOOGLE EARTH Studies such as the one described in this paper require resolutions of a few meters per pixel or less, which is an order of magnitude or more higher resolution than either Landsat or ASTER. The problem arises from the fact that, while researchers can obtain free access to NASA’s Landsat and ASTER imagery, those who wish to acquire higher resolution images must purchase them from commercial vendors such as SPOT, GeoEye, or Digital Globe at prices as high as $25/km2, even with an educational discount. The cost of commercial satellite imagery is affordable for detailed work on a known problem of limited extent. Purchasing high resolution imagery for huge areas for the purpose of searching for

page 4
interesting research problems, on the other hand, is outside the realm of possibility for most researchers. The problem, then, is that resolution of existing free NASA imagery is inadequate for finding interesting research problems involving small-scale features but the cost is prohibitive for purchasing large areas of high resolution commercial imagery to find and carry out research on such structures. Enter Google Earth. Freely available high resolution imagery in Google Earth makes it possible to browse large areas in remote regions to find interesting research problems. In the course of our work in Egypt, one of us (Tewksbury) has combed more than one hundred thousand square kilometers of Google Earth imagery in Egypt that would have cost quite literally millions of dollars on the commercial market. Google Earth can also be used to carry out the research, to choose critical areas for targeted “boots on the ground” field work, and to make selective purchases of commercial imagery for stereo or multi-spectral coverage and image analysis. Furthermore, Google Earth offers many ways of disseminating research results, maps, and photographs in the developing world. The remainder of this paper will detail an example from the Western Desert of Egypt. Although we will provide some research results to illustrate the validity of this research strategy, the paper will focus on the methodology, which is transportable to other remote regions. EXAMPLE FROM THE WESTERN DESERT OF EGYPT Location and Remoteness of the Study Area The Western Desert encompasses all of Egypt west of the Nile River floodplain (Figure 2a, area shaded in tan), an area of about 650,000 km2. Although the area has a number of oasis settlements linked by three major roads, the vast majority of the area is roadless and untracked. Figures 2a puts into perspective just how inaccessible much of the Western Desert actually is. The Cairo-Farafra Road and the Asyut-El Kharga Road, which are spaced about 300 km apart, are the only roads in the central part of the Western Desert – Lake Ontario would fit length-wise between them with room to spare. Figure 2a also shows, at the same scale, the state of California, where roads near Google Headquarters in Mountain View are spaced less than 0.25 km apart. A road spacing in California comparable to the road spacing in the Western Desert would place one road along the California Coast and one road east of the Sierra Nevada Mountains! Our study area (red star in Figure 2a and larger red outline in Figure 2b) lies about 125 km SW of Asyut along the Asyut-El Kharga Road. The area that we mapped on Google Earth images for this project covers an area of about 400 km2 and extends about 10 km both east and west of the Asyut-El Kharga Road. Ground truthing in the field was limited by difficulty of access to locations within about 1 km of the road. Previous Work and Project Evolution The Stable Platform of central Egypt (Figure 2a) consists of a sequence of Late Mesozoic through Miocene sediments lying unconformably on Precambrian basement. The sequence generally dips very gently north, exposing the oldest rocks in the south. The latest Cretaceous through Miocene section consists almost exclusively of shallow marine carbonates (Said, 1990). The study area lies in Eocene carbonates of the Drunka and El Rufuf Formations. Previous work by others has targeted general sedimentology, stratigraphy, and paleontology (e.g., Hassan et al.,
page 5
1993; Kaheila et al., 1990; Rashed and Sediek, 1997) and includes focused studies on the origin of chert in the carbonates (Elshistawy et al., 1997) and unusual large concretions in the Drunka Formation (McBride et al., 1999). Measured sections are limited to one drill hole (Barakat and Fakhry, 1965) and to rare areas with significant vertical exposure along the Nile escarpment (e.g., Kenawy et al., 1988), in small quarries along the Asyut-El Kharga Road, and in the escarpment bordering the El Kharga Valley (Hermina, 1967). Very limited work has been published on yardangs in the area of the Western Desert (Grolier et al., 1980) The contact between the Drunka and El Rufuf Formations has been mapped on the Asyut Sheet of the 1:500,000 Geological Map of Egypt (Klitzsch et al., 1987) (Figure 2c). Essentially the only structural work that has been done in the study area is the mapping of lineaments for the Asyut regional geology sheet using Landsat MSS imagery. While exploring new high resolution imagery in Google Earth in 2009 along the Drunka-El Rufuf contact, Tewksbury was intrigued by the complexity of patterns (Figure 3a) that suggest that the contact is not as simple as portrayed on the Asyut geologic map sheet. Both vertical and oblique views of SPOT images in Google Earth (Figures 3c and d) suggest that the pattern results from the presence of open folds, something that is not at all clear at Landsat resolutions (Figure 3b). Reconnaissance mapping by Tewksbury and Hamilton undergraduate Devin Farkas using SPOT imagery in Google Earth confirmed the presence of many open, shallowly-plunging narrow synclines trending both WNW and NS and separated by broad anticlinal or domical structures (Tewksbury et al., 2009). The study area for the work in Google Earth described in the previous paragraph lies about 20 km east of the Asyut-El Kharga Road in an area not easily accessible in the field. When the opportunity arose for Alexandria University Masters student Asmaa Dokmak to do both work in Google Earth and field ground truthing, we chose an area along the same contact but farther west where the study area is accessible from the Asyut-El Kharga Road and where Digital Globe imagery offers higher resolution than the SPOT images shown in Figure 3. The purpose of this study has been to conduct pre-field work mapping and structural analysis over a large area using imagery in Google Earth, to field check critical areas where they are accessible along the road, and to generalize those field results to validate and improve our mapping in the inaccessible portions of the area. Methods for Mapping Bedrock Structures in Google Earth Conducting Virtual Field Work We carried out our reconnaissance mapping using a combination of on-screen Google Earth and large format prints of our study area. Tewksbury and Dokmak were in the US and Egypt respectively and needed to be able to easily understand what each other was doing. We took all of our “field” notes in Google Earth placemarks and saved them as kmz files. Not only is it easy to email kmz files back and forth, but each placemark and its data are linked directly to a spot in Google Earth, making it easy to see what colleagues are thinking and to have discussions using Skype. Furthermore, data and observations in individual placemarks can easily be added to and updated as work proceeds. We use a standard numbering scheme for Google Earth placemarks, with unique project and worker identifiers, as one would do with standard field notes. In the past two years, Tewksbury has used this same note-taking strategy successfully for mapping in Google Earth on four other projects in Egypt with nine collaborators spread over seven institutions in the US and Egypt (Tewksbury et al., 2011a; Tewksbury et al., 2011b; Tewksbury et al., 2010). As with any electronic note-taking scheme, saving often and making electronic backups with clear date

page 6
designations or version numbers is essential. To make a printable file of a kml file with placemarks, it is a simple matter to import the kml file into Google Fusion Tables. Each placemark becomes a row in the Fusion Table, and placemark name, description, and geometry appear in separate columns. We divided our reconnaissance mapping area into sections and used the capability of Google Earth Pro to save a high resolution image of each section (note: for adjacent images to match perfectly, terrain must be turned off when saving the image). We printed each image out at 55 cm x 72 cm using a large format color printer and did our mapping on high transparency mylar overlays. We found that having Google Earth up on the computer screen for adding notes in placemarks, coupled with mapping by hand on an overlay, was a good combination for this complex area. This strategy allowed us to zoom in closely on the computer screen but to do the mapping in a larger context on the paper printout. Mapping by hand in pencil also allowed us to make tentative mapping decisions in uncertain areas and to make changes and additions easily, both of which are more difficult when mapping digitally. Data Source and Quality In the study area, current Google Earth imagery comes from Digital Globe and has a resolution of about 1 m/pixel or less. Digital Globe’s QuickBird and WorldView 2 platforms are both sun-synchronous, and both image this part of Egypt at approximately 10:30 am local time. This means that sun illumination is consistently from the SE quadrant. Elevation data are available for the study area only from the Shuttle Radar Topography Mission (90 m/pixel horizontal resolution and 16 m vertical resolution) and from the ASTER G-DEM (30 m/pixel horizontal resolution and 20 m vertical resolution). Determining Dip Direction Mapping fold structures in the study area on Google Earth images requires reliable determination of dip direction. In the absence of high resolution elevation data, dip direction must be inferred from the pattern of outcrop traces of contacts where they intersect the topographic surface. These interpretive techniques are typically used in areas with moderate to steep dips where tens to hundreds of meters of topographic relief produce significant valleys, hogbacks, and flatirons (Figure 4a). In our study area, however, the local topographic relief is generally very low, commonly only a few meters, and the area is not dissected by integrated drainage networks. In such a terrain, one might think that it would be ineffective to use outcrop patterns in imagery to infer dip direction. Surprisingly, slight differences in erosional resistance in the interlayered carbonates produce low ridges that are cut by tiny wadis, producing mini-hogbacks, mini-flatirons, and mini-scalloped ridges (Figure 4b). Despite the fact that these flatirons are one to two orders of magnitude smaller than those typically seen in mountainous regions, they serve as good dip indicators in the Western Desert. Our study area has a fortuitous combination of shallow dip and very low topographic relief. If dips were steeper, the very low local relief would not be enough to create interpretable outcrop patterns. If the local relief were higher and the area more thoroughly dissected by integrated drainage networks, the subtle outcrop patterns would be masked. We employed a variety of strategies to interpret dip direction in the Google Earth images. Figures 5 a and b show the typical pattern of Vs that develops in the outcrop traces of slightly more resistant units where they are eroded by small wadis. The Google Earth image in Figure 5c shows a scalloped ridge of mini-hogbacks at “a” on the north side of an eye-shaped structure. The locations of wadis with respect to scallops and flatirons indicate a southward dip. With very few exceptions in our study area, the outcrop patterns follow the “Rule of Vs”, i.e., the Vs in the
page 7
valleys point down dip. Local relief is not high enough relative to dip amounts to create the exception to the rule. Figure 5 also illustrates how the brightness of scarps and dip slopes in eroded dipping layers of different resistance depends on the Sun illumination direction relative to the dip direction. Where layers dip toward the Sun, (Figure 5a), the sun-facing dip slope is brightly but broadly illuminated, and a very sharp narrow shadow occurs where the scarp that cuts across the unit faces away from the Sun. Where resistant layers dip away from the Sun (Figure 5b), the scarp faces the Sun and is narrow and brightly lit, whereas the dip slope, which faces away from the Sun, is broad and more diffusely lit (and commonly somewhat shadowed). Figure 5c shows a dark scarp and bright dip slope at “a”, and a bright scarp and partly shadowed dip slope at “b”, indicating dips to the SSW and NW respectively. Both are consistent with the dip direction determined from the Vs in the small wadis, and all of the dip indicators taken together suggest that the structure in Figure 5c is a very small, elongate, and somewhat cuspate basin. Figure 5d also illustrates another technique that we used where scarps and flatirons are not present. The Google Earth image shows the typical straight line outcrop trace of the upper contact of a shallowly dipping unit where it meets a less resistant overlying unit. By contrast, the outcrop trace of the lower contact is typically ragged and irregular or scalloped. This pattern is particularly useful where layers are thin and scarps are too low to cast significant shadows. The critical requirement for determining dip direction using outcrop patterns in this area is high resolution imagery. Figure 1c shows an area on the eastern margin of our study area where high resolution Digital Globe imagery in Google Earth meets somewhat lower resolution SPOT imagery (1 m/pixel as opposed to 3 m/pixel). Dip slopes, small scarps, and even individual concretions are visible in the higher resolution imagery, and features suggest shallow inward dips in a slightly elongate basin. The resolution in the SPOT imagery to the east would be inadequate to make that determination. In our study area, we are able to determine dip direction in Google Earth images but not dip amount. Google Earth elevation data in this part of the world come from the SRTM data set and have a horizontal resolution of 90 m/pixel. Given the small horizontal scale of flatirons and Vs in our study area, coupled with less than a few meters of vertical relief, we would need elevation data at typical LiDAR resolutions in order to calculate dip amounts. Determining Mappable Sub-units Mapping structures in our study area in Google Earth required developing a stratigraphy of sub-units so that we could map not only the Drunka-El Rufuf contact but also structures within both the upper El Rufuf and the lower Drunka Formations on Google Earth images. Both formations in our study area have been described in the literature as lagoonal and platform limestones with concretion horizons and local chert bands, particularly in the Drunka Formation. Google Earth images of our study area show clearly that, within these limestones, sub-units of slightly different character are recognizable and can be traced over long distances. Existing published descriptions of these two formations are either too general or are written for sections too far removed from our study area to allow us to correlate sub-units that we could see in Google Earth imagery with descriptions based on field data collected by previous workers. Consequently, we defined our own local stratigraphy and set of sub-units for mapping based on characteristics that we could see in Google Earth images.

page 8
The Google Earth images show three different types of units within our study area (Figure 6): 1) a white unit (Figure 6b), commonly characterized by prominent jointing and, where thick enough, prominent yardangs; 2) a thin pale brown unit that holds up mini-hogbacks with small scarps on one side and, on the other side, prominent dip slopes decorated with a distinctive speckled texture (Figures 6b and c); and 3) a gray-brown unit with no scarps and hogbacks and no yardangs (Figure 6 d, units 5, 7, and 9). Without elevation data, we were unable to determine sub-unit thicknesses from the image data, but we inferred from the outcrop patterns that most of our sub-units are probably meters thick, rather than many 10s to hundreds of meters thick. Outcrop widths of our units vary across the study area from a few meters to several kilometers. We found nothing in the literature to suggest that actual layer thicknesses varies significantly, and we reasoned that the narrowest outcrop widths likely occur where dips are steeper and that extreme outcrop widths occur where bedding surfaces of a more resistant layer have been stripped of overlying softer layers and exposed as a horizontal or slightly undulating surface over hundreds of meters to many kilometers. The Google Earth imagery also shows two different surficial deposits, a tan unit and a dark gray unit, that locally blanket the bedrock (Figure 6b, arrows). We interpreted the pale tan, smooth textured material as aeolian sand. The dark gray deposit also appears to reflect prevailing wind direction and is commonly associated with the aeolian sand, but we were unable to determine its origin from the Google Earth images. Because we are interested in bedrock structure, we did not map either deposit in our reconnaissance work. Results of Pre-fieldwork Mapping By combining dip determinations in Google Earth with mappable units, we rapidly realized that our stratigraphy consists of nine sub-units (Figure 6a): four different white rock units (1, 3, 6, and 8), two different pale tan speckled units (2 and 4), and three different gray-brown units (5, 7, and 9). All but Unit 1 are sub-units within the Drunka Formation. Combining dip direction and stratigraphy allowed us not only to map small-scale structures within the lower part of the Drunka Formation but also larger-scale structures, including faults, across the full study area. Prior to going into the field in December of 2010, we had mapped the entire study area on the Google Earth images. On a casual look in Google Earth, this area looks splotchy and irregularly patterned (Figure 7a). Our mapping revealed, however, that the color variations reflect the stratigraphy and that the splotchiness is fundamentally structural. The geologic map in Figure 7b shows a generalized version of our mapping results, emphasizing large-scale features and stratigraphy. Unit 4 cores two very broad north-plunging anticlines and one broad, central, low-amplitude dome. The central dome is separated from the two broad anticlines by open, narrower, synclinal structures, one trending NNW and one trending NNE, that merge south into one syncline. The southern syncline lies parallel to a major NS striking fault that continues south to bound the eastern side of the El Kharga Valley. Furthermore, the pervasive “stripiness” of much of the western and northern portions of the study area (and, indeed, much of the Western Desert between here and the Nile) is due to the presence of narrow, open, WNW-ESE trending, synclinal structures that are typically several 100 meters wide separated by broader, low amplitude, anticlinal structures (Figure 7c). The high resolution of imagery in Google Earth also clearly illuminates the nature of the lineaments mapped on the 1987 1:500,000 geologic map sheets (Klitzsch et al., 1987) (see, for example, the lineaments in figure 2c). Because the map authors had access only to low resolution Landsat MSS images (at 79 m/pixel), they mapped lineaments wherever they saw linear trends in

page 9
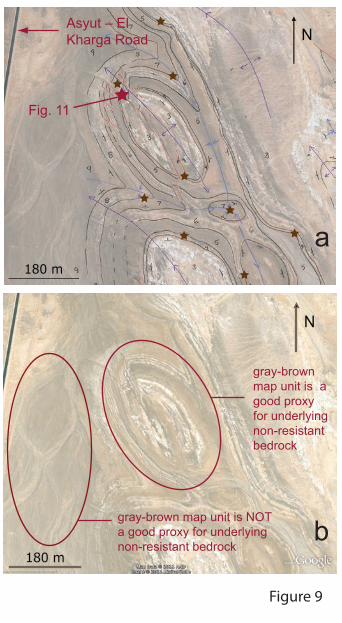
the satellite imagery. Our study has revealed that the vast majority of these lineaments are, in fact, the narrow synclinal structures described above, rather than faults. Google Earth and Field Work After having mapped the study area using the imagery in Google Earth, we were fortunate to have an opportunity to field check portions of our mapping in order to determine whether our basic strategy for dip determination in the Google Earth images produced accurate results, to verify that our maps units are indeed stratigraphic units, and to test our interpretation of both fold and fault structures with data collected in the field. Because field access to this area was very limited both in time and in distance that we could travel from the Asyut-El Kharga Road, our strategy was to choose a small number of carefully targeted areas to validate critical interpretations so that we could extend these, in principle, across the inaccessible portions of the study area where similar features occur. Google Earth played a crucial role in our field work. Each night prior to going into the field, we determined the critical target for the following day based on our pre-field work mapping (Figure 9a), and we used Google Earth to determine coordinates for the locations. Because we did not have reliable Internet access in the field itself, we wrote the coordinates directly on the back of our high resolution Google Earth printouts and used a hand held GPS device to locate our targets in the field. Most critically, our field work showed clearly that our interpretations of dip directions and fold structures based on high resolution imagery in Google Earth were spot on. Structures that we had mapped as folds are, in fact, folds. Dips are shallow in most places, as we had inferred, and units are on the order of meters, rather than 10s or hundreds of meters thick. Features that we had inferred as faults on the Google Earth images have fault characteristics in the field. Our map units, on the other hand, held a few surprises. The white rock of map units 1, 3, 6, and 8 is, indeed, a dense, white, crystalline limestone that is spectacularly wind fluted in many places (Figure 8a). The thin pale brown resistant rock of map units 2 and 4 is a pale buff, slightly purplish, siliceous limestone with large concretions up to 1 m or more in diameter scattered across the dip slopes (Figure 8b). These concretions are what give rise to the distinctive and widespread speckled texture in the high resolution Google Earth images. Gray-brown map units 5, 7, and 9, however, turned out to be surficial lag deposits, rather than bedrock. The dark color is due to abundant chert fragments coated with dark desert varnish (Figure 8c). In a few rare places, we encountered small outcrops of pale buff, fissile, slightly marly limestone poking up through the surface lag, from which we infer that the chert lag deposit blankets a largely non-resistant sequence in the stratigraphy (Figure 6a). Where this dark lag deposit is confined between the outcrop areas of two adjacent bedrock units, it is a good proxy for the non-resistant bedrock unit that immediately underlies it (Figure 9) and allows accurate mapping of bedrock units in Google Earth images. In some of the wider low areas in the study area, however, this dark lag deposit has been redistributed by past sheetwash and fluvial activity and, in such places, is not a good proxy for an underlying non-resistant bedrock layer (Figure 9). This kind of field data is crucial to feed back into the mapping process for remote areas in Google Earth and helps explain why structures are commonly difficult to sort out in the gray-brown areas.

page 10
WHAT DIFFERENCE DID GOOGLE EARTH MAKE? The fact that these structures have been missed previously by geologists in the field is a function, in part, of the remoteness of the area and the incredibly difficult access to virtually the entire area. Geologists have simply not combed this area over the course of decades as they have other areas with better accessibility. But even where roads cross these structures, the nature of both the terrain and the bedrock geology conspire against a geologist noticing these structures from the ground. The Asyut-El Kharga Road traverses a region with three types of terrain: 1) areas dominated by wind-sculpted yardangs (Figure 10a), 2) vast, flat expanses of desert pavement with irregular, very low exposures of white limestone (Figure 10b), and 3) surfaces with scattered large concretions (Figure 10c). Bedding in the limestones is commonly massive and difficult to see at a distance, and many outcrops are dominated by wind-scoured surfaces that cut across dip. These features catch the eye from road level, not the structures that show up so clearly in Google Earth. When these terrain features are combined with the fact that the structures have low dips and are fairly large (typically 100-300 m across), it is easy to see why they were missed from the ground by other geologists. For example, the faulted dome in figure 9 lies less than 250 m from the Asyut-El Kharga Road but is difficult to see even when one is standing on top of the structure (Figure 11), let alone from the road, because the wind-scoured bedrock exposures are only a few centimeters high and the structure is large enough that it is impossible to see in its entirety from one vantage point. Google Earth was also crucial for mapping these structures efficiently. Even in the accessible portions along the Asyut-El Kharga Road, it would have taken weeks to months of careful field work to trace contacts and structures. By contrast, Google Earth allowed us to map structures ahead of time and to plan specific points for sampling and data collection both to field check and to augment our mapping in Google Earth (Figure 9b). CONCLUSIONS: THE POTENTIAL OF GOOGLE EARTH Google Earth proved instrumental in many ways in this research project. Perhaps most important is the role that Google Earth played in finding this research problem in the first place. As far as we can determine, these structures have never been recognized before, even in satellite images. As mentioned at the start of this paper, these structures are just small enough to have been enigmatic at best, if not essentially invisible, in older freely available satellite imagery. Although high resolution commercial satellite imagery can be purchased at significant cost, the paradox remains that one would be unlikely to purchase costly high resolution satellite imagery for large areas to look for structures that one didn’t know were there in the first place. High resolution imagery in Google Earth has changed the landscape of finding structures such as these, and for studying them as well. Finding interesting research problems in high resolution Google Earth imagery is not limited to bedrock structures or to Egypt. Spending any time in Google Earth in the desert regions of North Africa reveals a whole host of interesting features in both the surficial and bedrock geology that have been little studied previously, and the same can be said for other remote regions of the world. Reconnaissance using Google Earth imagery is also an outstanding and virtually cost-free strategy for collecting enough data to make a credible proposal for research funding. Reconnaissance work that Tewksbury and several Hamilton undergraduates did on structures of

page 11
the Sinn El Kaddab Plateau (Tewksbury et al., 2009) formed the basis for a successful NSF-IRES proposal to fund three years of mapping in Google Earth and field work in Egypt (Tewksbury et al., 2011b). Additional work in El Sett Tellaal in Egypt (Tewksbury et al., 2010) has provided a strong rationale and supporting data for another proposal. Neither would have been possible without the freely available, high resolution imagery in Google Earth. Using Google Earth to find research projects that can be carried out essentially entirely in Google Earth is particularly valuable for geologists from the developing world. Whereas support is commonly available for applied geological research (e.g., water resources, engineering geology), funding is more difficult to come by for basic geologic research. The ready availability of the Internet in countries such as Egypt makes a Google Earth-based approach particularly attractive for basic research and collaboration. Furthermore, Google Earth offers a platform for wide and low-cost dissemination of research results in the developing world, including maps, cross sections, field and sample data, and photographs, using strategies discussed by Whitmeyer et al. (2010) and, in this volume, by XXX, XXX, and XXX1. Online resources that outline specific methods are available at http://serc.carleton.edu/NAGTWorkshops/google_earth/index.html 2. ACKNOWLEGEMENTS Our work has benefited from contributions to these strategies for mapping using Google Earth by a number of individuals, including Hamilton undergraduates Devin Farkas, Stephen Kemp, Tucker Keren, Nicholas Kernan, and Anoop Pandey, and U.S. Air Force Capt. Carolyn Tewksbury-Christle. Dave Tewksbury was instrumental in providing technical support. The authors are also deeply grateful for the support that we have received from Hamilton College, Alexandria University, and Damanhour University and from our colleagues and families. REFERENCES CITED Abdelsalam, M. G., Tsige, Lulu, Yihunie, Tadesse and Hussien, Bedru, 2008, Terrane rotation during the East African orogeny; evidence from the Bulbul shear zone, south Ethiopia: Gondwana Research, v. 14, p. 497-‐508. Abdelsalam, Mohamed G., Robinson, Cordula, El-‐Baz, Farouk and Stern, Robert J., 2000, Applications of orbital imaging radar for geologic studies in arid regions; the Saharan testimony: Photogrammetric Engineering and Remote Sensing, v. 66, p. 717-‐726. Alfarhan, Mohammed S., Arafat, Sayed M. and Abdelsalam, Mohamed G., 2006, Interplay of Cretaceous-Quaternary faulting and folding in the south desert of Egypt; insights from remote sensing analysis: Abstracts with Programs - Geological Society of America, v. 38, p. 9-9. Barakat, M.G. and Asaad, Fakhry A., 1965 Geological results of the Assiut-Kharga well: Journal of the Geology of the U.A.R., v. 9, no. 2, p. 81-87. Bosworth, William, Guiraud, René, and Kessler, L.G., II, 1999, Late Cretaceous (ca. 84 Ma) compressive deformation of the stable platform of northeast Africa (Egypt): far-field stress effects of the “Santonian event” and origin of the Syrian arc deformation belt: Geology, v. 27, no. 7, p. 633-636.
1 Steve – because I do not know what the contents of the volume are, I can’t include this yet. 2 At the time of writing this draft, these web pages are still in the development stage. They are scheduled
to go live long before the Penrose volume will be published.
page 12
El-Baz, Farouk and El-Etr, Hassan A., 1979, Color zoning in the Western Desert of Egypt: NASA Special Publication, Issue SP-412, p. 203-218. El-Etr, H.A., and El-Baz, F., 1979, Utilization of ASTP photographs in the study of small structures in Abu Rawash and Wadi el Natrun, Egypt: Apollo-Soyuz Test Project, Summary Science Report; Volume II, Earth Observations and Photography NASA Special Publication, p. 107-118. El-Etr, H.A. and Moustafa, Adel A.R., 1981, Lineation patterns of the central Western Desert: Annals of the Geological Survey of Egypt, v. XI, p. 51-56. El-Etr, Hassan A. and Moustafa, Adel R., 1980, Utilization of orbital imagery and conventional aerial photographi in the delineation of the regional lineation patterbn of the central Western Desert of Egypt with particular emphasis on the Bahariya Region: Symposium on the Geology of Libya, Issue 2, p., 933-953. Elshishtawy, Ahmed M., Abd Elhameed, Abd E. T., Abd Elwahab, Anter A. and Abu Shama, Aziz A., 1997, Length-slow chalcedony and origin of quartz geodes in lower Eocene limestones, Gebel Duwi, Egypt: Sedimentology of Egypt, v. 5, p. 21-30. Gani, N. D., Abdelsalam, M. G., Gera, S. and Gani, M. R., 2009, Stratigraphic and structural evolution of the Blue Nile Basin, northwestern Ethiopian Plateau: Geological Journal, v. 44, p. 30-56. Grolier, M.J., McCauley, J.F., Breed, C.S., and Embabi, S., 1980, Yardangs of the Western Desert: The Geographical Journal, v. 146, no. 1, p. 86-87. Hassaan, Mahmoud M., Mohamed, M. H., Hathout, M. H. and Abdel Moneim, S. M., 1993, Eocene chemo-litho-facies maps and significance to depositional pattern, Nile Valley, Egypt: Sedimentology of Egypt, v. 1, p. 67-85. Hermina, M.H., 1967, Geology of the North-Western Approaches of Kharga: Report Paper, No. 44. Kaheila, Esmat A., El-Ayyat, Abd A. M.,1990, Lower Eocene carbonate facies, environments and sedimentary cycles in upper Egypt; evidence for global sea-level changes: Palaeogeography, Palaeoclimatology, Palaeoecology, v. 81, p. 33-47. Kenawy, A. I., Bassiouni, M. A., Khalifa, H. and Aref, Mahmoud A. M., 1988, Stratigraphy of the Eocene outcrops between Assiut and Beni Suef, Nile Valley, Egypt: Bulletin of the Faculty of Science.F, Geology, v. 17, p. 161-193. Klitzsch, Eberhard, List, Franz K., Pohlman, Gerhard, Handley, Robert, Hermina, Maurice, and Meissner, Bernd, 1987, Geological map of Egypt, 1:500,000, Asyut sheet NG 36 NW: Conoco and the Egyptian General Petroleum Company, 1 sheet. Luo, W., Arvidson, R.E., Sultan, M., Becker, R., Crombie, M.K., Sturchio, N.C., and El Alfy, Z., 1997, Ground-water sapping processes, Western Desert, Egypt: Geological Society of America Bulletin, v. 109, p. 43-62.

page 13
Masoud, A., Koike, K.,2006, Tectonic architecture through Landsat-7 ETM+/SRTM DEM-derived lineaments and relationship to the hydrogeologic setting in Siwa region, NW Egypt: Journal of African Earth Sciences, v. 45, p. 467-477. McBride, E. F., Abdel-Wahab, Antar and El-Younsy, Ahmed R. M., 1999, Origin of spheroidal chert nodules, Drunka Formation (Lower Eocene), Egypt: Sedimentology, v. 46, p. 733-755. McCauley, John F., Breed, Carol S., Issawi, Bahay, Schaber, Gerald G., El-Hinnawi, Mohammed, and El-Kelani, Ali, 1997, Spaceborne imaging radar (SIR) geologic results in Egypt, a review: 1982-1997: Proceedings of the Geological Survey of Egypt Centennial Conference, p. 489-527. Meshref, W.M., 1990, Tectonic framework, in Said, R., ed., The geology of Egypt: Netherlands, A.A. Balkema : Rotterdam, Netherlands, p. 113-156. Rashed, M. A., Sediek, K. N.,1997, Petrography, diagenesis and geotechnical properties of the El-Rufuf Formation (Thebes Group), El-Kharga Oasis, Egypt: Journal of African Earth Sciences, v. 25, p. 407-423. Said, R., ed., The geology of Egypt: Netherlands, A.A. Balkema : Rotterdam, Netherlands, p. 451-486. Stern, Robert J., Abdel Salam, Mohamed G.,1996, The origin of the great bend of the Nile from SIR-C/X-SAR imagery: Science, v. 274, p. 1696-1698. Tewksbury, Barbara, Dokmak, Asmaa, Tarabees, Elhamy, Mansour, Ahmed Sadek M., and Rashed, Mohamed A., 2011a, A previously unrecognized system of folds and related faults in Stable Platform limestones of the El Rufuf and Drunka Foramtions, Western Desert, Egypt: Geological Society of America, Abstracts with Programs, v. 42, no. 7. Tewksbury, Barbara, Kattenhorn, Simon, Sayler, Frances, Tewksbury-Christle, Carolyn, and Saint-Jacques, David, 2011b, Polygonal patterns and desert eyes: reconnaissance satellite image study of fold and fault structures in Late Cretaceous and Early Tertiary limestones of the Western Desert, Egypt: Geological Society of America, Abstracts with Programs, v. 42, no. 7. Tewksbury, Barbara J., Hogan, John P. Kemp, Stephen M., Keren, Tucker T., Tewksbury-Christle, Carolyn M., Schultz, Richard A., and Mehrtens, Charlotte, 2010, Deformation bands and the expression in siliciclastic cover rocks of slip on basement faults in southern Egypt: : Geological Society of America, Abstracts with Programs, v. 41, no. 7. Tewksbury, Barbara J., Abdelsalam, Mohamed G., Tewksbury-Christle, Carolyn M., Hogan, John P., Pandey, Anoop R., and Jerris, Thomas J, 2009, Reconnaissance study of domes and basins in Tertiary sedimentary rocks in the Western Desert of Egypt using high resolution satellite imagery: Geological Society of America, Abstracts with Programs, v. 40, no. 7. Whitmeyer, Steven J., Nicoletti, Jeremy, and De Paor, Declan G., 2010, The digital revolution in geologic mapping: GSA Today, v. 20, issue 4, p. 4-10. Youssef, M. M., 2003, Structural setting of central and South Egypt; an overview: Micropaleontology, v. 49, Suppl. 1, p. 1-13.

page 14
Figure captions Figure 1: a) A portion of our study area at highest Landsat resolution, with an inset showing the 15-meter pixels of the Landsat ETM panchromatic band. The dark diagonal line at far left is the Asyut-El Kharga Road. b) The same area as Figure 1a but in Google Earth with Digital Globe imagery. The inset shows the same area as the inset in Figure 1a. Features that are enigmatic at best at Landsat resolution are mappable in Google Earth where imagery has resolution of ~1m/pixel. The red outline shows the area in Figures 9a and b. c) Digital Globe imagery in Google Earth at ~1 m/pixel (left side of image capture) allows analysis of small-scale features that remain enigmatic even in SPOT imagery at ~3 m/pixel (right side of image capture). Image centers: N26.264758, E30.718018 (a and b); N26.279837, E30.801195 (c). Figure 2: a) Outline maps of Egypt and California at the same scale. The Egypt map shows our study area (red star) in the Western Desert. The general boundary between the Stable Platform and the Syrian Arc Mobile Belt is based on Bosworth et al., 1999 (also referred to as the Stable vs. Unstable Shelf, e.g., Meshref, 1990; Youssef, 2003). b) Google Earth image of our main study area and surrounding region, which is bisected by the Asyut-El Kharga Road. Surface materials in the Google Earth satellite imagery range in color from white to pale brown. c) A portion of the 1:500,000 Asyut Sheet of the Geological Map of Egypt (Klitzsch et al., 1987) covering the same area as the Google Earth image in 2b. The contact between the Eocene El Rufuf Formation and the younger Drunka Formation is clearly visible in the Google Earth imagery in Figure 2b as a change in color from white to pale brown. Solid and dashed black lines on the geologic map are lineaments based on Landsat MSS imagery. Image centers: N26.229491, E30.810484 (b & c). Figure 3: a) In high resolution imagery in Google Earth, the outcrop trace of the contact between the El Rufuf Formation (white) and the Drunka Formation (pale brown) displays a complex pattern. The location box for this figure is shown in Figures 2b and c. b) Landsat ETM panchromatic imagery (15 m/pixel) does not have high enough resolution to resolve the nature of the complexity of the outcrop trace. c) Imagery in Google Earth has high enough resolution to show that the elongate pale brown patches of the Drunka Formation lie in the keels of narrow, open, WNW-ESE trending synclines (Tewksbury et al., 2009). d) View in Google Earth looking ESE along the main synclinal keel in Figure 3c. Image centers: N26.169381, E30.850278 (a); N26.163600, E30.848134 (b & c); N26.163840, E30.853516 (d) Figure 4: a) The flatirons on the flank of this whaleback anticline in the Zagros Mountains are typical of those in areas of moderate to steep dips and significant topographic relief. b) Mini-flatirons occur in areas of shallowly dipping sedimentary layers and low topographic relief in the Western Desert. Despite the fact that these flatirons are one to two orders of magnitude smaller than those typically seen in mountainous regions, they serve as good dip indicators in the Western Desert. Image centers: N27.455276, E55.562232 (a); N26.238550, E31.004897 (b). Figure 5: a and b) Subtle differences in erosional resistance allow determination of dip direction in our bedrock layers despite the fact that both topographic relief and dip are low. Features include mini-flatirons and scalloped ridges with down-dip Vs in wadis and differences in brightness of scarps and dip slopes depending on dip direction. c) This small eye-shaped structure has mini-flatirons, a scarp shadow, and bright dip slopes on the north side, and bright scarps and somewhat shadowed dip slopes on the south side, indicating inward dips in a very small, elongate, and slightly cuspate basin. d) South-dipping layers showing ragged and irregular traces of lower contacts and straight traces of upper contacts. Image centers: N26.276515, E31.032348 (c); N26.293425, E30.688310 (d).

page 15
Figure 6: a) For mapping in Google Earth, we established a stratigraphy consisting of one subunit in the El-Rufuf Formation and eight subunits in the Drunka Formation. The top legend and images b-d show the characteristics of the three different surface types that define these subunits, and the stratigraphic column shows the order of the subunits. The bottom legend shows ground truth information on each of the unit types, which are pictured in the field in Figure 8. b) Google Earth image showing Unit 1 (one of the white units with prominent yardangs), and Unit 2 (one of the thin, pale brown resistant units). Arrows point to tan and dark gray surficial deposits (which we did not map) that reflect prevailing wind direction. c) Google Earth close-up showing the speckled texture of units 2 (also characteristic of unit 4). d) Google Earth image showing Units 3, 6, and 8 (white units), Unit 4 (a pale brown unit), and Units 5, 7, and 9 (gray-brown units). Image centers: b) N26.283681, E30.744191 (b); N26.311928, E31.101309 (c); N26.293425, E30.688310 (d). Figure 7: a) The Google Earth image of our map area shows prominent broad NS trends in color patterning and a finer-scale WNW-ESE “stripiness”. b) A generalized geologic map, which shows only main structures and contacts, illustrates that the broad NS patterning results primarily from broad, open anticlinal and synclinal structures that repeat the stratigraphy, with faults becoming more prominent to the south. See Figure 6 for the stratigraphic column. c) A more detailed geologic map of a portion of the area reveals that the WNW-ESE patterning is due to dozens of narrow, open synclines and broader anticlines. Image centers: N26.325800, E30.721515 (a and b); N26.357718, E30.778587 (c). Figure 8: a) The white rock unit in the field is a dense, white, crystalline limestone occurring as both low, wind-fluted outcrops (inset, foreground) and as yardangs (inset, background). The main image shows a thin, shallowly dipping layer of the Unit 3 white limestone and a line of large concretions marking the outcrop of dipping Unit 4 in the middle distance. b) The speckled pale brown unit in the field is a pale buff, slightly purplish, siliceous limestone with large concretions up to 1 m or more in diameter. In the main image, the people are walking on a dip slope in Unit 2. The middle distance shows yardangs in the white rock of the underlying Unit 1, and the far distance shows resistant Unit 2 holding up the near rim of an elongate, open basin trending parallel to the plane of the photograph. The inset photo shows a close-up of the large concretions weathered out of Unit 2 (on the skyline) and accumulating at the base of the slope on top of the white limestone of Unit 1 (foreground). c) The gray-brown unit turned out in the field to be a surficial deposit consisting of abundant chert fragments coated with dark desert varnish. Rare outcrops of pale buff, fissile limestone suggest that the chert lag deposit blankets a largely non-resistant sequence in the stratigraphy. White limestone of Unit 6 appears at the left in the main image. Figure 9: a) Preliminary mapping in Google Earth defined stratigraphy and structure and allowed us to choose target areas (brown stars) to ground truth both the mapping units and the structures. b) Despite the fact that our gray-brown mapping unit turned out to be a surficial deposit, it still proved useful in mapping where it was confined between the outcrop areas of two adjacent bedrock units, as in the area circled in the center of Figure 9b. Where the dark lag deposit has been redistributed by past sheetwash and fluvial activity, it is not a good proxy for an underlying non-resistant bedrock layer and helps explain why both structure and stratigraphy are impossible to map in areas such as that circled at the left of Figure 9b. Image center: N26.265632, E30.716359. Figure 10: The three terrain types in the study area conspire against a geologist on the ground noticing the structures that we mapped easily in Google Earth. a) Bedding is difficult to see in wind-sculpted yardangs in the massive white limestone. b) Open fold structures several 100 m

page 16
across are almost impossible to see in the vast, flat expanses of desert pavement with irregular, very low exposures of wind-fluted white limestone. In this image, the dark patch in the middle distance cores an elongate structural basin about 200 m wide and 600 m long. Dips in the limestones in the foreground toward the center of the basin are almost impossible to see because of wind fluting that cuts across bedding. c) Concretions up to 1 meter across, such as these at the Valley of the Watermelons, occur both on bedding surfaces and on surfaces that cut subtly across bedding where weathering and erosion has released resistant concretions from overlying layers. Figure 11: The prominent dome structure shown in Figure 9a lies in an area with essentially no topographic relief. This photograph was taken at the large red star in Figure 9a and shows that, although the dome shows up spectacularly well in Google Earth, it is essentially impossible to see from the ground, let alone from the Asyut-El Kharga Road, which lies less than 250 m away. The two small black specks (circled) on the skyline in the left hand part of the photo are two vehicles on the road.
250 m
250 m
100 m
b
Figs. 9 a & b
a
c
N
N
N
DigitalGlobe
SPOT
15 m/pixel
~1 m/pixel
Figure 1

Sierra Nevada Mts.
200 km
Stable Platform
Syrian Arc Mobile Belt
a
N
StudyArea
Cairo
AsyutFarafra
ElKharga
Aswan
Nile River
Western Desertroads
WesternDesert
minor WesternDesert roads
GooglePlex
area of Fig. 3a
contact
Drunka Formation
El Rufuf Formation area of Figs. 3b & c
c
10 km
b
Asyut - El Kharga Road
area of Fig. 3a
area of Figs.3b & c
main study areaand area of Fig. 7 main study area
and area of Fig. 7
N N
contact
26.24N, 34.20E
22.02N, 31.35E
Figure 2

3 km
N
500 m
N
500 m
N
a b
c d
area ofFigs. 3b & c
view inFig. 3d
Figure 3

a
10 m
75 m
Nb
Figure 4

flatiron
flatiron
100 m
d Noutcrop traces ofbottom contacts
outcrop tracesof top contacts
a Sundip slopes are broadly and evenly illuminated
scarps are sharply shadowed
Sundip slopes are diffuse and less bright; (may even be a bit shadowed, depending on dip& sun angle)
scarps are sharp and brightly lit
b
N
100 m
a
b
Figure 5

white unit
pale brown unit with speckled texture
gray-brown unit
massive white limestone
pale buff limestone with large chert shell
concretions
non-resistant, fissile limestone largely
mantled by lag deposit of dark, desert-varnished
chert pebbles
Units for Mapping in Google Earth
Units with Ground Truth Added
N
400 m
d
N
100 m
b
1
2
3
4
5
6
7
8
9
Dru
nk
a F
orm
ati
on
El
Ruf
ufF
m.
a
1
2
34 5
67
8 9
c
2
15 m
Nc
surficial deposits
Figure 6

4 km
N
N
3
El Rufuf - Drunka contact
subunit contact within Drunka Fm.
fault
anticlinal axial surface trace
synclinal axial surface trace
map unit number (see stratigraphic column in Fig. 6)
Legend
N
N
1
4 km
2
34
4
4
5-8
3
2
1
9
5-8
5-8
9
4
5-8
99
500 m
a b
c
Figure 7

a
b
c
Figure 8
180 m
NAsyut – El Kharga Road
Fig. 11
180 m
N
gray-brown map unit is a good proxy for underlying non-resistant bedrock
gray-brown map unit is NOT a good proxy for underlying non-resistant bedrock
a
b
Figure 9

a
b
c
Figure 10

Figure 11