information note to the press (press release no /2009)
TRANSCRIPT

Page 1 of 10
Information Note to the Press (Press Release No.39/2021)
TELECOM REGULATORY AUTHORITY OF INDIA
New Delhi, the 27th August, 2021
For Immediate release Website: - www.trai.gov.in
“Indian Telecom Services Performance Indicator Report” for the
Quarter ending January-March, 2021
TRAI today has released the “Indian Telecom Services Performance Indicator
Report” for the Quarter ending 31st March, 2021. This Report provides a broad
perspective of the Telecom Services in India and presents the key parameters and
growth trends of the Telecom Services as well as Cable TV, DTH & Radio
Broadcasting services in India for the period covering 1st January, 2021 to 31st
March, 2021 compiled mainly on the basis of information furnished by the
Service Providers.
Executive Summary of the Report is enclosed. The complete Report is available
on TRAI’s website (www.trai.gov.in under the link http://www.
trai.gov.in/release-publication/reports/performance-indicators-reports). Any
suggestion or any clarification pertaining to this report, Shri M.P. Tangirala, Pr.
Advisor (F&EA), TRAI may be contacted on Tel. +91-11-23221856, Fax. +91-11-
23235249 and e-mail: [email protected].
(V. Raghunandan) Secretary, TRAI

Page 2 of 10
The Indian Telecom Services Performance Indicators
January–March, 2021
Executive Summary
1. The number of telephone subscribers in India increased from 1,173.83
million at the end of Dec-20 to 1,201.20 million at the end of Mar-21,
registering a growth rate of 2.33% over the previous quarter. This reflects
Year-On-Year (Y-O-Y) growth rate of 1.97% over the same quarter of the
last year. The overall Tele-density in India also increased from 86.38% as
in QE Dec-20 to 88.17% as in QE Mar-21.
Trends in Telephone subscribers and Tele-density in India
2. Telephone subscribers in Urban areas increased from 647.91 million at the
end of Dec-20 to 663.77 million at the end of Mar-21 and Urban Tele-
density also increased from 138.34% to 141.03% during the same period.
3. Rural telephone subscribers increased from 525.92 million at the end of
Dec-20 to 537.42 million at the end of Mar-21 and Rural Tele-density also
increased from 59.05% to 60.27% during the same period.

Page 3 of 10
4. Out of the total subscription, the share of Rural subscription decreased
from 44.80% at the end of Dec-20 to 44.74% at the end of Mar-21.
Composition of Telephone Subscribers
5. With a net increase of 27.18 million subscribers during the quarter, the
total wireless subscriber base increased from 1,153.77 million at the end of
Dec-20 to 1,180.96 million at the end of Mar-21, registering a growth rate
of 2.36% over the previous quarter. On Y-O-Y basis, wireless subscriptions
also increased at the rate of 2% during the year.
6. Wireless Tele-density increased from 84.90% at the end of Dec-20 to
86.68% at the end of Mar-21 with quarterly growth rate of 2.10%.
7. Wireline subscribers increased from 20.05 million at the end of Dec-20 to
20.24 million at the end of Mar-21 with a quarterly growth rate of 0.94%
and, on Y-O-Y basis, wireline subscriptions also increased by 0.11% at the
end of QE Mar-21.

Page 4 of 10
8. Wireline Tele-density increased from 1.48% at the end of Dec-20 to 1.49%
at the end of Mar-21 with quarterly growth rate of 0.68%.
9. Total number of Internet1 subscribers increased from 795.18 million at the
end of Dec-20 to 825.30 million at the end of
Mar-21, registering a quarterly growth rate of 3.79%. Out of 825.30 million
internet subscribers, number of Wired Internet subscribers are 26 million
and number of Wireless Internet subscribers are 799.31 million.
Composition of internet subscription
10. The Internet subscriber base is comprised of Broadband2 Internet
subscriber base of 778.09 million and Narrowband3 Internet subscriber
base of 47.21 million.
1 Internet: Interconnected global networks that use the internet protocol. 2 Broadband: Internet access with a minimum capacity of greater or equal 512 Kbit/s in one or both directions. 3 Narrowband: Internet access with a capacity of less than 512 Kbit/s in one or both directions.
(Source-ITU)

Page 5 of 10
11. The broadband Internet subscriber base increased by 4.11% from 747.41
million at the end of Dec-20 to 778.09 million at the end of Mar-21.
However, the narrowband Internet subscriber base declined by 1.18% from
47.77 million at the end of Dec-20 to 47.21 million at the end of Mar-21.
12. Monthly Average Revenue per User (ARPU)4 for wireless service increased
by 1.90%, from Rs.101.65 in QE Dec-20 to Rs.103.58 in QE Mar-21. On Y-
O-Y basis, monthly ARPU for wireless service increased by 13.21% in this
quarter.
13. Prepaid ARPU per month increased from to Rs.95 in QE Dec-20 to Rs.97 in
QE Mar-21, however, Postpaid ARPU per month decreased from Rs.227 in
QE Dec-20 to Rs.226 in QE Mar-21.
14. On all India average, the overall Minutes of Usage (MOU)5 per subscriber
per month for wireless service increased by 4.12% from 785 in QE Dec-20
to 818 in QE Mar-21.
15. Prepaid MOU per subscriber per month increased from 793 in QE Dec-20
to 829 in QE Mar-21. Postpaid MOU per subscriber per month decreased
from 631 in QE Dec-20 to 597 in QE Mar-21.
16. Gross Revenue6 (GR) and Adjusted Gross Revenue7 (AGR) of Telecom
Service Sector for the Q.E. Mar-21 has been Rs.66,784 Crore and
4 ARPU per month is calculated by dividing net subscribers’ revenue by average number of subscribers. 5 MOU per subscriber per month is calculated by dividing total minutes of usage (incoming & outgoing) by average
number of subscribers. 6 Gross Revenue is inclusive of installation charges, late fees, sale proceeds of handsets (or any other terminal
equipment etc.), revenue on account of interest, dividend, value added services, supplementary services, access or
interconnection charges, roaming charges, revenue from permissible sharing of infrastructure and any other
miscellaneous revenue, without any set-off for related item of expense etc. 7 Adjusted Gross Revenue: The following shall be excluded from the Gross Revenue to arrive at the AGR:
I. PSTN related call charges (Access Charges) actually paid to other eligible/entitled telecommunication service
providers within India;
II. Roaming revenues actually passed on to other eligible/entitled telecommunication service providers; and
III. Service Tax on provision of service and Sales Tax actually paid to the Government if gross revenue had included
as component of Sales Tax and Service Tax

Page 6 of 10
Rs.48,587 Crore respectively. GR decreased by 6.17% and AGR increased
by 2.03% in Q.E. Mar-21, as compared to previous quarter.
17. The Y-O-Y growth in GR and AGR in Q.E. Mar-21 over the same quarter in
last year has been -1.11% and 8.12% respectively.
18. Pass-through8 charges decreased from Rs.23,966 Crore in QE Dec-20 to
Rs.18,196 Crore in QE Mar-21 with quarterly decline rate of 24.07%. The
Y-O-Y decline rate of 19.46% has been recorded in pass-through charges
for QE Mar-21.
19. The License Fee9 increased from Rs.3,809 Crore for the QE Dec-20 to
Rs.3,979 Crore for the QE Mar-21. The quarterly and the Y-O-Y growth
rates of license fee are 4.44% and 10.40% respectively in this quarter.
Service-wise composition of Adjusted Gross Revenue
8 Pass through charges means the charges excluded from gross revenue to arrive at adjusted gross revenue for the
purpose of levying licence fee.
9 License Fee means a fee payable by Licensee at prescribed intervals and rates for the period of the Licence.
Page 7 of 10
20. Access services contributed 79.46% of the total Adjusted Gross Revenue of
telecom services. In Access services, Gross Revenue (GR), Adjusted Gross
Revenue (AGR), License Fee Spectrum Usage Charges (SUC)10 and Pass
Through Charges increased by -5.99%, 0.88%, 3.12%, 0.14% and -23.06%
respectively in QE Mar-21.
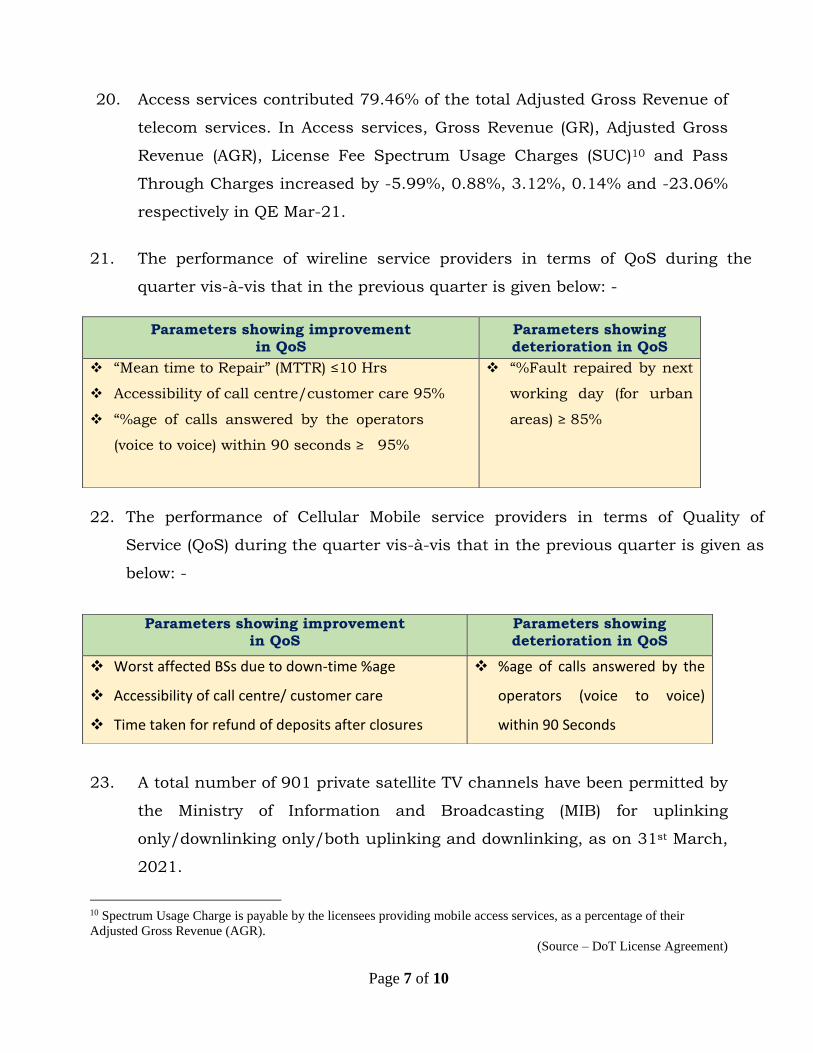
21. The performance of wireline service providers in terms of QoS during the
quarter vis-à-vis that in the previous quarter is given below: -
22. The performance of Cellular Mobile service providers in terms of Quality of
Service (QoS) during the quarter vis-à-vis that in the previous quarter is given as
below: -
23. A total number of 901 private satellite TV channels have been permitted by
the Ministry of Information and Broadcasting (MIB) for uplinking
only/downlinking only/both uplinking and downlinking, as on 31st March,
2021.
10 Spectrum Usage Charge is payable by the licensees providing mobile access services, as a percentage of their
Adjusted Gross Revenue (AGR).
(Source – DoT License Agreement)
Parameters showing improvement
in QoS
Parameters showing
deterioration in QoS
❖ “Mean time to Repair” (MTTR) ≤10 Hrs
❖ Accessibility of call centre/customer care 95%
❖ “%age of calls answered by the operators
(voice to voice) within 90 seconds ≥ 95%
❖ “%Fault repaired by next
working day (for urban
areas) ≥ 85%
Parameters showing improvement in QoS
Parameters showing deterioration in QoS
❖ Worst affected BSs due to down-time %age
❖ Accessibility of call centre/ customer care
❖ Time taken for refund of deposits after closures
❖ %age of calls answered by the
operators (voice to voice)
within 90 Seconds

Page 8 of 10
24. As per the reporting done by broadcasters in pursuance of the
Telecommunication (Broadcasting and Cable) Services (Eighth)
(Addressable Systems) Tariff Order, 2017 dated 3rd March 2017, as
amended, there are 327 satellite pay channels as on 31st March 2021,
which include 235 SD (standard definition) satellite pay TV channels and
92 HD (high definition) satellite Pay TV channels.
25. Since the introduction of DTH Sector in the year 2003, Indian DTH (direct-
to-home) services have displayed a phenomenal growth. During the QE 31st
March 2021, there were 4 pay DTH service providers in the country.
26. Pay DTH has attained total active subscriber base of around
69.57 million in QE 31st March 2021. This is in addition the subscribers of
DTH Free Dish (free DTH services of Doordarshan).
27. Apart from the radio stations operated by All India Radio – the public
broadcaster, as on 31st March 2021, there are 366 operational private FM
Radio stations in 105 cities with operational 30 Private FM Radio
broadcasters.
28. The reported advertisement revenue during the quarter ending 31st March
2021 in respect of 365 private FM Radio stations is Rs.321.52 crore as
against Rs.323.01 crore in respect of 366 private FM Radio stations for the
previous quarter.
29. As per data received from MIB, as on 31st March 2021, 324 Community
Radio Stations are operational in the country.

Page 9 of 10
SNAPSHOT
(Data as on Q.E. 31st March, 2021)
Telecom Subscribers (Wireless+Wireline)
Total Subscribers 1,201.20 Million
% change over the previous quarter 2.33%
Urban Subscribers 663.77 Million
Rural Subscribers 537.42 Million
Market share of Private Operators 89.05%
Market share of PSU Operators 10.95%
Tele-density 88.17%
Urban Tele-density 141.03%
Rural Tele-density 60.27%
Wireless Subscribers
Total Wireless Subscribers 1,180.96 Million
% change over the previous quarter 2.36%
Urban Subscribers 645.20 Million
Rural Subscribers 535.75 Million
Market share of Private Operators 89.68%
Market share of PSU Operators 10.32%
Tele-density 86.68%
Urban Tele-density 137.08%
Rural Tele-density 60.08%
Total Wireless Data Usage during the quarter 27,799 PB
Number of Public Mobile Radio Trunk Services (PMRTS) 64,175
Number of Very Small Aperture Terminals (VSAT) 2,93,632
Wireline Subscribers
Total Wireline Subscribers 20.24 Million
% change over the previous quarter 0.94%
Urban Subscribers 18.57 Million
Rural Subscribers 1.67 Million
Market share of PSU Operators 47.20%
Market share of Private Operators 52.80%
Tele-density 1.49%
Rural Tele-density 0.19%
Urban Tele-density 3.95%
No. of Village Public Telephones (VPT) 68,606
No. of Public Call Office (PCO) 126,108

Page 10 of 10
Telecom Financial Data
Gross Revenue (GR) during the quarter Rs.66,784 Crore
% change in GR over the previous quarter -6.71%
Adjusted Gross Revenue (AGR) during the quarter Rs.48,587 Crore
% change in AGR over the previous quarter 2.03%
Share of Public sector undertakings in Access AGR 5.93%
Internet/Broadband Subscribers
Total Internet Subscribers 825.30 Million
% change over previous quarter 3.79%
Narrowband subscribers 47.21 Million
Broadband subscribers
778.09 Million
Wired Internet Subscribers 25.99 Million
Wireless Internet Subscribers 799.30 Million
Urban Internet Subscribers 502.53 Million
Rural Internet Subscribers 322.77 Million
M Total Internet Subscribers per 100 population 60.73
Urban Internet Subscribers per 100 population 107.30
Rural Internet Subscribers per 100 population 36.24
Broadcasting & Cable Services
Number of private satellite TV channels permitted by the Ministry of I&B for uplinking only/downlinking only/both uplinking and downlinking
901
Number of Pay TV Channels as reported by broadcasters 327
Number of private FM Radio Stations (excluding All India Radio) 366
Number of total active subscribers with pay DTH operators
69.57 Million
Number of Operational Community Radio Stations 324
Number of pay DTH Operators 4
Revenue & Usage Parameters
Monthly ARPU of Wireless Service Rs.103.58
Minutes of Usage (MOU) per subscriber per month - Wireless Service 818 Minutes
Total Outgoing Minutes of Usage for Internet Telephony 174.89 Million
Wireless Data Usage Average Wireless Data Usage per wireless data subscriber per month
12.33 GB
Average revenue realization per subscriber per GB wireless data during the quarter
Rs.10.77