plantwatch 2009-3 new colors 5(s) - naturewatch · cornus canadensis bunchberry ranunculus...
TRANSCRIPT

79
www.PlantWatch.ca
Appendices

www.PlantWatch.ca

Appendices
81
PlantWatch Species
Appendix 1
Latin name Common name NL NS PEI NB QC ON MB SK AB BC YK NWT NU
Populus tremuloides Aspen Poplar
Arctostaphylos uva-ursi Bearberry
Galium boreale Bedstraw, northern
Betula papyrifera/neoalaskana Birch, paper
Houstonia caerulea Bluets
Cornus canadensis Bunchberry
Ranunculus glaberrimus Buttercup, sagebrush
Prunus virginiana Choke cherry
Clintonia borealis Clintonia, blue-bead lily
Rubus chamaemorus Cloudberry, bakeapple
Tussilago farfara Coltsfoot
Vaccinium vitis-idaea Cranberry (partridge berry, lingonberry)
Taraxacum offi cinale Dandelion
Forsythia suspensa Forsythia, weeping
Thermopsis rhombifolia Golden bean
Ledum/Rhododendron groenlandicum/decumbens Labrador Tea
Syringa vulgaris Lilac, Common Purple
Lupinus arcticus Lupine, arctic
Acer rubrum Maple, red
Epigaea repens Mayfl ower
Pinus contorta Pine, lodgepole
Anemone patens Prairie Crocus
Clintonia unifl ora Queen’s cup
Rhododendron canadense Rhodora
APPENDICES
82
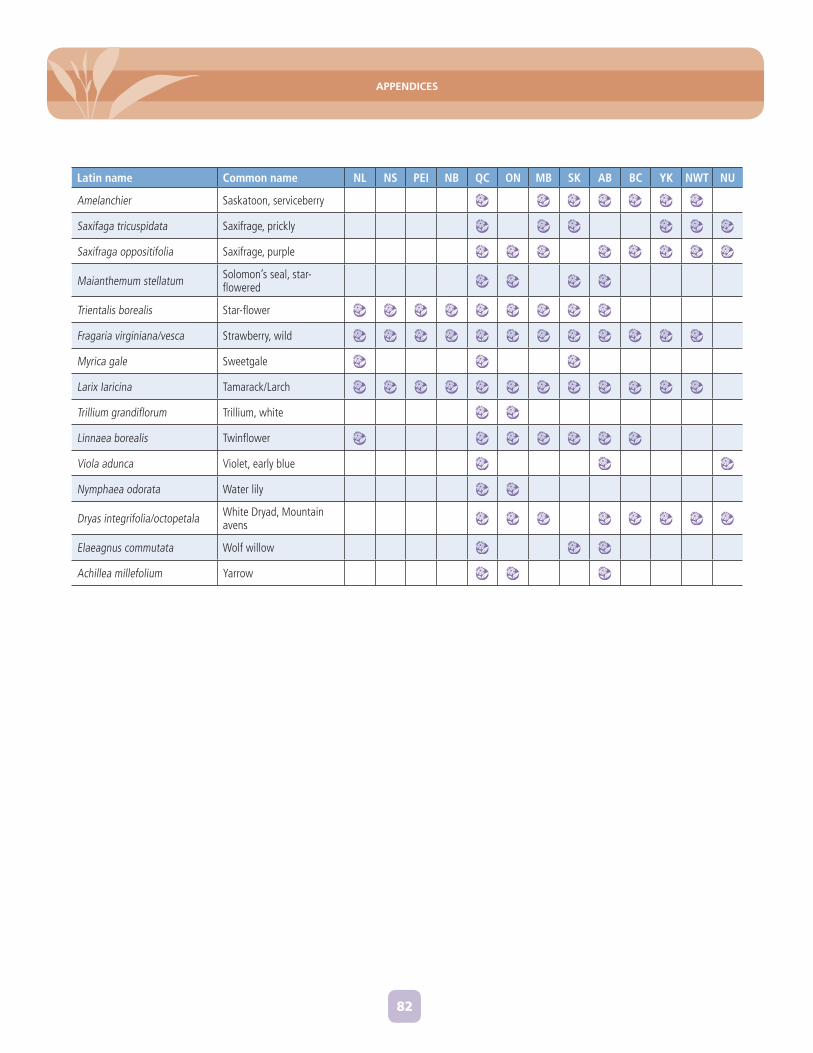
Latin name Common name NL NS PEI NB QC ON MB SK AB BC YK NWT NU
Amelanchier Saskatoon, serviceberry
Saxifaga tricuspidata Saxifrage, prickly
Saxifraga oppositifolia Saxifrage, purple
Maianthemum stellatum Solomon’s seal, star-fl owered
Trientalis borealis Star-fl ower
Fragaria virginiana/vesca Strawberry, wild
Myrica gale Sweetgale
Larix Iaricina Tamarack/Larch
Trillium grandifl orum Trillium, white
Linnaea borealis Twinfl ower
Viola adunca Violet, early blue
Nymphaea odorata Water lily
Dryas integrifolia/octopetala White Dryad, Mountain avens
Elaeagnus commutata Wolf willow
Achillea millefolium Yarrow

Appendices
83
Glossary
Appendix 2
Adaptation (to climate change) – Adaptation to climate change is any activity that reduces the negative impacts of climate change and/or takes advantage of new opportunities that may be presented
Alpine – High mountain regions, above the tree line
Alternate – Arrangement of leaves in which successive leaves arise at different levels on opposite sides of the stem (see also: “Opposite”)
Ament – See “Catkin”
Anther – The pollen-producing structures, borne at the tip of a fi lament in male fl ower parts (stamens) (See fl ower diagram on page 87.)
Basal – Located at the base of a plant or plant organ
Beaked – Ending in a prolonged tip that resembles a beak
Blade – The whole green leaf, without the petiole or leaf stalk
Boreal Forest – The mainly coniferous or evergreen forest that covers much of Canada’s northern regions
Bract – A small leaf beneath a fl ower or another plant organ
Bud Scale – A small, modifi ed leaf that covers the bud
Capsule – A dry fruit that releases seed through slits or pores
Carpel – The leaf-like organ of a fl ower that encloses one or more ovules (see “Pistil”)
Catkin – A highly condensed cluster of (usually) unisexual fl owers that lack petals
Circumpolar – A large region around either the North or South Pole; can refer to a plant that is distributed around the globe in northern regions
Clone – A stand or group of plants of one type (all have identical genetic material)
Cluster – A tightly packed group of fl owers
Colony – A group of plants that all have the same genetic material
Conifer – Belonging to the order Coniferales, these plants are mostly evergreen with cones and narrow, pointed, often needle-like leaves. Pine, larch, spruce, fi r and cedar are all conifers. Larch is the only one which is not evergreen; it sheds its needles annually.
Creeping – Growing along or near the surface of the ground
Cross-pollination – The process by which pollen is carried from the stamens of one plant to the stigmatic surface of another plant (compare with Self-fertilization)
Crown Division – Propagation technique where the base of a plant is divided into sections
Cultivar – A uniform group of cultivated plants obtained by breeding or selection, and propagated as a pure line
Day Neutral – When a plant’s seasonal changes do not depend on how many hours of sunlight the plant receives

APPENDICES
84
Deciduous – Falling off at the end of the growing season
Dormancy – Lack of plant growth during unfavourable environmental conditions
Dormant – For cells, buds, seeds, etc., the period before growth begins
Ecology – The science of the interrelationship of organisms and their environment
Elaiosome – Oily appendage of a seed (can be an “ant-snack”)
Ethnobotany – The study of the relationships between plants and people
Evergreen – Plants whose leaves remain green throughout the winter
Female Tree – Trees that produce only female fl owers (these fl owers are imperfect since they have one sex only; pistillate)
Filament – The stalk on which anthers are borne; anthers plus fi lament forms a stamen, the male part of a fl ower (See fl ower diagram on page 87.)
Fire-successional – Plants that are adapted to the environments present after wildfi re
Floret – Individual fl ower in a cluster
Flower Bud – Undeveloped fl ower
Flower Stem – The stalk by which a fl ower is attached to the rest of the plant (also called a peduncle)
Flowering Sac – See “Pollen Sac”
Foliage – Leaves
Forb – A term used in botany to refer to plants – many wildfl owers, for example – that do not fi t into other classes like trees, shrubs or grasses. Generally, a forb is a broad-leaved, non-woody plant that dies back to the ground at the end of every growing season.
Fungi – A group of non-photosynthetic organisms with chitinous walls that feed on organic matter (includes mushrooms)
Fungal Partners – Many plants have an important underground relationship with fungi; these organisms are known as fungal partners (symbionts)
Genetic Mutations – Changes in the hereditary information carried by an organism
Genetic Variation – The genetic differences between individuals of the same species
Germination – The fi rst stage in the growth of a seed into a seedling
Glandular – A plant organ (e.g. leaf, stem) that possess specialized cells that secrete chemical substances
Graft(ed) – The joining of two separate plant parts, like root and stem, or a branch from one plant to a branch from another, so that they can regenerate and grow as one plant
Growing Degree Summation (GDS) – A way to measure the warmth to which a plant has been exposed. The GDS is calculated by summing average daily temperatures for a given time period.
Habitat – The natural home of an organism
Hair – Hair-like structures, also known as trichomes, that are attached to many plant parts
Hardwood Cuttings – Cuttings taken from older woody tissues of hardwood trees, used for plant propagation. Cuttings are usually taken in the winter from dormant plant parts (see “Dormant”).
Hardy – Plants adapted to cold or otherwise adverse conditions
Heat Unit – Temperature affects the rate of plant growth. The amount of accumulated temperature a plant has been exposed to in spring time can be measured in heat units. It is measured through growing degree summation.
Hermaphroditic – Plants that have fl owers with male and female parts (see “Perfect Flowers”)
Horticulture – The science of garden cultivation
Hybrid Vigour – The condition of a hybrid that is fi tter than either of its parents
Hybridize – The process by which two plants with different genetic material produce offspring
Hydratode – Pore in the surface of a leaf through which minerals are extruded
APPENDICES
85
Indicator Plant – In phenology studies, a plant useful as a “biological measuring stick,” i.e. its growth occurs in response to a combination of weather and environmental factors, and certain growth phases are easily defi ned and recognized
ITEX – International Tundra Experiment
Julian Calendar – Calendar that marks the days from January 1st onwards; i.e. January 30 = day 30 and February 28 = day 59
Leaf Pore – Small opening on the leaf surface
Lenticel – Small dot or spot on the bark of a young twig that allows gas exchange between the stem and the atmosphere
Life Cycle -The entire sequence of phases in the growth and development of any organism from birth to reproduction, maturity and death
Loam – Soil that has about equal proportions of sand, silt and clay
Male Tree – Trees that bear only male fl owers
Matted – Plants that grow in a very dense and fl at cluster, or mat
Microclimate – The climate of a small or limited space, e.g. the surface of the soil, or under the canopy of a small patch of forest.
Native plant – A plant that occurred in a particular area before the arrival of European settlers in North America (i.e. not introduced by settlers)
Nectar – A sugary liquid secreted by a fl ower’s nectaries
Node – The point on a stem from which a leaf grows; nodes are spaced along stems with internodes between them
Nodules (of a root) – Swollen areas of the root that contain a bacterial symbiont
Open Pollination – Pollination in which the source of pollen is unknown
Opposite – Arrangement of leaves in which each pair is at right angles to the pair above and below (see also “Alternate)
Ovary – Part of the female fl ower parts, located at the base of the pistil and containing ovules which can become seeds (See fl ower diagram on page 87.)
Ovule – Structure within the ovary containing an egg cell
Parkland – In the Canadian Prairie Provinces, Parkland is a transitional natural region between the prairies to the south and the boreal forest to the north. Patches of open meadows alternate with forest of largely poplar trees, with spruce trees on cool, north-facing slopes.
Perennial – Plants which grow and reproduce for many years, from the same roots. Perennial plants are usually woody.
Perfect Flowers – Flowers with male and female reproductive organs
Petals – Modifi ed leaves, usually the conspicuous, brightly coloured structures above the sepals in a fl ower (See fl ower diagram on page 87.)
Petiole – Stalk of a leaf
Phenology – Study of the seasonal timing of life cycle events, i.e. growth stages or changes in plants and animals
Photoperiod – the number of hours of light that a plant receives in a day.
Photosynthetic – An organism that uses light energy to produce food
Photosynthesis – The process by which plants, algae and some bacteria convert light energy into the chemical energy stored in sugars
Phyllody – Process in which petals and sepals revert to leaves
Pistil – A collective term for all the female fl ower parts: stigma, style and ovary (See fl ower diagram on page 87.)
Pollen – Powdery contents of the anthers; a single pollen grain produces a pollen tube and sperm, and fertilizes ovules contained in a plant’s ovary

APPENDICES
86
Pollen Sac – The pollen-containing sac of the anthers
Pollination – Process by which pollen is transferred from the male parts (stamen) to the female parts (stigma) of a fl ower
Polyploid – An organism with three or more sets of chromosomes
Ramets – A large number of clonal shoots
Respiration – Physiological process in plants and animals in which oxygen is consumed in the fi nal step of metabolizing sugars
Rhizome – A stem which grows horizontally in the soil, bearing buds from which shoots grow
Rootstock – Plant roots onto which shoots are grafted, in propagation
Root Cutting – Cutting taken from the roots, used in plant propagation
Runner – A long, slender branch that runs along the ground rooting at the nodes or tip (see “Node”)
Scale – Any small, thin fl at structure of a plant; a small outgrowth
Scree Slope – Mountain slope of small loose stones
Seed Capsule – Dry fruit that releases seed by way of pores or slits
Seed Head – A cluster of fruit or seeds
Seed Pod – General term for any dry fruit that opens to release seeds
Self-fertilize – Fertilization in which the pollen (sperm) and the ovary (egg) belong to the same individual. Compare with Cross-pollination.
Sepals – Modifi ed petal-like leaves, below the petals in a fl ower, often green and leaf-like (See fl ower diagram on page 87.)
Softwood Cutting – Cutting taken from emerging woody plant parts of softwood trees, used for propagation
Stamen – Collective term for male fl ower parts; includes fi laments and anthers (See fl ower diagram on page 87.)
Stigma – The receptive area of the pistil (top of the female fl ower part) where pollen lands or is deposited (See fl ower diagram on page 87.)
Stratifi cation – Process in which seed is placed in moist, cool soil to break dormancy
Stratifi cation Period – The amount of time required to break seed dormancy and start germination
Style – Central, tube-like region of the female fl ower parts (See fl ower diagram on page 87.)
Subalpine – Area in the higher mountain slopes just below the tree line and the alpine region
Succession – The process of development of vegetation involving changes of species and communities with time
Suckers – Shoots that arise from underground plant parts
Symbiont – An organism living in a relationship with another organism, where these two organisms live closely together for much or all of their lives, e.g. the fungi and algae in lichens
Tap Root – A large, vertical root arising from the main axis of the plant
Terminal – Applies to position of a structure borne at the tip of a plant stalk, leaf, etc.
Tundra – A treeless region of the Arctic or subarctic
Variety – A taxonomic group within a species or subspecies, i.e., a uniform group of plants that differs slightly from another group within the same species
Vegetative Reproduction – Process through which plants increase in number without fertilization
Whorl – A group of three or more plant parts arising from the same region (node) of the stem
Winged – Structure with a membranous expansion
Winter Buds – Buds present in winter

APPENDICES
87
PARTS OF A TYPICAL FLOWER
Reprinted with permission from Wildfl owers of the Canadian Rockies by G.W. Scotter and H. Flygare ©1986

Appendices
88
Map Sources for Canada
Appendix 3
For a regularly updated list of map sources for your territory or province, check the federal website:
maps.nrcan.gc.ca
and select Canadian topographic maps, map distributors, and then, regional distribution centres.

Appendices
89
Horticultural
Appendix 4
All words highlighted in blue can be found in the glossary (Appendix 2).
ESTABLISHING A PLANTWATCH GARDEN
Introduction
This guide will serve as a resource to teachers in the Plantwatch Program who are interested in learning more about the cultivation and growth requirements of these key indicator plants. Some participants may fi nd that their access to the plants in the wild state is limited (e.g., urban classrooms may fi nd it hard to fi nd white trilliums (eastern Canada) or prairie crocus (western Canada). One solution is for schools to create their own garden areas, using plants from the Plantwatch program and others that are native to their area. This approach not only provides special places in which to observe and record the timing of natural phenomenon such as plant fl owering, but also gives opportunities for creating wildlife habitat (for birds, butterfl ies, etc.) and increasing local biodiversity.
Students are able to observe daily the changes in the Plantwatch species and accurately report the fl owering stages. They will see fi rst hand the effect of weather events such as spring snow storms or frosts on their plants. Temperature records from the site or nearby will provide highly useful information on the amount of heat needed for fl owering. If students have access to the school grounds over the summer, they will see all stages of growth — from fi rst buds, to fl owers, to ripe fruit, as well as leaf colouring, and discover some of the insect partners that these plants attract.
Creating garden spaces in communities need not be an overwhelming task, if all the factors are considered.
The benefi ts of such a project go far beyond the project itself, as communities become involved with the land, its rhythms and its diversity. Natural areas offer a rich learning environment that can lead directly to a stronger environmental ethic for all who become involved.
Creating Garden Spaces
Individuals, communities or schools considering the creation of school garden spaces need to ask themselves some important questions. Assistance in answering these questions can be obtained from many sources individuals, organizations and printed materials.
1. What is the purpose of the garden space? Are you going to just plant certain Plantwatch species for observation, or are you going to expand your garden area to include other native plant species?
2. Is there a plan in place? Does the plan include a budget, a realistic time line, use of the expertise of other people who have initiated such garden spaces, and opportunities for learning about the plants and their requirements?
3. Has an appropriate site been located, taking into account the soils, topography and present condition of the land, along with the requirements of the plant communities you’d like to establish? If possible, sites should be located at least 3 m-5 m (10 - 15 ft.) away from buildings (to avoid hot microclimates that will affect bloom timing), and away from sidewalks or roads. Consideration

APPENDICES
90
should also be given to ease of watering, and ways in which the site can be protected from students’ outdoor play activities.
4. What kind of site preparation considerations are there? Proper cultivation of an area, to control weed growth, is necessary prior to the planting of a garden. The soil should be well packed with rollers before seeding, and have appropriate soil amendments added before planting live plants. Because native plants are well adapted to low fertility, they do not require heavy fertilization (which may only encourage the growth of weedy, non-native species). Avoid using herbicides as they pose a threat to valuable soil organisms and also threaten the health of children, pets, and living things in nearby rivers and lakes.
5. What species are you going to plant? For certain Plantwatch species, see section B following: “How to Grow the Plantwatch Species.”
6. What planting methods are you going to use? The methods will vary, depending on whether you are working with seeds or live plant material. Things to consider would include best dates for planting and any special techniques for specifi c plants.
7. What kinds of long-term management strategies do you need to consider? Young shrubs of saskatoon and lilac may take three to four years before they begin fl owering. How will you maintain weed control – by hand or mowing? Keep in mind that drought-adapted species such as saskatoon, prairie crocus, or white dryad should not be overwatered once established. How will the garden space be protected from unwanted intrusions?
8. How will you achieve public involvement and support? Can you involve a variety of people (principal, school staff, grounds crew, local business people, local gardeners for summer weeding and watering)? How will you educate others about your project? Finding funding for school gardens is relatively simple because these projects have so many benefi ts. Sources that we know have funded
similar projects include The Evergreen Foundation and Shell (see resource list for addresses).
HOW TO GROW SOME OF THE PLANTWATCH SPECIES
(lilac, prairie crocus, saskatoon, white dryad, and white trillium)
Common Purple Lilac
For those who want to plant new lilacs to observe, a recommended cultivar for Plantwatch observers is the early-fl owering and popular Syringa vulgaris “Charles Joly”, originally developed in 1896 in France by Lemoine. The fl owers of this species are reddish-purple, slightly redder in colour than most common purple lilacs, but suitable for Plantwatch because they are early blooming and many nurseries have them for sale. Make sure your lilac is growing on its own roots, not rootstocks.
Common purple lilac (Syringa vulgaris) can be planted individually or in a line to form an unclipped hedge. Lilacs should be grown in fertile, moisture-retentive soil that is neutral to alkaline, not acidic. They will thrive in sun or partial shade but grow best in full sun. In a new garden be careful not to plant any trees in the vicinity of your lilacs. Over the years these trees will grow and eventually shade the lilacs, which then will produce fewer and fewer fl owers. If your lilacs do get shaded, transplant them to a sunnier site. During dry spells, lilacs benefi t from regular watering, particularly young or recently transplanted plants. This shrub is relatively free from major pests, but watch out for leaf miner and lilac borer.
Pruning
Lilacs should be pruned every fi ve to ten years to maintain a good shape. Lilacs fl ower on the previous year’s growth, so they should not be pruned in any way until after the fl owers have died. The spent blossoms should be removed every year, to prevent wasting energy on seed formation and to stimulate fl ower bud formation. Prune immediately after fl owering occurs
APPENDICES
91
in spring because next year’s buds will form on the new wood that grows after fl owering. Don’t prune in autumn as it will remove next year’s fl ower buds. One or more of the older main stems at the base of a plant may be removed in pruning and some of the remaining stems trimmed back to maintain the size and shape desired. Remember, never remove more than one third of a lilac bush at any one time. Cut a branch back only to the fi rst node, where new buds can be seen. If branches are cut back beyond this point, next year’s fl owers will be lost. After being transplanted, it may take several years for some lilacs to produce fl owers.
Occasionally, a lilac may bloom the fi rst year after being transplanted because the buds were set up in the nursery before the plant was bought. Usually, such a plant will not fl ower again for about three or four years, assuming the plant is growing in the full sun, and has a good supply of nutrients and moisture. Once a plant does begin to fl ower, it will continue to do so for many years.
The ultimate size of a mature lilac is one factor limiting the number of lilacs that any garden can satisfactorily hold. Because under ideal conditions common purple lilacs can reach a height of 2.5 m to 4 m (8-13 ft.), and have a spread of 6 m to 7 m (20-23 ft.), one has to be careful not to plant too many lilacs in a small, city garden.
Growing lilacs from seed
Lilacs can be grown from seed. If open pollinated seed is used there is no way of knowing if the new plant will be similar or quite different from the parent plant. Seed can be collected in the autumn, then dried, and the seed stored in a cool, dry place until February. Lilac seed requires a wet/cold stratifi cation period to break the seed’s natural dormancy. Seed may also be sown directly in the garden in the autumn. After the fi rst freeze, the bed should be covered with a light mulch. In the spring, this mulch should be removed, and the bed should be shaded as the seedlings appear because these seedlings scorch very easily in direct sun.
Prairie Crocus
This welcome little sign of spring is sometimes diffi cult to grow in a garden. It can be started from seed collected from the wild, or purchased from nurseries specializing in native plants and seeds. Please do not attempt to transplant plants from the wild to the garden. This usually fails, and it contributes to loss of biodiversity in our remaining natural habitats! Growing prairie crocus from seed requires patience because not all the seeds will germinate the fi rst year and because the plants are deep-rooted and slow to mature. Native plant seeds usually require stratifi cation before planting, to break their natural dormancy; that is, they must be exposed to a cold and damp period prior to planting. To stratify prairie crocus seed, place the seed in a clean zip-loc bag or fi lm container with a little sterilized dampened sand and refrigerate it from one to three weeks. Then plant the seeds in fl ats — they do not compete very well with other plants. Ideally, these plants should be grown in nursery conditions for the fi rst year or two, and then transplanted to a garden in late fall or early spring.
Habitat Requirements
Prairie crocus likes a sandy soil that is never wet for more than a few hours. Once the plant has a well-established root system, do not water it during the summer unless the soil becomes very dry.
This plant needs to be planted in an open area with full sun. After a year or two, like other wild plants, it becomes dependent on fungal partners in the soil. Seedlings will fl ower in three or four years.
Note: In central Alberta, seed is best collected from the wild in June, when it is ripe.
Saskatoon/Serviceberry
Saskatoon is an excellent ornamental shrub for the garden. It is hardy, that is, it can withstand cold winters and drought, and is easily propagated, with fragrant showy fl owers, edible fruit and attractive fall foliage. It also attracts birds! Many different varieties have been produced by horticulturalists for commercial

APPENDICES
92
and garden use. If you’d like one in your own garden, saskatoon plants are available from many plant nurseries, in several different sizes and varieties. Plants that are old enough to produce fl owers are, of course, more useful for the Plantwatch project.
Saskatoons can be started in several different ways including from seed, suckers, root cuttings, softwood cuttings, hardwood cuttings, and crown division. Saskatoon twigs can also be grafted onto other trees like apples and pears. When seeds are used, some of the plants grown from a batch of seed will be different from the parent stock.
When choosing a saskatoon for your garden, Plantwatch recommends the cultivar, “Smoky”, as this variety blooms early. Choose plants that are not grafted. When plants arrive, remove them from the root trainer, and completely cover the root plug with soil. Firm soil around roots. Water as soon as possible, making sure that roots do not become exposed in the process. It usually takes the fi rst year for the plants to establish their roots, so good care (e.g. occasional watering, effective weeding) at this time will ensure healthy plants for the future. Shallow cultivation is important, to protect the fragile roots, and to keep competing weeds from gaining a foothold.
Growing Saskatoons From Seed
Saskatoons can also be grown from seed. For guidelines on plant collection for the horiticultural use of native plants visit http://www.anpc.ab.ca/assets/gardener_guidelines.pdf. Collect the fruit when it is ripe and freeze it. In the fall, or when you are ready, extract the seed from the fruit pulp (add the fruit to water in blender, use a few brief pulses to avoid damaging the seed, then pass the liquid through a sieve). Don’t allow seed to dry as deep dormancy may result. Soak the seed 24 hours, then place it in small zip-lock bags with moist sand (four parts sand to one part seed) and place the bags in a refrigerator for four to fi ve months. Occasionally examine the bags for germinating seeds. Plant when a seed germinates and the fi rst root is seen. When potting new plants handle the plant very gently
to avoid breaking growing tips. Alternatively, cleaned seed can be sown in the fall and pots placed outside to take advantage of natural stratifi cation. Germination will occur the following spring.
White Dryad, (White Mountain Avens, or Arctic and Alpine Dryad)
White dryads are attractive as garden plants because of the neat, trim leaves, abundant and long-lasting fl owers and interesting seed heads. Several different commercial varieties are available. To minimize human impact on natural habitats, please do not attempt to move plants from the wild. Adult plants are hard to transplant anyway because of their large branching taproot system.
Growing White Dryad From Seed
For most success, sow ripe seed in seed pans fi lled with sandy, well-drained soil. If you have older seed, this seed will need to be stratifi ed. Put the seed in sealable plastic bags, and put them in a refrigerator for two months at 4°C. After germination, transfer the seedlings to individual pots. Because white dryad has a long tap root, letting the plants grow a while in pots will reduce the amount of damage that can occur when the plant is being transplanted into a garden. Plants grown from seed take many years to fl ower.
Habitat Requirements
The dryad grows in alpine and in northern regions, so it is adapted to cool, dry places. It can tolerate moderate drought, and alkaline soils. If you want to grow white dryad in more southern, warmer places you must try to duplicate its favoured growing conditions as much as possible.
First, you need to ensure that your soil is quite coarse in texture so it has adequate drainage. Dryads like to be slightly dry, which can be facilitated if you add pebbles with a little peat moss to your soil. Or, you can plant white dryad in a rock garden among pebbles where there is good drainage but enough moisture to keep the soil from becoming too dry.
Second, your plants need to be protected from the

APPENDICES
93
hot afternoon sun, so pick a spot that is shaded in the afternoon but will expose the plants to sun in the evening and/or morning.
Third, these plants do not thrive in conditions of shade or competition with other plants. These plants have a long branching tap root.
White Trillium
Trilliums can be grown in your garden; the problem is to get them started in the fi rst place.
Do not try to transplant trilliums from the forest to the garden. It is very important to protect these species in the wild!
Forest wildfl owers can take up to 15 years to fl ower and therefore are not economical for commercial greenhouses to grow from seeds or cuttings. For this reason some nurseries dig plants from the wild for resale, a practice that is a great threat to the biodiversity and health of our forests. FloraQuebeca, a Quebec conservation group, therefore recommends no selling or buying of forest fl owers such as trillium, ladies’ slipper orchid, dog-tooth violet, or spring beauty.
Growing Trilliums From Seed
If you still wish to grow trilliums and are very patient, they can be started from seed. Seeds should be harvested as soon as the capsules are ripe, and immediately planted. Germination is more likely if the seeds have experienced a frost, so it is better to sow in the fall. For germination to be successful, it is important that the seed be kept damp. Trilliums can take 15 years to fl ower after the seed germinates. Seedlings survive best in open soil away from plant competition, and away from heavy leaf mould.
Habitat Requirements
This plant is suitable for the shade garden, planted with other species that like cool damp conditions, such as primroses. Trilliums require a semi-shady location with good drainage, in neutral to slightly acid soils with some well rotted leaf mould (avoid heavy clay or sandy soils). The protection provided by nearby trees or shrubs
and a constantly moist soil will produce a healthier plant.
For more information on native plants and seed sources, visit the following websites.
NATIONAL
Evergreen Native Plant Databasewww.evergreen.ca/nativeplants/index.php
Canadian Botanical Conservation Networkc/o Royal Botanical GardensAttention: David GalbraithP.O. Box 399Hamilton, Ontario L8N 3H8www.rbg.ca/cbcn/en/index.html
BRITISH COLUMBIA
Native Plant Society of British Columbia2012 William StreetVancouver, British Columbia V5L 2X6Tel: 604.255.5719Fax: 604.258.0201www.npsbc.org
ALBERTA
Alberta Native Plant Council Native Plant Source List.www.anpc.ab.ca/assets/2007SourceList.pdf
SASKATCHEWAN
Saskatchewan Native Plant Society list of native plant sources.www.npss.sk.ca/nps.php
MANITOBA
Prairie Habitatswww.prairiehabitats.com/
Manitoba Naturalists Society401 - 63 Albert StreetWinnipeg, Manitoba R3B 1G4www.manitobanature.ca

APPENDICES
94
ONTARIO
Native Plant Resource Guide for Ontariowww.serontario.org/publications.htm
Acorus Restoration722 6th Concession Road, R.R. #1Walsingham, Ontario N0E 1X0Phone: 519.586.2603Fax: 519.586.2447Email: [email protected]
QUEBEC
Montréal Botanical Garden4101 Sherbrooke EastMontréal, Quebec H1X 2B2www2.ville.montreal.qc.ca/jardin/en/menu.htm
NEW BRUNSWICK
New Brunswick Botany Clubwww.macbe.com/botanyclub/home.html
Save a Plant16 Fletcher Court, Fredericton, New Brunswick E3A 4T4Tel.: 506.474.0801Email: [email protected]
NOVA SCOTIA
Harriet Irving Botanical Gardens - Acadia UniversityAcadia UniversityWolfville, Nova Scotia B4P 2R6http://botanicalgardens.acadiau.caNova Scotia Wild Flora Societyc/o Nova Scotia Museum of Natural History1747 Summer StreetHalifax, Nova Scotia B3H 3A6www.nswildfl ora.ca/
NEWFOUNDLAND AND LABRADOR
Dr. K. Wilf NichollsGarden DirectorMUN Botanical GardenMemorial UniversitySt. John’s, NL A1C 5S7709-737-3326709-737-8596 (fax)[email protected]
YUKON
Environment Yukonwww.environmentyukon.gov.yk.ca/wildlifebiodiversity/plants.php
Yellowstone to Yukon Conservation Initiativewww.y2y.net/

Appendices
95
Canadian Curriculum Links
Appendix 5
For the PlantWatch Teachers’ Guide
USING THE CURRICULUM LINKS TABLESAppendix 4 identifi es the specifi c curriculum connection for science and math for each activity in the PlantWatch Teacher’s Guide. The table is organized by province/territory. The following table will help you to fi nd the pages where you can locate the specifi c curriculum connections for each activity by code.
Grade 6 Grade7 Grade 8
Atlantic pages 99 pages 101 pages 103
Quebec pages 105 pages 107 pages 108
Ontario pages 109 pages 112 pages 114
Manitoba pages 116 pages 118 pages 122
Saskatchewan pages 123 pages 125 pages 126
Alberta pages 129 pages 131 pages 134
BC/Yukon pages 136 pages 137 pages 138
NT/NU pages 139 pages 141 pages 145
The following Quick Reference Tables have been developed to help you locate the appropriate curriculum connections by grade or by subject.
Quick Reference Guide to Activity by Grade and Subject
K = Key Activity S = Science M = Math So = Social Studies L = Language Arts
NWT/NUN. BC/YUKON ALBERTA SASK. MANITOBA ONTARIO QUEBEC ATLANTIC
Grade Subject Activities
6 (Cycle 3 in Quebec)
Science
K3, K4, K5, S1, S5
K2, K6, S1, S4, S5
S4, So3, L1, L2
S1, S3, S4, S5, M3, So1, So3
K1, K3, S1, M3, So2, So3,
L1, L2
K3, K4, K5, K6, S1, S2, S4, S5, M3, So1, So2,
L1, L2
K2, K3, K4, K5, K6, S1, S2, S5, M2, M3, MSo3,
L1, L2
K1, K2, K3, K4, K5, K6, S2, S5, M3, So1, So2,
So3, L1, L2
Math
K4, K5, S2, S5, M1, M3, L1
K2, K4, S2, S5, M1, M3, L1
K4, S2, M1, M3, L1
K2, K3, K4, K6, S2, M1,
M2, M3, M4, So1, L1
K2, K4, K6, S2, M1, M3, M4,
So1, L1
K2, K4, K6, S2, M1, M2,
M3, L1
K2, K4, S2, S5, M1, M4, So1
K4, K5, K6, S2, M1, M2, M4,
So1
7 (Section I in
Quebec)
Science
K2, K3, K4, K5, K6, S1, S2, S4, M1, M3, So1, So2, L1, L2
K3, S1, S4, S5 K2, K3, K4, K5, K6, S1, S2, S4, M1, M3, So1, So2, L1, L2
K2, K3, S3, M1, So3, L1
K1, K2, K3, K4, K6, S1, S4, M3, So2, So3,
L1, L2
K1, K3, K4, K5, K6, S1, S4, S5,
M3, L1
K2, K3, S1, S2, S5, M3, So1, So3, L1, L2
K2, K3, K4, K5, K6, S1, S2, S4, S5, M3, So2,
So3, L1
MathS2, M1, M2,
M4S2, M1, M2, M4, S2, M1
K4, S2, M1, M2, M4, So1
M1, M2, M4, So1
K4, S2, M1, M2, M4, So1
K2, K4, K6, S2, M1, M2, M3, M4, So1, L1
K2, K4, K5, S2, M1, M3, L1
K4, K5, K6, S2, M1, M2,
M4MSo1
8 (Section II in
Quebec)
ScienceM3 K5, S2, S4, S5,
M3, So3, L1M3 K3, K5, K6, S1,
S4, S5, M3, So1, So3, L1
M3, So2, So3, L1
M3 None K3, K4, K5, K6, S1, M3
MathS2.M1 S2, M1 K4, K6, S2, M1 K2, K5, K6,
S2, M1, M2, M3, L1
K4, S2, M1 K2, K4, K5, K6, M2, M3,
M4, L1
K4, K5, M3 K4, K5, K6, S2, M1, M2, M3, M4, So1, L1

APPENDICES
96
Quick Reference Table to Curriculum Links by Activity and GradeNWT/
NUNAVUTBC/YUKON ALBERTA SASK. MANITOBA ONTARIO QUEBEC ATLANTIC
Activity Grades with Curriculum Links (of Gr. 6, 7, 8)
Key Activity 1 None None None None 6, 7 7 None 6
Key Activity 2 7 None 7 6, 7, 8 6, 7 6, 7, 8 Cycle 3, Sec. I 6, 7
Key Activity 3 6, 7 7 7 6, 7, 8 6, 7 6, 7, Cycle 3, Sec. I 6, 7
Key Activity 4 6, 7 6 6, 7, 8 6, 8 6, 7, 8 6, 7Cycle 3, Sec. I,
Sec. II6, 7
Key Activity 5 6, 7 8 7 8 None 6.7, 8Cycle 3, Sec. I,
Sec. II6, 7, 8
Key Activity 6 7 6 7, 8 6, 8 6, 7 6, 7, 8 Cycle 3 6, 7, 8
Science 1 6, 7 6, 7 7 6, 8 6, 7 6, 7 Cycle 3, Sec. I 7, 8
Science 2 6, 7 6, 7, 8 6, 7, 8 6, 8 6, 7, 8 6, 7 Cycle 3, Sec. I 6, 7, 8
Science 3 None None None 6, 7 None None None None
Science 4 7 6, 7, 8 6, 7 6, 8 7 6, 7 None 7
Science 5 6 6, 7, 8 None Ga None 6, 7 Cycle 3, Sec. I 6, 7
Math 1 6, 7, 8 6, 7, 8 6, 7, 8 6, 7, 8 6, 7, 8 6, 7 Cycle 3, Sec. I 6, 7, 8
Math 2 7 7 7 6, 7, 8 6, 7 6, 7, 8 Cycle 3 6, 7, 8
Math 3 6, 7, 8 6, 8 6, 7, 8 6, 8 6, 7, 8 6, 7, 8Cycle 3, Sec. I,
Sec. II6, 7, 8
Math 4 7 7, 8 7 6, 7 6, 7 7, 8 Cycle 3 6, 7, 8
Social Studies 1 7 7, 8 7 6, 7, 8 6, 7 6, 7 Cycle 3, Sec. I 6, 7, 8
Social Studies 2 7 None 7 None 6, 7, 8 6 None 6, 7
Social Studies 3 None 8 6 6, 7, 8 6, 7, 8 None Cycle 3, Sec. I 6, 7
Lanuage Arts 1 6, 7 6, 8 6, 7 6, 7, 8 6, 7, 8 6, 7, 8 Cycle 3, Sec. I 6, 7, 8
Lanuage Arts 2 7 None 6, 7 6, 7 6, 7 6 Cycle 3, Sec. I 6

APPENDICES
97
Quick Reference Table to Curriculum Links by Activity and SubjectNWT/
NUNAVUTBC/YUKON ALBERTA SASK. MANITOBA ONTARIO QUEBEC ATLANTIC
Activity Subjects with Curriculum Links for Grades 6, 7 and 8 (of Science and Math)
Key Activity 1 Science Science Science Science Science
Key Activity 2 Science Science, Math Science Science, Math Science, Math Math Science, Math Science
Key Activity 3 Science, Math Science Science, Math Science, Math Science Science Science Science
Key Activity 4 Science, Math Math Science, Math Math Science, Math Science, Math Science, Math Science, Math
Key Activity 5 Science, Math Science Science Science, Math Science, Math Science, Math Science, Math
Key Activity 6 Science Science Science, Math Science, Math Science, Math Science, Math Science Science, Math
Science 1 Science Science, Math Science Science Science Science Science Science
Science 2 Science, Math Science, Math Science, Math Math Math Science, Math Science, Math Science, Math
Science 3 Science
Science 4 Science Science Science Science Science Science Science
Science 5 Science, Math Science, Math Science Science Science, Math Science
Math 1 Science, Math Math Science, Math Science, Math Math Math Math Math
Math 2 Math Math Math Math Math Math Science Math
Math 3 Science, Math Science, Math Science, Math Science, Math Science, Math Science, Math Science, Math Science, Math
Math 4 Math Science, Math Math Math Math Math Math Science, Math
Social Studies 1 Science, Math Math Science, Math Science, Math Math Science, Math Math Science, Math
Social Studies 2 Science Science Science Science Science
Social Studies 3 Science Science Science Science Science Science
Lanuage Arts 1 Science, Math Science, Math Science, Math Science, Math Science, Math Science, Math Science, Math Science, Math
Lanuage Arts 2 Science, Math Science Science Science Science Science

APPENDICES
98
ATLANTIC PROVINCES
NOTE: The math and science curriculum for the Atlantic Provinces is a result of a collaborative effort of the education departments of the four provinces, coordinated through the Atlantic Provinces Education Foundation/Council of Atlantic Ministers of Education and Training. Please refer to any of the Atlantic Provinces as a reference to the detailed curriculum learning outcomes. The following documents were used:
• Atlantic Canada Elementary Science Curriculum Guide (2002)
• Atlantic Canada Intermediate Science Curriculum Guide
• Grade 6 Mathematics Curriculum Guide (Interim Edition 2005)
• Grade 7 Mathematics Curriculum Guide (Interim Edition 2008)
• Grade 8 Mathematics Curriculum Guide (Interim Edition 2002)
NEWFOUNDLAND
www.ed.gov.nl.ca/edu/sp/pcdbs.htm
PRINCE EDWARD ISLAND
www.gov.pe.ca/educ/index.php3?number=74897&lang=E
NOVA SCOTIA
https://sapps.ednet.ns.ca/Cart/index.php?UID=2009011516322024.222.131.202
NEW BRUNSWICK
www.gnb.ca/0000/anglophone-e.asp#cd
LEGEND: K - Key activity SUBJECT-SPECIFIC ACTIVITIES: S - Science M - Math So - Social Studies L - Language Arts
CHART OF PROVINCIAL/TERRITORIAL CURRICULUM CONNECTIONS FOR SCIENCE AND MATH FOR GRADES 6-8

APPENDICES
LEGEND: K - Key activity SUBJECT-SPECIFIC ACTIVITIES: S - Science M - Math So - Social Studies L - Language Arts
99
ATLANTIC PROVINCES (GRADE 6) PROVINCIAL CURRICULUM OUTCOMES
Activity Science Mathematics
Key Activity
K1 104-8 demonstrate the importance of using the languages of science and technology to compare and communicate ideas, processes, and results
N/A
K2 204-1 propose questions to investigate and practical problems to solve
207-2 communicate procedures and results, using lists, notes in point form, sentences, charts, graphs, drawing, and oral language
N/A
K3 104-8 demonstrate the importance of using the languages of science and technology to compare and communicate ideas, processes, and results
205-7 record observations using a single work, notes in point form, sentences and simple diagrams and charts
N/A
K4 205-7 record observations using a single work, notes in point form, sentences and simple diagrams and chart
207-2 communicate procedures and results, using lists, notes in point form, sentences, charts, graphs, drawing, and oral language
GCO FKSCO: iii) represent mathematical patterns and relationships in a variety of ways (including rules, tables and one- and two-dimensional graphs)
SCO F4use bar graphs, double bar graphs and stem-and-leaf plots to display data
K5 205-7 record observations using a single work, notes in point form, sentences and simple diagrams and chart
207-2 communicate procedures and results, using lists, notes in point form, sentences, charts, graphs, drawing, and oral language
GCO F: Students will solve problems involving the collection, display and analysis of data.SCO F1 choose and evaluate appropriate samples for data collection F2 identify various types of data sources
KSCO: ii) construct a variety of data displays (including tables, charts and graphs) and consider their relative appropriateness
K6 206-9 identify new questions or problems that arise from what was learned GCO FSCO: F9 explore relevant issues for which data collection assists in reaching conclusions
Other Activity
S1 N/A N/A
S2 204-8 identify appropriate tools, instruments, and materials to complete their investigations
205-7 record observations using a single work, notes in point form, sentences and simple diagrams and chart
207-2 communicate procedures and results, using lists, notes in point form, sentences, charts, graphs, drawing, and oral language
SCO: A6 demonstrate an understanding of the meaning of a negative integer
B7 solve and create relevant addition, subtraction, multiplication and division problems involving whole numbers
B11 calculate sums and differences in relevant contexts by using the most appropriate method
KSCO: By the end of grade 6, students will have achieved the outcomes for entry-grade 3 and will also be expected to develop and apply measures of central tendency (mean, [median and mode])

APPENDICES
LEGEND: K - Key activity SUBJECT-SPECIFIC ACTIVITIES: S - Science M - Math So - Social Studies L - Language Arts
100
ATLANTIC PROVINCES (GRADE 6) PROVINCIAL CURRICULUM OUTCOMES…CONTINUED
Activity Science Mathematics
S3 N/A N/A
S4 N/A N/A
S5 205-7 record observations using a single work, notes in point form, sentences and simple diagrams and chart
207-2 communicate procedures and results, using lists, notes in point form, sentences, charts, graphs, drawing, and oral language
N/A
M1 N/A SCO: A6 demonstrate an understanding of the meaning of a negative integer
B7 solve and create relevant addition, subtraction, multiplication and division problems involving whole numbers
B11 calculate sums and differences in relevant contexts by using the most appropriate method
KSCO: By the end of grade 6, students will have achieved the outcomes for entry-grade 3 and will also be expected to develop and apply measures of central tendency (mean, [median and mode])
M2 N/A KSCO: By the end of grade 6, students will have achieved the outcomes for entry-grade 3 and will also be expected to develop and apply measures of central tendency (mean, [median and mode])
M3 Communication and Teamwork 207-2 communicate procedures and results, using lists, notes in point form, sentences, charts, graphs, drawing, and oral language
N/A
M4 N/A B3 compute quotients of whole numbers and decimals using up to 2- digit whole number divisors
So1 Life Science: Diversity of Life: Adaptations and Natural Selectionpropose questions about the relationship between the structural features of organisms and their environment, and use a variety of sources to gather information about this relationship (204-1, 205-8)
Refer to M4
So2 STSE: Nature of Science and Technology105-5 identify examples of scientifi c knowledge that have developed as a result of the gradual accumulation of evidence
N/A
So3 Life Science: Diversity of Life: Adaptations and Natural Selectionpropose questions about the relationship between the structural features of organisms and their environment, and use a variety of sources to gather information about this relationship (204-1, 205-8)
Relationships Between Science and Technology 205-8 identify and use a variety of sources and technologies to gather pertinent information
STSE108-5 describe how personal actions help conserve natural resources and protect the environment in their region
Refer to S3
N/A

APPENDICES
LEGEND: K - Key activity SUBJECT-SPECIFIC ACTIVITIES: S - Science M - Math So - Social Studies L - Language Arts
101
ATLANTIC PROVINCES (GRADE 6) PROVINCIAL CURRICULUM OUTCOMES…CONTINUED
ATLANTIC PROVINCES (GRADE 7) PROVINCIAL CURRICULUM OUTCOMES
Activity Science Mathematics
L1 Performing and Recording 205-7 record observations using a single work, notes in point form, sentences and simple diagrams and charts
Communication and Teamwork 207-2 communicate procedures and results, using lists, notes in point form, sentences, charts, graphs, drawing, and oral language
N/A
L2 Performing and Recording 205-7 record observations using a single work, notes in point form, sentences and simple diagrams and charts
N/A
Activity Science Mathematics
Key Activity
K1 N/A N/A
K2 208-5 state a prediction and a hypothesis based on background information or an observed pattern
1.04 List examples of organisms that live in each ecosystem
Organize and record information collected in an investigation of an ecosystem using instruments effectively and accurately. (209-3, 209-4)
N/A
K3 210-2 compile and display data, by hand or computer, in a variety of formats, including diagrams, fl ow charts, tables, bar graphs, line graphs, and scatter plots.
N/A
K4 210-2 compile and display data, by hand or computer, in a variety of formats, including diagrams, fl ow charts, tables, bar graphs, line graphs, and scatter plots.
Strand: Statistics and Probability (Data Analysis) General Outcome: Collect, display and analyze data to solve problems.
K5 210-2 compile and display data, by hand or computer, in a variety of formats, including diagrams, fl ow charts, tables, bar graphs, line graphs, and scatter plots.
Strand: Statistics and Probability (Data Analysis) General Outcome: Collect, display and analyze data to solve problems.
K6 211-2 communicate questions, ideas, intentions, plans and results, using lists, notes in point form, sentences, data tables, graphs, drawings, oral language, and other means.
Strand: Statistics and Probability (Data Analysis) General Outcome: Collect, display and analyze data to solve problems.
Other Activity
S1 Unit 1: Interactions within Ecosystems
306-3 describe interactions between biotic and abiotic factors in an ecosystem.
N/A
APPENDICES
LEGEND: K - Key activity SUBJECT-SPECIFIC ACTIVITIES: S - Science M - Math So - Social Studies L - Language Arts
102
Activity Science Mathematics
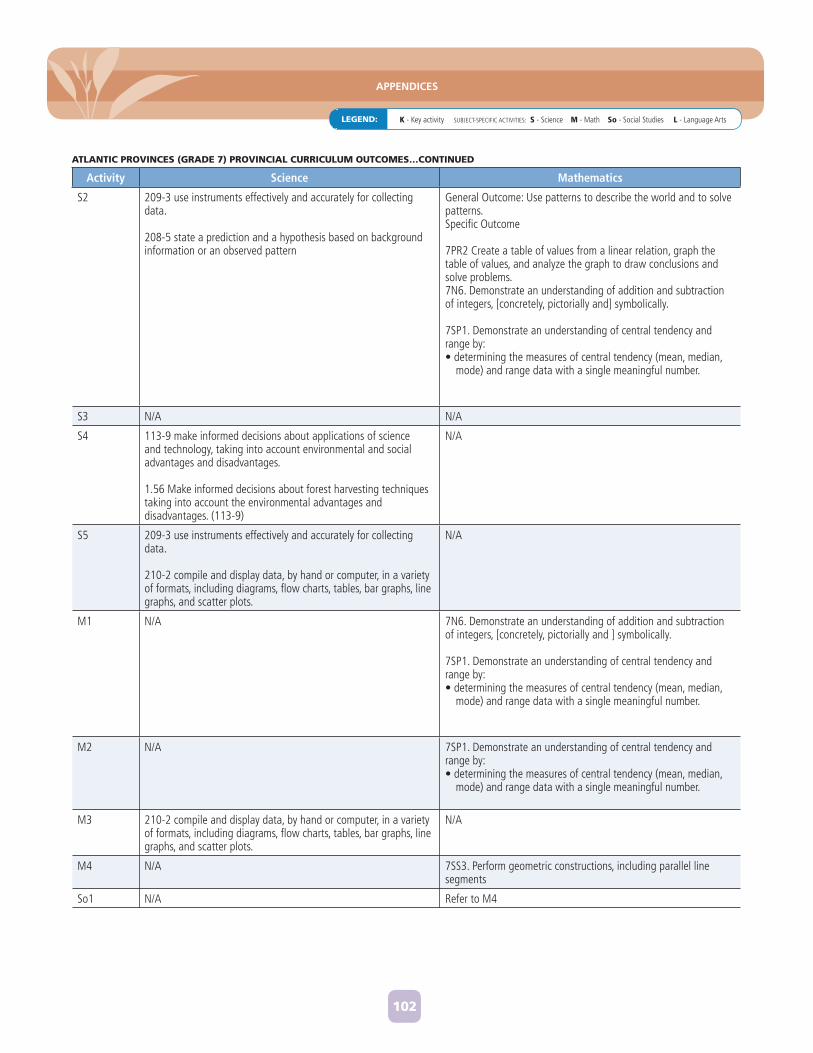
S2 209-3 use instruments effectively and accurately for collecting data.
208-5 state a prediction and a hypothesis based on background information or an observed pattern
General Outcome: Use patterns to describe the world and to solve patterns. Specifi c Outcome 7PR2 Create a table of values from a linear relation, graph the table of values, and analyze the graph to draw conclusions and solve problems. 7N6. Demonstrate an understanding of addition and subtraction of integers, [concretely, pictorially and] symbolically.
7SP1. Demonstrate an understanding of central tendency and range by: • determining the measures of central tendency (mean, median,
mode) and range data with a single meaningful number.
S3 N/A N/A
S4 113-9 make informed decisions about applications of science and technology, taking into account environmental and social advantages and disadvantages.
1.56 Make informed decisions about forest harvesting techniques taking into account the environmental advantages and disadvantages. (113-9)
N/A
S5 209-3 use instruments effectively and accurately for collecting data.
210-2 compile and display data, by hand or computer, in a variety of formats, including diagrams, fl ow charts, tables, bar graphs, line graphs, and scatter plots.
N/A
M1 N/A 7N6. Demonstrate an understanding of addition and subtraction of integers, [concretely, pictorially and ] symbolically.
7SP1. Demonstrate an understanding of central tendency and range by: • determining the measures of central tendency (mean, median,
mode) and range data with a single meaningful number.
M2 N/A 7SP1. Demonstrate an understanding of central tendency and range by: • determining the measures of central tendency (mean, median,
mode) and range data with a single meaningful number.
M3 210-2 compile and display data, by hand or computer, in a variety of formats, including diagrams, fl ow charts, tables, bar graphs, line graphs, and scatter plots.
N/A
M4 N/A 7SS3. Perform geometric constructions, including parallel line segments
So1 N/A Refer to M4
ATLANTIC PROVINCES (GRADE 7) PROVINCIAL CURRICULUM OUTCOMES…CONTINUED

APPENDICES
LEGEND: K - Key activity SUBJECT-SPECIFIC ACTIVITIES: S - Science M - Math So - Social Studies L - Language Arts
103
ATLANTIC PROVINCES (GRADE 7) PROVINCIAL CURRICULUM OUTCOMES…CONTINUED
Activity Science Mathematics
So2 304-3 describe conditions essential to the growth and reproduction of plants [and microorganisms] in an ecosystem and relate these conditions to various aspects of the human food supply.
N/A
So3 Social and Environmental Contexts of Science and Technology113-11 propose a course of action on social issues related to science and technology, taking into account personal needs.
Refer to S3
N/A
L1 Performing and Recording209-4 organize data using a format that is appropriate to the task or experiment.
Analyzing and Interpreting210-2 compile and display data, by hand or computer, in a variety of formats, including diagrams, fl ow charts, tables, bar graphs, line graphs, and scatter plots.
Communication and Teamwork 211-2 communicate questions, ideas, intentions, plans and results, using lists, notes in point form, sentences, data tables, graphs, drawings, oral language, and other means.
N/A
L2 N/A N/A
ATLANTIC PROVINCES (GRADE 8) PROVINCIAL CURRICULUM OUTCOMESActivity Science Mathematics
Key Activity
K1 N/A N/A
K2 N/A N/A
K3 209-4 organize data using a format that is appropriate to the task or experiment
N/A
K4 209-4 organize data using a format that is appropriate to the task or experiment
GCO (C): Students will explore, recognize, represent, and apply patterns and relationships, both informally and formally.
SCO: C1 represent patterns and relationships in a variety of formats and use these representations to predict unknown values
K5 209-4 organize data using a format that is appropriate to the task or experiment climates
GCO (C): Students will explore, recognize, represent, and apply patterns and relationships, both informally and formally.
SCO: C1 represent patterns and relationships in a variety of formats and use these representations to predict unknown values
K6 N/A GCO (C): Students will explore, recognize, represent, and apply patterns and relationships, both informally and formally.
SCO: C1 represent patterns and relationships in a variety of formats and use these representations to predict unknown values
C2 interpret graphs that represent linear and non-linear data

APPENDICES
LEGEND: K - Key activity SUBJECT-SPECIFIC ACTIVITIES: S - Science M - Math So - Social Studies L - Language Arts
104
Activity Science Mathematics
Other Activity
S1 306-3 describe interactions between biotic and abiotic factors in an ecosystem
N/A
S2 N/A B12 add, subtract, multiply, and divide positive and negative decimal numbers with and without the calculator B13 solve and create problems involving addition, subtraction, multiplication, and division of positive and negative decimal numbers
S3 N/A N/A
S4 N/A N/A
S5 N/A N/A
M1 N/A B12 add, subtract, multiply, and divide positive and negative decimal numbers with and without the calculator B13 solve and create problems involving addition, subtraction, multiplication, and division of positive and negative decimal numbers
M2 N/A B12 add, subtract, multiply, and divide positive and negative decimal numbers with and without the calculator B13 solve and create problems involving addition, subtraction, multiplication, and division of positive and negative decimal numbers
M3 Performing and Recording209-4 organize data using a format that is appropriate to the task or experiment
Analyzing and Interpreting 210-2 compile and display data, by hand or computer, in a variety of formats, including diagrams, fl ow charts, tables, bar graphs, line graphs, and scatter plots
210-6 interpret patterns and trends in data, and infer and explain relationships among the variables
C1 represent patterns and relationships in a variety of formats and use these representations to predict unknown values
C2 interpret graphs that represent linear and non-linear data
F4 construct and interpret scatter plots [and determine a line of best fi t by inspection]
M4 N/A B12 add, subtract, multiply, and divide positive and negative decimal numbers with and without the calculator
B13 solve and create problems involving addition, subtraction, multiplication, and division of positive and negative decimal numbers
So1 N/A Refer to M4
So2 N/A N/A
So3 Refer to S3 N/A
L1 N/A C2 interpret graphs that represent linear and non-linear data
L2 N/A N/A
ATLANTIC PROVINCES (GRADE 8) PROVINCIAL CURRICULUM OUTCOMES…CONTINUED

APPENDICES
LEGEND: K - Key activity SUBJECT-SPECIFIC ACTIVITIES: S - Science M - Math So - Social Studies L - Language Arts
105
QUÉBEC (CYCLE 3) PROVINCIAL CURRICULUM OUTCOMESActivity Science Mathematics
Key Activity
K1 N/A N/A
K2 Strategies: Exploration StrategiesPutting forward hypothesisAnticipating the results of his or her approach
Measurement: ProbabilityPredicting the likelihood of an event (certainty, possibility or impossibility)
K3 Living Things: Appropriate LanguageDrawings, sketches
Strategies: Strategies for recording, using and interpreting informationUsing a variety of observational techniques and tools
N/A
K4 Living Things: MatterReproduction of Plants and AnimalsLiving Things: Appropriate LanguageGraphs
Strategies: Communication StrategiesUsing tools to display information in tables and graphs or to draw a diagram
Measurement: StatisticsCollecting, describing and organizing data using tables
K5 Strategies: Strategies for recording, using and interpreting informationUsing a variety of observational techniques and tools
K6 Strategies: Exploration StrategiesStudying a problem or phenomena from different points of viewFormulating questionsPutting forward hypothesisExploring various ways of solving the problem
N/A
Other Activity
S1 Living Things: Energy• Transformation of energy in living things (ecological pyramids)
Appropriate Language• Drawings, sketches
N/A
S2 Energy: Techniques and instrumentationUse of simple measuring instruments
Strategies: Exploration StrategiesPutting forward hypothesisAnticipating the results of his or her approach
Integers: reading, writing, comparison, order, representation
Natural numbers: -operation sense
S3 N/A N/A
S4 N/A N/A
S5 Energy: Techniques and instrumentationUse of simple measuring instruments
Strategies: Exploration StrategiesFormulating questionsPutting forward hypothesis
Living Things: Appropriate LanguageTerminology related to an understanding of living thingsTablesDrawings, sketches
Measurement: Temperatures, estimating and measuringConventional units (C)
Measurement: ProbabilityPredicting the likelihood of an event (certainty, possibility or impossibility
Measurement: StatisticsCollecting, describing and organizing data using tables

APPENDICES
LEGEND: K - Key activity SUBJECT-SPECIFIC ACTIVITIES: S - Science M - Math So - Social Studies L - Language Arts
106
Activity Science Mathematics
M1 N/A Integers: reading, writing, comparison, order, representation
Natural numbers: -operation sense
M2 Living Things: Matter: Characteristics of Living Things• reproduction of plants and animals
N/A
M3 Living Things: Appropriate Language: Graphs
StrategiesUsing different tools for recording informationUsing tools to display information in tables and graphs or to draw a diagram
N/A
M4 N/A Geometry: Geometric fi gures and spatial senseconstructing parallel
Measurement: Lengths: estimating and measuring• relationships between units of measure
So1 Refer to M4
So2 N/A
So3 Living Things: Systems and InteractionInteraction between living organisms and their environment • adaptation
Refer to S3
N/A
L1 Earth and Space Science: Systems and InteractionMeteorological systems and climates
Living Things: Systems and InteractionInteraction between living organisms and their environment • living things and their habitats
Living Things: Appropriate Language: • Terminology related to an understanding of living thingsGraphs
StrategiesUsing different tools for recording informationUsing tools to display information in tables and graphs or to draw a diagram
N/A
L2 Living Things: Appropriate Language: Terminology related to an understanding of living things
StrategiesUsing different tools for recording informationUsing a variety of observational techniques and tools
N/A
QUÉBEC (CYCLE 3) PROVINCIAL CURRICULUM OUTCOMES…CONTINUED
Québec Education Program Chapter 6.2: Mathematics, Science and Technology. www.mels.gouv.qc.ca/DGFJ/dp/programme_de_formation/primaire/pdf/educprg2001/educprg2001-062.pdf

APPENDICES
LEGEND: K - Key activity SUBJECT-SPECIFIC ACTIVITIES: S - Science M - Math So - Social Studies L - Language Arts
107
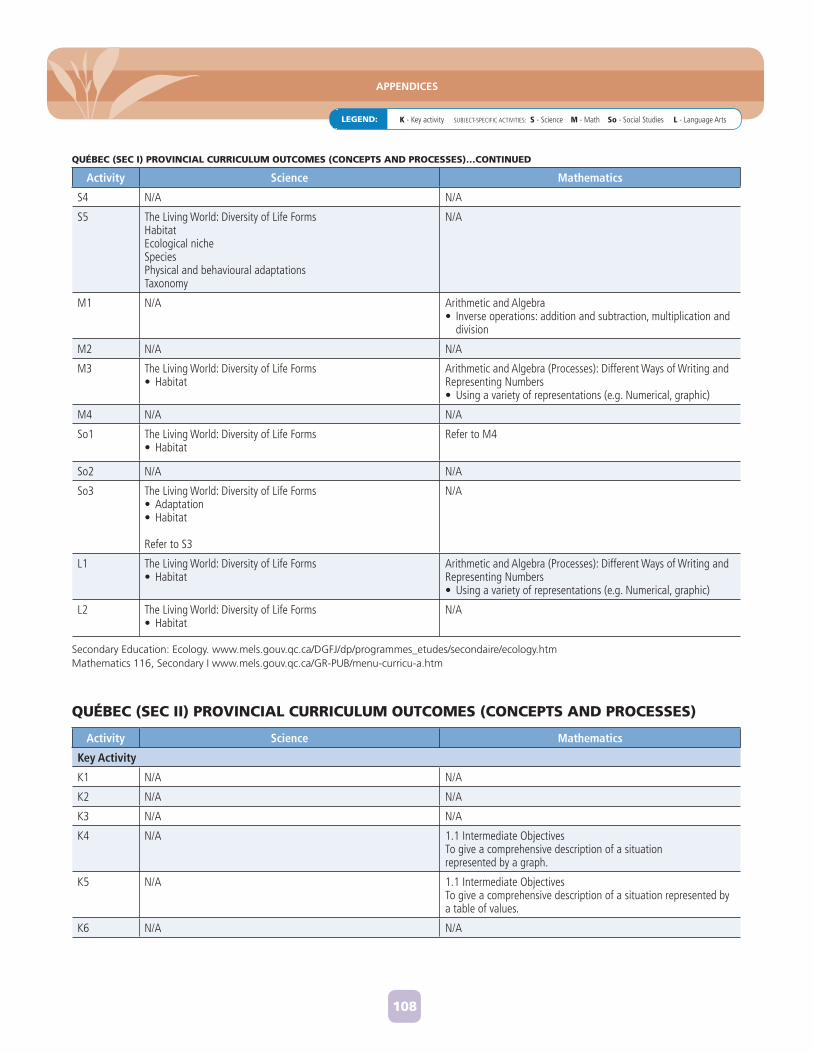
QUÉBEC (SEC I) PROVINCIAL CURRICULUM OUTCOMES (CONCEPTS AND PROCESSES)
Activity Science Mathematics
Key Activity
K1 N/A N/A
K2 The Living World: Diversity of Life FormsPhysical and behavioural adaptationsTaxonomy
Statistics and Probability: Random Experiment: EventCertain, probable and impossible events
Processing data from statistical reportsConducting a survey or a censusDetermining the population of a sampleGathering data
K3 The Living World: Diversity of Life FormsHabitatSpeciesPhysical and behavioural adaptationsTaxonomy
N/A
K4 N/A Statistics and Probability:Processing data from statistical reportOrganizing and choosing certain tools to present dataconstructing tables‘constructing graphs: bar graphs, broken line graphs, circle graphshighlighting some of the information that can be derived from a table or graphs
K5 N/A Statistics and Probability:Processing data from statistical reportsConducting a survey or a censusdetermining the population of a samplegathering data
K6 N/A N/A
Other Activity
S1 The Living World: Diversity of Life FormsHabitatEcological nicheSpeciesPhysical and behavioural adaptationsTaxonomy
EcologyT.O. 0.3 To identify the members of the living part of the environment.T.O. 1.1 To distinguish the different types of interactions that occur in the environment.T.O. 1.5 To identify, from examples, phenomena of living/living relationships.T.O. 1.6 To identify, from examples, phenomena of nonliving/living relationships.T.O. 1.7 To identify, from examples, phenomena of living/nonliving relationships.
N/A
S2 The Living World: Diversity of Life FormsPhysical and behavioural adaptationsTaxonomy
IO 2.2 To perform the following operations on integers: addition, subtraction, multiplication, division and exponentiation (exponents should be limited to the positive integers).
S3 N/A N/A
APPENDICES
LEGEND: K - Key activity SUBJECT-SPECIFIC ACTIVITIES: S - Science M - Math So - Social Studies L - Language Arts
108
Activity Science Mathematics
S4 N/A N/A
S5 The Living World: Diversity of Life FormsHabitatEcological nicheSpeciesPhysical and behavioural adaptationsTaxonomy
N/A
M1 N/A Arithmetic and Algebra• Inverse operations: addition and subtraction, multiplication and
division
M2 N/A N/A
M3 The Living World: Diversity of Life Forms• Habitat
Arithmetic and Algebra (Processes): Different Ways of Writing and Representing Numbers• Using a variety of representations (e.g. Numerical, graphic)
M4 N/A N/A
So1 The Living World: Diversity of Life Forms• Habitat
Refer to M4
So2 N/A N/A
So3 The Living World: Diversity of Life Forms• Adaptation• Habitat
Refer to S3
N/A
L1 The Living World: Diversity of Life Forms• Habitat
Arithmetic and Algebra (Processes): Different Ways of Writing and Representing Numbers• Using a variety of representations (e.g. Numerical, graphic)
L2 The Living World: Diversity of Life Forms• Habitat
N/A
QUÉBEC (SEC I) PROVINCIAL CURRICULUM OUTCOMES (CONCEPTS AND PROCESSES)…CONTINUED
Secondary Education: Ecology. www.mels.gouv.qc.ca/DGFJ/dp/programmes_etudes/secondaire/ecology.htmMathematics 116, Secondary I www.mels.gouv.qc.ca/GR-PUB/menu-curricu-a.htm
QUÉBEC (SEC II) PROVINCIAL CURRICULUM OUTCOMES (CONCEPTS AND PROCESSES)
Activity Science Mathematics
Key Activity
K1 N/A N/A
K2 N/A N/A
K3 N/A N/A
K4 N/A 1.1 Intermediate ObjectivesTo give a comprehensive description of a situation represented by a graph.
K5 N/A 1.1 Intermediate ObjectivesTo give a comprehensive description of a situation represented by a table of values.
K6 N/A N/A

APPENDICES
LEGEND: K - Key activity SUBJECT-SPECIFIC ACTIVITIES: S - Science M - Math So - Social Studies L - Language Arts
109
QUÉBEC (SEC II) PROVINCIAL CURRICULUM OUTCOMES (CONCEPTS AND PROCESSES)…CONTINUED
ONTARIO (GRADE 6) PROVINCIAL CURRICULUM OUTCOMES
Activity Science Mathematics
Other Activity
S1 N/A N/A
S2 N/A N/A
S3 N/A N/A
S4 N/A N/A
S5 N/A N/A
M1 N/A N/A
M2 N/A N/A
M3 N/A TO 1.1 To translate one representation of a situation into another
M4 N/A N/A
So1 N/A Refer to M4
So2 N/A N/A
So3 Refer to S3 N/A
L1 N/A N/A
L2 N/A N/A
Mathematics 216, Secondary II http://www.mels.gouv.qc.ca/GR-PUB/menu-curricu-a.htm/science/programs.aspx
Activity Science Mathematics
Key Activity
K1 N/A N/A
K2 N/A Data Management and Probabilitycollect data by conducting a survey (e.g., use an Internet survey tool) or an experiment to do with themselves,their environment, issues in their school or community, or content from another subject, and record observations or measurements;
K3 Understanding Life Systems: Biodiversity 1.2 assess the benefi ts that human societies derive from biodiversity (e.g., thousands of products such as food, clothing, medicine, and building use a variety of forms (e.g., oral, written, graphic, multimedia) to communicate with different audiences and for a variety of purposes (e.g., use a graphic organizer to show comparisons between organisms in various communities)
N/A
K4 2.5 use a variety of forms (e.g., oral, written, graphic, multimedia) to communicate with different audiences and for a variety of purposes (e.g., use a graphic organizer to show comparisons between organisms in various communities)
Data Management and Probabilitycollect and organize discrete or continuous primary data and secondary data (e.g., electronic data from websites such as E-Stat or Census At Schools) and display the data in charts, tables, and graphs (including continuous line graphs) that have appropriate titles, labels (e.g., appropriate units marked on the axes), and scales (e.g., with appropriate increments) that suit the range and distribution of the data, using a variety of tools (e.g., graph paper, spreadsheets, dynamic statistical software)

APPENDICES
LEGEND: K - Key activity SUBJECT-SPECIFIC ACTIVITIES: S - Science M - Math So - Social Studies L - Language Arts
110
Activity Science Mathematics
K5 2.5 use a variety of forms (e.g., oral, written, graphic, multimedia) to communicate with different audiences and for a variety of purposes (e.g., use a graphic organizer to show comparisons between organisms in various communities)
(Optional activity complements one additional outcome)3.1 identify and describe the distinguishing characteristics of different groups of plants and animals
N/A
K6 2.5use a variety of forms (e.g., oral, written, graphic, multimedia) to communicate with different audiences and for a variety of purposes (e.g., use a graphic organizer to show comparisons between organisms in various communities)
Data Management and ProbabilityRead, interpret, and draw conclusions from primary data (e.g., survey results, measurements, observations) and from secondary data (e.g., sports data in the newspaper, data from the Internet about movies), presented in charts, tables, and graphs (including continuous line graphs);
Other Activity
S1 3.5 describe interrelationships within species, between species within each species of plant and between species [and explain how these interrelationships sustain biodiversity.]
N/A
S2 2.5 use a variety of forms (e.g., oral, written, graphic, multimedia) to communicate with different audiences and for a variety of purposes (e.g., use a graphic organizer to show comparisons between organisms in various communities)
Data management and Probability: Data Relationships demonstrate an understanding of mean, and use the mean to compare two sets of related data, with and without the use of technology
S3 N/A N/A
S4 1.1 analyse a local issue related to biodiversity (e.g., the effects of human activities on urban biodiversity, fl ooding of traditional Aboriginal hunting and gathering areas as a result of dam construction), taking different points of view into consideration (e.g., the points of view of members of the local community, business owners, people concerned about the environment, mine owners, local First Nations, Métis, Inuit), propose action that can be taken to preserve biodiversity, and act on the proposal.
N/A
S5 2.5 use a variety of forms (e.g., oral, written, graphic, multimedia) to communicate with different audiences and for a variety of purposes (e.g., use a graphic organizer to show comparisons between organisms in various communities)
N/A
M1 N/A Data management and Probability: Data Relationships demonstrate an understanding of mean, and use the mean to compare two sets of related data, with and without the use of technology
M2 N/A Data management and Probability: Data Relationships demonstrate an understanding of mean, and use the mean to compare two sets of related data, with and without the use of technology
ONTARIO (GRADE 6) PROVINCIAL CURRICULUM OUTCOMES…CONTINUED

APPENDICES
LEGEND: K - Key activity SUBJECT-SPECIFIC ACTIVITIES: S - Science M - Math So - Social Studies L - Language Arts
111
ONTARIO (GRADE 6) PROVINCIAL CURRICULUM OUTCOMES…CONTINUED
Activity Science Mathematics
M3 Developing Investigation and Communication Skills2.5 use a variety of forms (e.g., oral, written, graphic, multimedia) to communicate with different audiences and for a variety of purposes (e.g., use a graphic organizer to show comparisons between organisms in various communities)
Data management and Probability:Collection and Organization of Data - collect and organize discrete or continuous primary data and secondary data (e.g., electronic data from websites such as E-Stat or Census At Schools) and display the data in charts, tables, and graphs (including continuous line graphs) that have appropriate titles, labels (e.g., appropriate units marked on the axes), and scales (e.g., with appropriate increments) that suit the range and distribution of the data, using a variety of tools (e.g., graph paper, spreadsheets, dynamic statistical software);
Data Relationships –read, interpret, and draw conclusions from primary data (e.g., survey results, measurements, observations) and from secondary data (e.g., sports data in the newspaper, data from the Internet about movies), presented in charts, tables, and graphs (including continuous line graphs);
M4 N/A N/A
So1 3.2 demonstrate an understanding of biodiversity as the variety of life on earth, including variety within each species of plant and animal, among species of plants and animals in communities, and among communities and the physical landscapes that support them
Refer to M4
So2 Relating Science and Technology to Society and the Environment 1.2 assess the benefi ts that human societies derive from biodiversity audiences and for a variety of purposes
3.6 identify everyday products that come from a diversity of organisms (e.g., traditional pain relievers are derived from the bark of the white willow tree; tofu is made from soybeans; silk is made from silkworm cocoons; nutritional supplements, shampoos, toothpastes, and deodorants contain pollen collected by bees)
N/A
So3 Refer to S3 N/A
L1 Relating Science and Technology to Society and the Environment 1.2 assess the benefi ts that human societies derive from biodiversity audiences and for a variety of purposes
Developing Investigation and Communication Skills2.5 use a variety of forms (e.g., oral, written, graphic, multimedia) to communicate with different audiences and for a variety of purposes (e.g., use a graphic organizer to show comparisons between organisms in various communities)
Data management and Probability:Collection and Organization of Data - collect and organize discrete or continuous primary data and secondary data (e.g., electronic data from websites such as E-Stat or Census At Schools) and display the data in charts, tables, and graphs (including continuous line graphs) that have appropriate titles, labels (e.g., appropriate units marked on the axes), and scales (e.g., with appropriate increments) that suit the range and distribution of the data, using a variety of tools (e.g., graph paper, spreadsheets, dynamic statistical software);
Data Relationships – read, interpret, and draw conclusions from primary data (e.g., survey results, measurements, observations) and from secondary data (e.g., sports data in the newspaper, data from the Internet about movies), presented in charts, tables, and graphs (including continuous line graphs);
L2 3.2 demonstrate an understanding of biodiversity as the variety of life on earth, including variety within each species of plant and animal, among species of plants and animals in communities, and among communities and the physical landscapes that support them
N/A
The Ontario Curriculum Grades 1-8: Science and Technology, 2007 www.edu.gov.on.ca/eng/curriculum/elementary/scientec.htmlThe Ontario Curriculum Grades 1-8: Mathematics, 2005 www.edu.gov.on.ca/eng/curriculum/elementary/math18curr.pdf

APPENDICES
LEGEND: K - Key activity SUBJECT-SPECIFIC ACTIVITIES: S - Science M - Math So - Social Studies L - Language Arts
112
ONTARIO (GRADE 7) PROVINCIAL CURRICULUM OUTCOMES
Activity Science Mathematics
Key Activity
K1 Understanding Life Systems, Interactions in the Environment
3.2 identify biotic and abiotic elements in an ecosystem, and describe the interactions between them (e.g., between hours of sunlight and the growth of plants in a pond; between a termite colony and a decaying log; between the soil, plants, and animals in a forest)
N/A
K2 N/A Data Management and Probability – collect data by conducting a survey or an experiment to do with themselves their environment, issues in their school or content from another subject and record observations or measurements;
K3 2.5 use a variety of forms (e.g., oral, written, graphic, multimedia) to communicate with different audiences and for a variety of purposes (e.g., design a multimedia presentation explaining the interrelationships between biotic and abiotic components in a specifi c ecosystem)
N/A
K4 2.5 use a variety of forms (e.g., oral, written, graphic, multimedia) to communicate with different audiences and for a variety of purposes (e.g., design a multimedia presentation explaining the interrelationships between biotic and abiotic components in a specifi c ecosystem)
Data Management and Probability – collect and organize categorical, discrete, or continuous primary data and secondary data (e.g., electronic data from websites such as E-Stat or Census At Schools) and display the data in charts, tables, and graphs (including relative frequency tables and circle graphs) that have appropriate titles, labels (e.g., appropriate units marked on the axes), and scales (e.g., with appropriate increments) that suit the range and distribution of the data, using a variety of tools (e.g., graph paper, spreadsheets, dynamic statistical software)
K5 2.5 use a variety of forms (e.g., oral, written, graphic, multimedia) to communicate with different audiences and for a variety of purposes (e.g., design a multimedia presentation explaining the interrelationships between biotic and abiotic components in a specifi c ecosystem)
N/A
K6 3.2 identify biotic and abiotic elements in an ecosystem, and describe the interactions between them (e.g., between hours of sunlight and the growth of plants in a pond; between a termite colony and a decaying log; between the soil, plants, and animals in a forest)
Data Management and Probability – read, interpret, and draw conclusions from primary data (e.g., survey results, measurements, observations) and from secondary data (e.g., temperature data or community data in the newspaper, data from the Internet about populations) presented in charts, tables, and graphs (including relative frequency tables and circle graphs);
Other Activity
S1 3.1 demonstrate an understanding of an ecosystem (e.g., a log, a pond, a forest) as a system of interactions between living organisms and their environment
3.2 [identify biotic and abiotic elements in an Ecosystem, and] describe the interactions between them
3.9 describe Aboriginal perspectives on sustainability and describe ways in which they can be used in habitat and wildlife management
N/A
S2 N/A Number Sense and Numeration–identify and compare integers found in real-life contexts (e.g.,–10°C is much colder than +5°C);
S3 N/A N/A

APPENDICES
LEGEND: K - Key activity SUBJECT-SPECIFIC ACTIVITIES: S - Science M - Math So - Social Studies L - Language Arts
113
Activity Science Mathematics
S4 3.2 identify biotic and abiotic elements in an ecosystem, and describe the interactions between them (e.g., between hours of sunlight and the growth of plants in a pond; between a termite colony and a decaying log; between the soil, plants, and animals in a forest)
N/A
S5 3.8 describe ways in which human activities and technologies alter balances and interactions in the environment (e.g., clear-cutting a forest, overusing motorized water vehicles, managing wolf-killings in Yukon
N/A
M1 N/A Number Sense and Numeration–identify and compare integers found in real-life contexts (e.g.,–10°C is much colder than +5°C);
M2 N/A Operational Sense–solve multi-step problems arising from real-life contexts and involving whole numbers and decimals, using a variety of tools (e.g., concrete materials, drawings, calculators) and strategies (e.g., estimation, algorithms);
M3 Developing Investigation and Communication Skills2.7 use a variety of forms to communicate with different audiences and for a variety of purposes
Collection and Organization of Data–collect and organize categorical, discrete, or continuous primary data and secondary data (e.g., electronic data from websites such as E-Stat or Census At Schools) and display the data in charts, tables, and graphs (including relative frequency tables and circle graphs) that have appropriate titles, labels (e.g., appropriate units marked on the axes), and scales (e.g., with appropriate increments) that suit the range and distribution of the data, using a variety of tools (e.g., graph paper, spreadsheets, dynamic statistical software); in charts, tables, and graphs (including relative frequency tables and circle graphs);
Data Relationships–read, interpret, and draw conclusions from primary data (e.g., survey results, measurements, observations) and from secondary data (e.g., temperature data or community data in the newspaper, data from the Internet about populations) presented in charts, tables, and graphs (including relative frequency tables and circle graphs);
–identify and describe trends, based on the distribution of the data presented in tables and graphs, using informal language;
–make inferences and convincing arguments that are based on the analysis of charts, tables, and graphs
M4 N/A Operational Sense–solve multi-step problems arising from real-life contexts and involving whole numbers and decimals, using a variety of tools (e.g., concrete materials, drawings, calculators) and strategies (e.g., estimation, algorithms);
Geometric Properties–construct related lines (i.e., parallel; [perpendicular; intersecting at 30º,45º,and 60º]),using angle properties and a variety of tools
So1 N/A Refer to M4
So2 N/A N/A
So3 Refer to S3 N/A
ONTARIO (GRADE 7) PROVINCIAL CURRICULUM OUTCOMES…CONTINUED

APPENDICES
LEGEND: K - Key activity SUBJECT-SPECIFIC ACTIVITIES: S - Science M - Math So - Social Studies L - Language Arts
114
Activity Science Mathematics
L1 Developing Investigation and Communication Skills2.4 use appropriate science and technology vocabulary, [including sustainability, biotic, ecosystem, community, population, and producer] in oral and written communication
2.7 use a variety of forms to communicate with different audiences and for a variety of purposes
Collection and Organization of Data–collect and organize categorical, discrete, or continuous primary data and secondary data (e.g., electronic data from websites such as E-Stat or Census At Schools) and display the data in charts, tables, and graphs (including relative frequency tables and circle graphs) that have appropriate titles, labels (e.g., appropriate units marked on the axes), and scales (e.g., with appropriate increments) that suit the range and distribution of the data, using a variety of tools (e.g., graph paper, spreadsheets, dynamic statistical software); in charts, tables, and graphs (including relative frequency tables and circle graphs);
Data Relationships–read, interpret, and draw conclusions from primary data (e.g., survey results, measurements, observations) and from secondary data (e.g., temperature data or community data in the newspaper, data from the Internet about populations) presented in charts, tables, and graphs (including relative frequency tables and circle graphs);
–identify and describe trends, based on the distribution of the data presented in tables and graphs, using informal language;
–make inferences and convincing arguments that are based on the analysis of charts, tables, and graphs
L2 N/A N/A
The Ontario Curriculum Grades 1-8: Science and Technology, 2007 www.edu.gov.on.ca/eng/curriculum/elementary/scientec.htmlThe Ontario Curriculum Grades 1-8: Mathematics, 2005 www.edu.gov.on.ca/eng/curriculum/elementary/math18curr.pdf
ONTARIO (GRADE 7) PROVINCIAL CURRICULUM OUTCOMES…CONTINUED
ONTARIO (GRADE 8) PROVINCIAL CURRICULUM OUTCOMES
Activity Science Mathematics
Key Activity
K1 N/A
K2 N/A Data Management and Probabilitycollect data by conducting a survey or an experiment to do with themselves, their environment, issues in their school or community, or content from another subject, and record observations or measurements;
K3 N/A N/A
K4 N/A Data Management and Probabilityselect an appropriate type of graph to represent a set of data, graph the data using technology, and justify the choice of graph (i.e., from types of graphs already studied, including histograms and scatter plots)
K5 N/A Operational Sense –solve multi-step problems arising from real-life on texts and involving whole numbers and decimals, using a variety of tools (e.g., graphs, calculators) and strategies (e.g., estimation, algorithms);

APPENDICES
LEGEND: K - Key activity SUBJECT-SPECIFIC ACTIVITIES: S - Science M - Math So - Social Studies L - Language Arts
115
ONTARIO (GRADE 8) PROVINCIAL CURRICULUM OUTCOMES…CONTINUED
Activity Science Mathematics
K6 N/A Data Management and Probabilityread, interpret, and draw conclusions from primary data (e.g., survey results, measurements, observations) and from secondary data (e.g., election data or temperature data from the newspaper, data from the Internet about lifestyles), presented in charts, tables, and graphs (including frequency tables with intervals, histograms, and scatter plots);
Other Activity
S1 N/A N/A
S2 N/A N/A
S3 N/A N/A
S4 N/A N/A
S5 N/A N/A
M1 N/A N/A
M2 N/A Operational Sense –solve multi-step problems arising from real-life contexts and involving whole numbers and decimals, using a variety of tools (e.g., graphs, calculators) and strategies (e.g., estimation, algorithms);
M3 Developing Investigation and Communication Skills2.6 use a variety of forms to communicate with different audiences and for a variety of purposes
Data Management and ProbabilityData Relationships–collect and organize categorical, discrete, or continuous primary data and secondary data (e.g., electronic data from websites such as E-Stat or Census At Schools), and display the data in charts, tables, and graphs (including histograms and scatter plots) that have appropriate titles, labels (e.g., appropriate units marked on the axes), and scales (e.g., with appropriate increments) that suit the range and distribution of the data, using a variety of tools (e.g., graph paper, spreadsheets, dynamic statistical software); charts, tables, and graphs (including frequency tables with intervals, histograms, and scatter plots);
–read, interpret, and draw conclusions from primary data (e.g., survey results, measurements, observations) and from secondary data (e.g., election data or temperature data from the newspaper, data from the Internet about lifestyles), presented in charts, tables, and graphs (including frequency tables with intervals, histograms, and scatter plots);
–make inferences and convincing arguments that are based on the analysis of charts, tables, and graphs
M4 N/A Operational Sense –solve multi-step problems arising from real-life contexts and involving whole numbers and decimals, using a variety of tools (e.g., graphs, calculators) and strategies (e.g., estimation, algorithms);
So1 N/A N/A
So2 N/A N/A
So3 N/A N/A

APPENDICES
LEGEND: K - Key activity SUBJECT-SPECIFIC ACTIVITIES: S - Science M - Math So - Social Studies L - Language Arts
116
Activity Science Mathematics
L1 N/A Data Management and ProbabilityData Relationships–collect and organize categorical, discrete, or continuous primary data and secondary data (e.g., electronic data from websites such as E-Stat or Census At Schools), and display the data in charts, tables, and graphs (including histograms and scatter plots) that have appropriate titles, labels (e.g., appropriate units marked on the axes), and scales (e.g., with appropriate increments) that suit the range and distribution of the data, using a variety of tools (e.g., graph paper, spreadsheets, dynamic statistical software); charts, tables, and graphs (including frequency tables with intervals, histograms, and scatter plots);
–read, interpret, and draw conclusions from primary data (e.g., survey results, measurements, observations) and from secondary data (e.g., election data or temperature data from the newspaper, data from the Internet about lifestyles), presented in charts, tables, and graphs (including frequency tables with intervals, histograms, and scatter plots);
–make inferences and convincing arguments that are based on the analysis of charts, tables, and graphs
L2 N/A N/A
ONTARIO (GRADE 8) PROVINCIAL CURRICULUM OUTCOMES…CONTINUED
MANITOBA (GRADE 6) PROVINCIAL CURRICULUM OUTCOMES
The Ontario Curriculum Grades 1-8: Science and Technology, 2007 www.edu.gov.on.ca/eng/curriculum/elementary/scientec.htmlThe Ontario Curriculum Grades 1-8: Mathematics, 2005 www.edu.gov.on.ca/eng/curriculum/elementary/math18curr.pdf
Activity Science Mathematics
Key Activity
K1 6-1-08 Observe and describe the diversity of living things within the local environment. GLO: A1, C2, D1, E1
N/A
K2 N/A 6.SP.2Select, justify and use appropriate methods of collecting data including questionnaires, experiments, databases, electronic media. [C, PS, T]
K3 6-1-08 Observe and describe the diversity of living things within the local environment. GLO: A1, C2, D1, E1
N/A
K4 N/A 6.SP.3Graph collected data and analyze the graph to solve problems.[C, CN, PS]
K5 N/A N/A
K6 N/A 6.SP.3Graph collected data and analyze the graph to solve problems.[C, CN, PS]

APPENDICES
LEGEND: K - Key activity SUBJECT-SPECIFIC ACTIVITIES: S - Science M - Math So - Social Studies L - Language Arts
117
MANITOBA (GRADE 6) PROVINCIAL CURRICULUM OUTCOMES…CONTINUED
Activity Science Mathematics
Other Activity
S1 6-1-08 Observe and describe the diversity of living things within the local environment. GLO: A1, C2, D1, E1
N/A
S2 N/A Number6.N.7. Demonstrate an understanding of integers, concretely, pictorially, and symbolically. [C, CN, R, V]
S3 N/A N/A
S4 N/A N/A
S5 N/A N/A
M1 N/A Number6.N.7. Demonstrate an understanding of integers, concretely, pictorially, and symbolically. [C, CN, R, V]
M2 N/A N/A
M3 Analysing and interpreting6-0-6A. Construct graphs to display data, and interpret and evaluate these and other graphs.
6-0-6C. Identify and suggest explanations for patterns and discrepancies in data.
Scientifi c and Technological Skills and AttitudesC6. employ effective communication skills and utilize information technology to gather and share scientifi c and technological ideas and data
Patterns and Relations6.PR.2. Represent and describe patterns and relationships using graphs and tables. [C, CN, ME, PS, R, V]
Statistics and Probability6.SP.1. Create, label, and interpret line graphs to draw conclusions. [C, CN, PS, R, V]
6.SP.3. Graph collected data and analyze the graph to solve problems. [C, CN, PS]
M4 N/A Number6.N.8. Demonstrate an understanding of multiplication and division of decimals involving 1-digit whole-number multipliers
So1 N/A Refer to M4
So2 Nature of Science and Technology (General Learning Outcomes)A4. identify and appreciate contributions made by women and men from many societies and cultural backgrounds towards increasing our understanding of the world and in bringing about technological innovations
Science, Technology, Society and the Environment (General Learning Outcomes)B2. recognize that scientifi c and technological endeavors have been and continue to be infl uenced by human needs and the societal context of the time
Diversity of Living Things6-1-15Identify and describe the contributions of scientists and naturalists who have increased our understanding of the diversity of living things.
N/A

APPENDICES
LEGEND: K - Key activity SUBJECT-SPECIFIC ACTIVITIES: S - Science M - Math So - Social Studies L - Language Arts
118
Activity Science Mathematics
So3 Science, Technology, Society and the Environment(General Learning Outcomes)B5. identify and demonstrate actions that promote a sustainable environment, society and economy, both locally and globally
Scientifi c and Technological Skills and Attitudes(General Learning Outcomes)C6. employ effective communication skills and utilize information technology to gather and share scientifi c and technological ideas and data
Researching6-0-2A. Access information using a variety of sources.6-0-2C. Make notes on a topic, combining information from more than one source and reference sources appropriately.
6-0-9F. Frequently and thoughtfully evaluate the potential consequences of their actions.
Refer to S3
N/A
L1 Nature of Science and Technology (General Learning Outcomes)A4. identify and appreciate contributions made by women and men from many societies and cultural backgrounds towards increasing our understanding of the world and in bringing about technological innovations
Observing, Measuring, Recording6-0-5A. Make observations that are relevant to a specifi c question.
6-0-5F. Record and organize observations in a variety of ways.
Patterns and Relations6.PR.2. Represent and describe patterns and relationships using graphs and tables. [C, CN, ME, PS, R, V]
L2 Observing, Measuring, Recording6-0-5A. Make observations that are relevant to a specifi c question.
6-0-5F. Record and organize observations in a variety of ways.
Diversity of Living Things6-1-08 Observe and describe the diversity of living things within the local environment.
N/A
MANITOBA (GRADE 6) PROVINCIAL CURRICULUM OUTCOMES…CONTINUED
K-8 Mathematics Manitoba Curriculum Framework of Outcomes. 2008. www.edu.gov.mb.ca/k12/cur/math/framework_k-8/index.htmlGrades 5 to 8 Science: Manitoba Curriculum Framework of Outcomes www.edu.gov.mb.ca/k12/cur/science/scicurr.html
MANITOBA (GRADE 7) PROVINCIAL CURRICULUM OUTCOMESActivity Science Mathematics
Key Activity
K1 7-1-01 Use appropriate vocabulary related to their investigations of interactions within ecosystems. Include: ecosystem, biosphere, abiotic, biotic, organisms, ecological succession, photosynthesis, cellular respiration, ecological pyramid, bioaccumulation, scavengers, decomposers, micro-organisms GLO: C6, D2
N/A

APPENDICES
LEGEND: K - Key activity SUBJECT-SPECIFIC ACTIVITIES: S - Science M - Math So - Social Studies L - Language Arts
119
MANITOBA (GRADE 7) PROVINCIAL CURRICULUM OUTCOMES…CONTINUED
Activity Science Mathematics
K2 7-1-01 Use appropriate vocabulary related to their investigations of interactions within ecosystems. Include: ecosystem, biosphere, abiotic, biotic, organisms, ecological succession, photosynthesis, cellular respiration, ecological pyramid, bioaccumulation, scavengers, decomposers, micro-organisms GLO: C6, D2
N/A
K3 7-1-01 Use appropriate vocabulary related to their investigations of interactions within ecosystems. Include: ecosystem, biosphere, abiotic, biotic, organisms, ecological succession, photosynthesis, cellular respiration, ecological pyramid, bioaccumulation, scavengers, decomposers, micro-organisms GLO: C6, D2
1-03 Identify abiotic and biotic components of ecosystems that allow particular organisms to survive. GLO: D1, D2, E2
N/A
K4 7-1-01 Use appropriate vocabulary related to their investigations of interactions within ecosystems. Include: ecosystem, biosphere, abiotic, biotic, organisms, ecological succession, photosynthesis, cellular respiration, ecological pyramid, bioaccumulation, scavengers, decomposers, micro-organisms GLO: C6, D2
General OutcomeCollect, display, and analyze data to solve problems
K5 N/A N/A
K6 7-1-01 Use appropriate vocabulary related to their investigations of interactions within ecosystems. Include: ecosystem, biosphere, abiotic, biotic, organisms, ecological succession, photosynthesis, cellular respiration, ecological pyramid, bioaccumulation, scavengers, decomposers, micro-organisms GLO: C6, D2
N/A
Other Activity
S1 -1-03 Identify abiotic and biotic components of ecosystems that allow particular organisms to survive. GLO: D1, D2, E2
N/A
S2 N/A Number7.N.2. Demonstrate an understanding of the addition, subtraction, multiplication, and division of decimals to solve problems (for more than 1-digit divisors or 2-digit multipliers, the use of technology is expected). [ME, PS, T]
7.N.6. Demonstrate an understanding of addition and subtraction of integers, concretely, pictorially, and symbolically. [C, CN, PS, R, V]
Statistics and Probability7.SP.1. Demonstrate an understanding of central tendency and range by determining the measures of central tendency (mean, median, mode) and range [C, PS, R, T]
S3 N/A N/A

APPENDICES
LEGEND: K - Key activity SUBJECT-SPECIFIC ACTIVITIES: S - Science M - Math So - Social Studies L - Language Arts
120
Activity Science Mathematics
S4 7-1-05Identify and describe positive and negative examples of human interventions that have an impact on ecological succession or the makeup of ecosystems. Examples: positive - protecting habitats, reintroducing species; negative - preventing natural fi res, introducing non-indigenous species, draining wetlands for agriculture or housingGLO: B5, D2, E2, E3
7-1-06Identify environmental, social, and economic factors that should be considered in the management and preservation of ecosystems. Examples: habitat preservation, recreation, employment, industrial growth, resource developmentGLO: B1, B5, D2, E2
7-1-12 Provide examples of scavengers and decomposers, and describe their role in cycling matter in an ecosystem. Include: micro-organism GLO: D2, E1, E2, E3
N/A
S5 N/A N/A
M1 N/A Number7.N.2. Demonstrate an understanding of the addition, subtraction, multiplication, and division of decimals to solve problems (for more than 1-digit divisors or 2-digit multipliers, the use of technology is expected). [ME, PS, T]
7.N.6. Demonstrate an understanding of addition and subtraction of integers, concretely, pictorially, and symbolically. [C, CN, PS, R, V]
Statistics and Probability7.SP.1. Demonstrate an understanding of central tendency and range by determining the measures of central tendency (mean, median, mode) and range [C, PS, R, T]
M2 N/A Statistics and Probability7.SP.1. Demonstrate an understanding of central tendency and range by determining the measures of central tendency (mean, median, mode) and range [C, PS, R, T]
M3 Analysing and Interpreting7-0-6A. Construct graphs to display data, and interpret and evaluate these and other graphs.
N/A
M4 N/A Space and Shape7.SS.3. Perform geometric constructions, including parallel line segments [CN, R, V] .
So1 N/A Refer to M4
MANITOBA (GRADE 7) PROVINCIAL CURRICULUM OUTCOMES…CONTINUED

APPENDICES
LEGEND: K - Key activity SUBJECT-SPECIFIC ACTIVITIES: S - Science M - Math So - Social Studies L - Language Arts
121
Activity Science Mathematics
So2 Nature of Science and Technology (General Learning Outcomes)A4. identify and appreciate contributions made by women and men from many societies and cultural backgrounds towards increasing our understanding of the world and in bringing about technological innovations
Science, Technology, Society and the Environment (General Learning Outcomes)B2. recognize that scientifi c and technological endeavors have been and continue to be infl uenced by human needs and the societal context of the time
Demonstrating Scientifi c and Technological Attitudes7-0-9A. Appreciate and respect that science has evolved from different views held by women and men from a variety of societies and cultural backgrounds.
N/A
So3 Science, Technology, Society and the Environment(General Learning Outcomes)B5. identify and demonstrate actions that promote a sustainable environment, society and economy, both locally and globally
Scientifi c and Technological Skills and Attitudes(General Learning Outcomes)C6. employ effective communication skills and utilize information technology to gather and share scientifi c and technological ideas and data
Researching7-0-2A. Access information using a variety of sources.
Refl ecting on Science and Technology7-0-8G. Discuss societal, environmental, and economic impacts of scientifi c and technological endeavours.
N/A
L1 Nature of Science and Technology (General Learning Outcomes)A4. identify and appreciate contributions made by women and men from many societies and cultural backgrounds towards increasing our understanding of the world and in bringing about technological innovations
Observing, Measuring, Recording7-0-5A. Make observations that are relevant to a specifi c question.
Analysing and Interpreting7-0-6A. Construct graphs to display data, and interpret and evaluate these and other graphs.
Demonstrating Scientifi c and Technological Attitudes7-0-9A. Appreciate and respect that science has evolved from different views held by women and men from a variety of societies and cultural backgrounds.
N/A
L2 Observing, Measuring, Recording7-0-5A. Make observations that are relevant to a specifi c question.
N/A
K-8 Mathematics Manitoba Curriculum Framework of Outcomes. 2008. www.edu.gov.mb.ca/k12/cur/math/framework_k-8/index.htmlGrades 5 to 8 Science: Manitoba Curriculum Framework of Outcomes www.edu.gov.mb.ca/k12/cur/science/scicurr.html
MANITOBA (GRADE 7) PROVINCIAL CURRICULUM OUTCOMES…CONTINUED

APPENDICES
LEGEND: K - Key activity SUBJECT-SPECIFIC ACTIVITIES: S - Science M - Math So - Social Studies L - Language Arts
122
MANITOBA (GRADE 8) PROVINCIAL CURRICULUM OUTCOMES
Activity Science Mathematics
Key Activity
K1 N/A N/A
K2 N/A N/A
K3 N/A N/A
K4 N/A General Outcome: Collect and analyze data to solve problems
K5 N/A N/A
K6 N/A N/A
Other Activity
S1 N/A N/A
S2 N/A Number8.N.7. Demonstrate an understanding of multiplication and division of integers, concretely, pictorially, and symbolically. [C, CN, PS, R, V]
S3 N/A N/A
S4 N/A N/A
S5 N/A N/A
M1 N/A Number8.N.7. Demonstrate an understanding of multiplication and division of integers, concretely, pictorially, and symbolically. [C, CN, PS, R, V]
M2 N/A N/A
M3 8-0-6A. Construct graphs to display data, and interpret and evaluate these and other graphs.
N/A
M4 N/A N/A
So1 N/A Refer to M4
So2 Nature of Science and Technology (General Learning Outcomes)A4. identify and appreciate contributions made by women and men from many societies and cultural backgrounds towards increasing our understanding of the world and in bringing about technological innovations
Science, Technology, Society and the Environment (General Learning Outcomes)B2. recognize that scientifi c and technological endeavors have been and continue to be infl uenced by human needs and the societal context of the time
N/A
So3 Science, Technology, Society and the Environment(General Learning Outcomes)B5. identify and demonstrate actions that promote a sustainable environment, society and economy, both locally and globally
Scientifi c and Technological Skills and Attitudes(General Learning Outcomes)C6. employ effective communication skills and utilize information technology to gather and share scientifi c and technological ideas and data
Also: Refer to S3
N/A

APPENDICES
LEGEND: K - Key activity SUBJECT-SPECIFIC ACTIVITIES: S - Science M - Math So - Social Studies L - Language Arts
123
SASKATCHEWAN (GRADE 6) PROVINCIAL CURRICULUM OUTCOMES
Activity Science Mathematics
L1 Nature of Science and Technology (General Learning Outcomes)A4. identify and appreciate contributions made by women and men from many societies and cultural backgrounds towards increasing our understanding of the world and in bringing about technological innovations
N/A
L2 N/A N/A
MANITOBA (GRADE 8) PROVINCIAL CURRICULUM OUTCOMES…CONTINUED
K-8 Mathematics Manitoba Curriculum Framework of Outcomes. 2008. http://www.edu.gov.mb.ca/k12/cur/math/framework_k-8/index.html
Activity Science Mathematics
Key Activity
K1 N/A
K2 N/A Data Management: CollectingD-1 acquire data through a. surveys, questionnaires b. experiments c. observation d. published information
K3 N/A Data Management: CollectingD-1 acquire data through a. surveys, questionnaires b. experiments c. observation d. published information
K4 N/A Data Management: CollectingD-1 acquire data through a. surveys, questionnaires b. experiments c. observation d. published information
Organizing and Displaying D-9 display data using a. histograms, line graphs (broken) b. frequency diagrams, tally c. circle graphs (fractional)
K5 N/A
K6 N/A Data Management: Summarizing and InterpretingD-14 discuss, interpret, and ascribe meaning to the organized data
Other Activity
S1 Ecosystems1.2 Identify interrelationships among the biotic and abiotic components of an ecosystem1.4 Appreciate the importance of food webs in conveying information about interrelationships in the local community2.4 Explain how living organisms cooperatively share an environment.
N/A

APPENDICES
LEGEND: K - Key activity SUBJECT-SPECIFIC ACTIVITIES: S - Science M - Math So - Social Studies L - Language Arts
124
Activity Science Mathematics
S2 N/A To be fi lled in with M1
S3 Earth’s Climate3.1 Recognize that climatic change can take place over prolonged periods of time3.3 Evaluate theories of climatic change.
N/A
S4 Inquire into the effects of change in an ecosystem.1. Identify some events that cause change.2. Examine an ecosystem that has experienced change.3. Appreciate the fragile nature of ecosystems.4. Explain how living organisms cooperatively share an environment.
N/A
S5 1.Investigate factors which infl uence an ecosystem .1.Recognize abiotic and biotic components of an ecosystem .2.Identify interrelationships among the biotic and abiotic components of an ecosystem.3.Acquire skills in estimating the population of an area.4.Appreciate the importance of food webs in conveying information about interrelationships in the local community.
2.Inquire into the effects of change in an ecosystem.1.Identify some events that cause change.2.Examine an ecosystem that has experienced change.3.Appreciate the fragile nature of ecosystems.4.Explain how living oganisms cooperatively share an environment.5.Illustrate ways that change cascades through an ecosystem.6.Identify changes that have global implications.7.Assess pressures on various populations.
3.Develop a sense of responsibility for the preservation of the ecosphere.
1.Identify direct personal links to the local ecosystem.2.Investigate the impact that humans have on ecosystems.3.Recognize the role that humans play in protecting or destroying ecosystems.4.Demonstrate actions that will ensure the health of the local ecosystem.
N/A
M1 N/A Problem Solving: UnderstandingP-1 establish and/or demonstrate an understanding of a problem by b: interpreting tables, charts, and graphs
Numbers and Operations Analysis: Whole NumbersN-16 recognize and solve a variety of problems involvinga. addition, subtraction, multiplication, or divisionmore than one operation
Numbers and Operations Analysis: Integers:N-33 represent integers by using objects, pictures, words, and symbols
N-34 recognize uses of integers in the real world
Numbers and Operations Analysis: Rational Numbers: Decimal NumbersN-59 recognize and solve problems involving operations with decimal numbers
SASKATCHEWAN (GRADE 6) PROVINCIAL CURRICULUM OUTCOMES…CONTINUED

APPENDICES
LEGEND: K - Key activity SUBJECT-SPECIFIC ACTIVITIES: S - Science M - Math So - Social Studies L - Language Arts
125
SASKATCHEWAN (GRADE 6) PROVINCIAL CURRICULUM OUTCOMES…CONTINUED
Activity Science Mathematics
M2 N/A Numbers and Operations Analysis: N-16 recognize and solve a variety of problems involving a. addition, subtraction, multiplication, or division more than one operation
Numbers and Operations Analysis: Rational Numbers: Decimal NumbersN-59 recognize and solve problems involving operations with decimal numbers
M3 Earth’s Climate1. Describe the Saskatchewan climateRecognize long-term climatic patterns.Develop a positive disposition towards lifelong learning.
Problem Solving: Refl ecting:P-11 display the results using a variety of means such as graphs, charts, or statements
M4 N/A Geometry/Measurement : Angles, Lines and Line SegmentsG/M-1 recognize, draw, name, and describe or defi ne a. parallel lines, perpendicular lines
So1 Earth’s Climate1. Describe the Saskatchewan climate.Recognize long-term climatic patterns.
Refer to M4
So2 N/A N/A
So3 Earth’s Climate1. Describe the Saskatchewan climateRecognize long-term climatic patterns.Develop a positive disposition towards lifelong learning.
N/A
L1 N/A Problem Solving: Refl ecting:P-11 display the results using a variety of means such as graphs, charts, or statements
L2 N/A N/A
Science: A Curriculum Guide for the Middle Level www.sasked.gov.sk.ca/docs/midlsci/midlsci.html September 1993Mathematics: A Curriculum Guide for the Middle Level www.sasklearning.gov.sk.ca/docs/midlmath/midmath.html 1996
SASKATCHEWAN (GRADE 7) PROVINCIAL CURRICULUM OUTCOMES
Activity Science Mathematics
Key Activity
K1 N/A N/A
K2 Basics of Life1.4 Observe and describe attributes of life in macro-organisms, both those kept in captivity and those in their natural habitats.
N/A
K3 Basics of Life2.3 Observe and describe the reactions of organisms in their natural environment.
N/A
K4 N/A N/A
K5 N/A N/A
K6 N/A N/A
Other Activity
S1 N/A N/A
S2 N/A N/A

APPENDICES
LEGEND: K - Key activity SUBJECT-SPECIFIC ACTIVITIES: S - Science M - Math So - Social Studies L - Language Arts
126
SASKATCHEWAN (GRADE 7) PROVINCIAL CURRICULUM OUTCOMES…CONTINUED
Activity Science Mathematics
S3 Basics of Life2.4 Examine how natural and human-related alterations to the local environments during the past two hundred years have changed the ability of organisms to survive.
N/A
S4 N/A N/A
S5 N/A N/A
M1 3. Temperature and HeatRecognize differences between heat and temperature.
N7.6. Demonstrate an understanding of addition and subtraction of integers, [concretely, pictorially and ] symbolically.
SP7.1. Demonstrate an understanding of central tendency and range for sets of data.
M2 N/A N7.2 Expand and demonstrate understanding of the addition, subtraction, multiplication, and division of decimals to greater numbers of decimal places, and the order of operations.
SP7.1. Demonstrate an understanding of central tendency and range for sets of data.
M3 N/A N/A
M4 N/A SS7.3 Demonstrate an understanding of 2-D relationships involving lines and angles.
So1 N/A Refer to M4
So2 N/A N/A
So3 Refer to S3 N/A
L1 Saskatchewan: The LandUnderstand and use the vocabulary and forms of expression which ecologists and geographers use to describe the environment.
N/A
L2 N/A N/A
Grade 7 Mathematics Curriculum (2007) www.sasked.gov.sk.ca/docs/math_curricula/g7_math_curr_2007.pdfScience: A Curriculum Guide for the Middle Level www.sasked.gov.sk.ca/docs/midlsci/midlsci.html September 1993
SASKATCHEWAN (GRADE 8) PROVINCIAL CURRICULUM OUTCOMES
Activity Science Mathematics
Key Activity
K1 N/A N/A
K2 N/A Data Management: CollectingD-1 acquire data through a.surveys, questionnaires b.research c.interviews D-2 recognize that the data collected are affected by a.the nature of the sample b.the method of collection c.the sample size d.biases

APPENDICES
LEGEND: K - Key activity SUBJECT-SPECIFIC ACTIVITIES: S - Science M - Math So - Social Studies L - Language Arts
127
SASKATCHEWAN (GRADE 8) PROVINCIAL CURRICULUM OUTCOMES…CONTINUED
Activity Science Mathematics
K3 Optional Unit: Plant Growth1.1 Identify factors important for plant growth.
N/A
K4 N/A
K5 Adaptation and Succession1.6 Examine the behaviours and mechanisms by which organisms make use of and coexist with the abiotic components of the ecosystem.
Data Management: CollectingD-14 discuss, interpret, and ascribe meaning to the organized data
K6 Optional Unit: Plant Growth1.1 Identify factors important for plant growth.
Data Management: CollectingD-14 discuss, interpret, and ascribe meaning to the organized data
Other Activity
S1 Adaptation and Succession1.4 Recognize energy sources and energy fl ows in the ecosystem.1.6 Examine the behaviours and mechanisms by which organisms make use of and coexist with the abiotic components of the ecosystem.1.7 Explore the behaviours and mechanisms by which organisms make use of and coexist with other biotic components of the ecosystem.
N/A
S2 N/A Math Activity 1
S3 N/A N/A
S4 Adaptation and Succession2 Examine how living things alter their environment.2.1. Find examples of succession in the ecosystems of your area.2.2 . Observe and describe the rate of environmental change.2.3. Assess how living organisms contribute to environmental change.2.4 .Evaluate the effect of succession on ecosystems.
N/A
S5 Adaptation and Succession1.5 Appreciate how abiotic factors infl uence how populations which develop.1.6. Examine the behaviours and mechanisms by which organisms make use of, and coexist with, the abiotic components of the ecosystem.1.7. Explore the behaviours and mechanisms by which organisms make use of and coexist with other biotic components of the ecosystem.2.0 Examine how living things alter their environment.2.1.Find examples of succession in the ecosystems of your area.2.2 Observe and describe the rate of environmental change.2.3. Assess how living organisms contribute to environmental change.
Optional Unit: Plant Growth1.1 Identify factors important for plant growth.
N/A

APPENDICES
LEGEND: K - Key activity SUBJECT-SPECIFIC ACTIVITIES: S - Science M - Math So - Social Studies L - Language Arts
128
Activity Science Mathematics
M1 N/A Numbers and Operations: Place Value: N-1 read, write the symbols for, read words for, and express orallyany decimal number
Numbers and Operations and Analysis: Whole NumbersN-16 recognize and solve a variety of problems involving a. more than one operation
Numbers and Operations and Analysis: IntegersN-32 recognize and solve a variety of problems involving positive and negative integers
Numbers and Operations and Analysis: Decimal NumbersN-59 recognize and solve problems involving operations with decimal numbers
M2 N/A Numbers and Operations: Place Value: N-1 read, write the symbols for, read words for, and express orallyany decimal number
N-5 round a number to the nearest a. hundred or tenth
M3 Plant Growth1. Explore the factors which infl uence plant growth.
Problem Solving: Refl ecting:P-11 display the results using a variety of means such as graphs, charts, or statements
Data Management: Summarizing and InterpretingD18 read various charts and schedules and use the information gained to solve problems
M4 N/A N/A
So1 Plant Growth1. Explore the factors which infl uence plant growth.
Refer to M4
So2 N/A N/A
So3 Adaptation and Succession1. Recognize how abiotic components of an ecosystem support and infl uence life
Plant Growth1. Explore the factors which infl uence plant growth.
Refer to S3
N/A
L1 Plant Growth1. Explore the factors which infl uence plant growth.
Problem Solving: Refl ecting:P-11 display the results using a variety of means such as graphs, charts, or statements
Data Management: Summarizing and InterpretingD18 read various charts and schedules and use the information gained to solve problems
L2 N/A N/A
SASKATCHEWAN (GRADE 8) PROVINCIAL CURRICULUM OUTCOMES…CONTINUED
Science: A Curriculum Guide for the Middle Level www.sasked.gov.sk.ca/docs/midlsci/midlsci.html September 1993Mathematics: A Curriculum Guide for the Middle Level www.sasklearning.gov.sk.ca/docs/midlmath/midmath.html 1996

APPENDICES
LEGEND: K - Key activity SUBJECT-SPECIFIC ACTIVITIES: S - Science M - Math So - Social Studies L - Language Arts
129
ALBERTA (GRADE 6) PROVINCIAL CURRICULUM OUTCOMESActivity Science Mathematics
Key Activity
K1 N/A N/A
K2 N/A N/A
K3 N/A N/A
K4 N/A Statistics and Probability (Data Analysis) General Outcome Collect, display and analyze data to solve problems. Specifi c Outcomes 1. Create, label and interpret line graphs to draw conclusions. [C, CN, PS, R, V]
K5 N/A N/A
K6 N/A N/A
Other Activity
S1 N/A N/A
S2 N/A Number2. Solve problems involving whole numbers and decimal numbers. [ME, PS, T] [ICT: C6–2.4]
7. Demonstrate an understanding of integers, concretely, pictorially and symbolically. [C, CN, R, V]
S3 N/A N/A
S4 General Learner Expectations Students will: 6–10 Describe characteristics of trees and the interaction of trees with other living things in the local environment.
Identify reasons why trees and forests are valued. Students meeting this expectation should be aware that forests serve as habitat for a variety of living things and are important to human needs for recreation, for raw materials and for a life-supporting environment.
Describe kinds of plants and animals found living on, under and among trees; and identify how trees affect and are affected by those living things.
Identify human actions that enhance or threaten the existence of forests.
Identify an issue regarding forest use, identify different perspectives on that issue, and identify actions that might be taken.
N/A
S5 N/A N/A

APPENDICES
LEGEND: K - Key activity SUBJECT-SPECIFIC ACTIVITIES: S - Science M - Math So - Social Studies L - Language Arts
130
Activity Science Mathematics
M1 N/A Number2. Solve problems involving whole numbers and decimal numbers. [ME, PS, T] [ICT: C6–2.4]
7. Demonstrate an understanding of integers, concretely, pictorially and symbolically. [C, CN, R, V]
M2 N/A N/A
M3 N/A Patterns and Relations1. Represent and describe patterns and relationships, using graphs and tables. [C, CN, ME, PS, R, V] [ICT: C6–2.3]
Statistics and Probability1. Create, label and interpret line graphs to draw conclusions. [C, CN, PS, R, V]
3. Graph collected data, and analyze the graph to solve problems. [C, CN, PS, R, T] [ICT: C6–2.5, C7–2.1, P2–2.1, P2–2.2]
7. Read and interpret graphs that are provided. [C, E, PS, R]
M4 N/A N/A
So1 N/A Refer to M4
So2 N/A
So3 Science Inquiry: Explore and Investigateidentify sources of information and ideas and demonstrate skill in accessing them. Sources may include library, classroom, community and computer-based resources
Attitudes a sense of personal and shared responsibility for actions taken
Refer to S3
N/A
L1 Science Inquiry: Refl ect and Interpret• record observations and measurements accurately, using a chart
format where appropriate. Computer resources may be used for record keeping and for display and interpretation of data progress
Patterns and Relations1. Represent and describe patterns and relationships, using graphs and tables. [C, CN, ME, PS, R, V] [ICT: C6–2.3]
Statistics and Probability7. Read and interpret graphs that are provided. [C, E, PS, R]
L2 Science Inquiry: Refl ect and Interpret• record observations and measurements accurately, using a chart
format where appropriate. Computer resources may be used for record keeping and for display and interpretation of data progress
N/A
ALBERTA (GRADE 6) PROVINCIAL CURRICULUM OUTCOMES…CONTINUED
Mathematics Kindergarten to Grade 9 Program of Studies (2007) http://education.alberta.ca/teachers/program/math/programs.aspxElementary Science. 1996 http://education.alberta.ca/teachers/program/science/programs.aspxJunior High Science 7–8–9. 2003 http://education.alberta.ca/teachers/program/science/programs.aspx

APPENDICES
LEGEND: K - Key activity SUBJECT-SPECIFIC ACTIVITIES: S - Science M - Math So - Social Studies L - Language Arts
131
ALBERTA (GRADE 7) PROVINCIAL CURRICULUM OUTCOMES
Activity Science Mathematics
Key Activity
K1 N/A N/A
K2 Interactions and Ecosystems, STSEinvestigate and interpret evidence of interaction and change (e.g., population fl uctuations, changes in weather, availability of food or introduction of new species into an ecosystem)
Skills Outcome:state a prediction and a hypothesis based on back ground information or an observed pattern of events
N/A
K3 Interactions and Ecosystems, STSEinvestigate a variety of habitats, and describe and interpret distribution patterns of living things found in those habitats (e.g., describe and compare two areas within the school grounds—a relatively undisturbed site and a site that has been affected by heavy use; describe and compare a wetland and a dry land area in a local parkland)
N/A
K4 Interactions and EcosystemsAnalyzing and interpreting compile and display data, by hand or computer, in a variety of formats, including diagrams, fl ow charts, tables, bar graphs and line graphs (e.g., illustrate a food web, based on observations made within a given environment)
Statistics and ProbabilityGeneral Outcome Collect, display and analyze data to solve problems.
K5 Interactions and Ecosystems, Performing and Recordinguse tools and apparatus effectively and accurately for collecting data (e.g., measure factors, such as temperature, moisture, light, shelter and potential sources of food, that might affect the survival and distribution of different organisms within a local environment)
N/A
K6 Interactions and Ecosystems, Analyzing and Interpreting identify strengths and weaknesses of different methods of collecting and displaying data (e.g., compare two different approaches to measuring the amount of moisture in an environment; analyze information presented by proponents on two sides of an environmental issue)
N/A
Other Activity
S1 Interactions and Ecosystems, STSEinvestigate and interpret evidence of interaction and change (e.g., population fl uctuations, changes in weather, availability of food or introduction of new species into an ecosystem)
N/A

APPENDICES
LEGEND: K - Key activity SUBJECT-SPECIFIC ACTIVITIES: S - Science M - Math So - Social Studies L - Language Arts
132
Activity Science Mathematics
S2 Performing and Recording:use tools and apparatus effectively and accurately for collecting data (e.g., measure factors, such as temperature, moisture, light, shelter and potential sources of food, that might affect the survival and distribution of different organisms within a local environment)
Number2. Solve problems involving whole numbers and decimal numbers. [ME, PS, T] [ICT: C6–2.4]
7. Demonstrate an understanding of integers, concretely, pictorially and symbolically. [C, CN, R, V]
8. Demonstrate an understanding of multiplication and division of decimals (1-digit whole number multipliers and 1-digit natural number divisors). [C, CN, ME, PS, R, V]
Statistics and Probability (Data Analysis)1. Demonstrate an understanding of central tendency and range by: • determining the measures of central tendency (mean, median,
mode) and range
S3 N/A N/A
S4 Interactions and Ecosystems, STSEdescribe human uses of plants as sources of food and raw materials, and give examples of other uses (e.g., identify uses of plants as herbs or medicines; describe plant products, and identify plant sources on which they depend) • investigate the extent of natural and managed living resources
in agricultural, horticultural, forest and grassland environments; and identify examples of local and global change (e.g., describe changes in the size of forested areas; describe changes in the characteristics of forested areas)
• investigate practical problems and issues in maintaining productive plants within sustainable environments, and identify questions for further study (e.g., investigate the long-term effects of irrigation practices or fertilizer use)
N/A
S5 N/A N/A
M1 2. Investigate life processes and structures of plants, and interpret related characteristics and needs of plants in a local environment
• investigate and interpret variations in plant structure, and relate these to different ways that plants are adapted to their environment (e.g., distinguish between plants with shallow spreading roots and those with deep taproots; describe and interpret differences in fl ower form and in the timing of fl ower production)
Number2. Solve problems involving whole numbers and decimal numbers. [ME, PS, T] [ICT: C6–2.4]
7. Demonstrate an understanding of integers, concretely, pictorially and symbolically. [C, CN, R, V]
8. Demonstrate an understanding of multiplication and division of decimals (1-digit whole number multipliers and 1-digit natural number divisors). [C, CN, ME, PS, R, V]
Statistics and Probability (Data Analysis)1. Demonstrate an understanding of central tendency and range by: • determining the measures of central tendency (mean, median,
mode) and range
ALBERTA (GRADE 7) PROVINCIAL CURRICULUM OUTCOMES…CONTINUED

APPENDICES
LEGEND: K - Key activity SUBJECT-SPECIFIC ACTIVITIES: S - Science M - Math So - Social Studies L - Language Arts
133
ALBERTA (GRADE 7) PROVINCIAL CURRICULUM OUTCOMES…CONTINUED
Activity Science Mathematics
M2 N/A Statistics and Probability (Data Analysis)1. Demonstrate an understanding of central tendency and range by: • determining the measures of central tendency (mean, median,
mode) and range
M3 Analyzing and Interpreting Analyze qualitative and quantitative data, and develop and assess possible explanations
Compile and display data, by hand or computer, in a variety of formats, including diagrams, fl ow charts, tables, bar graphs and line graphs
Communication and Teamwork Communicate questions, ideas, intentions, plans and results, using [lists, notes in point form, sentences, data tables,] graphs, [drawings], oral language and other means
Plants for Food and Fibre• investigate and interpret variations in plant structure, and
relate these to different ways that plants are adapted to their environment (e.g., distinguish between plants with shallow spreading roots and those with deep taproots; describe and interpret differences in fl ower form and in the timing of fl ower production)
N/A
M4 N/A Shape and Space
3. Perform geometric constructions, including: • perpendicular line segments • parallel line segments • perpendicular bisectors • angle bisectors. [CN, R, V]
So1 Analyze qualitative and quantitative data, and develop and assess possible explanations
Refer to M4
So2 Plants for Food and Fibre: STS and Knowledge• describe human uses of plants as sources of food and raw
materials, and give examples of other uses (e.g., identify uses of plants as herbs or medicines; describe plant products, and identify plant sources on which they depend)
Mutual RespectAppreciate that scientifi c understanding evolves from the interaction of ideas involving people with different views and backgrounds
N/A
So3 Refer to S3 N/A

APPENDICES
LEGEND: K - Key activity SUBJECT-SPECIFIC ACTIVITIES: S - Science M - Math So - Social Studies L - Language Arts
134
Activity Science Mathematics
L1 Analyzing and Interpreting
Compile and display data, by hand or computer, in a variety of formats, including diagrams, fl ow charts, tables, bar graphs and line graphs
Communication and Teamwork Communicate questions, ideas, intentions, plans and results, using [lists, notes in point form, sentences, data tables,] graphs, [drawings], oral language and other means
Plants for Food and Fibre: STS and Knowledge• describe human uses of plants as sources of food and raw
materials, and give examples of other uses (e.g., identify uses of plants as herbs or medicines; describe plant products, and identify plant sources on which they depend)
Performing and Recording• observe and record data, [and create simple line drawings]
Mutual RespectAppreciate that scientifi c understanding evolves from the interaction of ideas involving people with different views and backgrounds
N/A
L2 Performing and Recording• observe and record data, [and create simple line drawings]
N/A
ALBERTA (GRADE 7) PROVINCIAL CURRICULUM OUTCOMES…CONTINUED
Mathematics Kindergarten to Grade 9 Program of Studies (2007) http://education.alberta.ca/teachers/program/math/programs.aspxElementary Science. 1996 http://education.alberta.ca/teachers/program/science/programs.aspxJunior High Science 7–8–9. 2003 http://education.alberta.ca/teachers/program/science/programs.aspx
ALBERTA (GRADE 8) PROVINCIAL CURRICULUM OUTCOMESActivity Science Mathematics
Key Activity
K1 N/A N/A
K2 N/A N/A
K3 N/A N/A
K4 N/A Statistics and Probability (Data Analysis)General Outcome Collect, display and analyze data to solve problems.
K5 N/A N/A
K6 N/A Statistics and Probability (Data Analysis)General Outcome Collect, display and analyze data to solve problems.
Other Activ-ity
S1 N/A N/A

APPENDICES
LEGEND: K - Key activity SUBJECT-SPECIFIC ACTIVITIES: S - Science M - Math So - Social Studies L - Language Arts
135
ALBERTA (GRADE 8) PROVINCIAL CURRICULUM OUTCOMES…CONTINUED
Activity Science Mathematics
S2 N/A Number2. Demonstrate an understanding of the addition, subtraction, multiplication and division of decimals to solve problems (for more than 1-digit divisors or 2-digit multipliers, the use of technology is expected). [ME, PS, T] [ICT: P2–3.4]
7. Demonstrate an understanding of multiplication and division of integers, concretely, pictorially and symbolically. [C, CN, PS, R, V]
S3 N/A N/A
S4 N/A N/A
S5 N/A N/A
M1 N/A Number2. Demonstrate an understanding of the addition, subtraction, multiplication and division of decimals to solve problems (for more than 1-digit divisors or 2-digit multipliers, the use of technology is expected). [ME, PS, T] [ICT: P2–3.4]
7. Demonstrate an understanding of multiplication and division of integers, concretely, pictorially and symbolically. [C, CN, PS, R, V]
M2 N/A N/A
M3 Communication and Teamwork Communicate questions, ideas, intentions, plans and results, using [lists, notes in point form, sentences, data tables,] graphs, [drawings], oral language and other means
N/A
M4 N/A N/A
So1 N/A Refer to M4
So2 N/A N/A
So3 Refer to S3 N/A
L1 N/A N/A
L2 N/A N/A
Mathematics Kindergarten to Grade 9 Program of Studies (2007) http://education.alberta.ca/teachers/program/math/programs.aspxElementary Science. 1996 http://education.alberta.ca/teachers/program/science/programs.aspxJunior High Science 7–8–9. 2003 http://education.alberta.ca/teachers/program/science/programs.aspx

APPENDICES
LEGEND: K - Key activity SUBJECT-SPECIFIC ACTIVITIES: S - Science M - Math So - Social Studies L - Language Arts
136
BRITISH COLUMBIA / YUKON (GRADE 6) PROVINCIAL CURRICULUM OUTCOMES
Activity Science Mathematics
Key Activity
K1 N/A N/A
K2 Life Science: Diversity of Life analyse how different organisms adapt to their environments
Statistics and Probability: Data AnalysisD2 select, justify, and use appropriate methods of collecting data, including questionnaires experiments databases electronic media [C, PS, T]
K3 N/A N/A
K4 N/A Statistics and Probability: Data AnalysisD3 graph collected data and analyze the graph to solve problems [C, CN, PS]
K5 N/A N/A
K6 Life Science: Diversity of Life analyse how different organisms adapt to their environments N/A
N/A
Other Activity
S1 Life Science: Diversity of Life analyse how different organisms adapt to their environments
N/A
S2 N/A NumberA7 demonstrate an understanding of integers, concretely, pictorially, and symbolically [C, CN, R, V]
A8 demonstrate an understanding of multiplication and division of decimals (1-digit whole number multipliers and 1-digit natural number divisors) [C, CN, ME ,PS, R, V]
S3 N/A N/A
S4 Life Science: Diversity of Life analyse how different organisms adapt to their environments
N/A
S5 Life Science: Diversity of Life analyse how different organisms adapt to their environments
Statistics and Probability: Data AnalysisD2 select, justify, and use appropriate methods of collecting data, including questionnaires experiments databases electronic media [C, PS, T]
M1 N/A NumberA7 demonstrate an understanding of integers, concretely, pictorially, and symbolically [C, CN, R, V]
A8 demonstrate an understanding of multiplication and division of decimals (1-digit whole number multipliers and 1-digit natural number divisors) [C, CN, ME ,PS, R, V]
M2 N/A N/A
M3 N/A Patterns and RelationsB2 represent and describe patterns and relationships using graphs and tables [C, CN, ME, PS, R, V]
Statistics and Probability (Data Analysis) D1 create, label, and interpret line graphs to draw conclusions [C, CN, PS, R, V]
D3 graph collected data and analyze the graph to solve problems [C, CN, PS]

APPENDICES
LEGEND: K - Key activity SUBJECT-SPECIFIC ACTIVITIES: S - Science M - Math So - Social Studies L - Language Arts
137
BRITISH COLUMBIA / YUKON (GRADE 7) PROVINCIAL CURRICULUM OUTCOMES
Activity Science Mathematics
M4 N/A N/A
So1 N/A Refer to M4
So2 N/A N/A
So3 Refer to S3 N/A
L1 N/A Patterns and RelationsB2 represent and describe patterns and relationships using graphs and tables [C, CN, ME, PS, R, V]
Statistics and Probability (Data Analysis) D1 create, label, and interpret line graphs to draw conclusions [C, CN, PS, R, V]
L2 N/A N/A
BRITISH COLUMBIA / YUKON (GRADE 6) PROVINCIAL CURRICULUM OUTCOMES…CONTINUED
Mathematics K to 7 (2007) - Mathematics Integrated Resource Packages www.bced.gov.bc.ca/irp/irp_math.htmSciences Integrated Resource Packages Science K to 7 (2005) www.bced.gov.bc.ca/irp/irp_sci.htmSciences Integrated Resource Packages Science 8 (2006) www.bced.gov.bc.ca/irp/irp_sci.htm
Activity Science Mathematics
Key Activity
K1 N/A N/A
K2 N/A N/A
K3 Life Science: EcosystemsAnalyze the roles of organisms as part of interconnected food webs, communities and ecosystems
N/A
K4 N/A N/A
K5 N/A N/A
K6 N/A N/A
Other Activity
S1 Life Science: EcosystemsAssess survival needs and interactions between organisms and the environment
Assess the requirements for sustaining healthy local ecosystems
N/A
S2 N/A NumberA2 demonstrate an understanding of the addition, subtraction, multiplication, and division of decimals (for more than 1-digit divisors or 2-digit multipliers, the use of technology is expected) to solve problems [ME, PS, T]
A6 demonstrate an understanding of addition and subtraction of integers, concretely, pictorially, and symbolically [C, CN, PS, R, V]
Statistics and Probability (Data Analysis)D1 demonstrate an understanding of central tendency and range by determining the measures of central tendency (mean, median, mode) and range

APPENDICES
LEGEND: K - Key activity SUBJECT-SPECIFIC ACTIVITIES: S - Science M - Math So - Social Studies L - Language Arts
138
Activity Science Mathematics
S3 N/A N/A
S4 Life Science: Ecosystemsevaluate human impacts on local ecosystems
N/A
S5 Life Science: EcosystemsAssess survival needs and interactions between organisms and the environment
Assess the requirements for sustaining healthy local ecosystems
N/A
M1 N/A NumberA2 demonstrate an understanding of the addition, subtraction, multiplication, and division of decimals (for more than 1-digit divisors or 2-digit multipliers, the use of technology is expected) to solve problems [ME, PS, T]
A6 demonstrate an understanding of addition and subtraction of integers, concretely, pictorially, and symbolically [C, CN, PS, R, V]
Statistics and Probability (Data Analysis)D1 demonstrate an understanding of central tendency and range by determining the measures of central tendency (mean, median, mode) and range
M2 N/A Statistics and Probability (Data Analysis)D1 demonstrate an understanding of central tendency and range by determining the measures of central tendency (mean, median, mode) and range
M3 N/A N/A
M4 N/A 3-D Objects and 2-D Shapes C3 perform geometric constructions, including parallel line segments
So1 N/A Refer to M4
So2 N/A N/A
So3 Refer to S3 N/A
L1 N/A N/A
L2 N/A N/A
BRITISH COLUMBIA / YUKON (GRADE 7) PROVINCIAL CURRICULUM OUTCOMES…CONTINUED
Mathematics K to 7 (2007) - Mathematics Integrated Resource Packages www.bced.gov.bc.ca/irp/irp_math.htm
BRITISH COLUMBIA / YUKON (GRADE 8) PROVINCIAL CURRICULUM OUTCOMES
Activity Science Mathematics
Key Activity
K1 N/A N/A
K2 N/A N/A
K3 N/A N/A
K4 N/A N/A
K5 Processes of ScienceA8 demonstrate competence in the use of technologies specifi c to investigative procedures and research
N/A
K6 N/A N/A

APPENDICES
LEGEND: K - Key activity SUBJECT-SPECIFIC ACTIVITIES: S - Science M - Math So - Social Studies L - Language Arts
139
BRITISH COLUMBIA / YUKON (GRADE 8) PROVINCIAL CURRICULUM OUTCOMES…CONTINUED
NORTHWEST TERRITORIES / NUNAVUT (GRADE 6) PROVINCIAL CURRICULUM OUTCOMES
Activity Science Mathematics
Other Activity
S1 N/A N/A
S2 Processes of ScienceA8 demonstrate competence in the use of technologies specifi c to investigative procedures and research
A7 demonstrate an understanding of multiplication and division of integers, concretely, pictorially, and symbolically [C, CN, PS, R, V]
S3 N/A N/A
S4 Processes of ScienceA3 represent and interpret information in graphic form
N/A
S5 Processes of ScienceA3 represent and interpret information in graphic formA8 demonstrate competence in the use of technologies specifi c to investigative procedures and research
N/A
M1 N/A A7 demonstrate an understanding of multiplication and division of integers, concretely, pictorially, and symbolically [C, CN, PS, R, V]
M2 N/A N/A
M3 Processes of ScienceA3 represent and interpret information in graphic formA8 demonstrate competence in the use of technologies specifi c to investigative procedures and research
N/A
M4 A8 demonstrate competence in the use of technologies specifi c to investigative procedures and research
N/A
So1 N/A Refer to M4
So2 N/A N/A
So3 A8 demonstrate competence in the use of technologies specifi c to investigative procedures and research
Refer to S3
N/A
L1 Processes of ScienceA3 represent and interpret information in graphic form
N/A
L2 N/A N/A
Mathematics 8 and 9 (2008) - Mathematics Integrated Resource Packages www.bced.gov.bc.ca/irp/irp_math.htm
Activity Science Mathematics
Key Activity
K1 N/A N/A
K2 N/A N/A
K3 Diversity of Living ThingsCompile data gathered through investigation in order to record and present results, using charts, tables and labeled graphs produced by hand or with a computer (e.g., make an inventory of animals found in a specifi c location)
N/A

APPENDICES
LEGEND: K - Key activity SUBJECT-SPECIFIC ACTIVITIES: S - Science M - Math So - Social Studies L - Language Arts
140
Activity Science Mathematics
K4 Diversity of Living ThingsCompile data gathered through investigation in order to record and present results, using charts, tables and labeled graphs produced by hand or with a computer (e.g., make an inventory of animals found in a specifi c location)
Graph collected data and analyze the graph to solve problems. [C, CN, PS]
K5 Diversity of Living ThingsCommunicate the procedures and results of investigations for specifi c purposes and to specifi c audiences, using electronic media, oral presentations, written notes and descriptions, charts, graphs, and drawings (e.g., create a clearly labeled chart of organisms observed and identifi ed during a pond study).
Statistics and Probability: Data AnalysisSelect, justify and use appropriate methods of collecting data, including: • questionnaires • experiments • databases • electronic media. [C, PS, T]
K6 N/A N/A
Other Activity
S1 Diversity of Living ThingsCommunicate the procedures and results of investigations for specifi c purposes and to specifi c audiences, using electronic media, oral presentations, written notes and descriptions, charts, graphs, and drawings (e.g., create a clearly labeled chart of organisms observed and identifi ed during a pond study)
N/A
S2 N/A Number2. Solve problems involving whole numbers and decimal numbers. [ME, PS, T] [ICT: C6–2.4]
7. Demonstrate an understanding of integers, concretely, pictorially and symbolically. [C, CN, R, V]
S3 N/A N/A
S4 N/A N/A
S5 Diversity of Living ThingsCompile data gathered through investigation in order to record and present results, using charts, tables and labeled graphs produced by hand or with a computer (e.g., make an inventory of animals found in a specifi c location)
Statistics and Probability: Data AnalysisSelect, justify and use appropriate methods of collecting data, including: • questionnaires • experiments • databases • electronic media. [C, PS, T]
M1 N/A Number2. Solve problems involving whole numbers and decimal numbers. [ME, PS, T] [ICT: C6–2.4]
7. Demonstrate an understanding of integers, concretely, pictorially and symbolically. [C, CN, R, V]
M2 N/A N/A
NORTHWEST TERRITORIES / NUNAVUT (GRADE 6) PROVINCIAL CURRICULUM OUTCOMES…CONTINUED

APPENDICES
LEGEND: K - Key activity SUBJECT-SPECIFIC ACTIVITIES: S - Science M - Math So - Social Studies L - Language Arts
141
NORTHWEST TERRITORIES / NUNAVUT (GRADE 6) PROVINCIAL CURRICULUM OUTCOMES…CONTINUED
Activity Science Mathematics
M3 N/A Patterns and Relations1. Represent and describe patterns and relationships, using graphs and tables. [C, CN, ME, PS, R, V] [ICT: C6–2.3]
Statistics and Probability1. Create, label and interpret line graphs to draw conclusions. [C, CN, PS, R, V]
3. Graph collected data, and analyze the graph to solve problems. [C, CN, PS, R, T] [ICT: C6–2.5, C7–2.1, P2–2.1, P2–2.2]
7. Read and interpret graphs that are provided. [C, E, PS, R]
M4 N/A N/A
So1 N/A Refer to M4
So2 N/A N/A
So3 Refer to S3 N/A
L1 N/A Patterns and Relations1. Represent and describe patterns and relationships, using graphs and tables. [C, CN, ME, PS, R, V] [ICT: C6–2.3]
Statistics and Probability7. Read and interpret graphs that are provided. [C, E, PS, R]
L2 N/A N/A
The Northwest Territories and Nunavut use the Western Canadian Protocol (WCP) Mathematics, Kindergarten to Grade 12 - Lead: Alberta: The Common Curriculum Framework for K–9 Mathematics, May 2006 www.wncp.ca/english/subjectarea/mathematics/ccf.aspx
NORTHWEST TERRITORIES / NUNAVUT (GRADE 7) PROVINCIAL CURRICULUM OUTCOMESActivity Science Mathematics
Key Activity
K1 N/A N/A
K2 Interactions and Ecosystems, STSEinvestigate and interpret evidence of interaction and change (e.g., population fl uctuations, changes in weather, availability of food or introduction of new species into an ecosystem)
Skills Outcome:state a prediction and a hypothesis based on back ground information or an observed pattern of events
N/A
K3 Interactions and Ecosystems, STSEinvestigate a variety of habitats, and describe and interpret distribution patterns of living things found in those habitats (e.g., describe and compare two areas within the school grounds—a relatively undisturbed site and a site that has been affected by heavy use; describe and compare a wetland and a dry land area in a local parkland)
N/A

APPENDICES
LEGEND: K - Key activity SUBJECT-SPECIFIC ACTIVITIES: S - Science M - Math So - Social Studies L - Language Arts
142
Activity Science Mathematics
K4 Interactions and EcosystemsAnalyzing and Interpreting compile and display data, by hand or computer, in a variety of formats, including diagrams, fl ow charts, tables, bar graphs and line graphs (e.g., illustrate a food web, based on observations made within a given environment)
N/A
K5 Interactions and Ecosystems, Performing and Recordinguse tools and apparatus effectively and accurately for collecting data (e.g., measure factors, such as temperature, moisture, light, shelter and potential sources of food, that might affect the survival and distribution of different organisms within a local environment)
N/A
K6 Interactions and Ecosystems, Analyzing and Interpretingidentify strengths and weaknesses of different methods of collecting and displaying data (e.g., compare two different approaches to measuring the amount of moisture in an environment; analyze information presented by proponents on two sides of an environmental issue)
N/A
Other Activity
S1 Interactions and Ecosystems, STSEinvestigate and interpret evidence of interaction and change (e.g., population fl uctuations, changes in weather, availability of food or introduction of new species into an ecosystem)
N/A
S2 Performing and Recording:use tools and apparatus effectively and accurately for collecting data (e.g., measure factors, such as temperature, moisture, light, shelter and potential sources of food, that might affect the survival and distribution of different organisms within a local environment)
Number2. Solve problems involving whole numbers and decimal numbers. [ME, PS, T] [ICT: C6–2.4]
7. Demonstrate an understanding of integers, concretely, pictorially and symbolically. [C, CN, R, V]
8. Demonstrate an understanding of multiplication and division of decimals (1-digit whole number multipliers and 1-digit natural number divisors). [C, CN, ME, PS, R, V]
Statistics and Probability (Data Analysis)1. Demonstrate an understanding of central tendency and range by: • determining the measures of central tendency (mean, median,
mode) and range
S3 N/A N/A
S4 Interactions and Ecosystems, STSEdescribe human uses of plants as sources of food and raw materials, and give examples of other uses (e.g., identify uses of plants as herbs or medicines; describe plant products, and identify plant sources on which they depend) • investigate the extent of natural and managed living resources
in agricultural, horticultural, forest and grassland environments; and identify examples of local and global change (e.g., describe changes in the size of forested areas; describe changes in the characteristics of forested areas)
• investigate practical problems and issues in maintaining productive plants within sustainable environments, and identify questions for further study (e.g., investigate the long-term effects of irrigation practices or fertilizer use)
N/A
NORTHWEST TERRITORIES / NUNAVUT (GRADE 7) PROVINCIAL CURRICULUM OUTCOMES…CONTINUED

APPENDICES
LEGEND: K - Key activity SUBJECT-SPECIFIC ACTIVITIES: S - Science M - Math So - Social Studies L - Language Arts
143
NORTHWEST TERRITORIES / NUNAVUT (GRADE 7) PROVINCIAL CURRICULUM OUTCOMES…CONTINUED
Activity Science Mathematics
S5 N/A N/A
M1 2. Investigate life processes and structures of plants, and interpret related characteristics and needs of plants in a local environment
• investigate and interpret variations in plant structure, and relate these to different ways that plants are adapted to their environment (e.g., distinguish between plants with shallow spreading roots and those with deep taproots; describe and interpret differences in fl ower form and in the timing of fl ower production)
Number2. Solve problems involving whole numbers and decimal numbers. [ME, PS, T] [ICT: C6–2.4]
7. Demonstrate an understanding of integers, concretely, pictorially and symbolically. [C, CN, R, V]
8. Demonstrate an understanding of multiplication and division of decimals (1-digit whole number multipliers and 1-digit natural number divisors). [C, CN, ME, PS, R, V]
Statistics and Probability (Data Analysis)1. Demonstrate an understanding of central tendency and range by: • determining the measures of central tendency (mean, median,
mode) and range
M2 N/A Statistics and Probability (Data Analysis)1. Demonstrate an understanding of central tendency and range by: • determining the measures of central tendency (mean, median,
mode) and range
M3 Analyzing and Interpreting Analyze qualitative and quantitative data, and develop and assess possible explanations
Compile and display data, by hand or computer, in a variety of formats, including diagrams, fl ow charts, tables, bar graphs and line graphs
Communication and Teamwork Communicate questions, ideas, intentions, plans and results, using [lists, notes in point form, sentences, data tables,] graphs, [drawings], oral language and other means
Plants for Food and Fibre• investigate and interpret variations in plant structure, and
relate these to different ways that plants are adapted to their environment (e.g., distinguish between plants with shallow spreading roots and those with deep taproots; describe and interpret differences in fl ower form and in the timing of fl ower production)
N/A
M4 N/A Shape and Space
3. Perform geometric constructions, including: • perpendicular line segments • parallel line segments • perpendicular bisectors • angle bisectors. [CN, R, V]
So1 Analyze qualitative and quantitative data, and develop and assess possible explanations
Refer to M4

APPENDICES
LEGEND: K - Key activity SUBJECT-SPECIFIC ACTIVITIES: S - Science M - Math So - Social Studies L - Language Arts
144
Activity Science Mathematics
So2 Plants for Food and Fibre: STS and Knowledge• describe human uses of plants as sources of food and raw
materials, and give examples of other uses (e.g., identify uses of plants as herbs or medicines; describe plant products, and identify plant sources on which they depend)
Mutual RespectAppreciate that scientifi c understanding evolves from the interaction of ideas involving people with different views and backgrounds
N/A
So3 Refer to S3 N/A
L1 Analyzing and Interpreting
Compile and display data, by hand or computer, in a variety of formats, including diagrams, fl ow charts, tables, bar graphs and line graphs
Communication and Teamwork Communicate questions, ideas, intentions, plans and results, using [lists, notes in point form, sentences, data tables,] graphs, [drawings], oral language and other means
Plants for Food and Fibre: STS and Knowledge• describe human uses of plants as sources of food and raw
materials, and give examples of other uses (e.g., identify uses of plants as herbs or medicines; describe plant products, and identify plant sources on which they depend)
Performing and Recording• observe and record data, [and create simple line drawings]
Mutual RespectAppreciate that scientifi c understanding evolves from the interaction of ideas involving people with different views and backgrounds
N/A
L2 Performing and Recording• observe and record data, [and create simple line drawings]
N/A
NORTHWEST TERRITORIES / NUNAVUT (GRADE 7) PROVINCIAL CURRICULUM OUTCOMES…CONTINUED
The Northwest Territories and Nunavut use the Western Canadian Protocol (WCP) Mathematics, Kindergarten to Grade 12 - Lead: Alberta: The Common Curriculum Framework for K–9 Mathematics, May 2006 www.wncp.ca/english/subjectarea/mathematics/ccf.aspx Alberta Junior High Science 7–8–9. 2003 http://education.alberta.ca/teachers/program/science/programs.aspx

APPENDICES
LEGEND: K - Key activity SUBJECT-SPECIFIC ACTIVITIES: S - Science M - Math So - Social Studies L - Language Arts
145
NORTHWEST TERRITORIES / NUNAVUT (GRADE 8) PROVINCIAL CURRICULUM OUTCOMESActivity Science Mathematics
Key Activity
K1 N/A N/A
K2 N/A N/A
K3 N/A N/A
K4 N/A N/A
K5 N/A N/A
K6 N/A N/A
Other Activity
S1 N/A N/A
S2 N/A Number2. Demonstrate an understanding of the addition, subtraction, multiplication and division of decimals to solve problems (for more than 1-digit divisors or 2-digit multipliers, the use of technology is expected). [ME, PS, T] [ICT: P2–3.4]
7. Demonstrate an understanding of multiplication and division of integers, concretely, pictorially and symbolically. [C, CN, PS, R, V]
S3 N/A N/A
S4 N/A N/A
S5 N/A N/A
M1 N/A Number2. Demonstrate an understanding of the addition, subtraction, multiplication and division of decimals to solve problems (for more than 1-digit divisors or 2-digit multipliers, the use of technology is expected). [ME, PS, T] [ICT: P2–3.4]
7. Demonstrate an understanding of multiplication and division of integers, concretely, pictorially and symbolically. [C, CN, PS, R, V]
M2 N/A N/A
M3 Communication and Teamwork Communicate questions, ideas, intentions, plans and results, using [lists, notes in point form, sentences, data tables,] graphs, [drawings], oral language and other means
N/A
M4 N/A N/A
So1 N/A Refer to M4
So2 N/A N/A
So3 Refer to S3 N/A
L1 N/A N/A
L2 N/A N/A
The Northwest Territories and Nunavut use the Western Canadian Protocol (WCP) Mathematics, Kindergarten to Grade 12 - Lead: Alberta: The Common Curriculum Framework for K–9 Mathematics, May 2006 www.wncp.ca/english/subjectarea/mathematics/ccf.aspxAlberta Junior High Science 7–8–9. 2003 http://education.alberta.ca/teachers/program/science/programs.aspx

APPENDICES
146
Notes

APPENDICES
147
Notes

www.PlantWatch.ca
PlantWatchTeacher’s Guide