giant buttercup (ranunculus acris) management in dairy...
TRANSCRIPT

1
Giant buttercup (Ranunculus acris) management in dairy pastures – profitability of control
Author: Warren King & Grant Rennie
Date: 29 March 2011
Report for: Giant Buttercup Management Group
Client report number: SC110/2011/211
CONTENTS
1. EXECUTIVE SUMMARY ............................................................................................. 3
2. BACKGROUND............................................................................................................ 4
3. METHODS ................................................................................................................... 4
3.1 Development of base models .................................................................................... 5
3.2 Incorporation of giant buttercup effects in model....................................................... 5
3.3 Herbicide application .................................................................................................. 9
3.4 Modelling of clover loss following herbicide application. ........................................... 9
4. RESULTS AND DISCUSSION .................................................................................. 10
4.1 Effect of giant buttercup on farm profitability ........................................................... 10
4.2 Herbicide control of giant buttercup ......................................................................... 11
5. ACKNOWLEDGEMENTS .......................................................................................... 11
6. REFERENCES ........................................................................................................... 11
7. APPENDIX I ............................................................................................................... 13
8. APPENDIX II .............................................................................................................. 15
The information in this Report is based on current knowledge and is provided by AgResearch Limited without guarantee. The research, investigation and/or analysis undertaken by AgResearch Limited was completed using generally accepted standards and techniques of testing, research and verification.
This Confidential Report has been completed and compiled for the purpose of providing information to AgResearch Limited clients, however, no guarantee expressed or implied is made by AgResearch Limited as to the results obtained, nor can AgResearch Limited or any of our employees accept any liability arising directly or indirectly from the use of the information contained herein.
The fact that proprietary product names are used in no way implies that there are no substitutes which may be of equal or superior value.
This Report remains the property of AgResearch Limited and reproduction of the Report other than with the specific consent in writing of AgResearch Limited is hereby deemed to be a breach of the Copyright Act 1962. AgResearch Limited Confidential Reports and AgResearch Limited Client Reports may not be cited or referenced in open publications.

3
1. EXECUTIVE SUMMARY
AgResearch has been contracted by Dairy NZ (Schedule number OF1001) to determine the effect of giant buttercup, and its control, on the profitability of a dairy farm. This analysis is part of a larger project aimed at providing options for dairy farmers to achieve control of this weed.
A series of 14 FarmaxDairyPro® models was developed to examine the effect of giant buttercup on whole-farm profitability and the impact of herbicide application (with variable efficacy) including a mycoherbicide.
The key findings are:
o The presence of giant buttercup significantly constrains profitability. On the „typical‟ farm modelled, with giant buttercup cover peaking at 12% in November, profit was $1040 per hectare less than where giant buttercup was absent: $1830 vs $2870.
o The use of herbicides to control giant buttercup has a positive effect on
profitability but only where the „kill‟ (reduction in % ground cover of the buttercup) is better than ~30% with MCPA or ~60% with Preside.
o Modelling the effects of a mycoherbicide with a hypothetical 50% kill of
giant buttercup suggests that profitability improves by $485/ha.
This report should be read along with the others from the project (Bourdôt 2011; Hurrell & Bourdôt 2011) as a basis for discussions on how to manage giant buttercup on dairy farms in the Golden Bay region.

4
2. BACKGROUND The Giant Buttercup Management Group, based in Takaka, was successful in securing an On Farm Innovation Fund Grant from Dairy NZ in 2010 (Schedule number OF1001) to conduct “Stage One” of a project on giant buttercup in dairy pastures. Stage One will identify options for controlling the weed, including the economics of doing so, and thereby provide the foundation for “Stage Two” which will evaluate the options and develop best management practice.
The objective of the project overall is to provide dairy farmers with tools and information enabling them to return dairy pastures affected by the weed giant buttercup (Ranunuculus acris) to full grass production. To this end Stage One of the project aims to:
1. further develop the biological “mycoherbicide” methodology to a stage where it offers an effective and readily available product, and
2. collate information about existing and potential new chemical control options and deliver these options to farmers as clear and freely available information.
3. quantify the economic benefit from control of giant buttercup on a dairy farm.
The current report fulfils the requirements of (3) above, and specifically, as per the agreement with Dairy NZ, provides an analysis of “The profitability of controlling giant buttercup in infested dairy pasture ....using the dairy farm model, FarmaxDairyPro. This analysis will be based on giant buttercup cover and control costs on representative dairy farms in Golden Bay”
3. METHODS The approach adopted in this analysis was to first construct a „base‟ model of a „typical‟ farm affected by giant buttercup and then develop a range of models to explore scenarios around this. The models were constructed in FarmaxDairyPro
® (see www.farmax.co.nz),
which requires detailed information on the farm system, including pasture, forage and other supplementary inputs as well as animal enterprise information and milk production figures. The models explicitly consider the costs of the inputs and outputs so that the profitability of a given farm system can be calculated. Following development of this base model, 12 further scenarios were developed around giant buttercup impact and the application of a range of herbicides (including a bioherbicide); profitability of each farm system can then be compared.
The farm chosen as the basis from which the first model was developed was Waterford Farm, near Takaka, owned by Greg Fellowes. This property is considered by the Giant Buttercup Management Group (of which Greg is a member) to be reasonably representative of the farms in the area that are affected by giant buttercup. The level of infestation of this property was assessed by AgResearch staff in November 2010 – giant buttercup was present in nearly every paddock and the average cover was 11.8%. Individual paddock data was recorded (see Appendix 1) but it is important to note that the farm was modelled as a single block.

5
3.1 Development of base models The farm was visited by Warren King and Graeme Bourdôt on December 14
th 2010 and
Greg Fellowes was interviewed to obtain details of his farm enterprise. Physical descriptions of the farm were also recorded, along with other data such as fertiliser application and milk production for the last three years. This information was used to develop the first simulation model (Table 1: „TakakaBase‟) and was a reasonably accurate depiction of Waterford Farm.
There were, however, some particular features of this farm that we considered might interact negatively with the development and interpretation of scenarios. Analysis of the TakakaBase model suggested that, with the silage cuts and maize supplementation as specified, both feed shortages and surpluses were likely to occur in late spring. In addition, the Body Condition Score of the dry stock was unreasonably high and the pattern of milk production atypical. Since this model was to be used as the basis for all further model development, some generalisation was undertaken. The resultant model („TakakaBaseOptimised‟) is essentially the same as TakakaBase but with the changes noted below. TakakaBaseOptimised should be considered typical of farms in the area but not strictly representative of any particular farm. The pattern of pasture growth through the year closely resembles that recorded during 10 years of pasture growth measurement by DairyNZ at Takaka (see http://www.dairynz.co.nz/file/fileid/33418).
3.2 Incorporation of giant buttercup effects in model The TakakaBaseOptimised model does not explicitly recognise the impact of giant buttercup. The approach adopted to include this effect was to:
1) Reduce Pasture Utilisation in the model in line with the data of Bourdôt et al. (2003). That is, Pasture Utilisation was reduced by the actual cover of giant buttercup (in this case, 12%) multiplied by either 1.1 (Model 3) or 1.25 (Model 5). This incorporates the grazing aversion of giant buttercup determined by Bourdôt et al. (2003), which was 25% greater than that expected from cover alone (×1.25), as well as a more conservative approach, 1.1 to test the sensitivity of the model to this assumption.
2) Pasture Growth was then increased in the model to make the farm system „feasible‟ and produce the appropriate volume of milk.
The Pasture Utilisation values used in the model varied by month (Table 2) to reflect the seasonal growth pattern of giant buttercup (Appendix II). For example, the calculation outlined above, for a nominal 12% giant buttercup cover, resulted in a 13.2% (12*1.1) reduction in Pasture Utilisation in November at the peak of giant buttercup abundance (87=100-13) and was scaled back in other months according to the pattern detailed in Bourdôt et al. (2003) (Appendix II).

6
Table 1. Description of the FarmaxDairyPro® models developed for evaluating the
profitability of controlling giant buttercup (Ranunculus acris) on a dairy farm
Scenario/Model Number
Scenario/ Model name
General description
TakakaBase Base farm as described by farmer
1 TakakaBaseOptimised
Base model generalised to be representative – approx System 2/3 (moderate intensity; see http://www.dairynz.co.nz/page/pageid/2145861231/The_5_Production_Systems)
2 TakakaGB10 Takaka farm with 12% giant buttercup and 10% extra grazing aversion
3 TakakaGB10 NoGB
Value of removing buttercup
4 TakakaGB25 Takaka farm with 12% giant buttercup and 25% extra grazing aversion
5 TakakaGB25 NoGB
Value of removing giant buttercup
6 TakakaGB25 NoGB + 15 cows
Using a 5% increase in cow numbers to eat the extra grass grown
7 TakakaGB25 NoGB + 29 cows
Using a 10% increase in cow numbers to eat the extra grass grown
8 MCPA GB25 100% kill
Using MCPA to reduce giant buttercup
9 MCPA GB25 50% kill
Losing the ability to use MCPA to reduce giant buttercup
10 MCPA GB25 10% kill
Lost the ability to use MCPA to reduce giant buttercup
11 Preside GB25 100% kill
Using Preside to remove giant buttercup
12 Preside GB25 50% kill
Losing the ability to use preside to remove giant buttercup
13 Myco GB25 50% kill
Using a mycoherbicide to reduce giant buttercup
Notes on each scenario:
1. TakakaBaseOptimised: Start point: TakakaBase. Milk production profile was modified to give more of a milk peak during the start of the season. Removed a silage crop and moved another to reduce the feed shortage in late spring. Removed spring maize supplementation – there was enough grass at this time of year. Reduced some end-of-season supplementation to more typical amounts. Reduced Body Condition Score in the dry animals to more typical values by reducing supplementation. Reconciled the supplements, reduced the growth rate slightly from the Farmax Takaka default growth rate. This has resulted in a model that is closer to that of a „typical‟ Takaka dairy farm system.
2. TakakaGB10: Start point: TakakaBaseOptimised. Modelling the pasture lost with giant buttercup present by reducing the pasture able to be eaten. Pasture grown is then increased to ensure the current milk production is achieved. Pasture Utilisation in the model was decreased to the “12% GB with 10% aversion” profile (Table 2). Then, Pasture Offered was increased to return milk production to the level of TakakaBaseOptimised. Pasture Growth was then increased using the “Modify Tool” to make model „feasible‟ again (i.e.
7
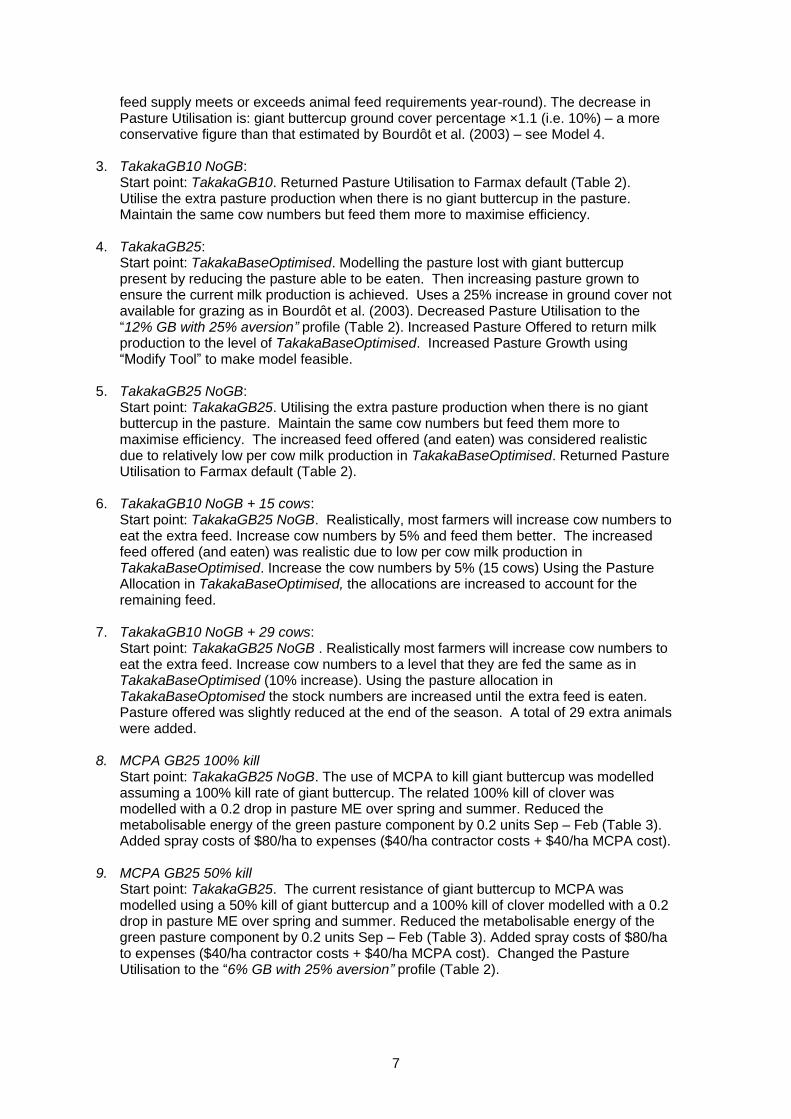
feed supply meets or exceeds animal feed requirements year-round). The decrease in Pasture Utilisation is: giant buttercup ground cover percentage ×1.1 (i.e. 10%) – a more conservative figure than that estimated by Bourdôt et al. (2003) – see Model 4.
3. TakakaGB10 NoGB: Start point: TakakaGB10. Returned Pasture Utilisation to Farmax default (Table 2). Utilise the extra pasture production when there is no giant buttercup in the pasture. Maintain the same cow numbers but feed them more to maximise efficiency.
4. TakakaGB25: Start point: TakakaBaseOptimised. Modelling the pasture lost with giant buttercup present by reducing the pasture able to be eaten. Then increasing pasture grown to ensure the current milk production is achieved. Uses a 25% increase in ground cover not available for grazing as in Bourdôt et al. (2003). Decreased Pasture Utilisation to the “12% GB with 25% aversion” profile (Table 2). Increased Pasture Offered to return milk production to the level of TakakaBaseOptimised. Increased Pasture Growth using “Modify Tool” to make model feasible.
5. TakakaGB25 NoGB: Start point: TakakaGB25. Utilising the extra pasture production when there is no giant buttercup in the pasture. Maintain the same cow numbers but feed them more to maximise efficiency. The increased feed offered (and eaten) was considered realistic due to relatively low per cow milk production in TakakaBaseOptimised. Returned Pasture Utilisation to Farmax default (Table 2).
6. TakakaGB10 NoGB + 15 cows: Start point: TakakaGB25 NoGB. Realistically, most farmers will increase cow numbers to eat the extra feed. Increase cow numbers by 5% and feed them better. The increased feed offered (and eaten) was realistic due to low per cow milk production in TakakaBaseOptimised. Increase the cow numbers by 5% (15 cows) Using the Pasture Allocation in TakakaBaseOptimised, the allocations are increased to account for the remaining feed.
7. TakakaGB10 NoGB + 29 cows: Start point: TakakaGB25 NoGB . Realistically most farmers will increase cow numbers to eat the extra feed. Increase cow numbers to a level that they are fed the same as in TakakaBaseOptimised (10% increase). Using the pasture allocation in TakakaBaseOptomised the stock numbers are increased until the extra feed is eaten. Pasture offered was slightly reduced at the end of the season. A total of 29 extra animals were added.
8. MCPA GB25 100% kill Start point: TakakaGB25 NoGB. The use of MCPA to kill giant buttercup was modelled assuming a 100% kill rate of giant buttercup. The related 100% kill of clover was modelled with a 0.2 drop in pasture ME over spring and summer. Reduced the metabolisable energy of the green pasture component by 0.2 units Sep – Feb (Table 3). Added spray costs of $80/ha to expenses ($40/ha contractor costs + $40/ha MCPA cost).
9. MCPA GB25 50% kill Start point: TakakaGB25. The current resistance of giant buttercup to MCPA was modelled using a 50% kill of giant buttercup and a 100% kill of clover modelled with a 0.2 drop in pasture ME over spring and summer. Reduced the metabolisable energy of the green pasture component by 0.2 units Sep – Feb (Table 3). Added spray costs of $80/ha to expenses ($40/ha contractor costs + $40/ha MCPA cost). Changed the Pasture Utilisation to the “6% GB with 25% aversion” profile (Table 2).

8
10. MCPA GB25 10% kill
Start point: TakakaGB25. The potential resistance of giant buttercup to MCPA was modelled using a 10% kill of giant buttercup and a 100% kill of clover modelled with a 0.2 drop in pasture ME over spring and summer.Reduced the metabolisable energy of the green pasture component by 0.2 units Sep – Feb (Table 3). Added spray costs of $80/ha to expenses ($40/ha contractor costs + $40/ha MCPA cost). Changed the Pasture Utilisation to the “10.8% GB with 25% aversion” profile (Table 2).
11. Preside GB25 100% kill Start point: TakakaGB25 NoGB. The use of Preside to kill giant buttercup was modelled using a 100% kill of giant buttercup and a lower (20%) kill of clover modelled with a 1% drop in pasture ME during spring. Reduced the metabolisable energy of the green pasture component by 0.1 units Sep – Nov (Table 3). Added spray costs of $117/ha to expenses ($40/ha contractor costs + $77/ha Preside and uptake oil cost).
12. Preside GB25 50% kill Start point: TakakaGB25 NoGB. The potential resistance of giant buttercup to Preside was modelled using a 50% kill rate of giant buttercup and a lower (20%) kill of clover modelled with a 1% drop in pasture ME during spring. Changed the Pasture Utilisation to the “6% GB with 25% aversion” profile (Table 2). Reduced the metabolisable energy of the green pasture component by 0.1 units Sep – Nov (Table 3). Added spray costs of $117/ha to expenses ($40/ha contractor costs + $77/ha Preside and uptake oil cost).
13. Myco GB25 50% kill Start point: TakakaGB25 NoGB. Assuming a mycoherbicide would have a 50% kill of giant buttercup (Bourdôt et al. 2007), no effect on clover and would have a contractor cost similar to the spraying of a herbicide ($40/ha) this model shows the benefits of use (not including the cost of the product). Changed the Pasture Utilisation to the “6% GB with 25% aversion” profile (Table 2). Add $40/ha to expenses for spraying costs.
9
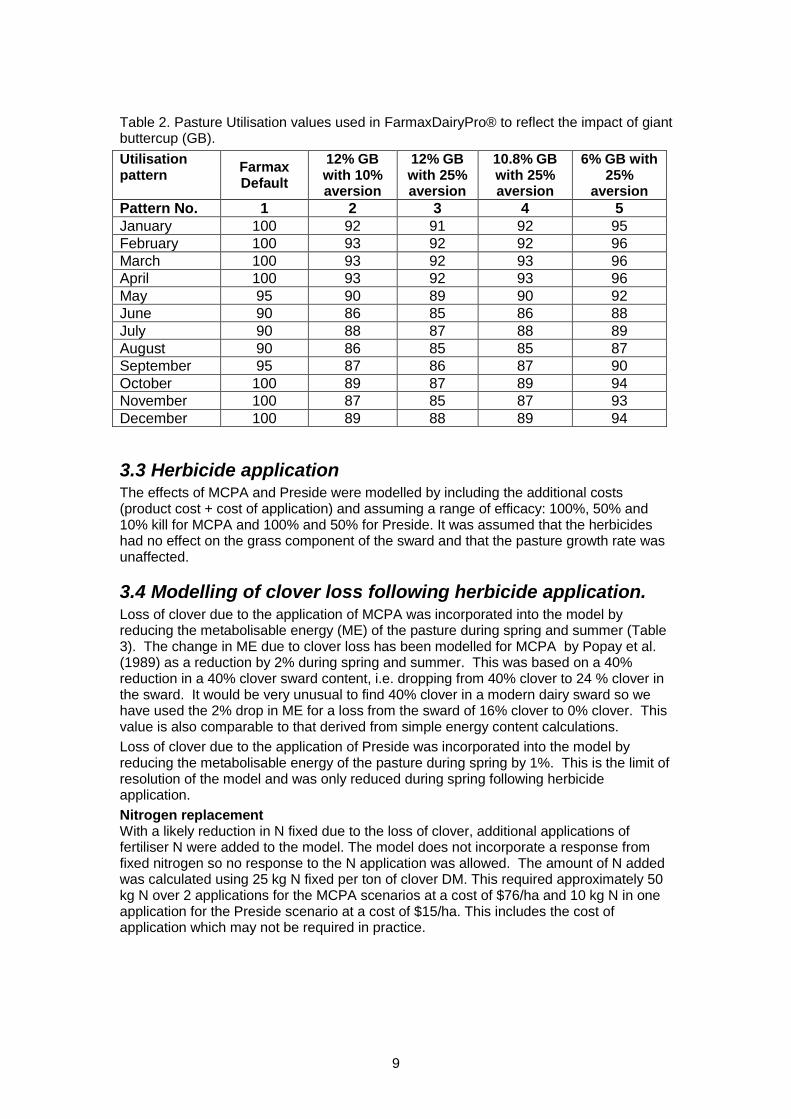
Table 2. Pasture Utilisation values used in FarmaxDairyPro® to reflect the impact of giant buttercup (GB).
Utilisation pattern
Farmax Default
12% GB with 10% aversion
12% GB with 25% aversion
10.8% GB with 25% aversion
6% GB with 25%
aversion
Pattern No. 1 2 3 4 5
January 100 92 91 92 95
February 100 93 92 92 96
March 100 93 92 93 96
April 100 93 92 93 96
May 95 90 89 90 92
June 90 86 85 86 88
July 90 88 87 88 89
August 90 86 85 85 87
September 95 87 86 87 90
October 100 89 87 89 94
November 100 87 85 87 93
December 100 89 88 89 94
3.3 Herbicide application The effects of MCPA and Preside were modelled by including the additional costs (product cost + cost of application) and assuming a range of efficacy: 100%, 50% and 10% kill for MCPA and 100% and 50% for Preside. It was assumed that the herbicides had no effect on the grass component of the sward and that the pasture growth rate was unaffected.
3.4 Modelling of clover loss following herbicide application. Loss of clover due to the application of MCPA was incorporated into the model by reducing the metabolisable energy (ME) of the pasture during spring and summer (Table 3). The change in ME due to clover loss has been modelled for MCPA by Popay et al. (1989) as a reduction by 2% during spring and summer. This was based on a 40% reduction in a 40% clover sward content, i.e. dropping from 40% clover to 24 % clover in the sward. It would be very unusual to find 40% clover in a modern dairy sward so we have used the 2% drop in ME for a loss from the sward of 16% clover to 0% clover. This value is also comparable to that derived from simple energy content calculations.
Loss of clover due to the application of Preside was incorporated into the model by reducing the metabolisable energy of the pasture during spring by 1%. This is the limit of resolution of the model and was only reduced during spring following herbicide application.
Nitrogen replacement With a likely reduction in N fixed due to the loss of clover, additional applications of fertiliser N were added to the model. The model does not incorporate a response from fixed nitrogen so no response to the N application was allowed. The amount of N added was calculated using 25 kg N fixed per ton of clover DM. This required approximately 50 kg N over 2 applications for the MCPA scenarios at a cost of $76/ha and 10 kg N in one application for the Preside scenario at a cost of $15/ha. This includes the cost of application which may not be required in practice.
10
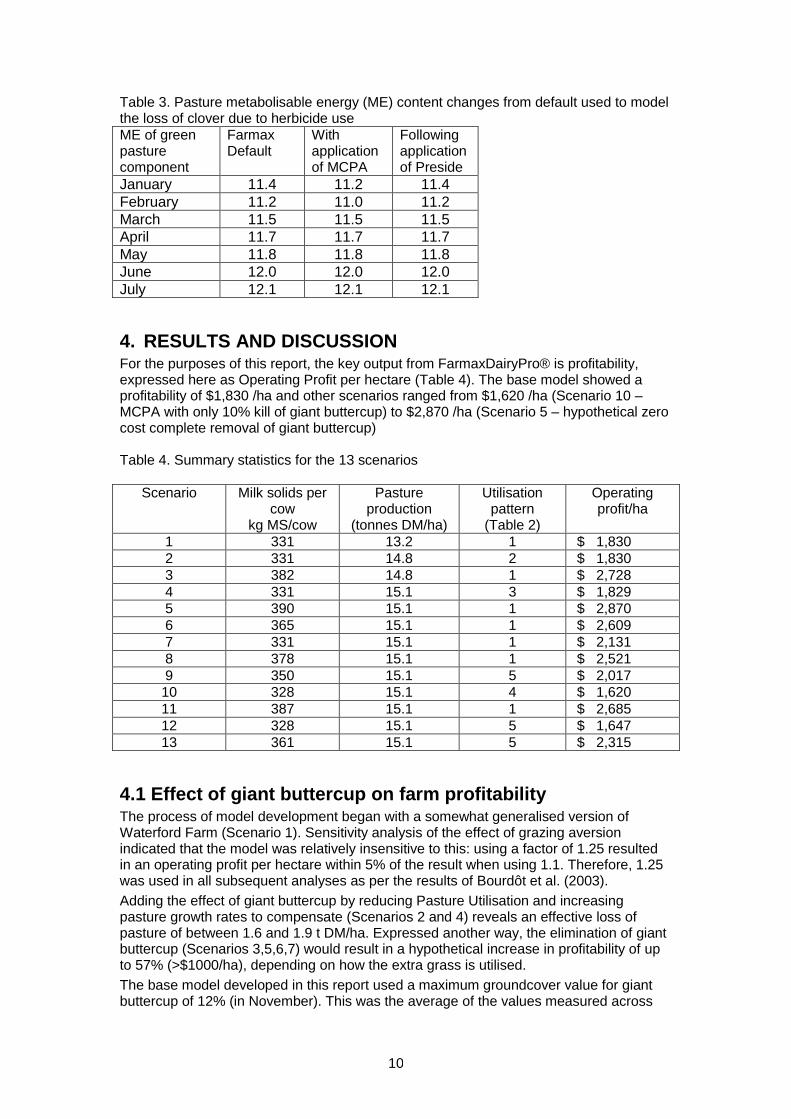
Table 3. Pasture metabolisable energy (ME) content changes from default used to model the loss of clover due to herbicide use
ME of green pasture component
Farmax Default
With application of MCPA
Following application of Preside
January 11.4 11.2 11.4
February 11.2 11.0 11.2
March 11.5 11.5 11.5
April 11.7 11.7 11.7
May 11.8 11.8 11.8
June 12.0 12.0 12.0
July 12.1 12.1 12.1
4. RESULTS AND DISCUSSION For the purposes of this report, the key output from FarmaxDairyPro® is profitability, expressed here as Operating Profit per hectare (Table 4). The base model showed a profitability of $1,830 /ha and other scenarios ranged from $1,620 /ha (Scenario 10 – MCPA with only 10% kill of giant buttercup) to $2,870 /ha (Scenario 5 – hypothetical zero cost complete removal of giant buttercup) Table 4. Summary statistics for the 13 scenarios
Scenario Milk solids per cow
kg MS/cow
Pasture production
(tonnes DM/ha)
Utilisation pattern
(Table 2)
Operating profit/ha
1 331 13.2 1 $ 1,830 2 331 14.8 2 $ 1,830 3 382 14.8 1 $ 2,728 4 331 15.1 3 $ 1,829 5 390 15.1 1 $ 2,870 6 365 15.1 1 $ 2,609 7 331 15.1 1 $ 2,131 8 378 15.1 1 $ 2,521 9 350 15.1 5 $ 2,017 10 328 15.1 4 $ 1,620 11 387 15.1 1 $ 2,685 12 328 15.1 5 $ 1,647 13 361 15.1 5 $ 2,315
4.1 Effect of giant buttercup on farm profitability The process of model development began with a somewhat generalised version of Waterford Farm (Scenario 1). Sensitivity analysis of the effect of grazing aversion indicated that the model was relatively insensitive to this: using a factor of 1.25 resulted in an operating profit per hectare within 5% of the result when using 1.1. Therefore, 1.25 was used in all subsequent analyses as per the results of Bourdôt et al. (2003).
Adding the effect of giant buttercup by reducing Pasture Utilisation and increasing pasture growth rates to compensate (Scenarios 2 and 4) reveals an effective loss of pasture of between 1.6 and 1.9 t DM/ha. Expressed another way, the elimination of giant buttercup (Scenarios 3,5,6,7) would result in a hypothetical increase in profitability of up to 57% (>$1000/ha), depending on how the extra grass is utilised.
The base model developed in this report used a maximum groundcover value for giant buttercup of 12% (in November). This was the average of the values measured across

11
each paddock on the farm (APPENDIX I). Bourdôt et al. (2003) reported giant buttercup groundcovers measured in 10 paddocks in the Takaka district over 2-5 years in the late 1980s averaging 20%. These measurements were made in May when we assume giant buttercup to be at only 40% of its maximum (APPENDIX II). By comparison, the Waterford Farm would have a giant buttercup groundcover of around 5% in May (40% of the 12% November peak). It appears therefore that Waterford Farm may not be as affected by giant buttercup as other farms in the district, although perhaps not by as much as the 15% (20%-5%) suggested here since the 20% was measured on the untreated control plots of herbicide comparison experiments in which the sites were selected for uniformity of cover rather than at random on each farm (Bourdôt & Hurrell 1990).
4.2 Herbicide control of giant buttercup The reality of herbicidal control of giant buttercup includes a variable kill of the target, collateral clover damage and the cost of product and application. Use of both MCPA and Preside improve profitability if the kill is 100% (Scenarios 8, 11). At 50% kill however, MCPA use still improves profitability but the use of Preside is not supported (Scenarios 9, 12). Using a 10% kill of giant buttercup with MCPA to represent the development of herbicide resistance (Scenario 10) results in the least profitable scenario, nearly $200/ha less than the base scenario in which no attempt is made to control the buttercup. The „break-even‟ points of these herbicides with respect to their efficacy can also be calculated: a 31% kill for MCPA and a 59% kill for Preside. Finally, the use of a putative mycoherbicide with a 50% kill (Scenario 13) results in an increase in profitability of $485 /ha (29%) from the base scenario. Given that the cost of the mycoherbicide itself was not included in the model (only the cost of application), this suggested that mycoherbicide use would be profitability-positive provided that the cost of the product is less than $485/ha.
5. ACKNOWLEDGEMENTS We thank Dairy NZ for funding this work under the On Farm Innovation Fund scheme and the members of the Giant Buttercup Management Group for frank and helpful discussion. Special thanks to Greg Fellowes, who was a gracious host under persistent questioning. Jeremy Bryant provided very useful feedback during model development. We thank also, Geoff Hurrell and Carrie Lusk, AgResearch, Lincoln, for securing the estimates of pasture area covered by giant buttercup on the study dairy farm owned by Greg Fellowes.
6. REFERENCES Bourdôt GW 2011. Giant buttercup (Ranunculus acris) management in dairy pastures -
herbicides. Lincoln, AgResearch. Pp. 17 Bourdôt GW, Hurrell GA 1990. Effects of annual treatments of MCPA and MCPB on giant
buttercup (Ranunculus acris L.) in dairy pastures. Proceedings of the 43rd New Zealand Weed and Pest Control Conference. Pp. 233-236.
Bourdôt GW, Hurrell GA, Saville D 2007. Variation in the efficacy of a mycoherbicide and two synthetic herbicide alternatives. XII th International Symposium on Biological Control of Weeds. Pp. 507-511.
Bourdôt GW, Saville DJ, Crone D 2003. Dairy production revenue losses in New Zealand due to giant buttercup (Ranunculus acris). New Zealand Journal of Agricultural Research 46: 295-303.
Hurrell GA, Bourdôt GW 2011. Giant buttercup (Ranunculus acris) management in dairy pastures - Sclerotinia sclerotiorum as a mycoherbicide. Lincoln, AgResearch. Pp. 25

12
Popay AI, Barlow ND, Bourdôt GW 1989. Economics of controlling Ranunculus acris in New Zealand dairy pastures. Brighton Crop Protection Conference - Weeds. Pp. 943-948.
13
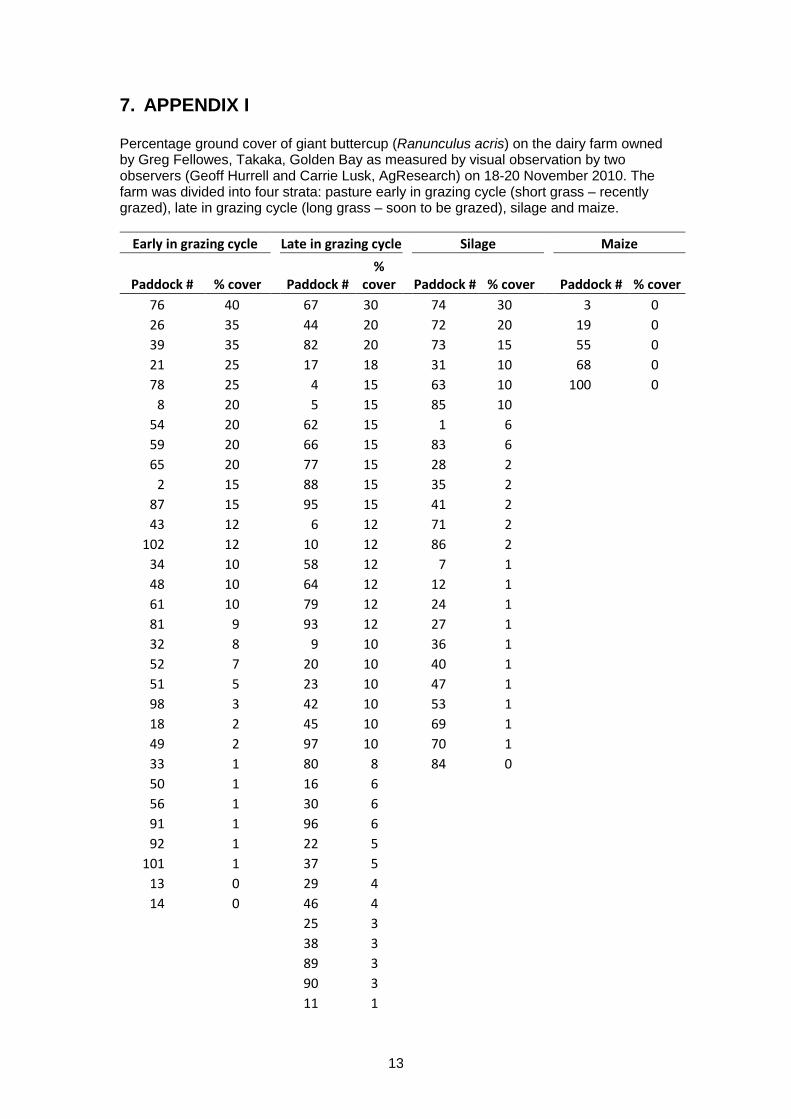
7. APPENDIX I Percentage ground cover of giant buttercup (Ranunculus acris) on the dairy farm owned by Greg Fellowes, Takaka, Golden Bay as measured by visual observation by two observers (Geoff Hurrell and Carrie Lusk, AgResearch) on 18-20 November 2010. The farm was divided into four strata: pasture early in grazing cycle (short grass – recently grazed), late in grazing cycle (long grass – soon to be grazed), silage and maize.
Early in grazing cycle Late in grazing cycle Silage Maize
Paddock # % cover Paddock # %
cover Paddock # % cover Paddock # % cover
76 40
67 30
74 30
3 0
26 35
44 20
72 20
19 0
39 35
82 20
73 15
55 0
21 25
17 18
31 10
68 0
78 25
4 15
63 10
100 0
8 20
5 15
85 10 54 20
62 15
1 6
59 20
66 15
83 6 65 20
77 15
28 2
2 15
88 15
35 2 87 15
95 15
41 2
43 12
6 12
71 2 102 12
10 12
86 2
34 10
58 12
7 1 48 10
64 12
12 1
61 10
79 12
24 1 81 9
93 12
27 1
32 8
9 10
36 1 52 7
20 10
40 1
51 5
23 10
47 1 98 3
42 10
53 1
18 2
45 10
69 1 49 2
97 10
70 1
33 1
80 8
84 0 50 1
16 6
56 1
30 6 91 1
96 6
92 1
22 5 101 1
37 5
13 0
29 4 14 0
46 4
25 3
38 3
89 3
90 3
11 1

14
Early in grazing cycle Late in grazing cycle Silage Maize
15 1
57 1
94 1
99 1
60 0
75 0
Mean % cover 11.8 9.2 5.3 0.0
Min % cover 0
0
0
0
Max % cover 40
30
30
0
SD % cover 11
7
7
0
# paddocks 31
42
24
5 % paddocks infested 94 95 96 0

15
8. APPENDIX II The annual pattern in the % ground cover of giant buttercup (R. acris) in dairy pasture in Takaka as used in the FarmaxDairyPro® model. The data in column “%”are mean monthly values of cover averaged over four farms in Takaka (Bourdôt et al. 2003). The data in column “Prop. Max” are the monthly cover values as a proportion of the maximum.
Ground cover pattern
% Prop. Max
July 8.1 0.17
August 15.9 0.34
September 28.3 0.60
October 39.3 0.84
November 46.8 1.00
December 38.3 0.82
January 28.3 0.60
February 26.3 0.56
March 24.6 0.53
April 25.4 0.54
May 18.8 0.40
June 14.5 0.31