pka isoforms coordinate mrna fate during nutrient starvation
TRANSCRIPT

Journ
alof
Cell
Scie
nce
PKA isoforms coordinate mRNA fate during nutrientstarvation
Vanesa Tudisca1, Clare Simpson2, Lydia Castelli2, Jennifer Lui2, Nathaniel Hoyle2, Silvia Moreno1, Mark Ashe2
and Paula Portela1,*1Departamento de Quımica Biologica, Facultad de Ciencias Exactas y Naturales, Universidad de Buenos Aires, Argentina2The Michael Smith Building, Faculty of Life Sciences, University of Manchester, Manchester, UK
*Author for correspondence ([email protected])
Accepted 8 July 2012Journal of Cell Science 125, 5221–5232� 2012. Published by The Company of Biologists Ltddoi: 10.1242/jcs.111534
SummaryA variety of stress conditions induce mRNA and protein aggregation into mRNA silencing foci, but the signalling pathways mediatingthese responses are still elusive. Previously we demonstrated that PKA catalytic isoforms Tpk2 and Tpk3 localise with processing andstress bodies in Saccharomyces cerevisiae. Here, we show that Tpk2 and Tpk3 are associated with translation initiation factors Pab1 and
Rps3 in exponentially growing cells. Glucose starvation promotes the loss of interaction between Tpk and initiation factors followed bytheir accumulation into processing bodies. Analysis of mutants of the individual PKA isoform genes has revealed that the TPK3 or TPK2
deletion affects the capacity of the cells to form granules and arrest translation properly in response to glucose starvation or stationaryphase. Moreover, we demonstrate that PKA controls Rpg1 and eIF4G1 protein abundance, possibly controlling cap-dependent
translation. Taken together, our data suggest that the PKA pathway coordinates multiple stages in the fate of mRNAs in association withnutritional environment and growth status of the cell.
Key words: Saccharomyces cerevisiae, Translation, PKA
IntroductionIn eukaryotic translation initiation a closed loop complex forms on
the mRNA (Wells et al., 1998). In this complex eIF4E interacts
with the 59 mRNA cap structure along with a molecular scaffold
protein, eIF4G, and the eIF4A ATP-dependent RNA helicase.
Pab1 interacts both with the mRNA 39 poly(A) tail and with
eIF4G. In addition, a 43S complex forms via the interaction of a
host of translation initiation factors (eIF1, eIF1A, eIF3, eIF2 and
eIF5) with the small ribosomal (40S) subunit (Pestova et al., 2007).
The interaction of the closed loop mRNP complex with the 43S
complex leads to the formation of the 48S pre initiation complex
(Jackson et al., 2010).
In mammalian and yeast cells, PBs (processing bodies)
have been defined as cytoplasmic bodies containing various
components of the mRNA metabolic machinery such as Dcp1p,
Dcp2p, Dhh1p, Pat1p, Lsm1p and Xrn1p (Sheth and Parker, 2003).
A diverse array of functions has been ascribed to these RNA
granules, including roles in mRNA localisation, degradation and
storage as well as in the micro-RNA pathway (Anderson and
Kedersha, 2006). PBs are dynamic structures affected by a range of
cellular perturbations including glucose deprivation, osmotic
stress, exposure to UV light, and stage of cell growth (Kedersha
et al., 2005; Teixeira et al., 2005; Wilczynska et al., 2005). Another
group of RNP granules containing mRNA, eIF4E, eIF4G, and
Pab1, has been described to form in yeast during glucose
deprivation and to either overlap or be distinct from PBs
(Brengues and Parker, 2007; Hoyle et al., 2007). These granules,
initially referred to as EGP-bodies, have been shown to be
analogous to mammalian stress granules (SGs) (Buchan et al.,
2008). SGs and PBs share some protein components, can dock or
overlap with one another and can contain the same mRNAs
(Kedersha et al., 2005), suggesting that mRNAs may move
between these granules.
An unresolved issue concerning both SGs and PBs function is
the mechanism that allows cells to rapidly adapt to stress and to
re-establish a basal unstressed state. The involvement of signal
transduction pathway enzymes into the dynamics of PB and SG
formation and dissolution is an ideal mechanism for modulating
mRNA function in response to changing cellular conditions. The
role of post-translational modifications in translational control
and mRNP granule formation has been recently discussed
(Hilliker and Parker, 2008), and the possibility exists that the
precise combination of modifications on proteins bound to
specific mRNAs may dictate the localisation, translation and
degradation rate of these individual mRNAs.
In Saccharomyces cerevisiae, cells starved for glucose or in
stationary phase show a characteristic inhibition of protein
synthesis and accumulation of mRNA in PBs and SGs (Ashe
et al., 2000; Brengues and Parker, 2007; Hoyle et al., 2007).
Recently, it has been proposed that glucose depletion inhibits
translation initiation via loss of the eIF4A helicase from the
preinitiation complex and a resulting temporary stabilization of the
eIF3–eIF4G interaction on the 48S complex (Castelli et al., 2011).
The cAMP–PKA pathway in S. cerevisiae plays a major role in
the control of metabolism, stress resistance and proliferation,
This is an Open Access article distributed under the terms of the Creative Commons AttributionNon-Commercial Share Alike License (http://creativecommons.org/licenses/by-nc-sa/3.0), whichpermits unrestricted non-commercial use, distribution and reproduction in any medium provided thatthe original work is properly cited and all further distributions of the work or adaptation are subject tothe same Creative Commons License terms.
Research Article 5221

Journ
alof
Cell
Scie
nce
particularly in connection with carbon source signalling. PKA isa hetero-tetramer composed of two regulatory subunits encodedby BCY1 gene, and two catalytic subunits encoded by three
partially redundant genes, TPK1, TPK2 and TPK3 (Toda et al.,1987). The cAMP–PKA pathway is under positive control of anintracellular and extracellular glucose sensing system (Beullens
et al., 1988; Rolland et al., 2000). This pathway is transientlyhyperactivated upon addition of glucose to cells grown on a non-fermentable carbon source or to stationary-phase cells (Kraakman
et al., 1999) and downregulated during stationary-phase ornutrient starvation (Santangelo, 2006).
PKA activity is also a requirement for the inhibition oftranslation when glucose becomes depleted (Ashe et al., 2000;Lui et al., 2010). Moreover, it has recently been demonstrated that
PKA inhibits the aggregation of PBs by directly phosphorylatingPat1, a conserved constituent of these foci that functions as ascaffold during the assembly process (Ramachandran et al., 2011).
We have recently analysed the subcellular localisation of PKAsubunits from S. cerevisiae in fermentative, respiratory andstationary phases of growth and found that Tpk2 and Tpk3
isoforms, but not Bcy1, are associated with PBs and SGs duringstationary phase, and that Tpk3 accumulates into PBs duringglucose starvation and hyper osmotic stress (Tudisca et al., 2010).
In this work, we study the role of the PKA isoforms both in theformation of SGs and PBs as well as in translational regulation
using two model conditions: glucose starvation and stationaryphase. We observe that Tpk2 and Tpk3, but not Tpk1, areassociated with translation initiation factors Pab1 and Rps3 in
exponentially growing cells. Glucose starvation promotes the lossof interaction between Tpk2/3 and initiation factors followed byTpk2 and Tpk3 accumulation into PBs. Tpk2 and Tpk3 show
distinct mechanisms of accumulation in PBs. TPK3 deletionaffects the capacity of the cells to form granules and arresttranslation properly promoting as a consequence a more rapidresumption of translation under favourable conditions. However,
once cells reach stationary phase, either TPK2 or TPK3 deletionreduces the ability of cells to inhibit translation and form PBs andSGs. Finally, TPK gene deletion increases the abundance of
translation initiation factors such as eIF4G1 and Rpg1 (a subunitof eIF3 factor) in stationary phase. Taken together, these resultsshow that the cAMP–PKA pathway coordinates multiple stages
in the fate of mRNAs in association with the precise nutritionalenvironment and growth status of the cell.
ResultsTpk1, Tpk2 and Tpk3 differentially associate with PBs andSGs under stationary phase or glucose starvationWe have previously demonstrated that in S. cerevisiae cells,
grown up to stationary phase, Tpk2 and Tpk3, but not Tpk1 norBcy1, colocalise with markers of PBs and markers of SGs(Tudisca et al., 2010). Since it has been described that SGs and
PBs can dock or overlap with each other in a dynamic manner(Buchan et al., 2008; Hoyle et al., 2007) we decided to compareTpk2 or Tpk3 distribution with markers of both PBs and SGs
simultaneously in the same cell. The strategy used was to analysechromosomally-tagged Tpk2–GFP or Tpk3–GFP colocalisationwith Dcp2–CFP and eIF4E–RFP as PB or SG markers,
respectively (Fig. 1).
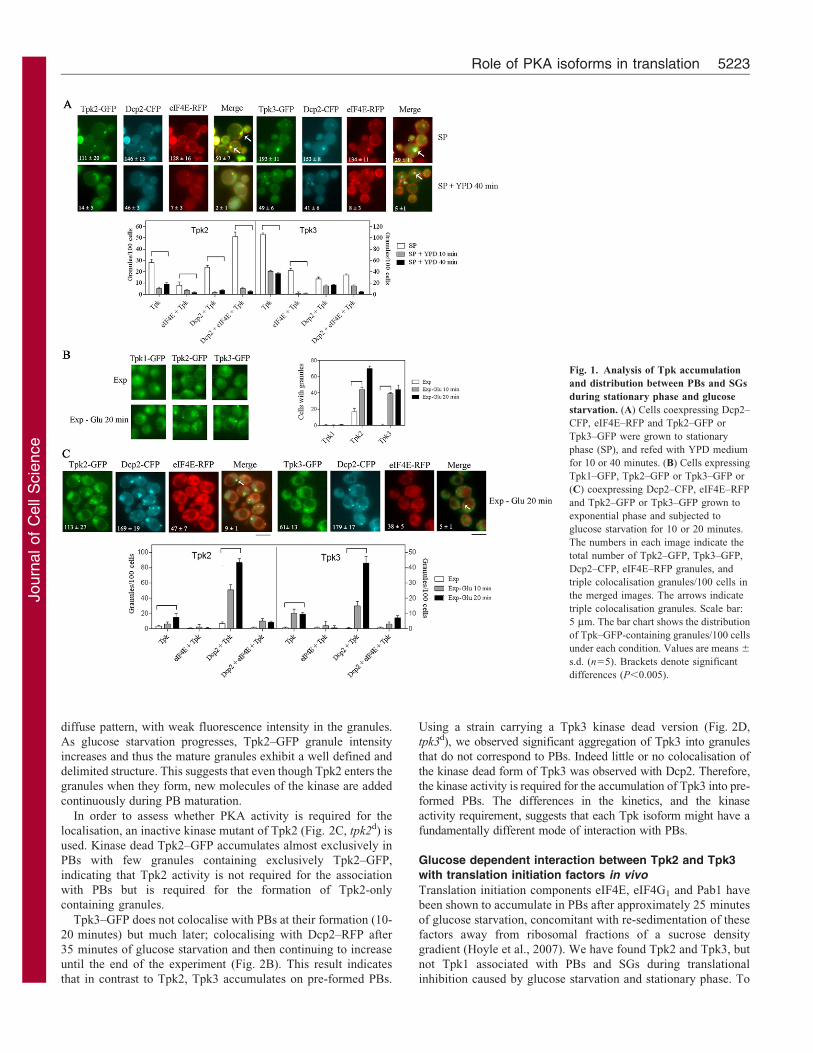
During stationary phase (SP), we have observed that 77% of thegranules could be defined as PBs (50% with Dcp2 alone and 27%containing both Dcp2 and eIF4E), while the remaining 23% were
SGs (containing exclusively eIF4E–RFP; Fig. 1A, SP). Fresh mediaaddition promoted the dissolution of these granules (Fig. 1A,
SP+YPD 40 min). Expression of Tpk2–GFP or Tpk3–GFP did notalter Dcp2–CFP or eIF4E–RFP protein expression levels or theproportion of each granule population when compared with an
untagged Tpk version strain (data not shown).
The majority of Tpk2–GFP was found associated with PBs(P,0.005). However, Tpk3–GFP showed a different profile, with
similar levels of colocalisation with PBs and SGs. Intriguingly, alarge number of Tpk3 granules did not colocalise with eitherDcp2 and/or eIF4E (P,0.005). However, we have previously
observed that Tpk3 mostly colocalised with Dcp1 (Tudisca et al.,2010), suggesting that this Tpk3 granule population has acomposition different from canonical SGs described inSaccharomyces cerevisiae. Glucose addition to stationary phase
cultures promoted a dramatic and rapid dissolution of Tpk2- andTpk3-containing granules (Fig. 1A, SP+YPD 40 min).
Previously we have demonstrated that acute glucose depletionfrom exponentially growing cells also causes Tpk3 accumulationinto PBs (Tudisca et al., 2010). Here we have extended theanalysis to investigate Tpk2 and Tpk1 localisation (Fig. 1B).
When exponentially growing Tpk1–GFP-, Tpk2–GFP- or Tpk3–GFP-expressing yeasts were starved for glucose, Tpk2–GFP andTpk3–GFP accumulated into cytoplasmic granules as soon as
10 minutes after glucose starvation. In contrast, the localisationof Tpk1–GFP was diffusely nucleo-cytoplasmic without asignificant accumulation of granules (Fig. 1B). To characterize
Tpk2–GFP and Tpk3–GFP containing cytoplasmic granules afterglucose starvation, the colocalisation with coexpressing Dcp2–CFP and eIF4E–RFP was assessed (Fig. 1C). As in previousstudies (Hoyle et al., 2007), at early time points after glucose
starvation (20 minutes), Dcp2 and eIF4E total granule populationwas predominantly comprised by PBs (84%), with only 16% ofvery newly formed SGs. The distribution analysis of Tpk2–GFP
and Tpk3–GFP granules indicates that both isoforms accumulatemainly in PBs (P,0.005).
Overall, it seems that each Tpk isoform shows a differential
subcellular distribution following glucose starvation andsubsequently, after entry into stationary phase. The cytoplasmiclocalisation of Tpk1 seems not to be affected by the nutritional
status of the cell, whereas Tpk3 and Tpk2 accumulate into RNP-granules under the same nutrient limitation conditions that triggertranslational arrest (Lui et al., 2010).
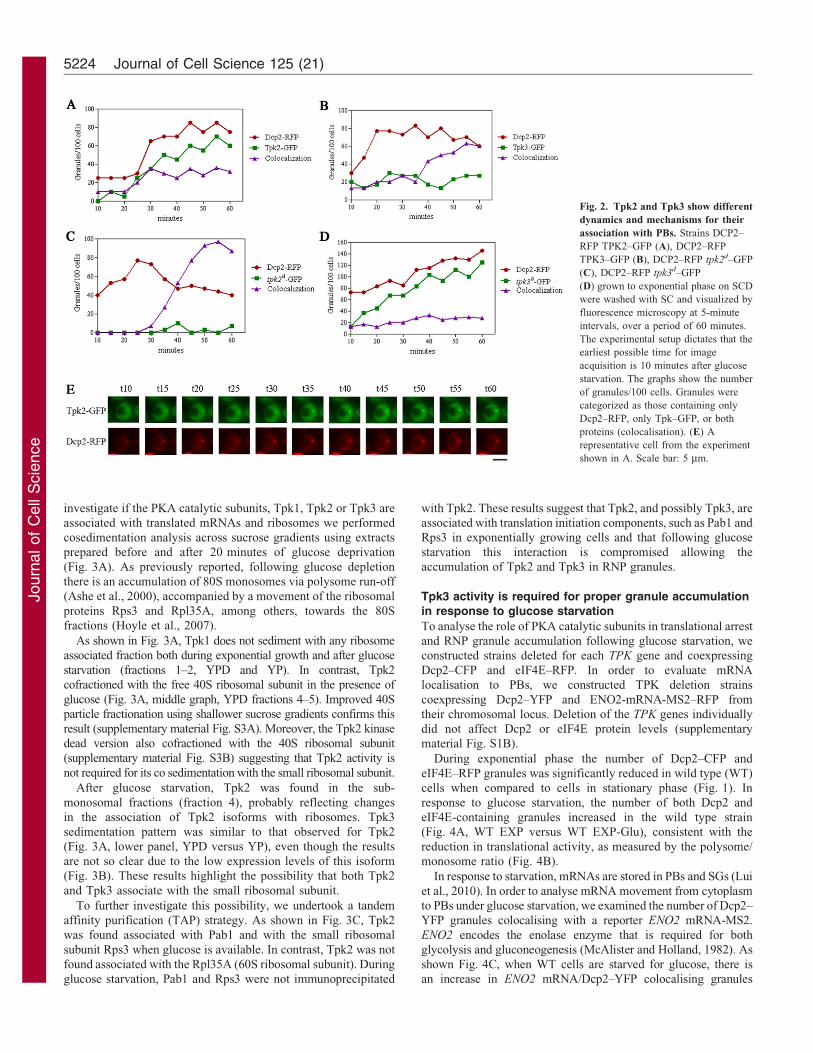
Tpk2 and Tpk3 show a differential dynamics andmechanism of association with PBs
The above results suggest that Tpk2 and Tpk3 predominantlylocalise to PBs early after glucose starvation. To investigate themechanism of Tpk2 and Tpk3 accumulation into PBs, we analysed
Tpk–GFP granule formation in strains expressing Dcp2–RFP(PBs) following individual cells after glucose starvation. As shownin Fig. 2A, when cells are deprived of glucose, there is an increase
in the amount of Dcp2, Tpk2 and colocalisation granules. Sinceexclusively Tpk2–GFP or Dcp2–RFP containing granules increaseall along the stimulus (and there is not a decrease in the
accumulation of one protein at the expense of another), we canconclude that Tpk2 localises to PBs at the same time as PBs areformed, with Dcp2 marking this event. However, even though both
proteins likely assemble simultaneously into PBs, detailedinspection showed that the colocalising granules mature duringthe starvation (Fig. 2E). At early stages, Tpk2–GFP exhibits a
Journal of Cell Science 125 (21)5222
Journ
alof
Cell
Scie
nce
diffuse pattern, with weak fluorescence intensity in the granules.
As glucose starvation progresses, Tpk2–GFP granule intensity
increases and thus the mature granules exhibit a well defined and
delimited structure. This suggests that even though Tpk2 enters the
granules when they form, new molecules of the kinase are added
continuously during PB maturation.
In order to assess whether PKA activity is required for the
localisation, an inactive kinase mutant of Tpk2 (Fig. 2C, tpk2d) is
used. Kinase dead Tpk2–GFP accumulates almost exclusively in
PBs with few granules containing exclusively Tpk2–GFP,
indicating that Tpk2 activity is not required for the association
with PBs but is required for the formation of Tpk2-only
containing granules.
Tpk3–GFP does not colocalise with PBs at their formation (10-
20 minutes) but much later; colocalising with Dcp2–RFP after
35 minutes of glucose starvation and then continuing to increase
until the end of the experiment (Fig. 2B). This result indicates
that in contrast to Tpk2, Tpk3 accumulates on pre-formed PBs.
Using a strain carrying a Tpk3 kinase dead version (Fig. 2D,
tpk3d), we observed significant aggregation of Tpk3 into granules
that do not correspond to PBs. Indeed little or no colocalisation of
the kinase dead form of Tpk3 was observed with Dcp2. Therefore,
the kinase activity is required for the accumulation of Tpk3 into pre-
formed PBs. The differences in the kinetics, and the kinase
activity requirement, suggests that each Tpk isoform might have a
fundamentally different mode of interaction with PBs.
Glucose dependent interaction between Tpk2 and Tpk3
with translation initiation factors in vivo
Translation initiation components eIF4E, eIF4G1 and Pab1 have
been shown to accumulate in PBs after approximately 25 minutes
of glucose starvation, concomitant with re-sedimentation of these
factors away from ribosomal fractions of a sucrose density
gradient (Hoyle et al., 2007). We have found Tpk2 and Tpk3, but
not Tpk1 associated with PBs and SGs during translational
inhibition caused by glucose starvation and stationary phase. To
Fig. 1. Analysis of Tpk accumulation
and distribution between PBs and SGs
during stationary phase and glucose
starvation. (A) Cells coexpressing Dcp2–
CFP, eIF4E–RFP and Tpk2–GFP or
Tpk3–GFP were grown to stationary
phase (SP), and refed with YPD medium
for 10 or 40 minutes. (B) Cells expressing
Tpk1–GFP, Tpk2–GFP or Tpk3–GFP or
(C) coexpressing Dcp2–CFP, eIF4E–RFP
and Tpk2–GFP or Tpk3–GFP grown to
exponential phase and subjected to
glucose starvation for 10 or 20 minutes.
The numbers in each image indicate the
total number of Tpk2–GFP, Tpk3–GFP,
Dcp2–CFP, eIF4E–RFP granules, and
triple colocalisation granules/100 cells in
the merged images. The arrows indicate
triple colocalisation granules. Scale bar:
5 mm. The bar chart shows the distribution
of Tpk–GFP-containing granules/100 cells
under each condition. Values are means 6
s.d. (n55). Brackets denote significant
differences (P,0.005).
Role of PKA isoforms in translation 5223
Journ
alof
Cell
Scie
nce
investigate if the PKA catalytic subunits, Tpk1, Tpk2 or Tpk3 are
associated with translated mRNAs and ribosomes we performed
cosedimentation analysis across sucrose gradients using extracts
prepared before and after 20 minutes of glucose deprivation
(Fig. 3A). As previously reported, following glucose depletion
there is an accumulation of 80S monosomes via polysome run-off
(Ashe et al., 2000), accompanied by a movement of the ribosomal
proteins Rps3 and Rpl35A, among others, towards the 80S
fractions (Hoyle et al., 2007).
As shown in Fig. 3A, Tpk1 does not sediment with any ribosome
associated fraction both during exponential growth and after glucose
starvation (fractions 1–2, YPD and YP). In contrast, Tpk2
cofractioned with the free 40S ribosomal subunit in the presence of
glucose (Fig. 3A, middle graph, YPD fractions 4–5). Improved 40S
particle fractionation using shallower sucrose gradients confirms this
result (supplementary material Fig. S3A). Moreover, the Tpk2 kinase
dead version also cofractioned with the 40S ribosomal subunit
(supplementary material Fig. S3B) suggesting that Tpk2 activity is
not required for its co sedimentation with the small ribosomal subunit.
After glucose starvation, Tpk2 was found in the sub-
monosomal fractions (fraction 4), probably reflecting changes
in the association of Tpk2 isoforms with ribosomes. Tpk3
sedimentation pattern was similar to that observed for Tpk2
(Fig. 3A, lower panel, YPD versus YP), even though the results
are not so clear due to the low expression levels of this isoform
(Fig. 3B). These results highlight the possibility that both Tpk2
and Tpk3 associate with the small ribosomal subunit.
To further investigate this possibility, we undertook a tandem
affinity purification (TAP) strategy. As shown in Fig. 3C, Tpk2
was found associated with Pab1 and with the small ribosomal
subunit Rps3 when glucose is available. In contrast, Tpk2 was not
found associated with the Rpl35A (60S ribosomal subunit). During
glucose starvation, Pab1 and Rps3 were not immunoprecipitated
with Tpk2. These results suggest that Tpk2, and possibly Tpk3, are
associated with translation initiation components, such as Pab1 and
Rps3 in exponentially growing cells and that following glucose
starvation this interaction is compromised allowing the
accumulation of Tpk2 and Tpk3 in RNP granules.
Tpk3 activity is required for proper granule accumulationin response to glucose starvation
To analyse the role of PKA catalytic subunits in translational arrest
and RNP granule accumulation following glucose starvation, we
constructed strains deleted for each TPK gene and coexpressing
Dcp2–CFP and eIF4E–RFP. In order to evaluate mRNA
localisation to PBs, we constructed TPK deletion strains
coexpressing Dcp2–YFP and ENO2-mRNA-MS2–RFP from
their chromosomal locus. Deletion of the TPK genes individually
did not affect Dcp2 or eIF4E protein levels (supplementary
material Fig. S1B).
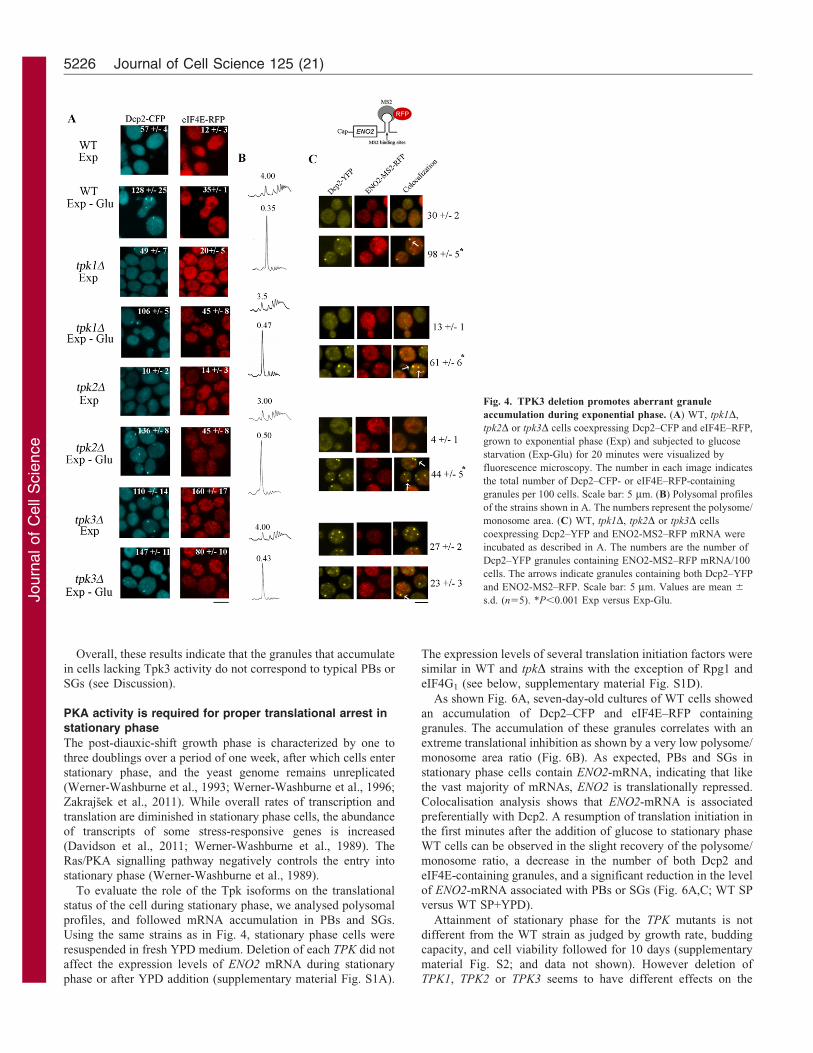
During exponential phase the number of Dcp2–CFP and
eIF4E–RFP granules was significantly reduced in wild type (WT)
cells when compared to cells in stationary phase (Fig. 1). In
response to glucose starvation, the number of both Dcp2 and
eIF4E-containing granules increased in the wild type strain
(Fig. 4A, WT EXP versus WT EXP-Glu), consistent with the
reduction in translational activity, as measured by the polysome/
monosome ratio (Fig. 4B).
In response to starvation, mRNAs are stored in PBs and SGs (Lui
et al., 2010). In order to analyse mRNA movement from cytoplasm
to PBs under glucose starvation, we examined the number of Dcp2–
YFP granules colocalising with a reporter ENO2 mRNA-MS2.
ENO2 encodes the enolase enzyme that is required for both
glycolysis and gluconeogenesis (McAlister and Holland, 1982). As
shown Fig. 4C, when WT cells are starved for glucose, there is
an increase in ENO2 mRNA/Dcp2–YFP colocalising granules
Fig. 2. Tpk2 and Tpk3 show different
dynamics and mechanisms for their
association with PBs. Strains DCP2–
RFP TPK2–GFP (A), DCP2–RFP
TPK3–GFP (B), DCP2–RFP tpk2d–GFP
(C), DCP2–RFP tpk3d–GFP
(D) grown to exponential phase on SCD
were washed with SC and visualized by
fluorescence microscopy at 5-minute
intervals, over a period of 60 minutes.
The experimental setup dictates that the
earliest possible time for image
acquisition is 10 minutes after glucose
starvation. The graphs show the number
of granules/100 cells. Granules were
categorized as those containing only
Dcp2–RFP, only Tpk–GFP, or both
proteins (colocalisation). (E) A
representative cell from the experiment
shown in A. Scale bar: 5 mm.
Journal of Cell Science 125 (21)5224

Journ
alof
Cell
Scie
nce
indicating that ENO2 mRNA is stored in PBs probably as a result of
the significant reduction in translation that occurs when cells
shutdown fermentative metabolism. Control experiments indicate
that ENO2 mRNA levels were not affected by MS2 tagging or by
deletion of each Tpk (supplementary material Fig. S1A).
tpk1D and tpk2D strains were indistinguishable from WT cells in
that translation initiation was inhibited and the cells accumulated
both Dcp2 and eIF4E into granules in response to glucosestarvation (Fig. 4A). The deletion of these isoforms does not
impair ENO2-mRNA accumulation into PBs in response toglucose starvation (Fig. 4C). In contrast, PB and SGaccumulation seems to be drastically affected in the absence ofthe Tpk3 isoform. Even though the translational inhibition caused
by glucose withdrawal is still normal (Fig. 4B), this strain showeda high number of Dcp2–CFP and eIF4E–RFP containing granuleseven in exponentially growing cells that remain almost unchanged
in number following glucose starvation (Fig. 4A). The abnormalgranule accumulation observed in tpk3D cells is therefore not dueto a defect in translation initiation. This result indicates that the
inhibition of translation initiation and granule formation, which arenormally tightly coupled, have become uncoupled in this strain.Moreover, the number of Dcp2–YFP granules that contain theENO2 mRNA observed after glucose withdrawal in the tpk3Dstrain was drastically reduced when compared to either the WT orthe other tpk mutants (Fig. 4C). Therefore, we can conclude thattpk3D strain fails to efficiently accumulate ENO2-mRNA into
Dcp2 containing granules. By analogy with mRNA decay mutantssuch as xrn1D and dcp1D which accumulate granulesconstitutively (Sheth and Parker, 2003), these results suggest that
TPK3 mutant has some rate limiting step in either mRNA decay orgranule formation. If the TPK3 mutant had a problem in mRNAdecay then mRNA should accumulate in the granules, however, as
observed in Fig. 4C this is not the case since the majority of theDcp2 containing granules are devoid of mRNA. This result is inagreement with a recent report that shows that PKA activity doesnot influence global mRNA decay (Ramachandran et al., 2011).
We therefore favour the hypothesis that tpk3D mutant has somedeficiency in granule formation which leads to the accumulation ofpartially formed or functionally compromised PBs.
To further characterize the Dcp2 and eIF4E containing granulesthat accumulate in vivo in the tpk3D strain, we performed animmunoblot analysis of granule enriched fractions (Teixeira et al.,
2005) obtained from WT and tpk3D exponentially growing cells aswell as from cells submitted to 20 minutes of glucose starvation.The pellet from glucose-starved WT cells was enriched for Dcp2,eIF4E, eIF4G1 and Pab1 (Fig. 5A) and these interactions were
dependent on RNA (Fig. 5C). The absence of Pyk1 from the pelletfraction indicates that the granule preparation was free fromsoluble cytoplasmic contaminants. The presence of Dcp2 and
eIF4E confirms our microscopy data (Fig. 4). In agreement withrecent data (Castelli et al., 2011), Rps3 and eIF4A were not presentin the granule fraction. Unlike WT cells, granule-enriched
fractions obtained from tpk3D cells growing on glucose showedthe presence of Rpg1 and Rps3 as well as Dcp2, eIF4G and Pab1.Protein expression levels remained similar before and after glucose
starvation in WT and tpk3D cells (supplementary material Fig.S1B). Even though we have microscopically observed theformation of granules containing eIF4E in tpk3D strain (Fig. 4),this protein was not found in the granular fraction after
biochemical analysis. These observations suggest that eIF4Egranules formed in the presence of glucose in tpk3D strain areunlikely to correspond to SGs. A possibility is that these granules
are more fragile and therefore are sensitive to biochemicalfractionation.
Except for Dcp2, the abundance of each protein in the pellet
decreased after glucose starvation, suggesting that the granulesformed in tpk3D strain are unstable and dynamic in response toglucose availability.
Fig. 3. Tpk2 and Tpk3 are associated in vivo with translation initiation
complexes during exponential growth. (A) Polysomal profile analysis and
immunoblots of 15–50% sucrose gradient fractions from cells expressing Tpk1-
TAP (top), Tpk2-TAP (middle) or Tpk3-TAP (bottom) grown to exponential
phase in YPD and subjected to glucose starvation for 20 minutes (YP).
(B) Expression levels of each Tpk under exponential growth (YPD) or after
glucose starvation (YP) were determined by immunoblot. The abundance of each
Tpk represents 5% of the input fraction used in A. (C) Tpk2-TAP and untagged
strains were purified from 20-minute glucose-starved (YP) or unstarved (YPD)
cultures. Immunoprecipitated samples were subjected to western blot analysis
with anti-TAP, anti-Pab1, anti-Rps3 and anti-Rpl35A antibodies. The input
represents 1% of total protein used in the immunoprecipitation assay.
Role of PKA isoforms in translation 5225
Journ
alof
Cell
Scie
nce
Overall, these results indicate that the granules that accumulate
in cells lacking Tpk3 activity do not correspond to typical PBs or
SGs (see Discussion).
PKA activity is required for proper translational arrest instationary phase
The post-diauxic-shift growth phase is characterized by one to
three doublings over a period of one week, after which cells enter
stationary phase, and the yeast genome remains unreplicated
(Werner-Washburne et al., 1993; Werner-Washburne et al., 1996;
Zakrajsek et al., 2011). While overall rates of transcription and
translation are diminished in stationary phase cells, the abundance
of transcripts of some stress-responsive genes is increased
(Davidson et al., 2011; Werner-Washburne et al., 1989). The
Ras/PKA signalling pathway negatively controls the entry into
stationary phase (Werner-Washburne et al., 1989).
To evaluate the role of the Tpk isoforms on the translational
status of the cell during stationary phase, we analysed polysomal
profiles, and followed mRNA accumulation in PBs and SGs.
Using the same strains as in Fig. 4, stationary phase cells were
resuspended in fresh YPD medium. Deletion of each TPK did not
affect the expression levels of ENO2 mRNA during stationary
phase or after YPD addition (supplementary material Fig. S1A).
The expression levels of several translation initiation factors were
similar in WT and tpkD strains with the exception of Rpg1 and
eIF4G1 (see below, supplementary material Fig. S1D).
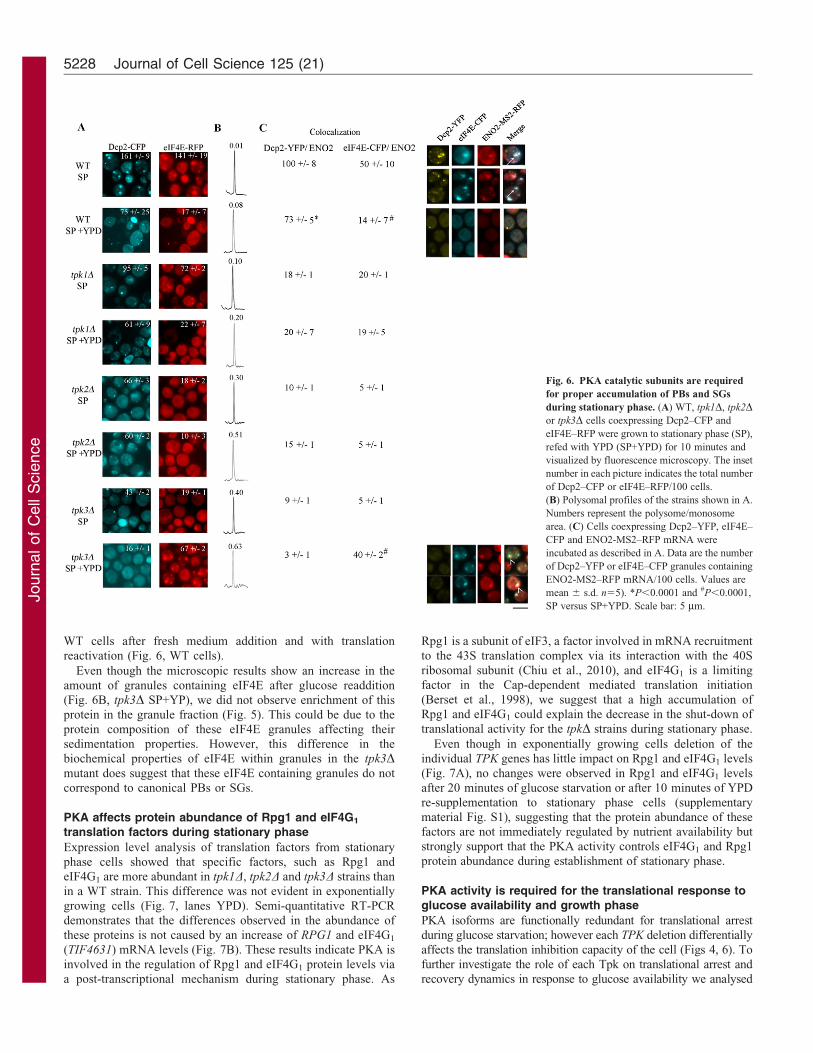
As shown Fig. 6A, seven-day-old cultures of WT cells showed
an accumulation of Dcp2–CFP and eIF4E–RFP containing
granules. The accumulation of these granules correlates with an
extreme translational inhibition as shown by a very low polysome/
monosome area ratio (Fig. 6B). As expected, PBs and SGs in
stationary phase cells contain ENO2-mRNA, indicating that like
the vast majority of mRNAs, ENO2 is translationally repressed.
Colocalisation analysis shows that ENO2-mRNA is associated
preferentially with Dcp2. A resumption of translation initiation in
the first minutes after the addition of glucose to stationary phase
WT cells can be observed in the slight recovery of the polysome/
monosome ratio, a decrease in the number of both Dcp2 and
eIF4E-containing granules, and a significant reduction in the level
of ENO2-mRNA associated with PBs or SGs (Fig. 6A,C; WT SP
versus WT SP+YPD).
Attainment of stationary phase for the TPK mutants is not
different from the WT strain as judged by growth rate, budding
capacity, and cell viability followed for 10 days (supplementary
material Fig. S2; and data not shown). However deletion of
TPK1, TPK2 or TPK3 seems to have different effects on the
Fig. 4. TPK3 deletion promotes aberrant granule
accumulation during exponential phase. (A) WT, tpk1D,
tpk2D or tpk3D cells coexpressing Dcp2–CFP and eIF4E–RFP,
grown to exponential phase (Exp) and subjected to glucose
starvation (Exp-Glu) for 20 minutes were visualized by
fluorescence microscopy. The number in each image indicates
the total number of Dcp2–CFP- or eIF4E–RFP-containing
granules per 100 cells. Scale bar: 5 mm. (B) Polysomal profiles
of the strains shown in A. The numbers represent the polysome/
monosome area. (C) WT, tpk1D, tpk2D or tpk3D cells
coexpressing Dcp2–YFP and ENO2-MS2–RFP mRNA were
incubated as described in A. The numbers are the number of
Dcp2–YFP granules containing ENO2-MS2–RFP mRNA/100
cells. The arrows indicate granules containing both Dcp2–YFP
and ENO2-MS2–RFP. Scale bar: 5 mm. Values are mean 6
s.d. (n55). *P,0.001 Exp versus Exp-Glu.
Journal of Cell Science 125 (21)5226

Journ
alof
Cell
Scie
nce
translational arrest in stationary phase. Deletion of the TPK1
partially impairs Dcp2–CFP and eIF4E–RFP accumulation into
granules (Fig. 6A) and translational activity is slightly higher
than in WT cells (Fig. 6B). Finally, colocalisation analysis of
ENO2-mRNA in both Dcp2 and eIF4E containing granules
suggest that tpk1D strains failed to accumulate mRNA into PBs
and SGs. Glucose addition to the tpk1D strain promoted a
reduction in the number of both PBs and SGs, in correlation with
the higher translational activity (Fig. 6A–C; tpk1D SP versus
tpk1D SP+YPD) and with a decrease in the number of mRNA
containing granules.
In the TPK2 and TPK3 mutant strains, there was a drastic
reduction in the level of Dcp2–CFP and eIF4E–RFP granules in
stationary phase cells, and as consequence a very low level of
ENO2-mRNA aggregation. These reduced levels of PBs and SGs
correlated with the slightly improved levels of translation
observed in the tpk2D and tpk3D (Fig. 6A–C; tpk2D SP, tpk3DSP versus WT SP). Glucose addition to stationary phase tpk2Dcells promoted translational activation without great effect on the
PBs and SGs pattern. Surprisingly, glucose addition to tpk3Dcells promoted eIF4E–RFP to accumulate in granules with the
ENO2 mRNA (Fig. 6A–C; tpk3D SP+YPD). Overall, the results
shown in Fig. 6 indicate that deletion of each TPK promotes
slightly higher translational levels in stationary phase; with TPK2
and TPK3 deletion being more severe than TPK1. The increased
translational activity in stationary phase for the TPK mutants
presumably explains their higher translational activities following
re-addition of glucose. The TPK3 mutant in particular, promotes
an aberrant eIF4E-ENO2 mRNA aggregation in response to
addition of nutrients. Moreover, mRNAs trapped in polysomes by
cycloheximide addition prior to YPD addition to tpk3D stationary
cells did not prevent this eIF4E granule aggregation (data not
shown), suggesting that these granules do not correspond to RNP
granules produced by translational arrest (Parker and Sheth,
2007; Sheth and Parker, 2003). Recently, eIF4E has been
postulated to function as a granule nucleation factor (Ferrero
et al., 2012), therefore the eIF4E-ENO2 mRNA granules
observed in tpk3D cells could be a reflection of a non
canonical function of eIF4E.
In order to characterize the RNP granules observed during
refeeding of stationary phase tpk3D cells, granule enriched
fractions were prepared from stationary phase samples with and
without nutrient resupplementation in tpk3D and WT cells.
Stationary phase granules from the WT strain were enriched for
several components of PBs and SGs, such as Dcp2, eIF4E,
eIF4G1 and Pab1 (Fig. 5B). Dcp2 and eIF4E enrichment in the
granular pellet was consistent with the microscopic results
(Fig. 6). In addition, Rpg1, eIF4A, Rps3 and Rpl35A ribosomal
subunit proteins were also found in the granular fraction. These
observations differ from previous results in which Rpg1 was not
found in granules (Brengues and Parker, 2007), however, the
precise timing of stationary phase are different; here observations
were made after 7 days of culture, whereas in Brengues and
Parker (Brengues and Parker, 2007), microscopy was performed
after only 3 days of stationary phase. It is entirely possible that in
stationary phase there is a greater propensity for many dormant
proteins to exist in aggregates as already described
(Narayanaswamy et al., 2009). We think that the aggregation of
the 80S particle into a cytoplasmic punctuate distribution could
represent an economic mechanism to allow a quick translational
reactivation once favourable nutritional conditions are restored.
When cells were refed with YPD, there was a redistribution of
all the components found in the pellet towards the supernatant.
This is consistent with the disassembly of granules observed in
Fig. 5. Biochemical characterization of granules
from Tpk mutant cells. WT or tpk3D strains were
(A) grown to exponential phase (Exp) and then
subjected to glucose starvation for 20 minutes
(Exp-Glu 20 min) or (B) grown to stationary phase
(SP) and re-fed with YPD for 10 minutes (SP+YPD).
Immunoblots from granule-enriched fractions (P)
and their corresponding supernatants (S). The graphs
represent the relative abundance for each protein
between the P and S fractions, determined by
densitometric quantification of the bands. (C) P
fractions from a WT strain after glucose starvation or
tpk3D strain grown to exponential phase in the
absence (2) or presence (+) of RNase A.
Role of PKA isoforms in translation 5227
Journ
alof
Cell
Scie
nce
WT cells after fresh medium addition and with translation
reactivation (Fig. 6, WT cells).
Even though the microscopic results show an increase in the
amount of granules containing eIF4E after glucose readdition
(Fig. 6B, tpk3D SP+YP), we did not observe enrichment of this
protein in the granule fraction (Fig. 5). This could be due to the
protein composition of these eIF4E granules affecting their
sedimentation properties. However, this difference in the
biochemical properties of eIF4E within granules in the tpk3Dmutant does suggest that these eIF4E containing granules do not
correspond to canonical PBs or SGs.
PKA affects protein abundance of Rpg1 and eIF4G1
translation factors during stationary phase
Expression level analysis of translation factors from stationary
phase cells showed that specific factors, such as Rpg1 and
eIF4G1 are more abundant in tpk1D, tpk2D and tpk3D strains than
in a WT strain. This difference was not evident in exponentially
growing cells (Fig. 7, lanes YPD). Semi-quantitative RT-PCR
demonstrates that the differences observed in the abundance of
these proteins is not caused by an increase of RPG1 and eIF4G1
(TIF4631) mRNA levels (Fig. 7B). These results indicate PKA is
involved in the regulation of Rpg1 and eIF4G1 protein levels via
a post-transcriptional mechanism during stationary phase. As
Rpg1 is a subunit of eIF3, a factor involved in mRNA recruitment
to the 43S translation complex via its interaction with the 40S
ribosomal subunit (Chiu et al., 2010), and eIF4G1 is a limiting
factor in the Cap-dependent mediated translation initiation
(Berset et al., 1998), we suggest that a high accumulation of
Rpg1 and eIF4G1 could explain the decrease in the shut-down of
translational activity for the tpkD strains during stationary phase.
Even though in exponentially growing cells deletion of the
individual TPK genes has little impact on Rpg1 and eIF4G1 levels
(Fig. 7A), no changes were observed in Rpg1 and eIF4G1 levels
after 20 minutes of glucose starvation or after 10 minutes of YPD
re-supplementation to stationary phase cells (supplementary
material Fig. S1), suggesting that the protein abundance of these
factors are not immediately regulated by nutrient availability but
strongly support that the PKA activity controls eIF4G1 and Rpg1
protein abundance during establishment of stationary phase.
PKA activity is required for the translational response toglucose availability and growth phase
PKA isoforms are functionally redundant for translational arrest
during glucose starvation; however each TPK deletion differentially
affects the translation inhibition capacity of the cell (Figs 4, 6). To
further investigate the role of each Tpk on translational arrest and
recovery dynamics in response to glucose availability we analysed
Fig. 6. PKA catalytic subunits are required
for proper accumulation of PBs and SGs
during stationary phase. (A) WT, tpk1D, tpk2D
or tpk3D cells coexpressing Dcp2–CFP and
eIF4E–RFP were grown to stationary phase (SP),
refed with YPD (SP+YPD) for 10 minutes and
visualized by fluorescence microscopy. The inset
number in each picture indicates the total number
of Dcp2–CFP or eIF4E–RFP/100 cells.
(B) Polysomal profiles of the strains shown in A.
Numbers represent the polysome/monosome
area. (C) Cells coexpressing Dcp2–YFP, eIF4E–
CFP and ENO2-MS2–RFP mRNA were
incubated as described in A. Data are the number
of Dcp2–YFP or eIF4E–CFP granules containing
ENO2-MS2–RFP mRNA/100 cells. Values are
mean 6 s.d. n55). *P,0.0001 and #P,0.0001,
SP versus SP+YPD. Scale bar: 5 mm.
Journal of Cell Science 125 (21)5228

Journ
alof
Cell
Scie
nce
in tpk1D, tpk2D and tpk3D strains the polysome profiles at various
time points during the starvation-refeeding regime (Fig. 8A). The
polysome profiles observed during exponential growth were similar
in all the strains, indicating that the translational status of the cells is
not grossly altered by the deletion of one Tpk gene. The kinetics of
translational inhibition after glucose removal was indistinguishable
between Tpk mutants and WT cells (Fig. 8A); in every case the
level of polysomes decreased rapidly, reaching a minimum
10 minutes after glucose starvation. After glucose addition to
starved cells, translational arrest of the three tpk mutant strains was
recovered, but the kinetics of translational recuperation was
different for each mutant. Surprisingly, 1–5 minutes after glucose
readdition, the translational status observed for tpk3D strain was
higher as a consequence of a faster recovery. In contrast, tpk1D and
tpk2D did not show differences with the WT cells during the first
5 minutes of translational recuperation, but tpk1D reached similar
values of translational recovery to tpk3D after 10 minutes of glucose
addition; these values were significantly higher than those attained
by WT and tpk2D strains.
In stationary phase, the inhibition of translation for the tpk1D,
tpk2D and tpk3D strains is not as severe as that in WT cells
(Fig. 6B; Fig. 8B, SP samples). Even though all the strains
recovered after glucose addition, the rate and level of recovery for
the tpk3D were higher than for the WT, tpk1D and tpk2D cells.
These results indicate that the PKA isoforms are functionally
redundant in terms of their effects on translational inhibition
during glucose starvation but not during the recovery phase.
Specifically, the Tpk3 isoform seems to limit the translational
recovery once glucose is added back to translational arrested cells.
DiscussionPKA role in translational arrest evoked by glucosestarvation
During exponential growth on glucose, Tpk2 is located mainly inthe nucleus, while Tpk1 and Tpk3 are homogeneously distributed
between nucleus and cytoplasm (Tudisca et al., 2010). In responseto glucose limitation translation is repressed and both PBs and SGsare formed (Hoyle et al., 2007). The reduction of translation
initiation rates caused by glucose starvation involves alterationsthat take place at the level of protein-protein interactions within the48S pre-initiation complex (Castelli et al., 2011).
In exponentially growing cells, we have observed that Tpk2 andTpk3, but not Tpk1, cofractionate with the 48S preinitiation
complex via their association with the 40S ribosomal subunit and/or Pab1 protein (Fig. 3). Similar to closed loop complex translationfactors, glucose starvation promotes the dissociation of Tpk2 and –
presumably – Tpk3 from the 48S pre-initiation complex allowingtheir accumulation in PBs and SGs (Fig. 1).
Protein kinase activity was necessary for both the accumulationof Tpk2 into granules and the association of Tpk3 with Dcp2
(Fig. 2). Recently it has been determined that specific glutamine-and/or asparagine-rich (Q/N-rich) regions in several PBcomponents play key roles in the aggregation and assembly ofPBs (Reijns et al., 2008). Protein sequence analysis of Tpk1, Tpk2
and Tpk3 showed that only Tpk2 has a Q/N rich region (19 Q, 2 N,2P residues) positioned between Q9 and Q56 in the N-terminalregion of Tpk2. Therefore, it is possible that the presence of the
Q/N rich domain in Tpk2 allows or favours its interaction withtranslation factors and its accumulation in PBs independently ofprotein kinase activity.
The analysis of PB and SG formation in TPK mutants showed
that the TPK3 deletion causes major alterations in both granulecomposition and accumulation since they are formed even in thepresence of glucose. Close inspection of granule composition
showed the presence of Rpg1 and Rps3 suggesting that deletion ofTPK3 could lead to accumulation and aggregation of stalled 48Spre-initiation complexes, which differs from the situation inglucose-deprived cells where it has been suggested that the stalled
48S complexes breakdown to the closed loop complex prior torelocalisation to SGs (Castelli et al., 2011). The translation factorspresent in granules in the tpk3D strain resemble in part those
present in stress granules induced by sodium azide, heat shock orethanol stress (Buchan et al., 2011; Grousl et al., 2009; Kato et al.,2011). Interestingly, it has been reported that deletion of TPK3
promotes damage to the mitochondrial enzymatic content and anincrease in the production of ROS (Chevtzoff et al., 2005). Theseresults highlight the possibility that the absence of Tpk3 activitypromotes RNP granule accumulation in response to defects in
mitochondrial functionality. In the tpk3D mutant, we haveobserved no defects in the translational activity of cells growingon glucose or in the capacity of these cells to inhibit translation
in response to glucose starvation. However, the kinetics oftranslational reactivation after glucose addition to arrested cellsin the tpk3D strain was faster than in WT cells (Fig. 8A). It seems
possible that the formation of stress granules even under glucosereplete conditions would diminish the cells capacity to arresttranslation correctly upon glucose starvation, thus favouring an
immediate translational reactivation once glucose is readded.
While this work was being prepared for publication, a studyhas been published showing that PKA specifically inhibits theformation of the larger PB aggregates by direct phosphorylation
Fig. 7. PKA regulates Rpg1 and eIF4G1 expression levels during stationary
phase. (A) WT, tpk1D, tpk2D or tpk3D strains were grown to exponential (left
panel) or stationary (right panel) phase in YPD. Endogenous expression levels of
eIF4G1, Rpg1 and Pyk1 (control) were analysed by western blotting. The numbers
under blots are the densitometric quantification of Rpg1 or eIF4G1 bands in relation
with Pyk bands. (B) RT-PCR of eIF4G1 (TIF4631), RPG1 and TUB1 (control)
mRNA during exponential (YPD) and stationary (SP) phase.
Role of PKA isoforms in translation 5229

Journ
alof
Cell
Scie
nce
of Pat1, a conserved constituent of PBs that functions as a
scaffold during the assembly process (Ramachandran et al.,
2011). In the light of our results, it seems likely that Tpk1, Tpk2
and Tpk3 are functionally redundant for Pat1 phosphorylation
since all of the Tpk-deleted strains were able to accumulate PBs.
Intriguingly Tpk2 and Tpk3 associate with PBs; where
unphosphorylated Pat1 is expected. PKA targets residues in the
C-terminus of Pat1, which is essential for the interaction with
mRNA decapping factors, i.e. Dcp2, Edc4 and Lsm1-7 (Braun
et al., 2010). It seems possible that the association of Tpk2 and
Tpk3 with PBs occurs after the establishment of protein-protein
interactions required for core PB formation (Decker et al., 2007).
A role for PKA in translational inhibition during
stationary phase
The Ras/PKA signalling pathway in S. cerevisiae is thought to
regulate the entry into stationary phase and thus the survival of
cells within this resting state (Dechant and Peter, 2008; Herman,
2002).
Our results strongly suggest that Tpk2 and Tpk3 have a role in
the translation inhibition that occurs during entry into stationary
phase (Fig. 6). First, the deletion of either TPK2 or TPK3 produces
a decrease in the cells capacity to accumulate Dcp2 and eIF4E
containing granules that correlate with reduced translational
inhibition even during the stationary phase of growth. Second,
the TPK3 deletion, in particular, induced the accumulation of
eIF4E granules associated with the ENO2 mRNA after glucose
addition to stationary phase cells. Biochemical analysis of these
granules (Fig. 5B) and their persistence after cycloheximide
addition (data not shown) suggests that these eIF4E granules do
not correspond to SGs (stress granules induced by glucose
depletion). Third, the tpk3D strain showed a faster translational
recovery from stationary phase (Fig. 8B) than the WT and other
tpk mutants, which may be due to this aberrant granule formation.
In S. cerevisiae, it has been observed that nutritional deprivation
or interruption of the TOR signal transduction pathway induces
eIF4G1 degradation which would negatively regulate translation,
allowing growth arrest in G1 phase. Degradation of this factor could
Fig. 8. Tpk3 controls translation activation
dynamics. WT, tpk1D, tpk2D and tpk3D polysome
profiles were analysed by sucrose gradient
sedimentation at the different times points indicated
in the figure. (A) Cells were grown to exponential
phase in YPD, subjected to glucose starvation (YP)
and re-fed with YPD. (B) Cells were grown to
stationary phase and re-fed with YPD. The graphs
show the polysome/monosome area ratio along the
time course. Values are means 6 s.d., n52.
Representative polysome profiles of the times
indicated are shown.
Journal of Cell Science 125 (21)5230

Journ
alof
Cell
Scie
nce
be required for proper entry of the cells into the stationary phase
(Berset et al., 1998). Here, for the first time, we have determined
that Rpg1 protein abundance drastically decreases during stationary
phase. On the contrary, tpk1D, tpk2D and tpk3D strains showed
high abundance of eIF4G1 and Rpg1 proteins, with levels similar to
those observed in cells growing in exponential phase (Fig. 7). This
observation could justify, at least partly, the higher translational
activity observed in TPK-deleted strains when compared with WT
cells. Moreover, we observed that TPK-deleted strains grew quicker
than WT cells during the diauxic shift as a consequence of a delay
in cell cycle arrest (supplementary material Fig. S2). Our results
suggest that PKA signalling would control the Rpg1 and eIF4G1
protein abundance allowing the entry into stationary phase
(supplementary material Fig. S2; Fig. 7). The characterization of
translation factors present in the PBs and SGs in stationary phase
(Figs 5, 6) shows that the Rpl35A ribosomal protein is present. The
possibility that the large ribosomal subunit is in granules during
stationary phase highlights that a proportion of ribosomes may exist
as 80S ribosomes. If these 80S ribosomes are mRNA associated,
their presence in protein aggregates could facilitate a rapid
resumption of translation in appropriate conditions.
Conclusion
Our results suggest that PKA may connect glucose availability with
the cell cycle and with the robustness of cellular translation. PKA
seems to be involved in multiple steps of translation regulation
including interaction with the translational machinery, localisation in
RNP granules, control of mRNA storage and granule composition, as
well as the regulation of Rpg1 and eIF4G1 protein abundance. This
work highlights the intricate and multitudinous network of inputs that
signalling pathways, such as the Ras/PKA pathway, can have on
fundamental processes such as the synthesis of proteins especially
under changing cellular conditions.
Materials and MethodsYeast strains and plasmids
The strains and plasmids used in this study are listed in supplementary materialTables S1 and S2.
Media, growth conditions and drug treatment
Strains were grown on rich medium containing 2% bactopeptone, 1% yeast extractand 2% glucose (YPD). Synthetic medium containing 0.67% yeast nitrogen basewithout amino acids, 2% glucose, plus the necessary additions to fulfil auxotrophicrequirements (SCD) was used to maintain the selectable plasmid. Solid mediacontained 2% agar. Cells in stationary phase were obtained by growth on YPD for7 days or in SCD for 3 days at 30 C. The re-feeding experiments were performedby transferring the cells to fresh YPD medium. Glucose-depleted cells wereobtained from cells in exponential phase in YPD or SCD, washed twice with YP orSC medium, resuspension in the same medium lacking glucose for different times.For the cycloheximide treatment, cells were grown to exponential phase in YPD,treated with 100 mg/ml cycloheximide for 10 minutes before glucose addition inthe presence of cycloheximide.
Crude extract western blotting
Strains were grown in the appropriate medium until exponential or stationary phase,lysed by disruption with glass beads at 4 C in an appropriate buffer (Portela et al.,2002), and centrifuged at 5000 g for 5 minutes. The crude extract was resolved bySDS-PAGE and analysed by western blotting. Blots were probed using the relevantprimary antibody. Samples containing SG components were prepared as describedpreviously (Teixeira et al., 2005). Pellet fraction was treated with 1 mg/ml RNase Afor 30 minutes at room temperature. Pellets and supernatants were analysed bywestern blotting for the presence of translation factors and PB and SG markers. Theimmunoblots shown are representative of two independent experiments.
TAP protein purification
Yeast cultures were grown to an OD600 of 0.6; cells were pelleted, resuspended inYPD or YP, incubated for 20 minutes at 30 C, pelleted, snap frozen and ground
under liquid nitrogen. TAP-affinity purification was carried out on the cell lysatesas described previously (Castelli et al., 2011). TAP tagged proteins were detectedwith a horseradish peroxidase (HRP) conjugated primary antibody to Protein A(Abcam).
Sucrose density gradient sedimentation analysis
Sucrose density gradients were performed as described previously (Ashe et al.,2000). Briefly, cells were grown to stationary or exponential phase, resuspended inmedium either with or without glucose and incubated at different times (asindicated in each figure). 10 mg/ml cycloheximide was added and cells were lysedwith glass beads. Nine A260 units of pre-cleared lysate were loaded onto 15–50%linear sucrose gradients. After centrifugation for 2.5 h at 40,000 rpm using aSW41Ti rotor (Beckman), the gradients were fractionated from the top. The A254
was measured continuously using an ISCO UA6 gradient collection apparatus.Lower sucrose gradients (7.5–30%) (Nielsen et al., 2004) were centrifuged for4.5 h at 35,000 rpm using a SW55Ti rotor (Beckman). Individual gradientfractions were collected and precipitated with 10% trichloroacetic acid, washedtwice with acetone and resuspended in Laemmli buffer. Proteins were analysed bySDS-PAGE and western blotting.
Fluorescence microscopyFor fixed-time epifluorescence microscopy, cells were grown to stationary orexponential phase (OD600 of 0.6), incubated for 10 minutes with mediumcontaining or not glucose and fixed with 7.4% formaldehyde. Confocal imageswere taken at room temperature by a confocal microscope (Eclipse E600; Nikon)using a 1006/0.5–1.3 NA plan APO oil objective and camera (Axiocam MRm).Images were acquired using Axiovision 4.5 software (Carl Zeiss MicroImaging,Inc.). Representative cells are shown from experiments repeated at least five times.Granules of approximately 100–200 nm diameter were counted in .100 cells. Forclarity the images shown are single planes. The numbers on the images representthe mean 6 s.d. of five independent experiments.
For time-course epifluorescence microscopy, cells were grown to stationary orexponential phase, washed twice with SC medium either with or without glucoseand 2 ml of cell suspension was applied to poly-lysine-coated glass slides. Real-time 2D deconvoluted projections generated from continuous Z-sweep acquisitionwere captured at room temperature using a microscope system (Delta Vision RT;Applied Precision) with a 1006/1.40NA differential interference contrast oil planApo objective (Olympus) and camera (CoolSNAP HQ; Roper Scientific) usingSoftworx 1.1 software (Applied Precision) and 262 binning. Images were takenover the course of 1 h every 5 minutes, allowing 10 minutes initially forexperimental set-up. A representative cell is shown from an experiment repeatedat least five times. For colocalisation scoring per cell, replicates were analysedusing ImageJ (National Institutes of Health).
RNA extraction and semi-quantitative RT-PCR
Total RNA extraction was performed using hot phenol protocol as described previously(Ocampo et al., 2009). Semi-quantitative reverse transcription-PCR (RT-PCR) of eachmRNA was performed using the TUB1 gene as an internal standard. ENO2 for+963: 59-TGACTTGACTGTCACCAACCCAGCTAGAATTG-39, ENO2rev+1257: 59-GGAA-GTTTTCACCGGCGTAG-39, ENO2for+166: 59-AAGTGGATGGGTAAGGGTGTT-ATGAAC-39, ENO2rev+294: 59-CTTGGACTTGTTGGCGGTACCA-39, TIF4631for
+183: 59-GAACTAAAGAAAGGTAAGCTGC-39, TIF4631rev+466: 59-CGATAT-GATTCCCAAGTAAATC-39, eIF4G1for+203: 59-GATATAACAACCGTGGCAAC-39, eIF4G1rev+518: 59-GAAGTAGAAGTAGAATCAGAAG-39, TUB1for: 59-CAAG-GGTTCTTGTTTACCCATTC-39, TUB1rev: 59-GGATAAGACTGGAGAATATGA-AAC-39. The PCR products were electophoresed in a 2% agarose gel.
Statistical analysis of the dataAll the experiments were repeated several times with independent cultures andenzymatic preparations. The data shown in figures were analysed using ANOVAand Tukey’s HSD test, a: 0.05.
AcknowledgementsWe are grateful to M. Pool (The University of Manchester) for thekind gift of a-Rps3 and a-Rpl35A antibodies, J. Gerst (WeizmannInstitute for Science) for MS2 tagging reagents and R. Parker for thekind gift of pRP115. We are grateful to the Journal for Cell Sciencefor a Travelling Fellowship.
FundingThis work was supported by a PhD fellowship from ConsejoNacional de Investigaciones Cientıficas y Tecnicas to V.T.; aEuropean Molecular Biology Organization Short Term Fellowship toV.T.; the Agencia Nacional de Promocion Cientıfica y TecnologicaPICT 2195 [grant number 2008-2195 to P.P.]; the University of
Role of PKA isoforms in translation 5231

Journ
alof
Cell
Scie
nce
Buenos Aires [grant number UBAX-528 to P.P.]; Consejo Nacionalde Investigaciones Cientıficas y Tecnicas [grant number PIP0519 toS.M.]; C.S. was supported by a Wellcome Trust project grant [grantnumber 088141/Z/09/Z to M.P.A.]; L.C. was supported by aBiotechnology and Biological Sciences Research Council [grantnumbers Lola BB/G012571/1 to M.P.A.]; both N.H. and J.L. weresupported by BBSRC funded studentships. Deposited in PMC forimmediate release.
Supplementary material available online at
http://jcs.biologists.org/lookup/suppl/doi:10.1242/jcs.111534/-/DC1
ReferencesAnderson, P. and Kedersha, N. (2006). RNA granules. J. Cell Biol. 172, 803-808.Ashe, M. P., De Long, S. K. and Sachs, A. B. (2000). Glucose depletion rapidly inhibits
translation initiation in yeast. Mol. Biol. Cell 11, 833-848.Berset, C., Trachsel, H. and Altmann, M. (1998). The TOR (target of rapamycin)
signal transduction pathway regulates the stability of translation initiation factoreIF4G in the yeast Saccharomyces cerevisiae. Proc. Natl. Acad. Sci. USA 95, 4264-4269.
Beullens, M., Mbonyi, K., Geerts, L., Gladines, D., Detremerie, K., Jans, A. W. and
Thevelein, J. M. (1988). Studies on the mechanism of the glucose-induced cAMPsignal in glycolysis and glucose repression mutants of the yeast Saccharomycescerevisiae. Eur. J. Biochem. 172, 227-231.
Braun, J. E., Tritschler, F., Haas, G., Igreja, C., Truffault, V., Weichenrieder,
O. and Izaurralde, E. (2010). The C-terminal alpha-alpha superhelix of Pat isrequired for mRNA decapping in metazoa. EMBO J. 29, 2368-2380.
Brengues, M. and Parker, R. (2007). Accumulation of polyadenylated mRNA, Pab1p,eIF4E, and eIF4G with P-bodies in Saccharomyces cerevisiae. Mol. Biol. Cell 18,2592-2602.
Buchan, J. R., Muhlrad, D. and Parker, R. (2008). P bodies promote stress granuleassembly in Saccharomyces cerevisiae. J. Cell Biol. 183, 441-455.
Buchan, J. R., Yoon, J. H. and Parker, R. (2011). Stress-specific composition,assembly and kinetics of stress granules in Saccharomyces cerevisiae. J. Cell Sci. 124,228-239.
Castelli, L. M., Lui, J., Campbell, S. G., Rowe, W., Zeef, L. A., Holmes, L. E., Hoyle,N. P., Bone, J., Selley, J. N., Sims, P. F. et al. (2011). Glucose depletion inhibitstranslation initiation via eIF4A loss and subsequent 48S preinitiation complexaccumulation, while the pentose phosphate pathway is coordinately up-regulated.Mol. Biol. Cell 22, 3379-3393.
Chevtzoff, C., Vallortigara, J., Averet, N., Rigoulet, M. and Devin, A. (2005). Theyeast cAMP protein kinase Tpk3p is involved in the regulation of mitochondrialenzymatic content during growth. Biochim. Biophys. Acta 1706, 117-125.
Chiu, W. L., Wagner, S., Herrmannova, A., Burela, L., Zhang, F., Saini, A. K.,
Valasek, L. and Hinnebusch, A. G. (2010). The C-terminal region of eukaryotictranslation initiation factor 3a (eIF3a) promotes mRNA recruitment, scanning, and,together with eIF3j and the eIF3b RNA recognition motif, selection of AUG startcodons. Mol. Cell. Biol. 30, 4415-4434.
Davidson, G. S., Joe, R. M., Roy, S., Meirelles, O., Allen, C. P., Wilson, M. R.,
Tapia, P. H., Manzanilla, E. E., Dodson, A. E., Chakraborty, S. et al. (2011). Theproteomics of quiescent and nonquiescent cell differentiation in yeast stationary-phase cultures. Mol. Biol. Cell 22, 988-998.
Dechant, R. and Peter, M. (2008). Nutrient signals driving cell growth. Curr. Opin.
Cell Biol. 20, 678-687.Decker, C. J., Teixeira, D. and Parker, R. (2007). Edc3p and a glutamine/asparagine-
rich domain of Lsm4p function in processing body assembly in Saccharomycescerevisiae. J. Cell Biol. 179, 437-449.
Ferrero, P. V., Layana, C., Paulucci, E., Gutierrez, P., Hernandez, G. and Rivera-Pomar, R. V. (2012). Cap binding-independent recruitment of eIF4E to cytoplasmicfoci. Biochim. Biophys. Acta 1823, 1217-1224.
Grousl, T., Ivanov, P., Frydlova, I., Vasicova, P., Janda, F., Vojtova, J., Malınska,
K., Malcova, I., Novakova, L., Janoskova, D. et al. (2009). Robust heat shockinduces eIF2alpha-phosphorylation-independent assembly of stress granules containingeIF3 and 40S ribosomal subunits in budding yeast, Saccharomyces cerevisiae.J. Cell Sci. 122, 2078-2088.
Haim, L., Zipor, G., Aronov, S. and Gerst, J. E. (2007). A genomic integrationmethod to visualize localization of endogenous mRNAs in living yeast. Nat. Methods
4, 409-412.Herman, P. K. (2002). Stationary phase in yeast. Curr. Opin. Microbiol. 5, 602-607.Hilliker, A. and Parker, R. (2008). Stressed out? Make some modifications! Nat. Cell
Biol. 10, 1129-1130.Hoyle, N. P., Castelli, L. M., Campbell, S. G., Holmes, L. E. and Ashe, M. P. (2007).
Stress-dependent relocalization of translationally primed mRNPs to cytoplasmicgranules that are kinetically and spatially distinct from P-bodies. J. Cell Biol. 179, 65-74.
Huh, W. K., Falvo, J. V., Gerke, L. C., Carroll, A. S., Howson, R. W., Weissman,
J. S. and O’Shea, E. K. (2003). Global analysis of protein localization in buddingyeast. Nature 425, 686-691.
Jackson, R. J., Hellen, C. U. and Pestova, T. V. (2010). The mechanism of eukaryotictranslation initiation and principles of its regulation. Nat. Rev. Mol. Cell Biol. 11, 113-127.
Kato, K., Yamamoto, Y. and Izawa, S. (2011). Severe ethanol stress induces assemblyof stress granules in Saccharomyces cerevisiae. Yeast 28, 339-347.
Kedersha, N., Stoecklin, G., Ayodele, M., Yacono, P., Lykke-Andersen, J., Fritzler,
M. J., Scheuner, D., Kaufman, R. J., Golan, D. E. and Anderson, P. (2005). Stressgranules and processing bodies are dynamically linked sites of mRNP remodeling.J. Cell Biol. 169, 871-884.
Kraakman, L., Lemaire, K., Ma, P., Teunissen, A. W., Donaton, M. C., Van Dijck,
P., Winderickx, J., de Winde, J. H. and Thevelein, J. M. (1999). A Saccharomycescerevisiae G-protein coupled receptor, Gpr1, is specifically required for glucoseactivation of the cAMP pathway during the transition to growth on glucose. Mol.
Microbiol. 32, 1002-1012.
Lui, J., Campbell, S. G. and Ashe, M. P. (2010). Inhibition of translation initiationfollowing glucose depletion in yeast facilitates a rationalization of mRNA content.Biochem. Soc. Trans. 38, 1131-1136.
McAlister, L. and Holland, M. J. (1982). Targeted deletion of a yeast enolase structuralgene. Identification and isolation of yeast enolase isozymes. J. Biol. Chem. 257, 7181-7188.
Narayanaswamy, R., Levy, M., Tsechansky, M., Stovall, G. M., O’Connell, J. D.,
Mirrielees, J., Ellington, A. D. and Marcotte, E. M. (2009). Widespreadreorganization of metabolic enzymes into reversible assemblies upon nutrientstarvation. Proc. Natl. Acad. Sci. USA 106, 10147-10152.
Nielsen, K. H., Szamecz, B., Valasek, L., Jivotovskaya, A., Shin, B. S. and
Hinnebusch, A. G. (2004). Functions of eIF3 downstream of 48S assembly impactAUG recognition and GCN4 translational control. EMBO J. 23, 1166-1177.
Ocampo, J., Fernandez Nunez, L., Silva, F., Pereyra, E., Moreno, S., Garre, V. and
Rossi, S. (2009). A subunit of protein kinase a regulates growth and differentiation inthe fungus Mucor circinelloides. Eukaryot. Cell 8, 933-944.
Oshima, T. and Takano, I. (1980). Mutants Showing Heterothallism from aHomothallic Strain of SACCHAROMYCES CEREVISIAE. Genetics 94, 841-857.
Parker, R. and Sheth, U. (2007). P bodies and the control of mRNA translation anddegradation. Mol. Cell 25, 635-646.
Pestova, T. V., Lorsch, J. R. and Hellen, C. U. T. (2007). Mechanisms of translationinitiation in eukaryotes. In Translational Control in Biology and Medicine (ed. M. B.Mathews, N. Sonenberg and J. W. B. Hershey), pp. 87-128. Cold Spring Harbor, NY:Cold Spring Harbor Laboratory Press.
Portela, P., Howell, S., Moreno, S. and Rossi, S. K. (2002). In vivo and in vitrophosphorylation of two isoforms of yeast pyruvate kinase by protein kinase A. J. Biol.
Chem. 277, 30477-30487.
Ramachandran, V., Shah, K. H. and Herman, P. K. (2011). The cAMP-dependent proteinkinase signaling pathway is a key regulator of P body foci formation. Mol. Cell 43, 973-981.
Reijns, M. A., Alexander, R. D., Spiller, M. P. and Beggs, J. D. (2008). A role for Q/N-rich aggregation-prone regions in P-body localization. J. Cell Sci. 121, 2463-2472.
Rolland, F., De Winde, J. H., Lemaire, K., Boles, E., Thevelein, J. M. and
Winderickx, J. (2000). Glucose-induced cAMP signalling in yeast requires both aG-protein coupled receptor system for extracellular glucose detection and a separablehexose kinase-dependent sensing process. Mol. Microbiol. 38, 348-358.
Rothstein, R. (1991). Targeting, disruption, replacement, and allele rescue: integrativeDNA transformation in yeast. Methods Enzymol. 194, 281-301.
Santangelo, G. M. (2006). Glucose signaling in Saccharomyces cerevisiae. Microbiol.
Mol. Biol. Rev. 70, 253-282.
Sheth, U. and Parker, R. (2003). Decapping and decay of messenger RNA occur incytoplasmic processing bodies. Science 300, 805-808.
Teixeira, D., Sheth, U., Valencia-Sanchez, M. A., Brengues, M. and Parker,
R. (2005). Processing bodies require RNA for assembly and contain nontranslatingmRNAs. RNA 11, 371-382.
Toda, T., Cameron, S., Sass, P., Zoller, M., Scott, J. D., McMullen, B., Hurwitz, M.,
Krebs, E. G. and Wigler, M. (1987). Cloning and characterization of BCY1, a locusencoding a regulatory subunit of the cyclic AMP-dependent protein kinase inSaccharomyces cerevisiae. Mol. Cell. Biol. 7, 1371-1377.
Tudisca, V., Recouvreux, V., Moreno, S., Boy-Marcotte, E., Jacquet, M. and
Portela, P. (2010). Differential localization to cytoplasm, nucleus or P-bodies ofyeast PKA subunits under different growth conditions. Eur. J. Cell Biol. 89, 339-348.
Wells, S. E., Hillner, P. E., Vale, R. D. and Sachs, A. B. (1998). Circularization ofmRNA by eukaryotic translation initiation factors. Mol. Cell 2, 135-140.
Werner-Washburne, M., Becker, J., Kosic-Smithers, J. and Craig, E. A. (1989).Yeast Hsp70 RNA levels vary in response to the physiological status of the cell.J. Bacteriol. 171, 2680-2688.
Werner-Washburne, M., Braun, E., Johnston, G. C. and Singer, R. A. (1993).Stationary phase in the yeast Saccharomyces cerevisiae. Microbiol. Rev. 57, 383-401.
Werner-Washburne, M., Braun, E. L., Crawford, M. E. and Peck, V. M. (1996).Stationary phase in Saccharomyces cerevisiae. Mol. Microbiol. 19, 1159-1166.
Wilczynska, A., Aigueperse, C., Kress, M., Dautry, F. and Weil, D. (2005). Thetranslational regulator CPEB1 provides a link between dcp1 bodies and stressgranules. J. Cell Sci. 118, 981-992.
Zakrajsek, T., Raspor, P. and Jamnik, P. (2011). Saccharomyces cerevisiae in thestationary phase as a model organism–characterization at cellular and proteome level.J. Proteomics 74, 2837-2845.
Journal of Cell Science 125 (21)5232