pitt&sherry - department of state growth · 3.1 population growth 21 ... stages of this study...
TRANSCRIPT

Infill development within Greater Hobart
Stage 1 report
Prepared for:
Department of Infrastructure, Energy and Resources
(DIER Ref: 1280-1-121)
March 2014
pitt&sherry

i
Contents
1 Introduction 1
1.1 Why infill development? 2
1.2 What is infill development? 2
1.3 Benefits of infill development 3
1.4 Project overview 3
2 Barriers and drivers to the supply of infill housing in Hobart 4
2.1 Site identification and assembly 5
2.2 Development feasibility 7
2.3 Planning and development assessment 11
2.4 Infrastructure provision 14
2.5 Development finance 15
2.6 Construction costs 16
2.7 Summary of barriers and drivers to the supply of infill housing in Hobart 17
3 Barriers and drivers to the demand for infill housing in Hobart 19
3.1 Population growth 21
3.2 Economic growth 21
3.3 Demographic change 21
3.4 Price 22
3.5 Convenience and lifestyle 25
3.6 Amenity 25
3.7 Safety 25
3.8 Design 26
3.9 Summary of barriers and drivers to the demand for infill housing in Hobart 27
A p p e n d ic es
A Case study analysis
L i s t of t a bl e s
1 Impact of revenue on development feasibility of a hypothetical infill project 7
2 Impact of land value on development feasibility of a hypothetical infill project 8
3 Impact of contributions, charges and planning delays
on development feasibility of a hypothetical infill project 9
4 Household income affordability calculator 24

1
1 Introduction
2
1 .1 W h y i n f i l l d ev el op me n t ?
Communities across Australia are increasingly recognising that the economic, environmental and
social costs of urban sprawl outweigh its benefits. As a consequence, policies that limit urban sprawl
and better balance the diverse housing needs of a community are being sought. Encouraging infill
development is one such approach.
1 . 2 W h a t i s i n f i l l d e v el op m e n t?
For the purposes of this study, infill development is defined as new residential development on
vacant or underutilised land within existing neighbourhoods and suburbs. Infill development can
occur on brownfield and greyfield sites where:
Brownfield sites are defined as a ‘real property, the expansion, redevelopment, or reuse of which
may be complicated by the presence or potential presence of a hazardous substance, pollutant, or
contaminant’.1
Greyfield sites are defined as ‘underutilised property assets located in the middle suburbs of large
Australian cities. Greyfields are usually occupied and privately owned sites typical of urban
development undertaken from the 1950s to the 1970s’.2
The Australian Housing and Urban Research Institute (AHURI) identifies numerous housing forms that
can be developed on infill sites:
high-density residential towers (8+ storeys)
high-density residential apartment/flat buildings (4–8 storeys)
walk-up apartment buildings (3 storeys with no lift)
townhouses (2–3 storeys)
villas (1 storey)
ancillary dwellings such as granny flats (1 storey).
Each of these forms of infill development has varying barriers and drivers, often dependent on the
scale of development. Many of the barriers and drivers discussed later in this report typically apply
only to the medium to higher density developments. Ancillary dwellings and small-scale townhouse
developments are not the focus of this study as these developments are already successfully
occurring across Greater Hobart, and indeed in most other municipalities in Tasmania.
However, much greater attention to other forms of infill development is required. Metropolitan
Hobart is at a pivotal time in respect to creating opportunities to facilitate increased infill growth and
development.
Greater land use efficiency through future infill residential growth has the potential to provide major
transport benefits including higher use of public transport, focused traffic movements, lower levels
of infrastructure requirements and shorter journeys to work. Consolidation of key service centres will
reduce the overall distances travelled by people to access goods and services.
1 United States General Services Administration, http://www.gsa.gov/portal/content/104582 (2013). 2 Newton, P, Murray, S, Wakefield, R, Murphy, C, Khor L-A and Morgan, T 2011, Towards a new development model for housing
regeneration in greyfield residential precincts, AHURI Final Report No. 171, Australian Housing and Urban Research Institute, Melbourne.

3
1 .3 B e n e f i ts o f i n f i l l d e ve l op m e n t
Infill development has the potential to generate a range of economic, environmental and social
benefits, some of which are identified below.
Infill development reuses properties or vacant land that may be underutilised, unattractive or
blighted thus helping to improve local amenity and increase property values.3
Fully utilising existing services and infrastructure through infill development before considering
extensions to greenfield areas can offer savings to state and local governments.
Infill development can improve the viability of local centres through increased spending by new
residents, in turn boosting jobs and generating revenues for state and local governments.
Infill development can facilitate relationship-building and contribute to a sense of community and
security.4
Infill development can diversify the supply of housing.
Located in close proximity to transit routes and within walking distance of services, shops and
entertainment, infill development can reduce private car use and associated congestion and
pollution, increase mobility for those who cannot drive or prefer not to drive, and support mass
transit and alternative modes of transportation such as walking and bicycling.5
Infill development contributes to a more compact form of development which is less consumptive
of land and resources.6
1 .4 P r oj e c t ov e rv i ew
The purpose of this stage 1 report is to identify the barriers and drivers to delivering more infill
development in Hobart. Importantly, the study considers both the supply and demand-side factors
that encourage and inhibit infill development. A subsequent stage 2 report will include
recommendations and initiatives for enhancing drivers and overcoming barriers to infill development
in Hobart.
Information for this report was gathered through a comprehensive review of national and
international literature; through interviews with fourteen people from Tasmania’s property
development industry and a survey of residents currently living in thirteen infill developments
around Hobart; and through a detailed case study analysis of five Hobart infill developments
(Appendix A). It is important to note that the response from the consultation with the property
development industry and also the developers responsible for the case studies analysed are
sometimes perceptions or based on isolated experiences and, as such, may be disputable or not
applicable in a general sense. However, these views are important to capture and inform the next
stages of this study as their perceptions will inform the extent to which they take on future infill
developments in many cases.
This report firstly discusses the barriers and drivers to supplying more infill development in Hobart.
The report then addresses the factors influencing demand for infill development.
3 Policy Link, Infill Incentives, http://policylink.info/EDTK/Infill/ (2013). 4 Baldwin, C, Osborne, C and Smith, P 2012, Infill Development for Older Australians in South East Queensland,
University of the Sunshine Coast. 5 ibid. 6 Municipal Research & Services Center of Washington, Infill Development Strategies for Shaping Livable Neighborhoods, June 1997.

4
2 Barriers and drivers to the supply of infill housing in Hobart
5
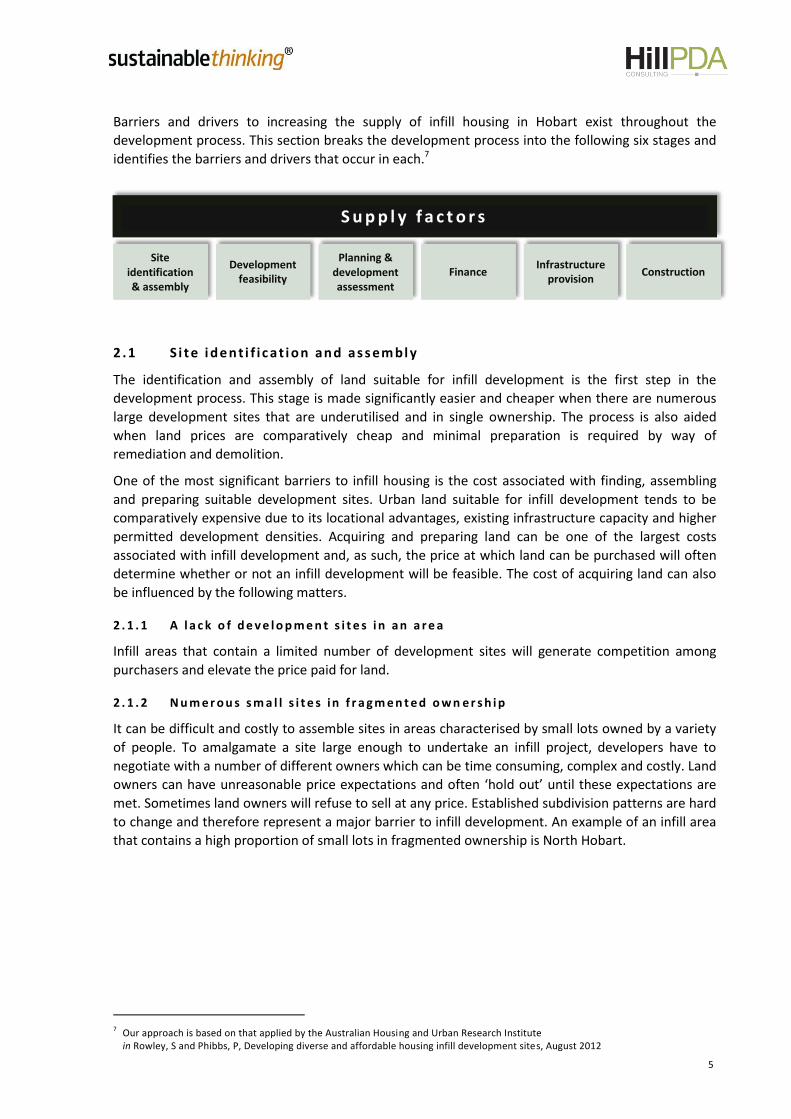
Barriers and drivers to increasing the supply of infill housing in Hobart exist throughout the
development process. This section breaks the development process into the following six stages and
identifies the barriers and drivers that occur in each.7
2 .1 S i t e i d e n t i f i c a t i on an d a s s em bl y
The identification and assembly of land suitable for infill development is the first step in the
development process. This stage is made significantly easier and cheaper when there are numerous
large development sites that are underutilised and in single ownership. The process is also aided
when land prices are comparatively cheap and minimal preparation is required by way of
remediation and demolition.
One of the most significant barriers to infill housing is the cost associated with finding, assembling
and preparing suitable development sites. Urban land suitable for infill development tends to be
comparatively expensive due to its locational advantages, existing infrastructure capacity and higher
permitted development densities. Acquiring and preparing land can be one of the largest costs
associated with infill development and, as such, the price at which land can be purchased will often
determine whether or not an infill development will be feasible. The cost of acquiring land can also
be influenced by the following matters.
2 . 1 . 1 A l a c k o f d e v e l o p m e n t s i t e s i n a n a r e a
Infill areas that contain a limited number of development sites will generate competition among
purchasers and elevate the price paid for land.
2 . 1 . 2 N u m e r o u s s m a l l s i t e s i n f r a g m e n t e d o w n e r s h i p
It can be difficult and costly to assemble sites in areas characterised by small lots owned by a variety
of people. To amalgamate a site large enough to undertake an infill project, developers have to
negotiate with a number of different owners which can be time consuming, complex and costly. Land
owners can have unreasonable price expectations and often ‘hold out’ until these expectations are
met. Sometimes land owners will refuse to sell at any price. Established subdivision patterns are hard
to change and therefore represent a major barrier to infill development. An example of an infill area
that contains a high proportion of small lots in fragmented ownership is North Hobart.
7 Our approach is based on that applied by the Australian Housing and Urban Research Institute
in Rowley, S and Phibbs, P, Developing diverse and affordable housing infill development sites, August 2012
S u p p l y f a c t o r s
Site identification & assembly
Development feasibility
Planning & development assessment
Finance Infrastructure
provision Construction
6
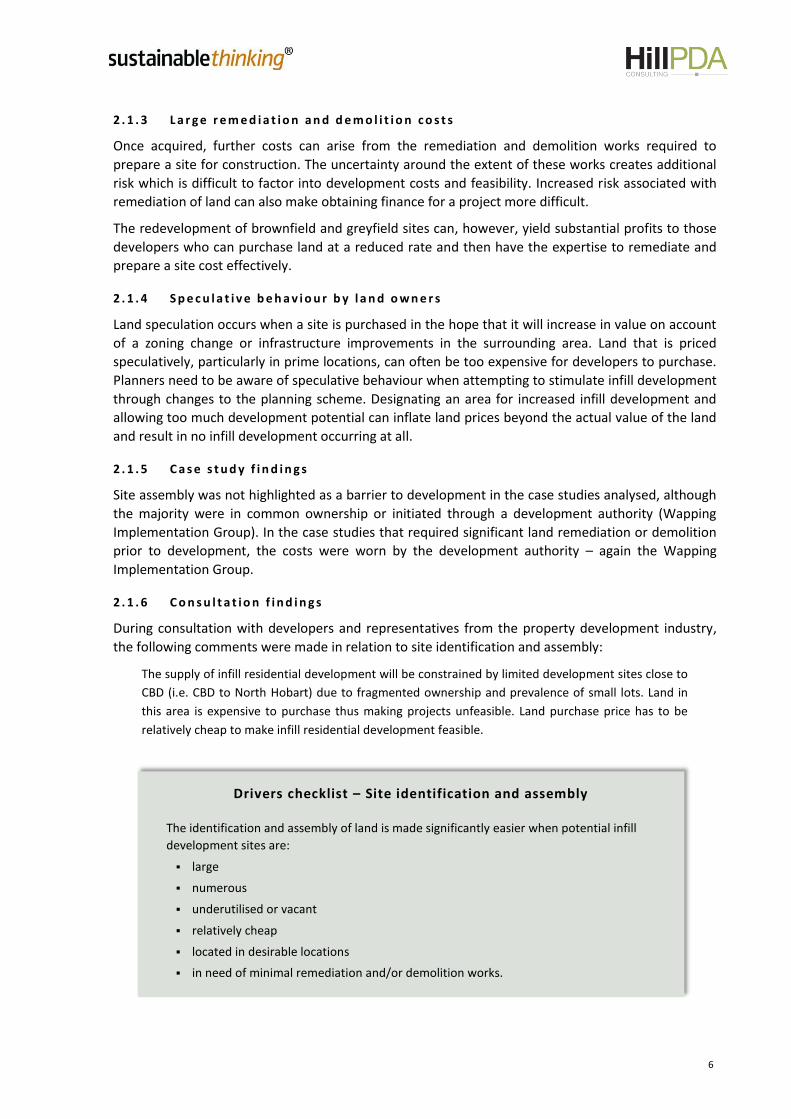
Drivers checklist – Site identification and assembly
The identification and assembly of land is made significantly easier when potential infill
development sites are:
large
numerous
underutilised or vacant
relatively cheap
located in desirable locations
in need of minimal remediation and/or demolition works.
2 . 1 . 3 L a r g e r e m e d i a t i o n a n d d e m o l i t i o n c o s t s
Once acquired, further costs can arise from the remediation and demolition works required to
prepare a site for construction. The uncertainty around the extent of these works creates additional
risk which is difficult to factor into development costs and feasibility. Increased risk associated with
remediation of land can also make obtaining finance for a project more difficult.
The redevelopment of brownfield and greyfield sites can, however, yield substantial profits to those
developers who can purchase land at a reduced rate and then have the expertise to remediate and
prepare a site cost effectively.
2 . 1 . 4 S p e c u l a t i v e b e h a v i o u r b y l a n d o w n e r s
Land speculation occurs when a site is purchased in the hope that it will increase in value on account
of a zoning change or infrastructure improvements in the surrounding area. Land that is priced
speculatively, particularly in prime locations, can often be too expensive for developers to purchase.
Planners need to be aware of speculative behaviour when attempting to stimulate infill development
through changes to the planning scheme. Designating an area for increased infill development and
allowing too much development potential can inflate land prices beyond the actual value of the land
and result in no infill development occurring at all.
2 . 1 . 5 C a s e s t u d y f i n d i n g s
Site assembly was not highlighted as a barrier to development in the case studies analysed, although
the majority were in common ownership or initiated through a development authority (Wapping
Implementation Group). In the case studies that required significant land remediation or demolition
prior to development, the costs were worn by the development authority – again the Wapping
Implementation Group.
2 . 1 . 6 C o n s u l t a t i o n f i n d i n g s
During consultation with developers and representatives from the property development industry,
the following comments were made in relation to site identification and assembly:
The supply of infill residential development will be constrained by limited development sites close to
CBD (i.e. CBD to North Hobart) due to fragmented ownership and prevalence of small lots. Land in
this area is expensive to purchase thus making projects unfeasible. Land purchase price has to be
relatively cheap to make infill residential development feasible.
7
2 . 2 D e v el op m e nt f e as i b i l i t y
Infill development will not occur unless it is sufficiently profitable for developers to build it.
Development feasibility is therefore critical to the delivery of infill housing. If a developer’s analysis
indicates the costs and revenues of a project are such that an adequate profit cannot be made, the
infill project will not go ahead. Developers interviewed during the consultation process indicated that
infill development away from Hobart’s waterfront rarely stacks up from a feasibility perspective.
As a consequence, a number of Hobart’s larger developers are currently focusing on commercial and
industrial projects. This situation is not unique to Hobart. According to a study into infill development
undertaken by the Australian Housing and Urban Research Institute, the vast majority of infill
projects around Australia do not progress beyond the feasibility assessment stage.
Developers usually require a profit of 10–25% in return for taking on the risks associated with a
project.8 The profit required will vary and depends on a range of risk factors like the quality of the
location, proven demand for the product in an area, the wider economic environment, the type of
development and the amount of debt associated with the project.9
The AHURI study uses a number of simple calculations to illustrate the impact of sales price, land
cost, developer charges and planning delays on development feasibility. This report will use a similar
approach but will be adapted to better reflect market conditions in Hobart.
2 . 2 . 1 I m p a c t o f r e v e n u e o n d e v e l o p m e n t f e a s i b i l i t y
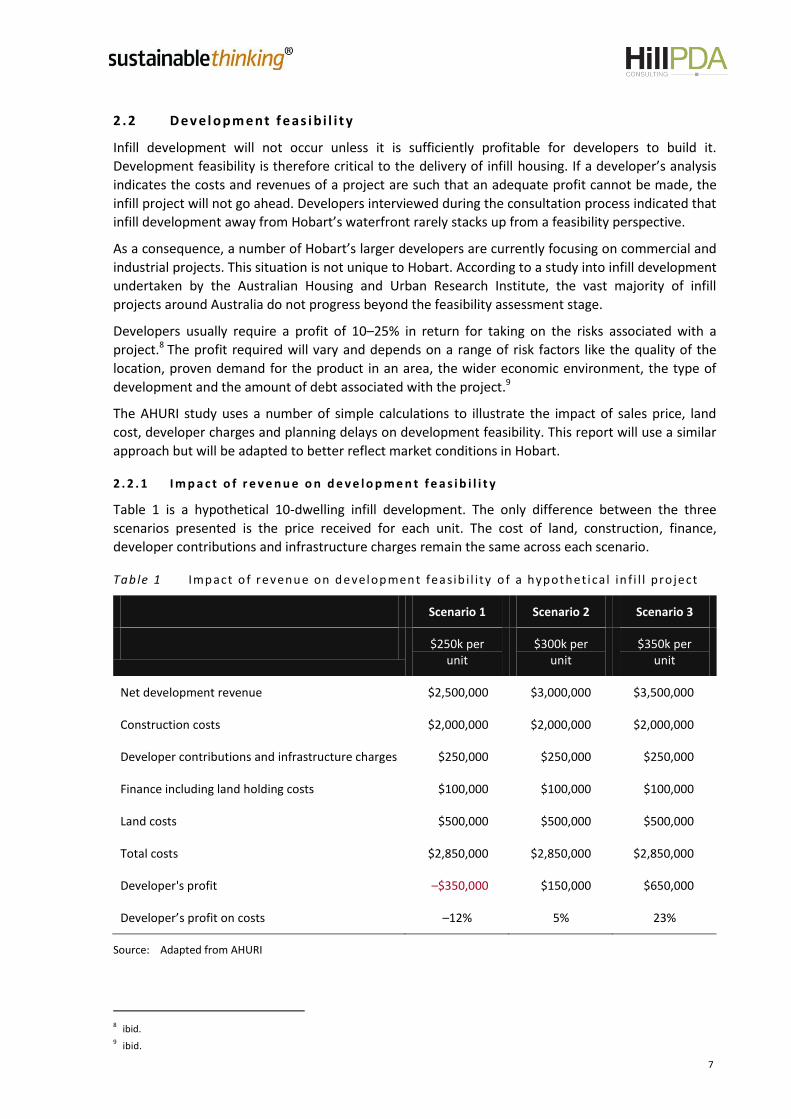
Table 1 is a hypothetical 10-dwelling infill development. The only difference between the three
scenarios presented is the price received for each unit. The cost of land, construction, finance,
developer contributions and infrastructure charges remain the same across each scenario.
Tab le 1 Impact o f revenue on development feasib i l i ty o f a hypothet ical in f i l l pro ject
Scenario 1 Scenario 2 Scenario 3
$250k per unit
$300k per unit
$350k per unit
Net development revenue $2,500,000 $3,000,000 $3,500,000
Construction costs $2,000,000 $2,000,000 $2,000,000
Developer contributions and infrastructure charges $250,000 $250,000 $250,000
Finance including land holding costs $100,000 $100,000 $100,000
Land costs $500,000 $500,000 $500,000
Total costs $2,850,000 $2,850,000 $2,850,000
Developer's profit –$350,000 $150,000 $650,000
Developer’s profit on costs –12% 5% 23%
Source: Adapted from AHURI
8 ibid. 9 ibid.

8
Under the first scenario ($250,000 per unit) the developer would make a loss and the project would
not proceed. Under the second scenario ($300,000 per unit) the developer would secure a 3% profit
on costs which would be an insufficient return to cover the risk associated with the project. In both
these scenarios, development costs would have to be significantly reduced for the project to
proceed. This might mean lowering development contributions or infrastructure charges or providing
the land at a lower price. Table 1 shows the hypothetical development will only be feasible if all units
can be sold for $350,000 (scenario 3).
2 . 2 . 2 I m p a c t o f l a n d v a l u e o n d e v e l o p m e n t f e a s i b i l i t y
Land value is a key determinant of project feasibility. In very simple terms, land value is calculated by
deducting anticipated costs and required profit from the project’s expected revenue. Put another
way, the value a developer places on land is the amount of money they could afford to buy a site for
and still make an acceptable profit after all anticipated development costs are deducted from
revenues.
The value a developer places on a potential site does not always equate to the land owner’s asking
price. When a land owner’s price expectations are inflated, developers are less likely to purchase a
site because it will be harder for them to achieve the profit required on an infill project. A project is
more likely to be feasible when the price at which land owners are willing to sell their land aligns with
the value a developer places on it.
Table 2 provides a simplified hypothetical example of how land value can impact the feasibility of an
infill development. In the hypothetical example, the anticipated construction costs and required
profit remain the same across each scenario but the expected revenues depend on the location of
the development. The sale of units in the high value area (scenario 1) will generate $5,000,000 in
revenue but only $4,250,000 in the medium value area (scenario 2), and so on.
In the high value area (scenario 1) the developer could afford to buy the site for $1 million and still
make their required profit ($875,000). In the medium value area (scenario 2) the developer could
only afford to buy the land for $250,000 to generate their required profit. In the low value area
(scenario 3) it would not be feasible for the developer to purchase the land. However, Table 2 shows
that a more modest infill development (i.e. fewer dwellings built at a lower cost) could still be
profitable in the low value area (scenario 4).
Tab le 2 Impact o f land va l ue on development feasib i l i ty of a hypothet ical in f i l l p roject
Scenario 1 Scenario 2 Scenario 3 Scenario 4
High-value area
Medium-value area
Low-value area
Alternative for low-
value area
Net development revenue $5,000,000 $4,250,000 $3,500,000 $1,500,000
Construction costs $2,500,000 $2,500,000 $2,500,000 $850,000
Developer contributions and infrastructure charges
$250,000
$250,000
$250,000
$100,000
Finance including land holding costs $375,000 $375,000 $375,000 $100,000
Developer's profit $875,000 $875,000 $875,000 $200,000
Land value $1,000,000 $250,000 -$500,000 $250,000
Source: Adapted from AHURI
9
This analysis also highlights why it is important for state and local government planners to consider
the feasibility of development when formulating land use strategies. As previously mentioned,
designating an area for increased infill development and allowing too much development potential
can inflate land price expectations beyond the actual value of the land. Trying to align land owners’
expectations with what the market can actually support is not something well suited to planning
policy. Rather, regular and effective engagement with land owners is a more effective means of
ensuring land owners’ price expectations are informed by the market conditions and what it takes to
make a development feasible. This requires sending clear messages about what government
intentions are (and are not) in renewal areas and also educating owners about the feasibility of
development. Government planners, too, can benefit from a better understanding of development
feasibility. Without understanding the basic parameters required to make infill development feasible,
planners risk creating strategies that will never be realised. Scenario 4 above also shows that by
being flexible and creative, developers can increase the feasibility of infill development.
2 . 2 . 3 I m p a c t o f c o n t r i b u t i o n s , c h a r g e s a n d p l a n n i n g d e l a y s o n d e v e l o p m e n t f e a s i b i l i t y
Developers need certainty to undertake an infill project. Before committing to a project, developers
will estimate all potential costs and revenues and decide whether they can make their required
profit. Any uncertainty around costs increases the risk of a development and reduces its feasibility.
Uncertainty can be generated from unexpected costs associated with delays in the planning process
and from changes to developer contributions and infrastructure charges levied at a later stage. These
unexpected costs eat into a developer’s profit margin and erode project feasibility. If the risk of
unexpected costs is too high, developers will not undertake a project.
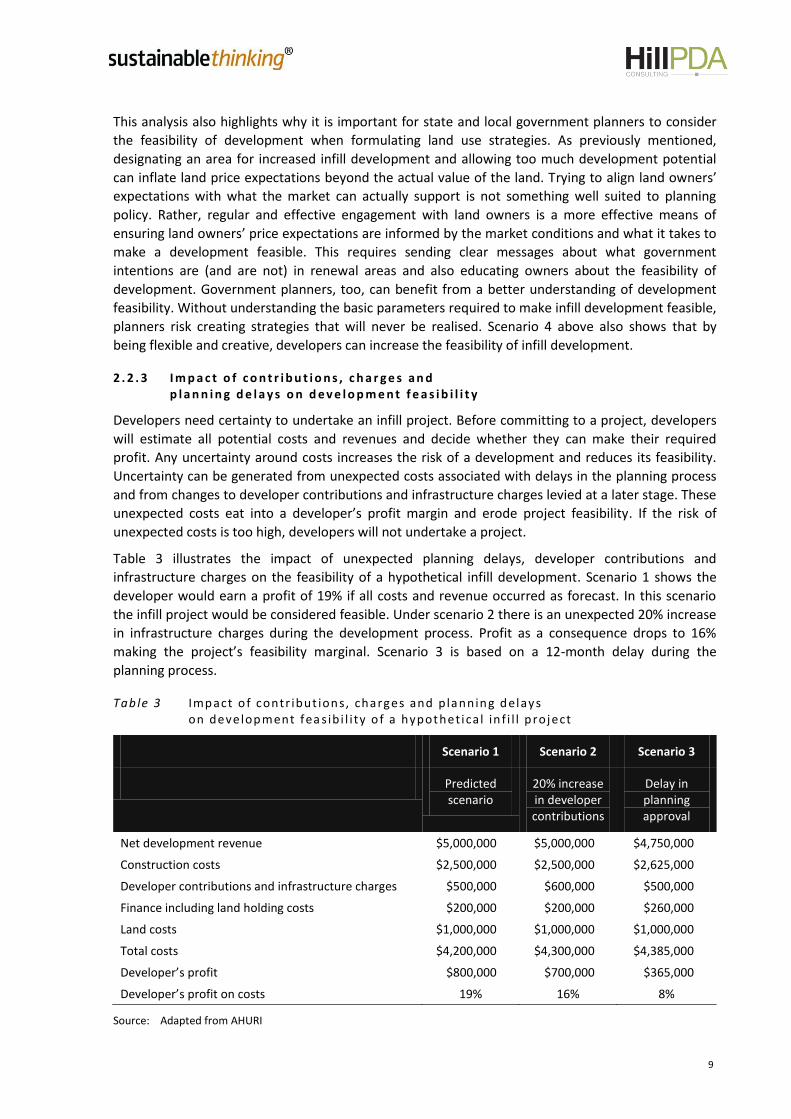
Table 3 illustrates the impact of unexpected planning delays, developer contributions and
infrastructure charges on the feasibility of a hypothetical infill development. Scenario 1 shows the
developer would earn a profit of 19% if all costs and revenue occurred as forecast. In this scenario
the infill project would be considered feasible. Under scenario 2 there is an unexpected 20% increase
in infrastructure charges during the development process. Profit as a consequence drops to 16%
making the project’s feasibility marginal. Scenario 3 is based on a 12-month delay during the
planning process.
Tab le 3 Impact o f contr ibut ions, charges and p lanning delays on development fea s ib i l i ty o f a hypothet ical in f i l l p roject
Scenario 1 Scenario 2 Scenario 3
Predicted scenario
20% increase in developer contributions
Delay in planning approval
Net development revenue $5,000,000 $5,000,000 $4,750,000
Construction costs $2,500,000 $2,500,000 $2,625,000
Developer contributions and infrastructure charges $500,000 $600,000 $500,000
Finance including land holding costs $200,000 $200,000 $260,000
Land costs $1,000,000 $1,000,000 $1,000,000
Total costs $4,200,000 $4,300,000 $4,385,000
Developer’s profit $800,000 $700,000 $365,000
Developer’s profit on costs 19% 16% 8%
Source: Adapted from AHURI
10
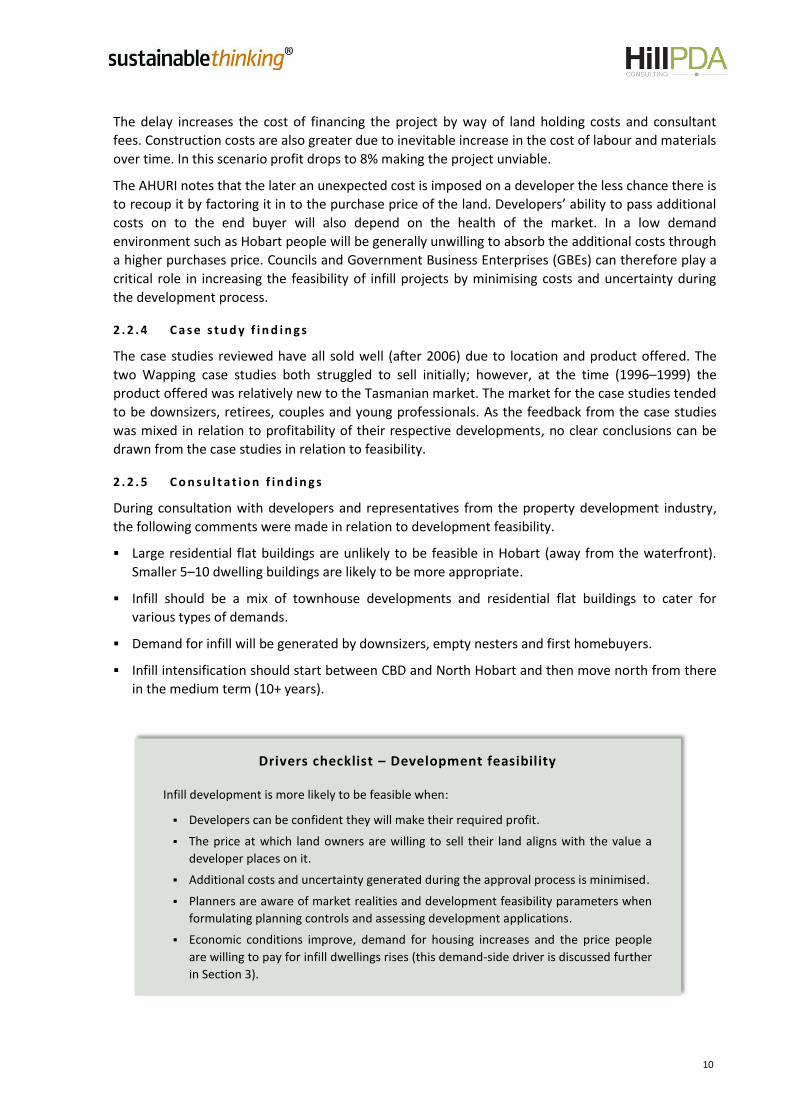
Drivers checklist – Development feasibility
Infill development is more likely to be feasible when:
Developers can be confident they will make their required profit.
The price at which land owners are willing to sell their land aligns with the value a
developer places on it.
Additional costs and uncertainty generated during the approval process is minimised.
Planners are aware of market realities and development feasibility parameters when
formulating planning controls and assessing development applications.
Economic conditions improve, demand for housing increases and the price people
are willing to pay for infill dwellings rises (this demand-side driver is discussed further
in Section 3).
The delay increases the cost of financing the project by way of land holding costs and consultant
fees. Construction costs are also greater due to inevitable increase in the cost of labour and materials
over time. In this scenario profit drops to 8% making the project unviable.
The AHURI notes that the later an unexpected cost is imposed on a developer the less chance there is
to recoup it by factoring it in to the purchase price of the land. Developers’ ability to pass additional
costs on to the end buyer will also depend on the health of the market. In a low demand
environment such as Hobart people will be generally unwilling to absorb the additional costs through
a higher purchases price. Councils and Government Business Enterprises (GBEs) can therefore play a
critical role in increasing the feasibility of infill projects by minimising costs and uncertainty during
the development process.
2 . 2 . 4 C a s e s t u d y f i n d i n g s
The case studies reviewed have all sold well (after 2006) due to location and product offered. The
two Wapping case studies both struggled to sell initially; however, at the time (1996–1999) the
product offered was relatively new to the Tasmanian market. The market for the case studies tended
to be downsizers, retirees, couples and young professionals. As the feedback from the case studies
was mixed in relation to profitability of their respective developments, no clear conclusions can be
drawn from the case studies in relation to feasibility.
2 . 2 . 5 C o n s u l t a t i o n f i n d i n g s
During consultation with developers and representatives from the property development industry,
the following comments were made in relation to development feasibility.
Large residential flat buildings are unlikely to be feasible in Hobart (away from the waterfront).
Smaller 5–10 dwelling buildings are likely to be more appropriate.
Infill should be a mix of townhouse developments and residential flat buildings to cater for
various types of demands.
Demand for infill will be generated by downsizers, empty nesters and first homebuyers.
Infill intensification should start between CBD and North Hobart and then move north from there
in the medium term (10+ years).
11
2 .3 P l a n ni n g a n d d ev e l op m e n t as s ess m e nt
2 . 3 . 1 P l a n n i n g p r o v i s i o n s
Planning controls can represent a major barrier for developers in Hobart’s infill areas by constraining
residential densities and mixed-use development, limiting heights and prohibiting multi-unit
development. Other requirements such as heritage, parking, setbacks and minimum lot sizes may
also constrain potential infill developments. Planning controls also need to be flexible to make it
feasible for developers to adaptively reuse older building stock.
Excessive car parking requirements are a common example of how well intentioned planning
controls can impede the delivery of infill development. The AHURI notes the cost of providing parking
is very costly (particularly underground parking which can cost over $20,000 per bay10) and can
detrimentally impact project feasibility. In a study on delivering diverse and affordable housing, the
Institute says:
This lack of flexibility prohibits the development of diverse housing and can, in fact, prevent the
development of any housing at all if the cost of providing parking pushes the development into the
unprofitable pile. The ability to offer developments with no parking near transport nodes opens up a
different type of market. Reduced parking provision not only reduces costs but can also increase the
density of development.
Avoiding the need for basement parking could make profitable schemes that would previously not
have been financially viable. Under the current system, households that do not want parking spaces
have little choice but to pay for them. It can, of course, work the other way, with developers (and
councillors) wanting to offer two parking spaces to attract a certain type of purchaser – two singles
for example – but are prevented from doing so by maximum parking standards. Flexibility was
considered key. Standard parking provision for standard apartments but developers and local
councils could request variations when considered necessary.11
This was affirmed during consultation, with one Hobart developer saying they were often unable to
get parking concessions from a council for an inner-city development aimed at students and young
professionals. According to the developer, council’s parking requirements made the project unviable
and as a consequence it did not proceed.
In another example a developer was seeking Green Star certification, which encourages developers
to reduce the quantum and size of parking, but then has to make a cash in lieu contribution due to
failing to meet the parking requirements of the planning scheme.
Section 2.2 of this study also identifies the need for planners to understand and consider
development feasibility when developing policy, and drafting planning schemes to ensure the market
can actually deliver the outcomes desired by council. For example, permitting higher density
development in low land value areas is unlikely to result in infill development occurring because land
owners will have unrealistic expectations about the sale price of their property (i.e. the price land
owners are willing to sell at is well above the price developers can afford to purchase the land for
and construct a profitable development).
10 Hill PDA. 11 AHURI in Rowley, S and Phibbs, P 2012, Developing diverse and affordable housing infill development sites, August 2012.

12
2 . 3 . 2 D e v e l o p m e n t a s s e s s m e n t
Lengthy and difficult approval processes can work against the delivery of infill development. Many
infill developments can be more complex than single dwelling or small-scale commercial
developments and therefore can require longer assessment timeframes. However, the requirements
for numerous consultant studies, frequent design changes and other delays can increase
development costs and decrease project feasibility. If the risk of unexpected approval delays is too
great then infill developments that are marginally feasible will not proceed. This point is particularly
relevant to Hobart where most infill development is marginally feasible.
2 . 3 . 3 C o m m u n i t y o p p o s i t i o n
Another substantial barrier to infill development, and a concern for most developers consulted, is
community opposition. Communities generally have a fear of both change and the unknown. There is
usually a perception that higher density development will result in a range of negative impacts and
fundamentally alter the character of their local area. People worry about the impacts on parking,
traffic, crime and property values. These fears often stem from past experiences or seeing the
impacts of inappropriate and poorly designed infill development elsewhere. In a Hobart context,
community experience and therefore acceptance of apartment living is not widespread. The
community often does not appreciate that quality infill can improve the amenity of an area and
increase property values.
Community opposition can stop infill projects directly, at the rezoning or development assessment
stage, by turning councillors against them or prolonging the approval process to such an extent that
the project becomes unviable. The challenge for delivering increased infill development in Hobart will
be to engage the community at early stages of planning to reduce misconceptions and ultimately
opposition.
2 . 3 . 4 C a s e s t u d y f i n d i n g s
One case study required an extension of time, the remainder ranged between 23 days and the full
statutory limit at the time (60 days).
All but one of the developments took longer to be determined than the contemporary Tasmanian
average of 34 days (for discretionary developments)12. This is not unexpected given these types of
development can be more complex than many other types of development.
A total of twelve representations were received for the five developments. Eight of those were on a
single development (301 Murray Street), while the two Wapping developments received none.
2 . 3 . 5 C o n s u l t a t i o n f i n d i n g s
The key point from the consultation was that developers needed a more efficient approval process
before they could feel confident to take on infill projects. Delays in the approval process generate
uncertainty, increase costs and erode project feasibility. Developers agreed the more efficient and
certain an approval process is, the lower the risk of infill projects and more likely they will be feasible.
Other comments made in relation to planning and development assessment included:
There is a feeling among the building and development community that it is ‘all too hard’ to
embark on more ambitious/demanding projects – mainly on account of council red tape and
resistance to development.
12 Parliament of Tasmania 2012, Report of the Auditor General No. 8 of 2011–12, The assessment of land-use planning applications.
This average includes the entire range of discretionary developments, including minor discretions and house extensions.

13
Drivers checklist – Planning and development assessment
Infill development is more likely to be delivered when:
Land use strategies support infill development, and planning schemes are
‘investment ready’, meaning areas designated for infill development are already
zoned for infill development and planning controls support project feasibility.
Development approval processes are efficient, consistent and provide certainty.
The community understands the benefits of infill development and participates in the
strategic planning underpinning the delivery of more infill projects.
Political leadership is required to create a ‘fast-track’ planning system that will give developers
and builders the confidence and certainty they require to undertake risky projects. Such a system
should guarantee minimal opportunities for community opposition to delay developments that
satisfy prescribed controls.
Supply of infill residential development will be constrained by:
– Lack of understanding by councils and others involved in the approval process about the risks
taken on by developers and the incentives required to construct higher density development.
– Council upfront costs, delays and uncertainty make it ‘all too hard’.
– Heritage planning issues are particularly problematic and costly.
– There is increasing demand for costly up-front consultant reports before any indication from
council whether the project will go ahead (i.e. increasing initial capital outlay and risk, with no
certainty).
Hobart needs to be at the forefront of streamlining planning processes to ensure it is seen as an
attractive place to invest.
Small developers may take on larger infill developments if it was made easier for them to do so.
Infill developments won’t occur while the current third party appeal process remains in place.
Infill development should be assessed through a two-step process. The first step would require
presenting council with an overview of the proposal with minimal detailed technical data. If
deemed acceptable, more technical (and costly) data could then be produced.
Local government and the planning system are major impediments:
– the planning system is increasingly complex and stifles innovation
– archaeology and heritage considerations can be onerous
– local government often ‘loads in’ permit conditions, adding significant costs
– need to review S57 of the Land Use Planning and Approvals Act. Some development can be
discretionary, but not subject to third party appeals (e.g. contaminated sites)
– it is very damaging to investment when the State Government has difficulty with the planning
system (e.g. Parliament Square)
– planning Schemes require much more regular updating.
14
2 .4 I n f r as tr uc t ur e pr ov is i on
One of the main benefits of infill development is that it makes more efficient use of existing
infrastructure when compared to greenfield development. New residents of infill development can
access parks and community facilities that already exist in an area. Similarly, because the utilities are
mostly already in place, it minimises the need for extensive new infrastructure works in greenfield
areas. The importance of good infrastructure in driving demand for infill development is discussed
further in Section 3. This section concentrates on the relationship between infrastructure provision
and the supply of housing.
In some locations existing infrastructure may lack the capacity to accommodate the added demand
generated by new infill development. In this case, infrastructure may need to be upgraded, which
can be troublesome and expensive for developers, councils and GBEs alike. As illustrated in
Section 2.2, infrastructure charges and developer contributions can detrimentally impact the
feasibility of an infill project by increasing costs, uncertainty and risk.
Infrastructure charges are integral to addressing increased development pressures and maintaining
infrastructure standards within the community. These headwork charges are normally applied to all
new developments which place demands on infrastructure and fund the administration, planning
and construction of works.
2 . 4 . 1 C a s e s t u d y f i n d i n g s
In one case study (107 Channel Highway) the infrastructure costs were noted as excessive. This is the
only development that was post the water and sewerage reform in Tasmania.
2 . 4 . 2 C o n s u l t a t i o n f i n d i n g s
During consultation with developers and representatives from the property development industry,
the following comments were made in relation to infrastructure provision.
Infrastructure charges can be excessive and need to be lowered if infill development is to become
feasible, particularly in low land value areas.
There is inadequate certainty around infrastructure charges, which is a significant impediment to
delivering infill housing. An example was given where similar projects in the same industrial estate
were charged vastly different amounts by a GBE with no sound justification for the difference
provided.
Funding the infrastructure improvements necessary to support some higher density living will
require substantial investment from government and should not be shifted on to developers.
Infrastructure fees, particularly heads works fees, can make or break the feasibility of infill
development.
Current development is being charged excessive amounts on account of past under investment.
These fees will have to be substantially cheaper for infill development to take off.
Infrastructure and development costs require significant reform:
– utilities, public open space contribution, land tax and stamp duty adds an impost;
– infrastructure providers’ (TasWater, Aurora, etc.) policy of 100% cost recovery upfront not
justified.

15
Drivers checklist – Infrastructure provision
Infill development is more likely to be delivered when:
Infrastructure charges are kept to a minimum and not used to subsidise past under-
investment or demand from existing residents.
Infrastructure charges are certain and known by the developer before the approval
process commences (acknowledging that changes to proposals during and after the
approval process can result in changes to infrastructure charges).
Infrastructure charges are fair, proportional, consistent and transparent.
2 .5 D e v el op m e nt f i n a nc e
Most infill projects are debt funded which makes financing a key consideration. Obtaining finance,
however, can be a major obstacle for developers. To receive funding a project must generate
sufficient returns for both the developer and lender (i.e. bank). Before funding a project the lender
will consider if the potential return is commensurate with the project’s risk.
Compared to low-density greenfield developments, infill projects have a higher level of risk attached
to them. They tend to require larger capital budgets, costs are harder to estimate and they take
longer to complete which, in turn, exposes them to fluctuations in market conditions and increases
the risk of unexpected events. Because of this increased risk, lenders tend to impose constraints on
the funding of infill projects, which developers often find difficult to meet.
The availability of finance has decreased since the Global Financial Crisis (GFC) as a result of banks
reassigning the risks of lending. Currently, funding is available to developers only if it can be clearly
demonstrated that projects are feasible and risk can be minimised. A study undertaken for the
National Housing Supply Council in 2011 found that prior to the GFC some banks were providing up
to 100% of finance required to cover development costs. Since then banks have become more
conservative and tend to limit their funding to around 80% of development costs. Before financing a
project, lenders also need to be confident that a project’s profit levels will be at least 20% of total
costs, although it may be less if they have an established relationship with a developer.13
2 . 5 . 1 C o n s u l t a t i o n f i n d i n g s
P r e - s a l e s r e q u i r e m e n t s
The requirement for pre-sales (i.e. off-the-plan sales) has increased. Even for good infill projects that
stack up, banks generally require pre-sales covering around 80% of the debt they are providing.
Selling eight out of ten dwellings of an infill development off the plan would demand significant
upfront marketing costs which many smaller developers would not have the capacity to fund.
Current pre-sales requirements are therefore a major hurdle to the development of infill housing in
Hobart where the general housing market is subdued and consumer acceptance of apartment living
is not widespread.
13 AHURI in Rowley, S and Phibbs, P 2012, Developing diverse and affordable housing infill development sites, August 2012.
16
Drivers checklist – Development finance
Finance for infill development is more likely to be provided when:
Banks have greater confidence that a project will be profitable and the risk of unexpected costs is minimal.
The development approval process is efficient.
Banks ease the constraints imposed on funding infill projects – for example, lowering pre-sale requirements.
More successful infill projects are built around Hobart, which will then give lenders confidence that the product can work and be profitable.
P r o v e n p r o d u c t
Obtaining finance for infill developments can be more difficult in areas where it is not a proven
product. Banks worry that demand for infill development does not exist and that the final product
will not sell at the price required to make a profit. It was noted during our consultation that banks
are also less likely to lend when they are not familiar with a particular type of housing product. Often
a lack of comparable projects in the local area makes it difficult for the bank to value a project and
appraise its risk. These issues are likely to be major barriers to obtaining finance for projects outside
the Hobart CBD and waterfront.
D e v e l o p m e n t a p p r o v a l
Some developers said finance is difficult to obtain without a development approval being in place for
a project. Financing may not be provided by a lender until a development is approved, or if financing
is provided prior to approval, banks are generally unwilling to lend more than 40% of development
costs.14 Costs incurred before an infill project is approved can be substantial, making it harder for
Hobart’s smaller developers with limited capital reserves to undertake infill projects. This barrier
highlights the role an efficient approval process plays in delivering infill development.
2 .6 C on s tr uc t i on c ost s
According to a dwelling cost study prepared for the National Housing Supply Council in 2011, the
major cost component of infill residential development in Australia’s capital cities is construction.
The study found construction costs constituted 45–60% of total costs.15 With the exception of Sydney
the study also identified that construction costs for multi-unit infill developments are 50% higher
than for single detached houses in greenfield areas.16 Developers consulted during this study said this
difference was in part due to additional costs associated with scaffolding, cranes, occupational health
and safety and the Building Code of Australia.
While Hobart was not included in the aforementioned study we have estimated that the overall
building rates per square metre for a medium-density, low-rise (2–3 storey) multi-unit development
would be slightly higher than for Perth and Sydney. For more complex projects, or higher quality
developments, this figure could increase substantially.
14 SGS, Understanding the property and economic drivers of housing, 2013. 15 National Dwelling Cost Study, prepared by Urbis for the National Housing Supply Council (2011) . 16 ibid.
17
Drivers checklist – Construction costs
Infill development is more likely to be delivered when:
Material, labour and other development costs can be kept to a minimum.
Unexpected costs associated with planning delays and government charges are avoided.
Regulatory costs are not excessive.
The higher cost of constructing infill development is offset by stronger demand and higher sales prices.
2 . 6 . 1 C a s e s t u d y f i n d i n g s
Notwithstanding the study prepared for the National Housing Supply Council in 2011 discussed
above, those developers consulted as part of the case study analysis reported that construction costs
were not a major concern.
2 . 6 . 2 C o n s u l t a t i o n f i n d i n g s
During consultation, developers highlighted that while construction costs for infill developments are
similar to elsewhere in Australia, the price the market is willing to pay for infill dwellings is
significantly less, with the exception of high-end developments around Salamanca and the
waterfront. Developers consider high construction costs along with insufficient demand and low
market prices the main barriers to infill development in Hobart. Other significant development costs
identified by the National Dwelling Cost Study were:
government taxes and charges (14–16% of total development costs)
land costs (6–14%)
professional fees, marketing costs, due diligence, funding and holding costs (9–11%).
Excessive costs were identified as the main reason some of Hobart’s smaller developers were less
inclined to undertake infill projects. Owing to their relative inexperience in building multi-storey
developments, smaller developers had concerns about the impact of additional regulatory burdens
and greater risk of cost blow outs.
Further comments made during the consultation stage include:
The supply of infill residential development can be encouraged by decreasing costs of
development associated with water infrastructure and council demands, delays and inefficiencies.
GBEs need to be more aware of the impact of their cost on development feasibility and show
greater flexibility with their charges.
The supply of infill residential development will be constrained by excessive costs imposed by
TasWater.
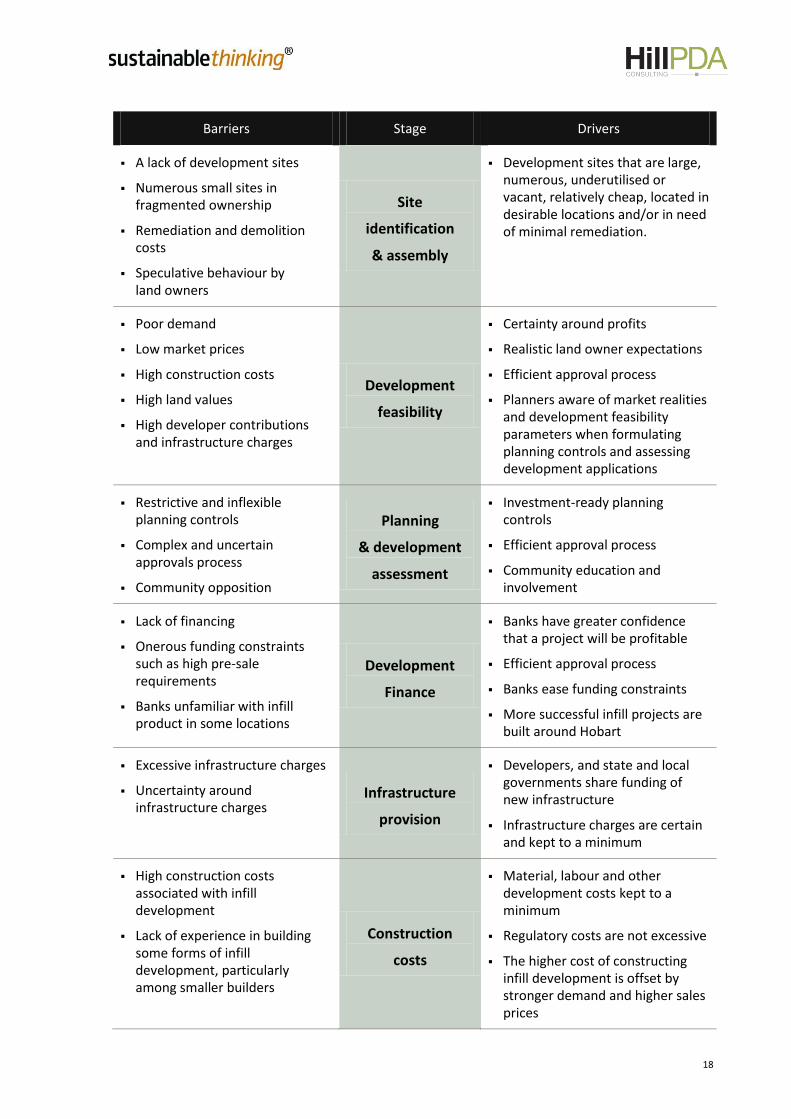
2 .7 Su m m a ry of b ar r i e rs a n d d r iv er s t o t h e s u p ply o f i n f i l l hou s i ng i n H ob a r t
The following diagram summarises the barriers and drivers to the supply of infill housing in Hobart.
18
Barriers Stage Drivers
A lack of development sites
Numerous small sites in fragmented ownership
Remediation and demolition costs
Speculative behaviour by land owners
Site
identification
& assembly
Development sites that are large, numerous, underutilised or vacant, relatively cheap, located in desirable locations and/or in need of minimal remediation.
Poor demand
Low market prices
High construction costs
High land values
High developer contributions and infrastructure charges
Development
feasibility
Certainty around profits
Realistic land owner expectations
Efficient approval process
Planners aware of market realities and development feasibility parameters when formulating planning controls and assessing development applications
Restrictive and inflexible planning controls
Complex and uncertain approvals process
Community opposition
Planning
& development
assessment
Investment-ready planning controls
Efficient approval process
Community education and involvement
Lack of financing
Onerous funding constraints such as high pre-sale requirements
Banks unfamiliar with infill product in some locations
Development
Finance
Banks have greater confidence that a project will be profitable
Efficient approval process
Banks ease funding constraints
More successful infill projects are built around Hobart
Excessive infrastructure charges
Uncertainty around infrastructure charges
Infrastructure
provision
Developers, and state and local governments share funding of new infrastructure
Infrastructure charges are certain and kept to a minimum
High construction costs associated with infill development
Lack of experience in building some forms of infill development, particularly among smaller builders
Construction
costs
Material, labour and other development costs kept to a minimum
Regulatory costs are not excessive
The higher cost of constructing infill development is offset by stronger demand and higher sales prices
19
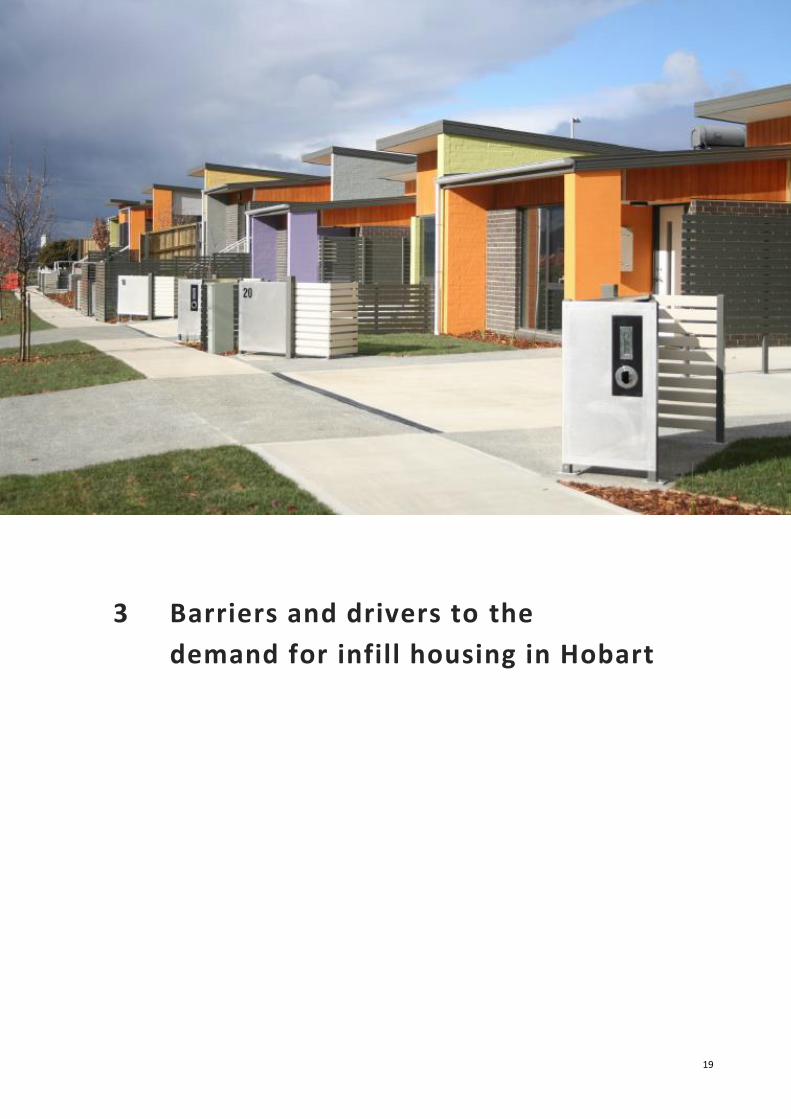
3 Barriers and drivers to the
demand for infill housing in Hobart
20
If greater amounts of infill development are to be built in Hobart it must become more attractive to
more people. Furthermore, developers will not build infill development if there is insufficient
demand for it.
A lack of demand for infill housing was raised as an issue during consultation with the development
industry. Some developers believed the market for infill development in Hobart was small, with most
people preferring to live in a house. Other developers, however, noted that there is a gradual shift
occurring, with apartment living becoming increasingly accepted by certain parts of the market,
notably students, professionals, young couples and retirees. Most noted that the benefits of good
infill development were not understood by the broader community; with the general perception
being that apartment living was an inferior form of housing.
If this barrier is to be overcome, areas designated for greater levels of infill development must offer
convenience and amenities not enjoyed in other areas to be successful. The strengths of infill areas
must be identified and enhanced. For example, many neighbourhoods closer to Hobart’s CBD can
offer a distinct and attractive character that is typically lacking in low density suburbs and new
greenfield areas. Infill areas can offer quick access to places of work, shops, recreation and
community services. Residents living in suburbs such as North, South and West Hobart, New Town
and Sandy Bay can choose to walk or ride on a bus instead of always driving.
Improvements are, however, required if infill development is to appeal to a broader range of people.
Government and the property development industry will need to work together to overcome
deficiencies and create neighbourhoods that can boast excellent infrastructure, a broad range of
services and convenient amenities. Government revitalisation initiatives in infill areas must occur
early and be substantial enough to attract private sector investment and engender confidence
among existing and future residents. If these areas are to become and/or remain desirable places to
live, developers and government must stay in tune with the constantly changing needs of the
community and respond accordingly.
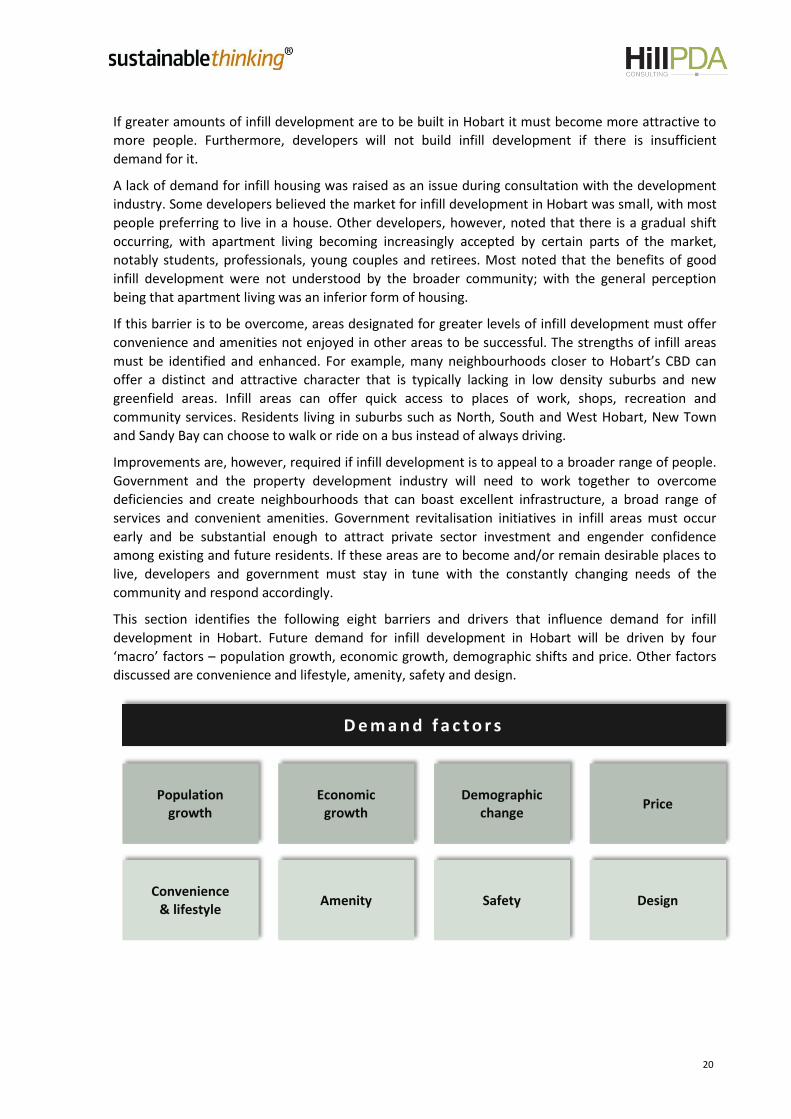
This section identifies the following eight barriers and drivers that influence demand for infill
development in Hobart. Future demand for infill development in Hobart will be driven by four
‘macro’ factors – population growth, economic growth, demographic shifts and price. Other factors
discussed are convenience and lifestyle, amenity, safety and design.
D e m a n d f a c t o r s
Population growth
Economic growth
Demographic change
Price
Convenience & lifestyle
Amenity Safety Design

21
3 .1 P op u l a t i on g r ow t h
As the population grows so, too, does demand for housing. Between 2001 and 2011 the population
of Greater Hobart increased on average by 1,940 people a year or 0.9%. By way of comparison
Sydney, Adelaide and Geelong recorded an average annual growth rate of 1.1%, 1.0% and 1.5%
respectively. The population of Greater Hobart is forecast to grow by 30,000 people between 2011
and 2031 which represents an average annual growth rate of just 0.7% or 1,550 people.17 This growth
is not anticipated to be uniformly distributed, with Inner Hobart forecast to grow at a significantly
higher rate over the same period (4.0% per annum). These statistics suggest Greater Hobart’s modest
population growth will constrain demand for infill development in most suburbs. The exception is
closer to the CBD where stronger than average population growth is likely to increase demand for
housing and therefore infill development.
3 .2 E c on om ic gr owt h
Strong economic growth generates jobs and wages enabling people to purchase new housing. Future
demand for infill housing will be heavily influenced by Tasmania’s economic performance.
Tasmania’s economy has slowed in recent years with key indicators such as employment, investment
and economic growth deteriorating relative to the national economy.18 This in turn has reduced
consumer confidence and weakened demand for new housing. While the outlook for the State is not
positive in the short term, the Tasmanian Department of Treasury and Finance anticipate the cyclical
forces behind Tasmania’s recent poor economic performance will ease in coming years.19 These
forces include the very high value of the Australian dollar and the strong levels of mining-related
investment in some mainland states.
3 .3 D e m og r a p hi c c h a n g e
Much of Hobart’s existing housing stock was built in an era when the ‘traditional’ household
consisted of two parents and multiple children. As a consequence, housing supply in Hobart remains
dominated by detached dwellings. According to the 2011 Australian Bureau of Statistics Census,
82.5% of dwellings in Greater Hobart were classified as ‘separate dwellings’, 6.5% were semi-
detached dwellings or townhouses and 10.5% were ‘flats, units or apartments’. These proportions
have remained generally steady since 2001.
The State’s demographics are, however, changing. The Australian Bureau of Statistics expects the
number of people per household in Tasmania to decline from 2.5 in 1996 to between 2.0 and 2.2 in
2021.20 Today, 42% of all Tasmanian households are childless (40% in Greater Hobart) and single
parents constitute a further 17% of households (18% in Greater Hobart).21
Hobart City Council is experiencing medium to high levels of population growth, a trend which is
forecast to continue; in 2008 Hobart was forecast to gain between 8,800 and 16,800 people by
2032.22 Hobart has a younger age profile than Glenorchy, as it attracts people of working and
university age.
17 AECgroup Greater Hobart Property Market Overview, Macquarie Point Railyards Final Report August 2012. 18 Department of Treasury and Finance, Structural Change in the Tasmanian Economy Information Paper April 2013. 19 ibid. 20 Australian Bureau of Statistics, 3236.0, Household and Family Projections, Australia, 1996 to 2021. 21 Australian Bureau of Statistics Census 2011. 22 Demographic Change Advisory Council 2008.

22
Glenorchy City Council is experiencing low population growth and is forecast to have static growth
into the future; Glenorchy is forecast to have a decrease of 270 people under the ‘medium’ scenario
or gain 4,100 people under the ‘high’ scenario by 2032.23 Glenorchy is experiencing demographic
change, with an ageing population and high levels of out-migration.
Tasmania’s population also happens to be the oldest in the country and is ageing faster than any of
Australia’s states or territories.24
Overall household size is decreasing across Tasmania. The greatest concentration of households with
one to two residents in Southern Tasmania is found in Hobart and Glenorchy.
The average household size in Glenorchy and Hobart is 2.3 people per dwelling (ABS 2011), which is
consistent with the Greater Hobart average of 2.4 people per dwelling.
In general many of these smaller households will have different requirements than the traditional
family. Professionals, students and retirees with busy schedules will often seek smaller, lower
maintenance housing types. Childless households may place higher value on living near work, shops
and entertainment. Elderly residents may prefer convenient access to services, medical facilities and
public transport. Single parent families are often in need of affordable housing options in proximity
to child care and schools.
These demographic shifts suggest that infill development that can meet the emerging needs of
Hobart’s population will generate demand.
3 . 3 . 1 S u r v e y f i n d i n g s
When residents of surveyed infill developments were asked to indicate their age, 65% said they were
over 50 years old. A summary of all responses is provided below.
17 years or younger (0% of respondents)
18–29 years (9%)
30–39 years (15%)
40–49 years (11%)
50–59 years (16%)
60+ years (49%).
3 .4 P r i c e
3 . 4 . 1 V a l u e f o r m o n e y
Some homebuyers will perceive the price of new infill development as poor value for money.
Locations that are in close proximity to the CBD and provide convenient access to shopping, public
transport, services and entertainment are most likely to generate the strongest demand for medium
and high density infill development (e.g. townhouses and unit/apartment buildings)in the short term.
These are suburbs like North Hobart, West Hobart, South Hobart, New Town, Sandy Bay and Hobart
itself. Demand for lower density infill development (e.g. villas and semi-detached dwellings) is also
likely to continue between New Town and Glenorchy.
23 Demographic Change Advisory Council 2008. 24 Lisa Denny, Tackling the challenge of Tasmania’s ageing population, The Conversation, www.theconversation.com.

23
Due to various development costs and land values between the CBD and North Hobart, the price of a
new two-bedroom apartment is likely to be in excess of $400,000 which is higher than the median
price for a typical three-bedroom house in nearby suburbs such as Bellerive ($393,500), Kingston
($377,500), Lenah Valley ($369,000), Lindisfarne ($359,000) and Moonah ($267,500).25 Given the
choice, many buyers will consider an existing detached house with an extra bedroom and yard better
value for money than a new apartment.
This simple comparison indicates that demand for infill development will remain constrained as long
as the price of detached houses in Hobart stays relatively affordable. It is possible that lower density
infill development could be delivered at a lower cost (primarily due to the reduced land value) in
locations further away from the CBD but this would be countered by even lower house prices for
detached houses in those areas. For example, the price of lower density infill development in
locations like Glenorchy and Derwent Park is more likely to be between $260,000 and $300,000, yet
in December 2012 the median house price in these suburbs was $219,000 and $200,000
respectively.26
The key message here is that increasing demand for infill development will require facilitating a
range of infill development types and price points along the corridor. Higher density and higher
priced infill development is more likely to be in demand closer to the CBD while lower density infill
development is likely to be popular and feasible north of New Town. Of course exceptions to this
statement will arise.
3 . 4 . 2 A f f o r d a b i l i t y
Affordability is likely to be a significant constraint on demand for new infill development in certain
locations. In order to understand the affordability of new infill housing, an Excel-based model
‘Household Income Affordability Calculator’ was prepared. The model profiles household income
bands based on ABS Census data for Greater Hobart and the level of debt that each household
income level could afford to pay depending on key variables (i.e. interest rate, deposit and household
income) (Table 4). Based on the outputs from the Household Income Affordability Calculator, a
household with the median income in Greater Hobart ($1,065/week27) could only afford to purchase
a home for $254,015 assuming a debt service ratio of 30% of income.28 Assuming a higher debt
service ratio of 40%, a household with the median income can afford to purchase a home for
$338,687.
This analysis shows new infill dwellings priced over $350,000 are likely to be unaffordable to low
income households and some moderate income households.
The affordability of infill development will also influence downsizing. Retirees who own houses are
more likely to downsize if they can purchase an apartment or unit in a desirable location at a price
that still enables them to save a significant portion of the house sale proceeds. For example, a couple
who own a $425,000 four-bedroom home are more likely to downsize if they can purchase an
apartment for $300,000 in an attractive location.
In summary, providing quality projects in desirable locations at competitive prices will help drive
demand for infill development.
25 Real Estate Institute of Tasmania, Quarterly Property Report December 2012. 26 ibid. 27 Australian Bureau of Statistics Census 2011. 28 It is generally accepted that housing is not within the means of a household ’s ability to pay for it (and thereby not affordable) when
housing costs (i.e. rent or mortgage costs) exceed 30% of the household’s gross income – this is also the common measure for mortgage and rental stress. It is important to note that this benchmark may vary dependent on the scale of the household’s income.

24
Tab le 4 Household income af fordabi l i ty ca lcu lator
Household income
($)
Household income
(weekly) ($)
Ownership (% income)
Monthly ($)
Principal loan ($)
Deposit ($)
Home affordability
($)
20,000 385 30 500 83,396 8,340 91,735
25,000 481 35 729 121,619 12,162 133,781
30,000 577 35 875 145,943 14,594 160,537
35,000 673 37 1,079 179,996 18,000 197,996
40,000 769 38 1,267 211,269 21,127 232,396
45,000 865 40 1,500 250,187 25,019 275,206
50,000 962 40 1,667 277,986 27,799 305,785
55,000 1,058 40 1,833 305,785 30,578 336,363
55,380 1,065 30 1,385 230,923 23,092 254,015
55,380 1,065 40 1,846 307,897 30,790 338,687
60,000 1,154 40 2,000 333,583 33,358 366,942
65,000 1,250 40 2,167 361,382 36,138 397,520
70,000 1,346 40 2,333 389,180 38,918 428,098
75,000 1,442 40 2,500 416,979 41,698 458,677
80,000 1,538 40 2,667 444,778 44,478 489,255
85,000 1,635 40 2,833 472,576 47,258 519,834
90,000 1,731 40 3,000 500,375 50,037 550,412
95,000 1,827 40 3,167 528,173 52,817 580,991
100,000 1,923 40 3,333 555,972 55,597 611,569
Note: Assumptions: 10% deposit, 6% interest rate, 30-year term
3 . 4 . 3 C a s e s t u d y f i n d i n g s
Key findings from the case study analysis were:
Sales prices for two-bedroom dwellings in infill developments ranged from $120,000 (in 1999) and
$320,000 more recently to $430,000.
Dwellings sold rapidly in all the developments post-2006.
Property values have risen substantially in those developments closer to the CBD (e.g. both the
Wapping developments).
25
3 . 4 . 4 S u r v e y f i n d i n g s
When asked what attracted them to live in their infill development, respondents said:
good investment (34% of respondents)
affordable to buy (28%)
downsizing from a larger dwelling (27%)
affordable to rent (12%).
3 .5 C on v e ni e nc e a n d l i f es ty l e
People will choose to live close to the Hobart CBD because they value convenient access to
employment, services, shops, public transport and entertainment that these areas offer. Most of
Hobart’s current higher density residential developments (i.e. apartments and units) are located
within 2 km of the CBD, although there has been an increase in proposed infill developments around
Glenorchy and Clarence in recent years.29 This suggests that demand for infill development in Hobart
is heavily dependent on proximity and convenient access to the CBD, services, shops and public
transport.
3 . 5 . 1 S u r v e y f i n d i n g s
When asked what attracted them to live in their infill development, respondents said:
the convenience provided by the residential complex (74% of respondents)
near shops (65%)
near work (45%)
near entertainment and/or nightlife (41%)
near recreational facilities (32%)
near public transport (24%)
near school, college or university (10%).
3 .6 A m e ni ty
To attract people to live in higher density urban environments, infill areas must provide a quality
urban environment and possess qualities that lower density areas cannot offer. This means creating
infill areas with distinctive neighbourhood character, active and passive open space, attractive
streetscapes, inviting gathering places and proximity to a variety of community and cultural
opportunities.
3 . 6 . 1 S u r v e y f i n d i n g s
When asked what they liked most about living in their infill development, responses included privacy,
proximity to amenities, communal benefits, friendly people, quiet and convenient, easy living,
community, well maintained and good neighbours and lifestyle.
3 .7 Sa f e t y
Numerous studies have found crime and the perception of crime to be the number one barrier to
infill development. 30 A key driver to increasing demand for infill development is creating
developments and neighbourhoods that the community feel safe and secure to live within. This is
supported by our survey findings.
29 AECgroup Greater Hobart Property Market Overview, Macquarie Point Railyards Final Report August 2012 30 Municipal Research & Services Center of Washington, Infill Development Strategies for Shaping Liveable Neighbour hoods, June 1997
26
3 . 7 . 1 S u r v e y f i n d i n g s
When asked how safe or unsafe they felt living in their infill development, respondents said:
very safe (72% of respondents)
fairly safe (28%).
When asked what attracted them to live in their infill development, 58% of respondents said the
security provided by the residential complex.
3 .8 D e s i g n
Many past infill developments have not been designed in ways that enhance the local area. They
have often ignored local character, blocked sun and views, lacked landscaping, provided dull or even
ugly facades and reduced the quality of the pedestrian environment. Internally they have often failed
to provide attractive, healthy and liveable spaces. Well-designed buildings and public domain can
help create more sustainable, liveable and harmonious communities. Infill developments that
maximise privacy, natural sunlight and ventilation can contribute to people’s well-being and
minimise the need for additional heating, cooling and light which in turn reduces consumption and
costs. Good design that considers the character of the local area can improve the appearance of the
streetscape and increase surrounding property values.
3 . 8 . 1 C a s e s t u d y f i n d i n g s
People were attracted to the case studies because of:
convenience and lifestyle
amenity – all case studies were perceived as being of high quality
safety
low maintenance.
3 . 8 . 2 S u r v e y f i n d i n g s
When asked what attracted them to live in their infill development, 64% of respondents said the
quality of their apartment and the development as a whole. Residents were also asked if they would
choose to live in an infill development again, to which 90% said yes, suggesting infill developments
can be highly desirable places to live when designed properly and in the right location.
3 . 8 . 3 C o n s u l t a t i o n f i n d i n g s
During consultation with developers and representatives from the property development industry,
the following comments were made in relation to demand for infill development.
Demand for greater amounts of infill residential development in Hobart does not exist due to:
– Poor performance of the State’s economy, high unemployment and lack of confidence.
– The price differential between higher density dwellings and detached housing is not that
great. Given the choice people will opt to buy a house over a unit or apartment if they are
similar in price.
– What little demand there is for this type of housing is being met by projects that are
subsidised by State and Federal Governments (e.g. NRAS, land grants, rate subsidies, UTAS
Student Housing project). This market distortion is removing financial incentives for private
developers to create infill development.
27
Drivers checklist – Demand for infill development
Demand for infill development is likely to be generated by:
Population growth.
Economic growth.
Demographic shifts.
Affordable prices that represent good value for money.
Developments that can provide a high level of convenience, amenity, safety and design.
Because of inadequate demand, the margins are not enough for developers to build infill
residential development and supply-side costs (e.g. construction costs and land use planning
regime) are not dominant considerations.
Greater demand for higher density residential development exists between CBD and New Town,
particularly apartments. However, there are limited opportunities between the CBD and North
Hobart for higher density development. Previous attempts to build infill development in this area
have met community resistance.
3 .9 Su m m a ry of b ar r i e rs a n d d r iv er s t o t h e d e m a n d f or i nf i l l h ou s i n g i n H ob a rt
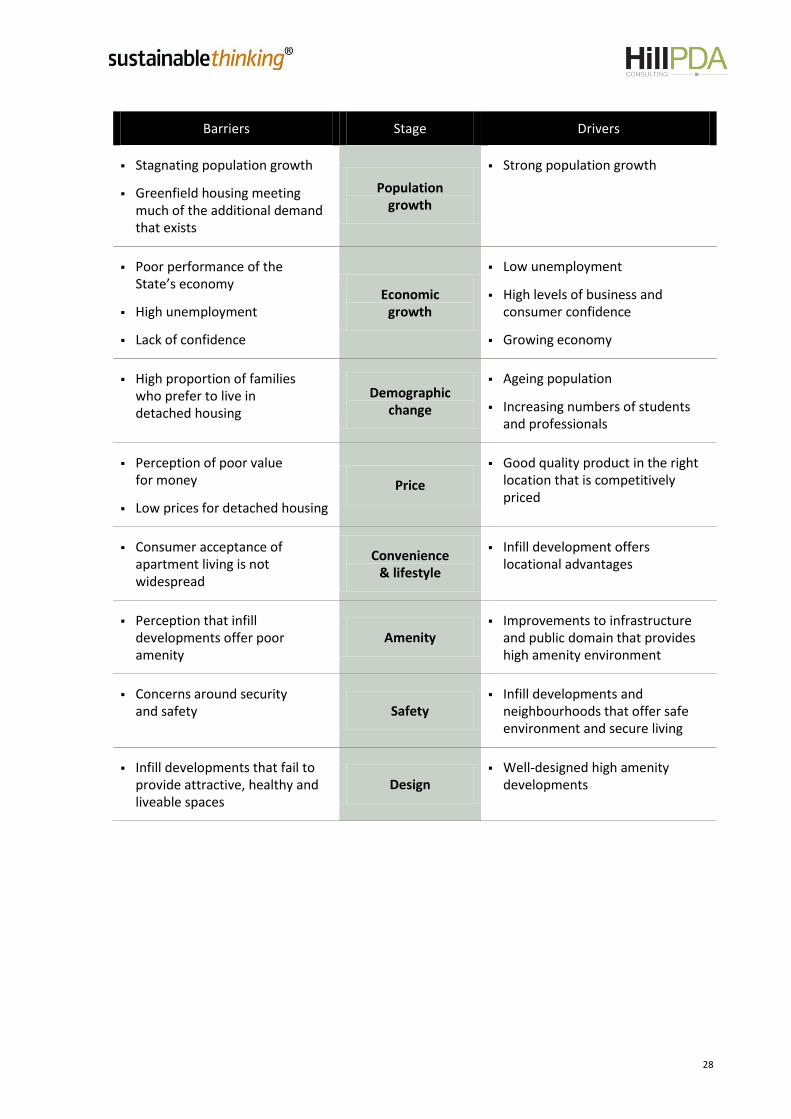
The following diagram summarises the barriers and drivers to the demand for infill housing in Hobart.
28
Barriers Stage Drivers
Stagnating population growth
Greenfield housing meeting much of the additional demand that exists
Population growth
Strong population growth
Poor performance of the State’s economy
High unemployment
Lack of confidence
Economic growth
Low unemployment
High levels of business and consumer confidence
Growing economy
High proportion of families who prefer to live in detached housing
Demographic change
Ageing population
Increasing numbers of students and professionals
Perception of poor value for money
Low prices for detached housing
Price
Good quality product in the right location that is competitively priced
Consumer acceptance of apartment living is not widespread
Convenience & lifestyle
Infill development offers locational advantages
Perception that infill developments offer poor amenity
Amenity Improvements to infrastructure
and public domain that provides high amenity environment
Concerns around security and safety Safety
Infill developments and neighbourhoods that offer safe environment and secure living
Infill developments that fail to provide attractive, healthy and liveable spaces
Design Well-designed high amenity
developments

Infill development within Greater Hobart
Appendix A – Case study analysis
pitt&sherry
Contents
1 Introduction 1
2 301 Murray Street 2
2.1 Location 2
2.2 Development description 2
2.3 Supply side 3
2.4 Demand side 4
2.5 Conclusion 5
3 Wapping 6
3.1 Location 6
3.2 Development description (39–49 Macquarie Street) 6
3.3 Supply side (39–49 Macquarie Street) 6
3.4 Demand side (39–49 Macquarie Street) 8
3.5 Development description (37 Campbell Street) 9
3.6 Supply side (37 Campbell Street) 10
3.7 Demand side (37 Campbell Street) 12
3.8 Conclusion 13
4 75 Warwick Street 14
4.1 Location 14
4.2 Development description 14
4.3 Supply side 14
4.4 Demand side 16
4.5 Conclusion 16
5 107 Channel Highway 17
5.1 Location 17
5.2 Development description 17
5.3 Supply side 17
5.4 Demand side 20
5.5 Conclusion 20
L i s t of f i g ur es
1 Location of the case study area at 301 Murray Street 2
2 Location of the Wapping case study areas 7
3 Location of the two Wapping case study areas 7
4 Location of each of the split development applications within the Theatre Mews complex 10
5 Location of the case study area at 75 Warwick Street 14
6 Hobart shown at point A and Kingston shown at point B 18
7 Location of the case study area at 107 Chanel Highway 18

1
1 Introduction
This report is an analysis of five case study areas for the purpose of enabling the review of local
drivers and barriers to infill development within the Greater Hobart area.
The five case study areas are:
301 Murray Street, North Hobart
39–49 Macquarie Street and 37 Campbell Street (Wapping), Hobart
75 Warwick Street, Hobart
107 Channel Highway, Kingston.
2
2 301 Murray Street
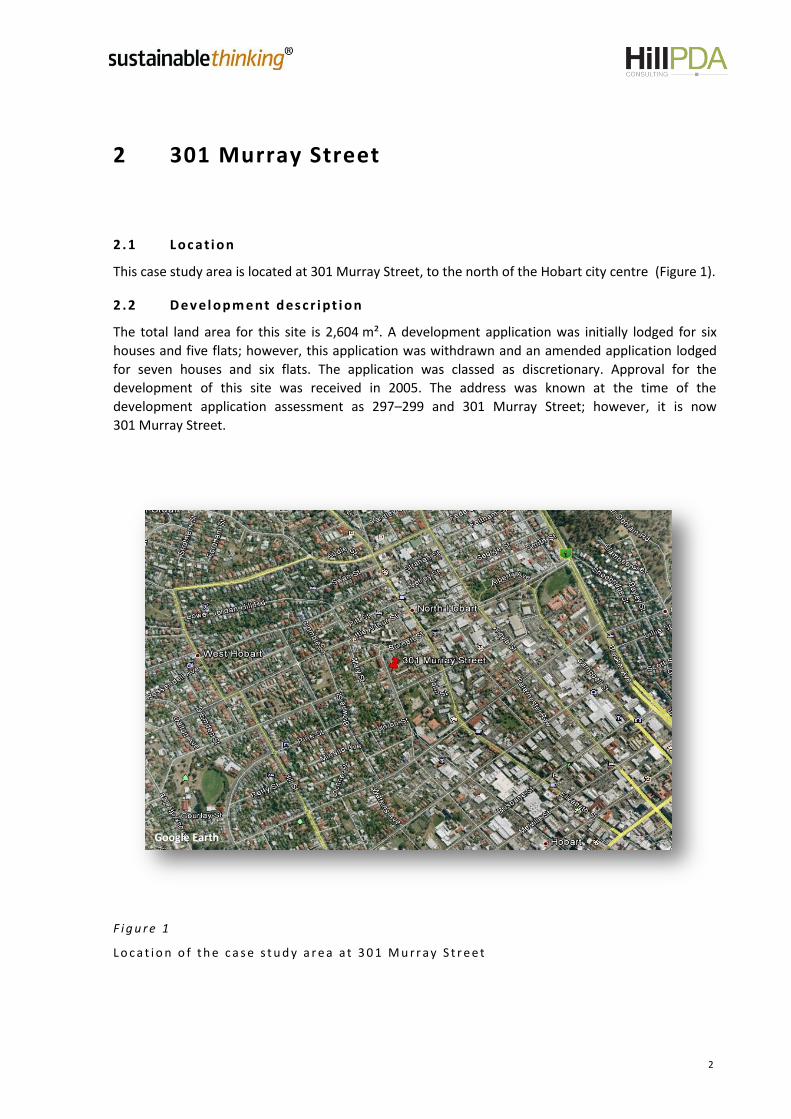
2 .1 L oc a t i on
This case study area is located at 301 Murray Street, to the north of the Hobart city centre (Figure 1).
2 .2 D e v el op m e nt d es c r i pt i on
The total land area for this site is 2,604 m². A development application was initially lodged for six
houses and five flats; however, this application was withdrawn and an amended application lodged
for seven houses and six flats. The application was classed as discretionary. Approval for the
development of this site was received in 2005. The address was known at the time of the
development application assessment as 297–299 and 301 Murray Street; however, it is now
301 Murray Street.
F i g u r e 1
L o c a t i o n o f t h e c a s e s t u d y a r e a a t 3 0 1 M u r r a y S t r e e t
Google Earth

3
2 .3 Su p p l y s i d e
2 . 3 . 1 S i t e a s s e m b l y
The site initially comprised three land titles that were adhered in order to accommodate the
development. These titles were a mix of vacant land, a cottage and two conjoined townhouses.
At the time of the lodgement of the development application, the site was located within Precinct
25A of the Residential 1 Zone under the City of Hobart Planning Scheme 1982. This development was
assessed as being consistent with the zone objectives (creating a diversity of dwelling types within
the area) and the Statement of Desired Future Character for Precinct 25A (conserving and reinforcing
the area for inner city residential housing).
2 . 3 . 2 A p p r o v a l p r o c e s s
The development application was lodged on 7 December 2004 and a permit was issued on 21
February 2005. A request for further information was sent out on 14 December 2004.
This additional information request was sought regarding a revised traffic impact assessment,
location of the proposed water connection and signatures of all owners upon the application form.
The revised traffic impact assessment was required to reflect the revised trip generation of the
proposed development after the development was amended by the applicant.
An extension of time was required within the approval process as the 42-day time limit was
exceeded. The 42-day statutory time limit ran out on 21 January 2005 and an extension of time was
granted until 18 February 2005.
Eight representations were received, with the issues raised being primarily in relation to:
increased density;
double-storey development and potential for overshadowing or loss of amenity to adjoining
properties;
detriment to the surrounding heritage values.
As representations were received, the development application went to a full council meeting. The
development was assessed to be consistent with the planning controls.
2 . 3 . 3 F i n a n c e a n d i n c e n t i v e s
The development did not depend on government initiatives.
2 . 3 . 4 I n f r a s t r u c t u r e
Prior to the submission of the development application, Murray Street had undergone some
infrastructure reconstruction. A central island and trees were installed within the road reserve just
outside the entrance to the development site. The development application sought to relocate the
island further south. This suggestion was not viewed favourably by council, as careful planning was
said to have gone into the spacing of the islands and trees along the street. A condition was placed
on the permit instead, to allow for left in and left out vehicle access only.
The developer was to install and bear the cost of installation of a new water connection and sewer
and stormwater mains. A new cross-over was required to be installed at the developer’s cost.

4
2 . 3 . 5 C o n s t r u c t i o n
The development drew on local expertise and materials. It is not known if the development was a
profitable project.
2 . 3 . 6 M a r k e t i n g a n d s a l e s
These apartments are in a sought-after location, being in close proximity to the city centre and North
Hobart, with a high level of amenity. The complex would be appealing as an investment opportunity,
for professionals wanting to live close to their place of employment, and for downsizers.
2 .4 D e m a n d s i d e
2 . 4 . 1 P r i c e
The units were originally sold in 2007 for between $360,000 and $410,000, with subsequent sales in
2008 remaining at a similar price (between $380,000 and $410,000). There have been no further
property sales since 2008.
2 . 4 . 2 S a f e t y
The development’s communal areas –the vehicle accessway, parking and entrance areas – are all
easily accessible to the general public as there is no restricted access to the complex. However, these
areas can easily be viewed from windows of the dwellings and from the street, providing very good
passive surveillance. This passive surveillance and the privacy fences to a height of 1.8 m surrounding
the rear patio areas suggest that the development is relatively safe. There are vegetation plantings
that have grown to maturity, which suggests that the development has not been subject to
vandalism.
Four surveys were returned from residents of the development who were asked to rate a number of
different elements of their housing complex. When rating ‘how safe one feels in the complex’, three
responded with fairly safe (being a rating of 5 out of 6) and one responded with very safe (being a
rating of 6 out of 6). This survey response would suggest a high level of perceived safety.
2 . 4 . 3 C o n v e n i e n c e
The development at Murray Street is within close proximity to the North Hobart shopping strip,
located approximately one full city block to the north-east of the site, on Elizabeth Street. This
shopping precinct can service most daily needs with shops such as a chemist, dry cleaners,
newsagent, banks, groceries, cafes and restaurants. More substantially sized supermarkets are
located in Campbell Street, North Hobart, or in the Hobart city centre.
Elizabeth Street is serviced regularly by Metro buses that run in and out of the Hobart city centre.
The Hobart city centre, being the main employment hub, is easily accessible on foot from the Murray
Street development, being approximately a 20 minute walk.
There is a park with skateboard facilities located on the corner of Tasma and Murray Streets,
approximately 10 m to the south of the subject site. Elizabeth College is located within walking
distance, approximately two city blocks to the south-east of the site.
Each of the four survey respondents have indicated that the convenience provided by the location of
the complex, the proximity to work, shops, entertainment and nightlife are all factors that attracted
them to the development.

5
2 . 4 . 4 A m e n i t y a n d l i f e s t y l e
The development’s high quality, proximity to work and shops, convenience, low maintenance, and
safety were all factors influencing the decision to purchase within the development.
Those surveyed indicated that they did not use public transport.
2 . 4 . 5 D w e l l i n g c h a r a c t e r i s t i c s
The development provides thirteen dwellings in total, consisting of eleven double-storey and two
single-storey townhouses. Six of the dwellings have three bedrooms and seven of the dwellings have
two bedrooms. There are twenty car spaces within the development, indicating that each dwelling
has at least one car space.
The private open space areas are generally small in comparison to typical urban and residential
backyard dimensions within the immediate area; however, they are appropriate to a higher density
living scenario. Most of the dwellings have a patio area on the ground floor of between 31 to 91 m²,
with some also having a small deck area on the first floor (approximately 2.5 to 3.55 m2 in area).
In general, different cohorts prefer different dwelling characteristics. In the Tasmanian context multi-
level dwellings are generally undesirable for the elderly and for couples with young children.
Whereas dwellings with larger backyards (or within close proximity to a park or alternative
recreational area) are often considered more suited to young families as there would be larger space
for children to play outside.
The two-bedroom dwellings are likely to suit couples, young professionals house sharing, retirees
who want less maintenance, empty nesters and possibly families with one child. The three-bedroom
dwellings are likely to suit similar people; however, some small families might also be attracted
because of the extra bedroom.
2 .5 C on c l us i on
The site assembly was simple, did not require remediation and required only limited demolition
costs. The development was appropriately located and designed for its target markets and
consequently the sale price was good for the time. The approval timeframe exceeded the statutory
timeframe of 42 days (albeit with an extension of time granted). This compares poorly against the
Tasmanian average of 28 days for all approvals and 34 days for discretionary developments.31
31 Parliament of Tasmania 2012, Report of the Auditor General No. 8 of 2011–12, The assessment of land-use planning applications.

6
3 Wapping
3 .1 L oc a t i on
The Wapping case study covers two separate development areas located at 39–49 Macquarie Street
and 37 Campbell Street.
39–49 Macquarie Street relates to Wapping Parcel 2 of the Wapping Outline Development Plan and
Local Area Plan and is bound by Terminus Row, Collins Street, Creswells Row and existing buildings
including the Mission Church and Barnett Bros Building. The developments that make up this case
study are now referred to as Terminus Row, Creswells Row and Collins Street.
37 Campbell Street is the second part of the Wapping case study and includes numerous
development applications. This development was located upon Wapping Parcel 6 of the Wapping
Outline Development Plan and Local Area Plan. The site is bounded by Sackville Street and Mistral
Place and is known as the Theatre Mews.
The Wapping site was formerly used as a bus depot owned by state government. The Wapping
Implementation Group was formed to develop the site.
The general Wapping area is shown in Figure 2. Figure 3 shows the Campbell Street development site
in red and the Macquarie Street development site in blue. Each site is discussed below.
3 .2 D e v el op m e nt d es c r i pt i on (3 9–4 9 M a c q u ar i e S tr e e t )
The development application was for 19 flats and 3 shops/offices and 1 shop with 35 car parking
spaces. This development application was classed as discretionary, and public notification was
required.
3 .3 Su p p l y s i d e (3 9–49 M a c q u a r i e St r e et )
3 . 3 . 1 S i t e a s s e m b l y
The site was previously used as a bus depot and was vacant prior to the current multi-unit
development. The proposed development was within a small section of the larger title.
The site was zoned Central Commercial and Administrative Zone, Precinct 13A under the City of
Hobart Planning Scheme 1982 and subject to the Wapping Local Area Plan under the Draft Sullivans
Cove Planning Scheme (June 1997). The use status was classed as permitted within the scheme;
however, discretions were triggered in relation to heritage and the width of the access. The planning
provisions encouraged infill development in the form of a high-quality, stimulating residential
environment.
3 . 3 . 2 A p p r o v a l p r o c e s s
The development application was lodged on 26 June 1998. There was an extended assessment
statutory time period in accordance with LUPAA (at the time) of 60 days due to external referrals
required, which was due to expire on 25 August 1998. The permit was issued on 6 August 1998.

7
F i g u r e 2
L o c a t i o n o f t h e W a p p i n g c a s e s t u d y a r e a s ( s h o w n a t t h e r e d p i n s y m b o l )
F i g u r e 3
L o c a t i o n o f t h e t w o W a p p i n g c a s e s t u d y a r e a s
Google Earth

8
One representation was received from the National Trust regarding the issue of the proposed
development being built over the top of the existing heritage building shop front and the appropriate
integration of elements of neighbouring buildings. Concern was raised with particular regard to the
triangular pediment and faceted facia; these issues were addressed through a permit condition
requiring the deletion of these elements.
3 . 3 . 3 F i n a n c e a n d i n c e n t i v e s
Raising finance was reported to be difficult. The project received financial incentives from the
government, without which the project would not have been able to proceed.
3 . 3 . 4 I n f r a s t r u c t u r e
The sealing, draining and construction of new driveways, double width cross-overs, car parking areas
and turning areas and solid waste group collection facilities were required to be undertaken at the
developer’s cost. The internal streets of Creswells Row and Terminus Row were required to be
constructed at the developer’s cost.
De-watering was required for the excavation work to prevent environmental damage and damage to
the downstream drainage infrastructure.
The development at this site involved the excavation and construction of basement car parking,
which is a major infrastructure addition.
3 . 3 . 5 C o n s t r u c t i o n
The Wapping development drew on local designers, local contractors, local expertise and materials.
The development was considered to be a profitable project.
3 . 3 . 6 M a r k e t i n g a n d s a l e s
The apartments are marketed as being in a highly sought after area with a high level of amenity, low
maintenance and high security. The hospital is within very close proximity, indicating that there
would be an opportunity for an investment with a high rental return as accommodation for hospital
employees.
3 .4 D e m a n d s i d e ( 39–49 M a c q u a r i e St r e et )
3 . 4 . 1 P r i c e
In 1999, apartments were selling for between $119,000 and $163,000. Prices have since risen
steadily with sales in 2001 at around $230,000 and sales in 2005 up to $430,000. However, in 2007
sales were still at a similar mark of $430,000 and in 2009 sales were reportedly at $420,000 and in
2011 $436,000. This may be simply reflecting the market downturn rather than the development’s
attractiveness.
The apartments are now worth considerably more than they were at the time of construction.
Number 2 Terminus Row was recently on the market at an advertised price of $661,000.
3 . 4 . 2 S a f e t y
The complex appears to have a reasonably high level of security as the development has been built
right up to the street with high fencing and visually permeable locked gates. Security swipe passes
are required to gain access to the complex, including vehicular access to the internal courtyard and
pedestrian access directly off the footpath.

9
3 . 4 . 3 C o n v e n i e n c e
The location of the complex has a high level of convenience, being within close proximity to the
Hobart city centre, the waterfront and Salamanca Place. The Royal Hobart Hospital, theatres and
restaurants are all within walking distance, as is a supermarket which is located on the corner of
Argyle Street and Liverpool Street.
The Elizabeth Street bus mall is also located within close proximity and is the main public transport
hub of Hobart.
3 . 4 . 4 A m e n i t y a n d l i f e s t y l e
Fifteen resident survey responses were received from the two Wapping developments. These
surveys indicated that the developments are perceived to be of a good quality with a high level of
security. The location of the complex also provides convenient access to public amenities such as the
Hobart waterfront, the Aquatic Centre, the Botanical Gardens and social activities.
The majority of the survey respondents are professionals, with three clerical or administrative
workers and two retirees. There was no consistent age bracket of residents as they ranged between
18 years and 60+ years.
Many of the residents that responded to the survey live on their own or with one other in the
dwelling.
3 . 4 . 5 D w e l l i n g c h a r a c t e r i s t i c s
The dwellings are designed with a basement garage (level 1), the living area and a small deck/patio
area (level 2) and two bedrooms and small balcony and bathroom located on the next level (level 3).
There is communal paved courtyard area that is internal to the development. The complex can only
be accessed with a security swipe pass.
3 .5 D e v el op m e nt d es c r i pt i on (3 7 C am p b el l S t r e e t )
The development of 37 Campbell Street commenced in 2006, with some pre-development site
preparation done previously by the Wapping Implementation Group. The Campbell Street section of
Wapping referred to here (known as the Theatre Mews) can be seen in Figure 3. A pre-application
consultation process was used for this development, with council considering a master planning
concept for the site – called a 'Letter of Intent', followed by the lodgement of each development
application within that site area.
A Letter of Intent for 44 flats plus shop development covering the whole of Parcel 6 was supported
by Council in 1996. Following this intent, Council approved the following development applications
generally in accordance with the Letter of Intent plans.
3-storey flat development filling the Campbell Street frontage, comprising 4 flats
2 flats
10 flats
29 flats and shop (69 car spaces beneath complex).
Some of these development applications were discretionary and some were not (further details are
provided in the following section). Figure 4 shows the location of the various developments within
the site.

10
F i g u r e 4
L o c a t i o n o f e a c h o f t h e s p l i t d e v e l o p m e n t
a p p l i c a t i o n s w i t h i n t h e T h e a t r e M e w s c o m p l e x
3 .6 Su p p l y s i d e (3 7 C amp b e l l S t re e t )
3 . 6 . 1 S i t e a s s e m b l y
The Theatre Mews was located upon Wapping Parcel 6 of the Wapping Outline Development Plan
and Local Area Plan. The site was a vacant car park prior to the project commencing. This site has
been subject to numerous planning applications. Council approved a subdivision application to divide
Parcel 6 into three lots in September 1996.
The land was zoned Commercial and within the Administrative Precinct 2, with the use of a flat and
shop permitted. The Wapping Outline Development Plan asserts that the site is to be developed as
multiple and/or single dwellings.
The zoning is supportive of infill development as the Statement of Desired Future Character for
Precinct 2 states that the area should be characterised by closely linked activities at high densities
and promotes the progressive redevelopment of the current stock of vacant or under-utilised sites
and derelict buildings.
Google Earth

11
3 . 6 . 2 A p p r o v a l p r o c e s s
The application for four flats was issued lodged on 24 May 1996 and approved on 17 June 1996. This
was a permitted application with no public notification required.
The development application for two flats was a permitted application with no public notification
required and was issued on 25 July 1996.
The development application for ten flats was lodged on 2 August 1996 and was approved on
11 September 1996, within the 42-day statutory assessment period. This application was not
advertised and did not have to go to any committee or council meetings for a decision.
The development application for 29 flats was lodged on 13 November 1996. The application was
advertised and no representations were received. The application was decided at a council meeting
on 16 December 1996, within the 42-day statutory time limit.
There is no community opposition recorded in relation to the developments at 37 Campbell Street.
The planning controls clearly support this type of higher density infill development.
3 . 6 . 3 F i n a n c e a n d i n c e n t i v e s
Finance was difficult to raise for these developments. The first stage was partly financed by the
Wapping Implementation Group. The second stage included the ten flats that were originally built as
public housing units. The project stalled due to financial difficulties, at which point the original
developer brought in an equity partner to get the project moving again. Although the development
was eventually completed, the developer nearly went into receivership as a result.
Pre-sales were difficult, which resulted in contractors being owed money for some time after
construction was complete.
3 . 6 . 4 I n f r a s t r u c t u r e
The development at Campbell Street involved the excavation and construction of a basement car
park of 69 spaces, which is a major infrastructure addition.
Extensive consultation was undertaken in relation to the site pedestrian permeability, effect on the
walkability of the area, and the provision of bollards, gateposts and staggered fencing to allow for
public pedestrian access through the site.
The development was required to show sensitivity toward existing walls that were of heritage value,
which were incorporated into the development. These walls required repositioning and underpinning
in some cases, particularly in relation to the interface with the basement car park excavations.
Contamination and archaeological issues were addressed as an initial stage, along with the major
services, financed by the Wapping Implementation Group.
The design of this complex was a result of a design competition, followed by a developer partnering
with the Wapping Authority to develop the site. The Wapping Implementation Group bore the major
infrastructure costs, such as the provision of major services, archaeological issues and contamination.
3 . 6 . 5 C o n s t r u c t i o n
The development of this site was undertaken by local designers and local contractors, and building
materials were sourced locally. Contracts did not stipulate that local expertise and material was a
requirement. The development was not profitable for the developers and there are still unresolved
legal issues between parties.
12
3 . 6 . 6 M a r k e t i n g a n d s a l e s
The development initially targeted the affordable housing market and some were built for public
housing.
The dwellings did not perform well on the market initially as there was a low level of interest. This
was one of the very first projects in the Wapping area and the public housing component was not
received well. The public housing component was seen as a negative by the market at the time.
3 .7 D e m a n d s i d e ( 37 C am p b e l l St r e et )
3 . 7 . 1 P r i c e
As initial sales were slow, prices were similarly low. Subsequent property values have increased as
the Wapping area has developed. The two-bedroom apartments originally sold for around $120,000.
The ten public housing flats were sold for $1.1 million. These two-bedroom flats now sell for around
$350,000 to $400,000 each. Only four of these units are still owned by Housing Tasmania, with the
majority being investment properties, with five lived in by the owners.
There is now a mix of housing types throughout the Wapping area that target a varied market and
cover a varied price range.
3 . 7 . 2 S a f e t y
The issue of site security, pedestrian access and the definition of space were given a great deal of
consideration at this site. A pedestrian link was required within the Outline Development Plan
between Campbell Street and Mistral Place. The provision of bollards, gateposts, staggered fencing
or a similar open arrangement at the street boundaries was suggested to be a solution to reinforce
the semi-private boundaries. The remainder of the complex is gated, which provides for a high level
of security. There is secure undercover parking as part of this complex.
3 . 7 . 3 C o n v e n i e n c e
The complex is a gated development accessible only by the residents or their invited guests, located
in the middle of Hobart City. The location is opposite the Royal Hobart Hospital and within close
proximity to the Hobart waterfront, Salamanca Place, theatres, restaurants and all of the general
services that the city offers.
3 . 7 . 4 A m e n i t y a n d l i f e s t y l e
The Theatre Mews complex is built around a private courtyard with a central reflection pool which is
available for the enjoyment of the residents and guests only.
Similar to the previous Wapping case study assessed, the majority of the survey respondents are
professionals, with three clerical or administrative workers and two retirees. There was no consistent
age bracket of residents as they ranged between 18 years and 60+ years.
Many of the residents that responded to the survey live on their own or with one other in the
dwelling.
3 . 7 . 5 D w e l l i n g c h a r a c t e r i s t i c s
The complex consists mostly of two-bedroom dwellings, with only a few three-bedroom dwellings.
The dwellings are of an angular unembellished design with rendered concrete and masonry walls and
flat Zincalume roofs. The dwellings each have a car parking spot.

13
3 .8 C on c l us i on
The Wapping developments were one of the first significant infill developments within Greater
Hobart. Wapping Implementation Group involvement in the site assembly, planning (site
remediation and archaeology), financing and infrastructure provision were significant factors in the
project’s realisation.
All planning processes fell within statutory timeframes and were commensurate with current
average timeframes (21 days for permitted development and 34 for discretionary32); there was
limited third-party or community representations (one representation for the case studies reviewed).
The pre-development strategic plan (Wapping Outline Development Plan and Local Area Plan) no
doubt played a significant role in the trouble-free development assessment process.
Financing was difficult for these developments, no doubt as a result of the nature, timing and scale of
the developments proposed. The product proposed was one of the first of this scale in the Greater
Hobart context and as such was seen as somewhat risky from an investment perspective.
32 ibid.

14
4 75 Warwick Street
4 .1 L oc a t i on
This case study area is located at 75 Warwick Street, to the north of the Hobart city centre (Figure 5).
4 .2 D e v el op m e nt d es c r i pt i on
The development at Warwick Street commenced in 2006. It involved partial demolition and the
construction of sixteen flats and associated car parking. The development application was
discretionary.
4 .3 Su p p l y s i d e
4 . 3 . 1 S i t e a s s e m b l y
The site had a vacant warehouse at the time of the development application and the proposal was
for partial demolition of that warehouse and for the construction of 16 flats with 29 car parks. The
site was zoned Commercial and Residential (Precinct 8) under the Hobart Planning Scheme 1982.
Flats were a permitted use within this zone. The Statement of Desired Future Character was that ‘The
Precinct should evolve as a retail and community service area between adjacent residential Precincts.
New development should be of lesser density than that to the south and blend with nearby
residential areas.’
F i g u r e 5
L o c a t i o n o f t h e c a s e s t u d y a r e a a t 7 5 W a r w i c k S t r e e t
Google Earth

15
The proposed density was considered to be reasonably high; however, because of a similar high-
density development across the road at the time, it was considered to be consistent with the
surrounding development pattern, particularly having regard to the visual appearance from the
street, as this would remain relatively unchanged due to the high stone wall that would remain at
street level.
The development was proposed upon one lot of approximately 1,525 m². Although this lot was
previously consolidated from three smaller titles, no adjustments to the title arrangement were
required for the application of the multi-unit development.
4 . 3 . 2 A p p r o v a l p r o c e s s
The development application was lodged on 1 March 2006 and the permit was issued on 24 April
2006. This is a 55-day approval process; however, the statutory clock was stopped due to a further
information request being made by the council on 3 March 2006, requesting the following.
Parking layout that complies with the Australian Standards.
Driveway gradients to include transitions chords where appropriate.
Overhead clearances from carriageway level to adjacent overhangs.
Details of rubbish bin enclosures
Proposed slab level – given adjacent to 12.5% slope.
The development application attracted two representations from the public. The first raised issues
relative to heritage impacts, increased street parking pressure, and potential impacts upon the
amenity of the guests at the adjoining accommodation.
The second representation raised issues concerning the negative amenity impact of construction
works, amenity impacts as a result of the increased density and height, and impacts upon the
heritage characteristics of the area.
The development was assessed by Council to be in compliance with the planning controls.
Discretions were exercised in relation to maximum floor area. The surrounding residential amenity
was deemed not to be compromised as a result of the discretion, as it was assessed to have a
negligible change to overshadowing, and privacy concerns could be addressed through conditions.
The concept of a relatively high-density residential use was supported in terms of efficient use of
land close to the city and urban renewal.
4 . 3 . 3 F i n a n c e a n d i n c e n t i v e s
The Warwick Street development has used the National Rental Affordability Scheme (NRAS)
government initiative.
4 . 3 . 4 I n f r a s t r u c t u r e
The site had a level platform raised significantly higher than street level. Vehicular access was via an
existing ramp generally in accordance with council's engineering standards, although discretion was
required in relation to the grade of the ramp. There was also the existing, large stone wall located
along the perimeter of Warwick Street that acts as a retainer to the site and holds heritage status.
The driveway access, car parks, turning areas and footways were required to be upgraded, with a
bond of $36,586 taken for this assurance. A cross-over reconstruction was required at the
developer’s cost. The installation of a new water connection and water meter was required at the
developer’s cost.
16
4 . 3 . 5 C o n s t r u c t i o n
The development drew on local expertise and materials. It is not known if the development was a
profitable project.
4 . 3 . 6 M a r k e t i n g a n d s a l e s
Number 10 of 75 Warwick Street was recently on the market for between $375,000 and $399,000.
This is a dwelling that comprises three bedrooms, two bathrooms and one car space. It was marketed
to be a great investment with reference to the Federal Government Incentives under the NRAS
providing incentives over the next eight years.
4 .4 D e m a n d s i d e
4 . 4 . 1 P r i c e
Some dwellings sold in 2008 at between $320,000 and $390,000. Subsequent sales in 2010 increased
to $410,000 to $420,000, however in 2012 sale prices decreased to $375,000. In 2013 sales were
recorded at $385,000.
No. 4, 75 Warwick Street was recently advertised to rent for $288 per week for a 2 bedroom, 1 bathroom
dwelling with no car spaces. This dwelling was similarly advertised as being available under NRAS.
4 . 4 . 2 S a f e t y
The complex has limited public access, with locked gates at the entrance. The site is located
significantly higher than the street level. The complex appears to have a high level of security.
4 . 4 . 3 C o n v e n i e n c e
There is a high level of convenience with regard to the location of the Warwick Street development.
It is within very close proximity to both the North Hobart shopping precinct and the Hobart city
centre. The Campbell Street Woolworths is located approximately three blocks to the north-east. The
Elizabeth Street College is located on the corner of Elizabeth Street and Warwick Street, and Metro
buses run frequently along Elizabeth Street to and from the city centre. The city centre is within a ten
minute walk of the complex. There is a park located in Church Street, approximately 20 m to the
north-east. The site location is considered to have a high level of convenience.
4 . 4 . 4 A m e n i t y a n d l i f e s t y l e
The development is perceived by the one survey respondent to be of a high quality, good security
and convenient.
4 . 4 . 5 D w e l l i n g c h a r a c t e r i s t i c s
The dwellings are all double storey with car parking located on the ground level. Each dwelling has
limited private open space areas, with only a balcony area provided.
4 .5 C on c l us i on
The site assembly was simple, did not require remediation and required only limited demolition
costs. The development is well located and is one of the higher density developments in the general
area. The approval timeframe exceeded the statutory timeframe of 42 days (albeit with an extension
of time granted). This compares poorly against the Tasmanian average of 28 days for all approvals
and 34 days for discretionary developments33. 33 Parliament of Tasmania 2012, Report of the Auditor General No. 8 of 2011 – 12, The assessment of land-use planning applications.

17
5 107 Channel Highway
5 .1 L oc a t i on
The Channel Highway case study area is located at 107 Chanel Highway at Kingston, which is located
approximately 12 km south of Hobart (Figure 6).
Figure 7 shows the location of the development in relation to the Kingston Central precinct.
5 .2 D e v el op m e nt d es c r i pt i on
The land at Channel Highway commenced development in 2010. The development comprises
20 units (of which two were existing) with 27 car parking spaces. The development was classed as
discretionary. The address was known as 105–107 and 109 Channel Highway for the purposes of the
development application.
5 .3 Su p p l y s i d e
5 . 3 . 1 S i t e a s s e m b l y
The site previously consisted of three separate titles. In 2010 a boundary adjustment was approved
for number 105–107 Channel Highway, number 109 Channel Highway and 3 Dollery Drive to
consolidate these titles and facilitate the multi-unit development. This resulted in one lot with an
area of 6,092 m2.
The land was zoned residential under the Kingborough Planning Scheme 2000 and the development
application was discretionary. Multi-unit housing was specifically stated as being encouraged within
the Desired Future Character Statement for Kingston.
5 . 3 . 2 A p p r o v a l p r o c e s s
The development application was lodged with council on 21 May 2010 and the permit was issued on
13 September 2010, with the full statutory time limitation utilised.
Further information was requested on 21 June in relation to the following matters.
Traffic impact assessment
Details regarding stormwater
Privacy issues
Sun diagrams
Details of trees to be removed.
The further information request was satisfied by 30 August 2010, at which point the application was
then able to be advertised.

18
F i g u r e 6
H o b a r t s h o w n a t p o i n t A a n d K i n g s t o n s h o w n a t p o i n t B
F i g u r e 7
L o c a t i o n o f t h e c a s e s t u d y a r e a a t 1 0 7 C h a n e l H i g h w a y
Google Earth
Google Earth

19
Two representations were received and the following issues were raised.
Privacy impacts
Protection of views and amenity
Setbacks
Density of development
Traffic issues
Waste collection
Building materials, bulk and colour
Future ownership of units
Car parking
Stormwater drainage management.
The development invoked the following discretions.
The size of the rear garden areas for the existing dwellings.
Separation distances between various bedroom windows, kitchen windows, decks and the
internal driveway.
Private open space areas were not directly accessible from the living areas (Units 14–20).
Car parking spaces provided were less than the number required and visitor spaces were
proposed forward of the building line.
Council assessed the development as meeting the Alternative Solutions in relation to these
discretions and recommended approval.
5 . 3 . 3 F i n a n c e a n d i n c e n t i v e s
The viability of the project did not rely or depend on government incentives or initiatives, and there
were no issues with the raising of finances.
5 . 3 . 4 I n f r a s t r u c t u r e
The developer was not required to provide any additional infrastructure that was not budgeted for;
however, the headworks’ charges for Southern Water were considered to be excessive at $7000 per
unit, being a major cost component. All infrastructure costs were covered by the developer.
5 . 3 . 5 C o n s t r u c t i o n
The project drew on local expertise where possible, as the developer was a local Tasmanian business
that used Kingston-based labourers. The materials were generally sourced from K&D Warehouse and
Bunnings. Local timber was reported to be difficult to source, with most being imported from New
Zealand. The project was profitable for the developer.
5 . 3 . 6 M a r k e t i n g a n d s a l e s
The villas are currently being marketed as being a close walk to the facilities at Kingston, schools and
supermarkets. This indicates that small families are a target market; however, the villas may also
appeal to downsizers, investors wanting to rent the villas out and retirees.
With the exception of three units, all the units sold quickly. There were no pre-sales. The units were
marketed in Tasmania and interstate, and specifically targeted investors. All of the units were sold as
investment properties for self-managed super funds. The three that did not sell were then held by
the developer, who has sought NRAS incentives.

20
5 .4 D e m a n d s i d e
5 . 4 . 1 P r i c e
The remaining units are currently on the market for $300,000 to $325,000. They have been recently
constructed, indicating that subsequent sales cannot be assessed at this point.
Subsequent property values and sales cannot be analysed at this point as the development has only
recently been constructed and sold.
5 . 4 . 2 S a f e t y
The site is easily accessed by vehicles, with no restricted entry. As there are a large number of units,
it is relatively easy for the general public to wander into the complex un-noticed. Once inside the
complex, people are not visible from external points. There appear to be limited windows
overlooking the shared areas. This is not considered to be a highly secure arrangement.
The survey respondents have indicated that the complex is rated 'very safe' by two of the residents
and ‘safe’ by one of the residents. This indicates a high level of perceived safety. There are private,
lock-up garages accessible with a remote control for each dwelling.
5 . 4 . 3 C o n v e n i e n c e
The development is located within close proximity to the Kingston shopping precinct, and is directly
adjacent to a shopping centre complex. However, owing to the design of the development and the
surrounding shopping centres, pedestrian site permeability is not ideal and vehicle transport is
promoted.
The Kingston Primary School is located within close proximity to the north-east of the site; however,
the street layouts do not encourage walking.
5 . 4 . 4 A m e n i t y a n d l i f e s t y l e
The affordability of the housing was indicated to be an attractive attribute by all survey respondents,
with convenience, quality and proximity to shops and work being other contributing factors.
5 . 4 . 5 D w e l l i n g c h a r a c t e r i s t i c s
The development consists of the two previously existing dwellings, with 18 new dwellings
constructed in three rows along the site. These new dwellings consist of seven two-storey
townhouses with the remainder being single storey. All dwellings have two bedrooms. The private
open space areas range from 70 m² to 263 m², with most being around 80 m². Each of the dwellings
has at least one car space, with additional visitor parking available on site.
5 .5 C on c l us i on
This development is the most recent and also most affordable development among the case studies.
85% of the units have sold relatively quickly, indicating that this product has a market if appropriately
located. The approval timeframe was within the statutory period, but at the upper extent. This
compares poorly against the Tasmanian average of 28 days for all approvals and 34 days for
discretionary developments.34
34 Parliament of Tasmania 2012, Report of the Auditor General No. 8 of 2011 – 12, The assessment of land-use planning applications.
Dion Lester
03 6210 1473
0400 224 414
email: [email protected]
www.pittsh.com.au
Brisbane Launceston
Level 2 276 Edward Street Brisbane Qld 4000
T 07 3221 0080
Level 4 113–115 Cimitiere Street Launceston Tas. 7250
T 03 6323 1900
Canberra Melbourne
Level 5 Tower A 7 London Circuit Canberra City ACT 2601
T 02 6295 2100
Level 1, HWT Tower 40 City Road Southbank Vic. 3006
PO Box 259 South Melbourne Vic. 3205
T 03 9682 5290
Devonport Sydney
Level 1 35 Oldaker Street Devonport Tas. 7310
T 03 6424 1641
Level 1 56 Clarence Street Sydney NSW 2000
T 02 8216 4700
Hobart
Ground floor 199 Macquarie Street Hobart Tas. 7000
T 03 6210 1400
Incorporated as Pitt and Sherry (Operations) Pty Ltd
ABN 67 140 184 309
David Parsell
02 9252 8777
0438 903 270
email: [email protected]
www.hillpda.com
Sydney Melbourne
Level 3 234 George Street Sydney NSW 2000
T 02 9252 8777 [email protected]
Suite 114 838 Collins Street Docklands Vic. 3008
T 03 9629 1842 [email protected]
Gold Coast
T 0403 454 752
pitt&sherry