pitch book january 2017
TRANSCRIPT
Prepared by George G. Namur, Ph.D.
January 2017
Dual Strategy
Equity Derivatives Fund

Confidentiality
Dual Strategy Equity Derivatives Fund2
This information is privileged and confidential. This
presentation includes descriptions of methodologies and
concepts derived through substantial research and
development efforts. No part of this presentation may be
reproduced by any means or transmitted without the written
permission of Dr George G. Namur.
Dual Strategy Equity Derivatives Fund3
Introduction
Fund Overview
Strategy Overview
Highlights of Prospective Organization
Dual Strategy Structure and Performance
Equity Valuation
Bios
Contact Information
Appendix
Overview
Introduction
Dual Strategy Equity Derivatives Fund4
Introduction
Dual Strategy Equity Derivatives Fund5
The fund is looking to raise capital in exchange for equity in the NewCo
Prospective funding General Partners (GPs) will receive shares in the Investment Manager Company and the Investment Advisor Company
GPs will jointly receive the performance and net management fees that the fund generates
Required funds are part seed capital and part operation expenses (OpEx) capital
Fund Overview
Dual Strategy Equity Derivatives Fund6

Fund Objective
Dual Strategy Equity Derivatives Fund7
Achieve superior risk-adjusted returns using equity derivatives and
quantitative models
Keep correlation with market and volatility in check through
diversification and proper strategy allocation
Fund is targeting an annual performance of approximately 30% before
management and performance fees, with a volatility in the mid-teens
and a Sharpe ratio of approximately 2

The Fund in a Snapshot
Dual Strategy Equity Derivatives Fund8
The FCA-regulated London based fund will combine two complementary
strategies to generate high returns while limiting volatility
Long-Biased Options Strategy
Quantitative Volatility Strategy
Equity options primarily The strategy serves to de-risk the options strategy
• The two strategies are loosely correlated (correlation of 0.115)*
• The combination features a barbell strategy where more weight is allocated to
the lower risk strategy* Monthly returns from Jan 2012 to Dec 2016 were used in computations
Portfolio Construction
Dual Strategy Equity Derivatives Fund9
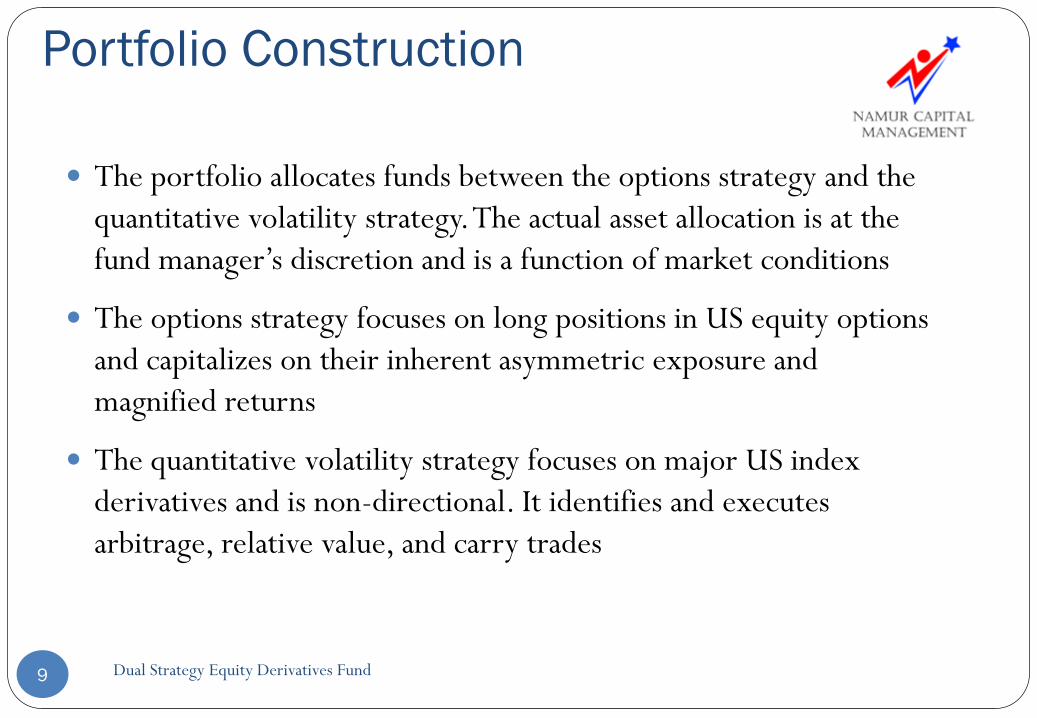
The portfolio allocates funds between the options strategy and the
quantitative volatility strategy. The actual asset allocation is at the
fund manager’s discretion and is a function of market conditions
The options strategy focuses on long positions in US equity options
and capitalizes on their inherent asymmetric exposure and
magnified returns
The quantitative volatility strategy focuses on major US index
derivatives and is non-directional. It identifies and executes
arbitrage, relative value, and carry trades
Theoretical Portfolio Allocation
Dual Strategy Equity Derivatives Fund10
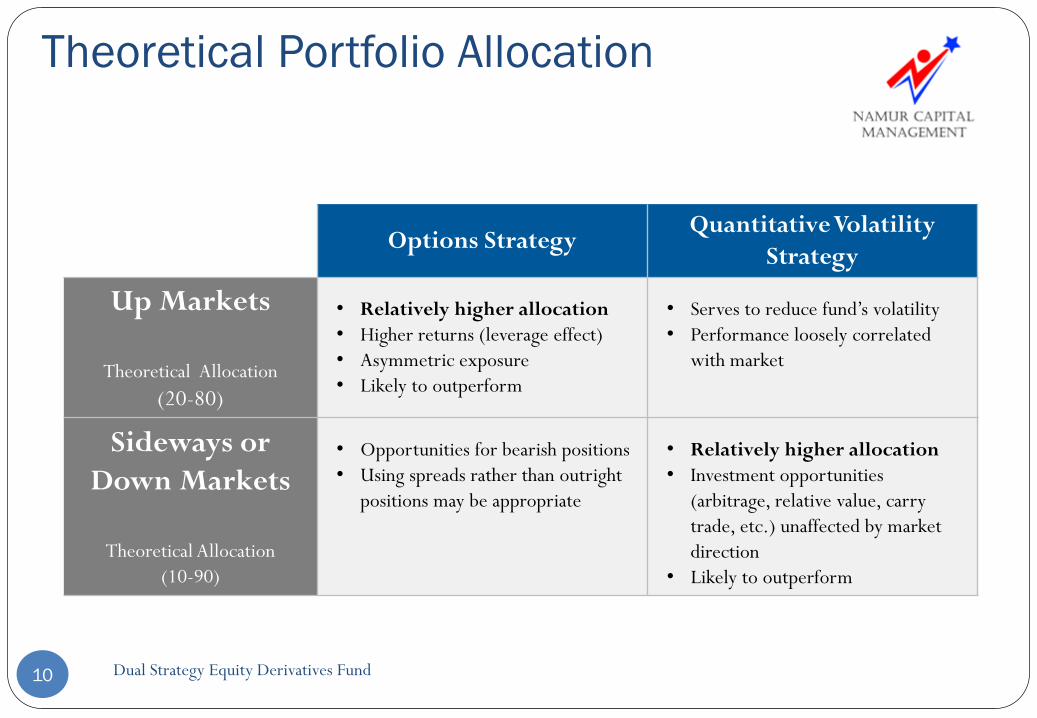
Options Strategy Quantitative Volatility
Strategy
Up Markets
Theoretical Allocation
(20-80)
• Relatively higher allocation
• Higher returns (leverage effect)
• Asymmetric exposure
• Likely to outperform
• Serves to reduce fund’s volatility
• Performance loosely correlated
with market
Sideways or
Down Markets
Theoretical Allocation
(10-90)
• Opportunities for bearish positions
• Using spreads rather than outright
positions may be appropriate
• Relatively higher allocation
• Investment opportunities
(arbitrage, relative value, carry
trade, etc.) unaffected by market
direction
• Likely to outperform

Strategy Overview
Dual Strategy Equity Derivatives Fund11
Options Strategy
Dual Strategy Equity Derivatives Fund12
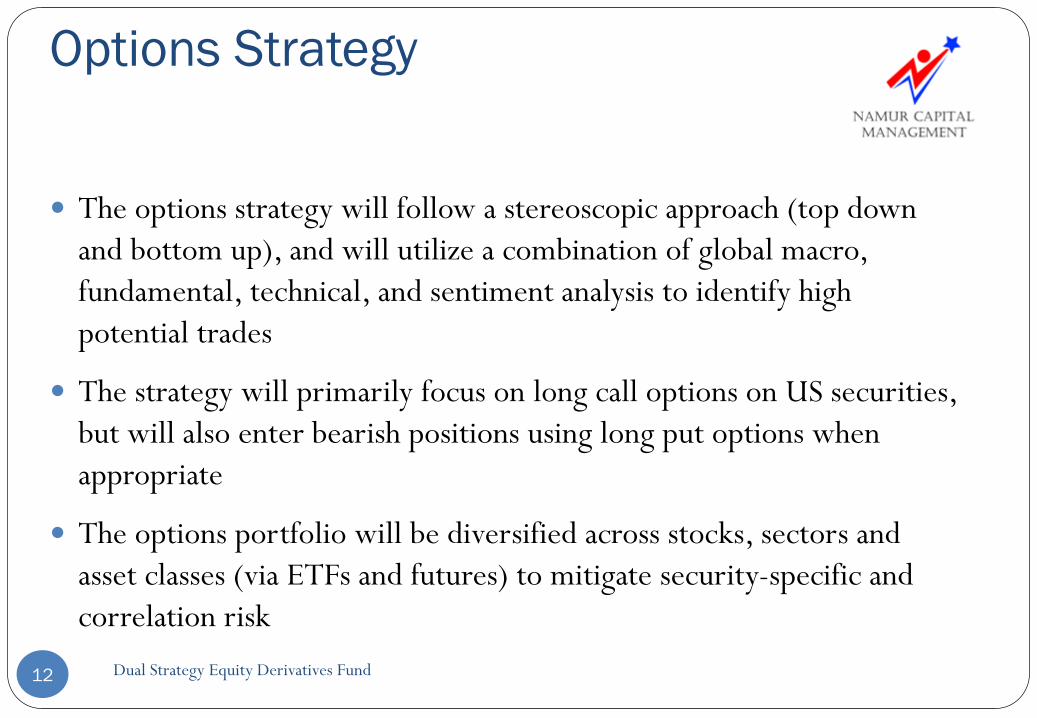
The options strategy will follow a stereoscopic approach (top down
and bottom up), and will utilize a combination of global macro,
fundamental, technical, and sentiment analysis to identify high
potential trades
The strategy will primarily focus on long call options on US securities,
but will also enter bearish positions using long put options when
appropriate
The options portfolio will be diversified across stocks, sectors and
asset classes (via ETFs and futures) to mitigate security-specific and
correlation risk
Quantitative Volatility Strategy
Dual Strategy Equity Derivatives Fund13
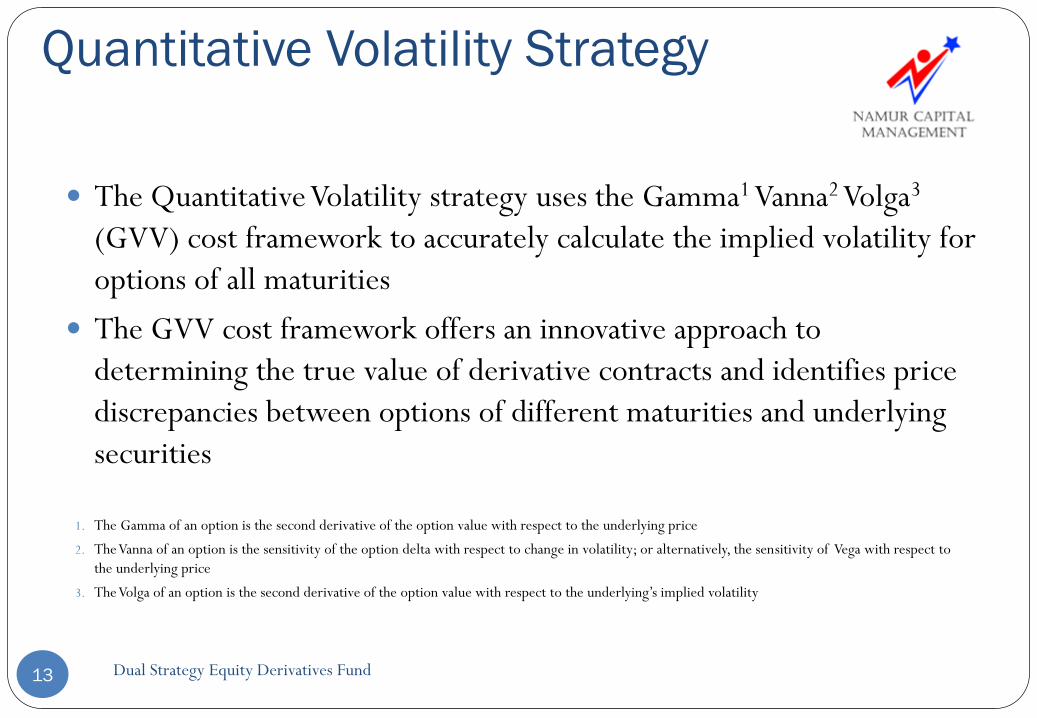
The Quantitative Volatility strategy uses the Gamma1 Vanna2 Volga3
(GVV) cost framework to accurately calculate the implied volatility for
options of all maturities
The GVV cost framework offers an innovative approach to
determining the true value of derivative contracts and identifies price
discrepancies between options of different maturities and underlying
securities
1. The Gamma of an option is the second derivative of the option value with respect to the underlying price
2. The Vanna of an option is the sensitivity of the option delta with respect to change in volatility; or alternatively, the sensitivity of Vega with respect to
the underlying price
3. The Volga of an option is the second derivative of the option value with respect to the underlying’s implied volatility

Highlights of Prospective Organization
Dual Strategy Equity Derivatives Fund14
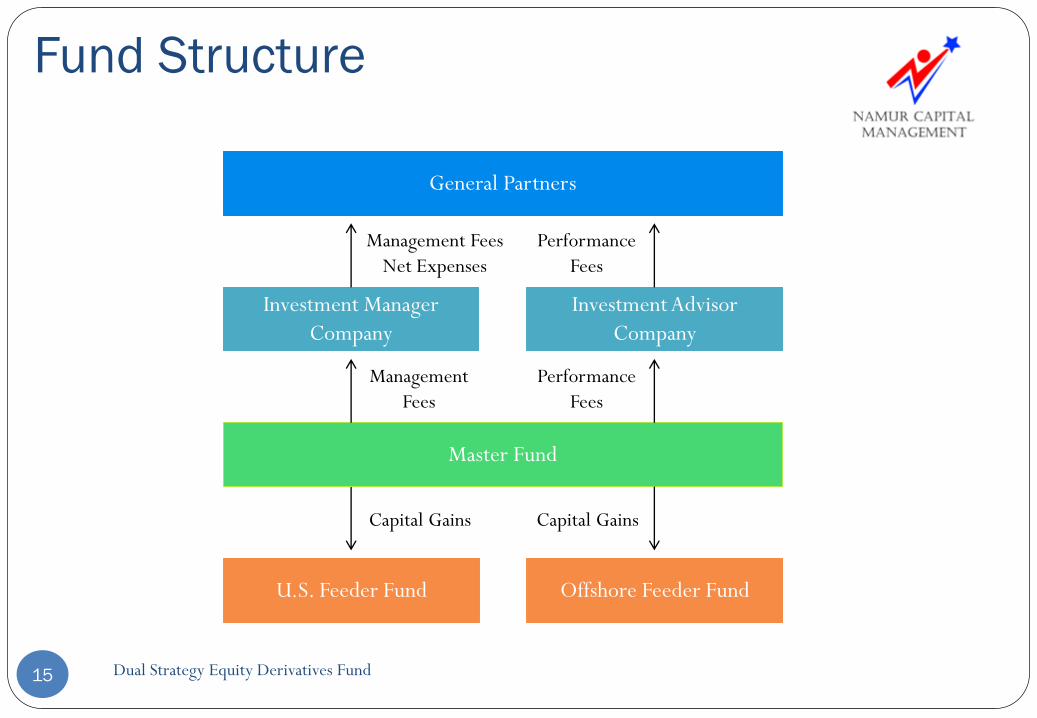
Fund Structure
Dual Strategy Equity Derivatives Fund15
U.S. Feeder Fund Offshore Feeder Fund
Master Fund
Investment Advisor
Company
General Partners
Capital GainsCapital Gains
Performance
Fees
Performance
Fees
Investment Manager
Company
Management
Fees
Management Fees
Net Expenses

Fee Structure
Dual Strategy Equity Derivatives Fund16
• Assets under management will be subject to an annual management fee
of 2%
• The fee will be charged on the first business day of every quarter on
the net assets under management as of the last business day of the
previous quarter
• Profits will be subject to an annual performance fee of 20%
• The fee will be charged on the first business day of every quarter on
the previous quarter profits in excess of the high-watermark, after the
management fees are deducted
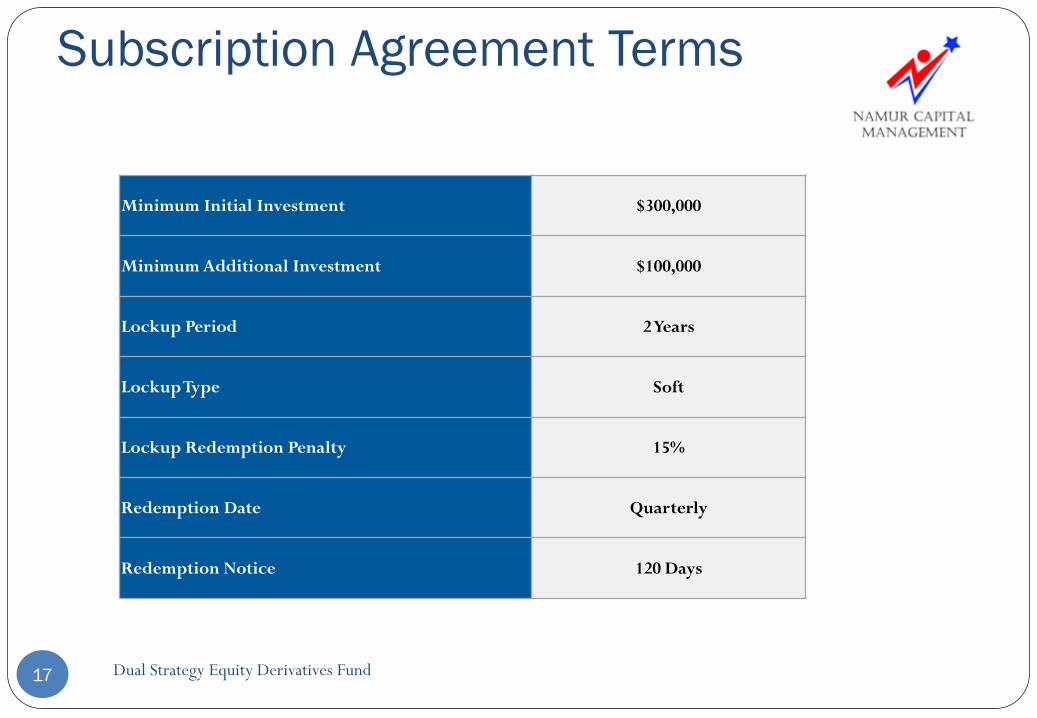
Subscription Agreement Terms
Dual Strategy Equity Derivatives Fund17
Minimum Initial Investment $300,000
Minimum Additional Investment $100,000
Lockup Period 2 Years
Lockup Type Soft
Lockup Redemption Penalty 15%
Redemption Date Quarterly
Redemption Notice 120 Days

Service Providers
Dual Strategy Equity Derivatives Fund18
Investment Manager Company
UBS London
(Prime Broker)
PwC London
(Auditor)
HSBC London
(Banker)
Dechert London
(Law Firm)
Citco London
(Administrator)
FCA
(Regulator)
Dual Strategy Structure and
Hypothetical Performance
Dual Strategy Equity Derivatives Fund19
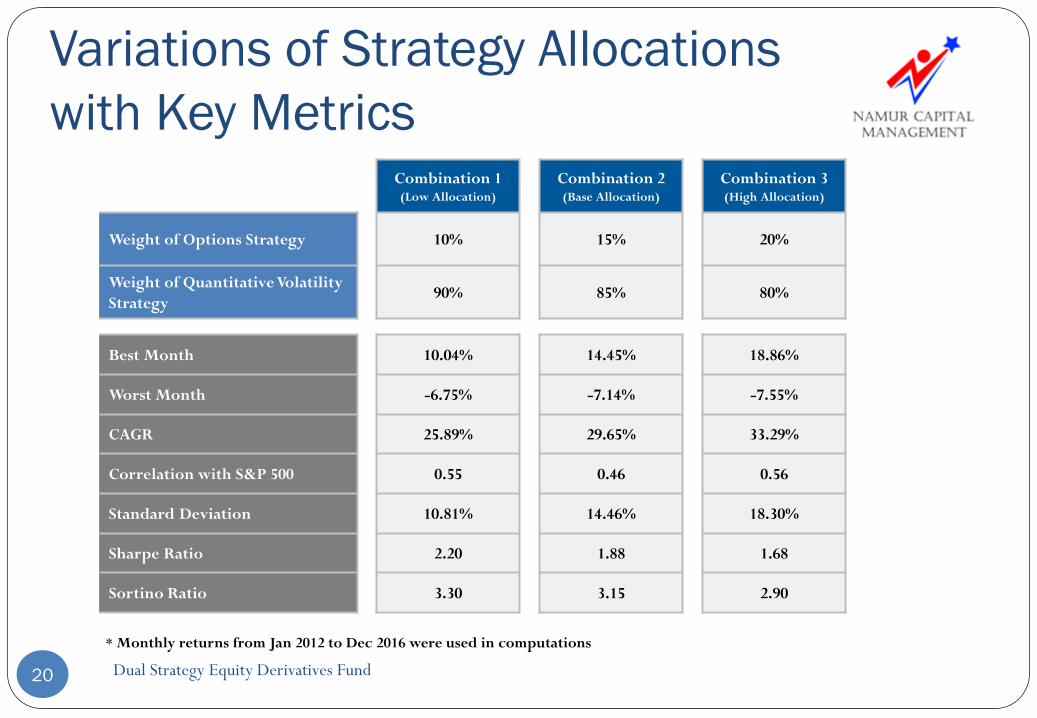
Dual Strategy Equity Derivatives Fund20
Combination 1(Low Allocation)
Combination 2(Base Allocation)
Combination 3(High Allocation)
Weight of Options Strategy 10% 15% 20%
Weight of Quantitative Volatility
Strategy90% 85% 80%
Best Month 10.04% 14.45% 18.86%
Worst Month -6.75% -7.14% -7.55%
CAGR 25.89% 29.65% 33.29%
Correlation with S&P 500 0.55 0.46 0.56
Standard Deviation 10.81% 14.46% 18.30%
Sharpe Ratio 2.20 1.88 1.68
Sortino Ratio 3.30 3.15 2.90
* Monthly returns from Jan 2012 to Dec 2016 were used in computations
Variations of Strategy Allocations
with Key Metrics
Dual Strategy Equity Derivatives Fund21
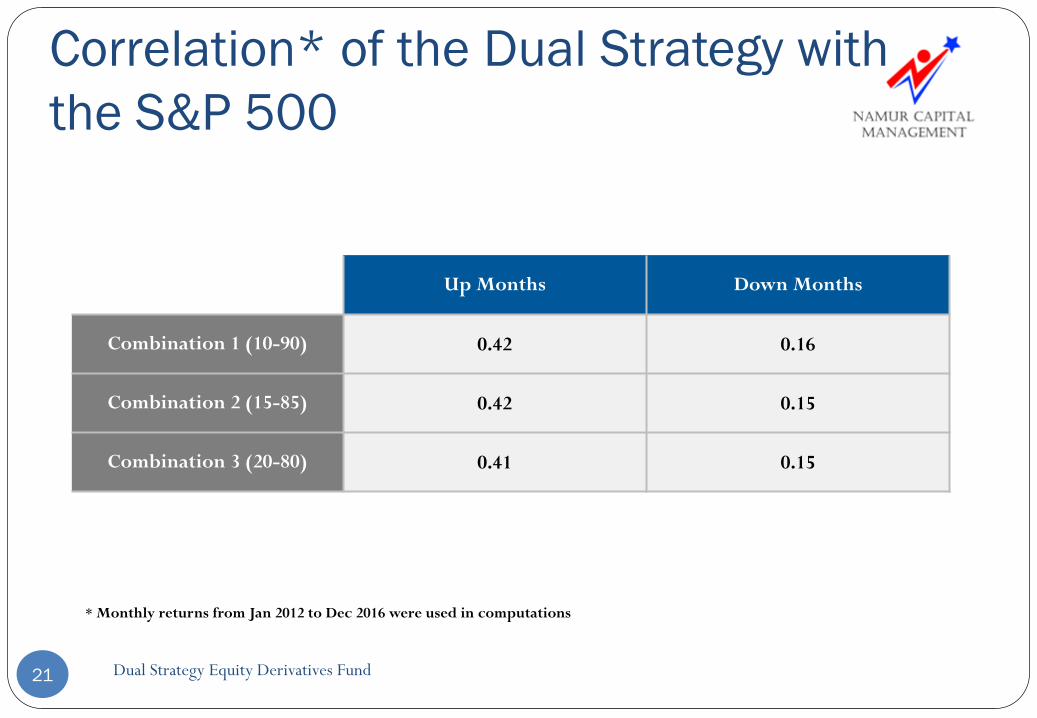
Up Months Down Months
Combination 1 (10-90) 0.42 0.16
Combination 2 (15-85) 0.42 0.15
Combination 3 (20-80) 0.41 0.15
* Monthly returns from Jan 2012 to Dec 2016 were used in computations
Correlation* of the Dual Strategy with
the S&P 500
Dual Strategy Equity Derivatives Fund22
-10%
-5%
0%
5%
10%
15%
Jan
-12
Fe
b-1
2M
ar-1
2A
pr-
12M
ay-1
2Ju
n-1
2Ju
l-12
Au
g-1
2Se
p-1
2O
ct-
12N
ov
-12
De
c-1
2Ja
n-1
3F
eb
-13
Mar
-13
Ap
r-13
May
-13
Jun
-13
Jul-
13A
ug
-13
Sep
-13
Oc
t-13
No
v-1
3D
ec
-13
Jan
-14
Fe
b-1
4M
ar-1
4A
pr-
14M
ay-1
4Ju
n-1
4Ju
l-14
Au
g-1
4Se
p-1
4O
ct-
14N
ov
-14
De
c-1
4Ja
n-1
5F
eb
-15
Mar
-15
Ap
r-15
May
-15
Jun
-15
Jul-
15A
ug
-15
Sep
-15
Oc
t-15
No
v-1
5D
ec
-15
Jan
-16
Fe
b-1
6M
ar-1
6A
pr-
16M
ay-1
6Ju
n-1
6Ju
l-16
Au
g-1
6Se
p-1
6O
ct-
16N
ov
-16
De
c-1
6
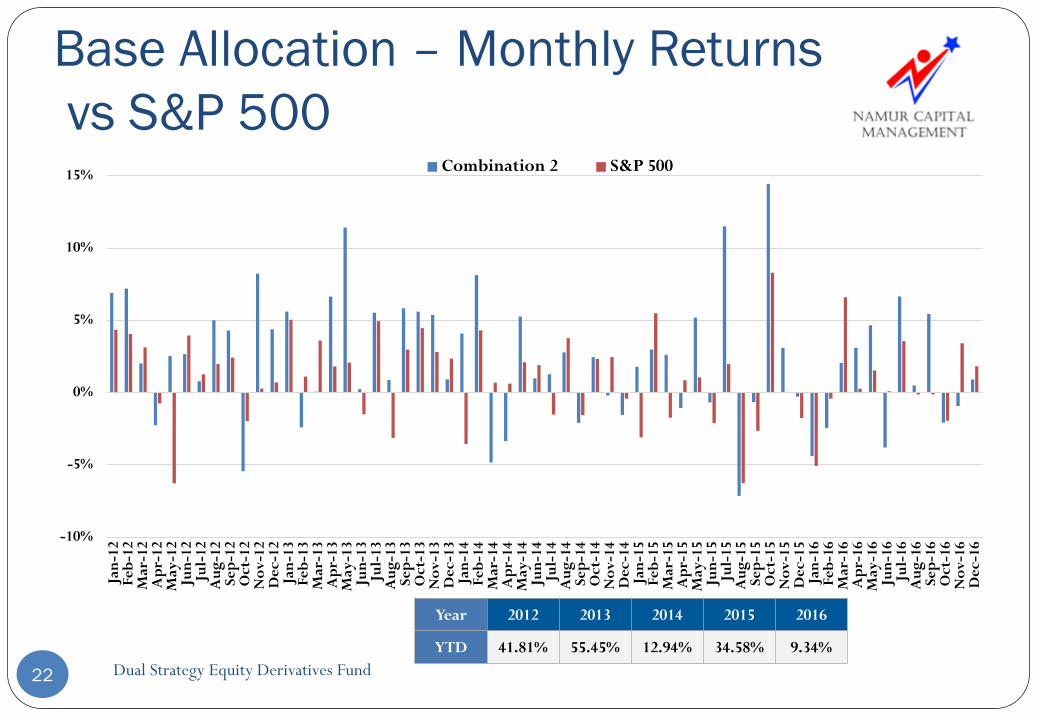
Combination 2 S&P 500
Base Allocation – Monthly Returns
vs S&P 500
Year 2012 2013 2014 2015 2016
YTD 41.81% 55.45% 12.94% 34.58% 9.34%

Dual Strategy Equity Derivatives Fund23
* VAMI: Value Added Monthly Index, or the value of $1,000 invested at beginning of time series.
VA
MI
1,000
1,500
2,000
2,500
3,000
3,500
4,000
Jan
-12
Fe
b-1
2M
ar-1
2A
pr-
12M
ay-1
2Ju
n-1
2Ju
l-12
Au
g-1
2Se
p-1
2O
ct-
12N
ov
-12
De
c-1
2Ja
n-1
3F
eb
-13
Mar
-13
Ap
r-13
May
-13
Jun
-13
Jul-
13A
ug
-13
Sep
-13
Oc
t-13
No
v-1
3D
ec
-13
Jan
-14
Fe
b-1
4M
ar-1
4A
pr-
14M
ay-1
4Ju
n-1
4Ju
l-14
Au
g-1
4Se
p-1
4O
ct-
14N
ov
-14
De
c-1
4Ja
n-1
5F
eb
-15
Mar
-15
Ap
r-15
May
-15
Jun
-15
Jul-
15A
ug
-15
Sep
-15
Oc
t-15
No
v-1
5D
ec
-15
Jan
-16
Fe
b-1
6M
ar-1
6A
pr-
16M
ay-1
6Ju
n-1
6Ju
l-16
Au
g-1
6Se
p-1
6O
ct-
16N
ov
-16
De
c-1
6
Combination 2 S&P 500
Base Allocation – VAMI Curve vs
S&P 500
Equity Valuation – Base Allocation
Dual Strategy Equity Derivatives Fund24
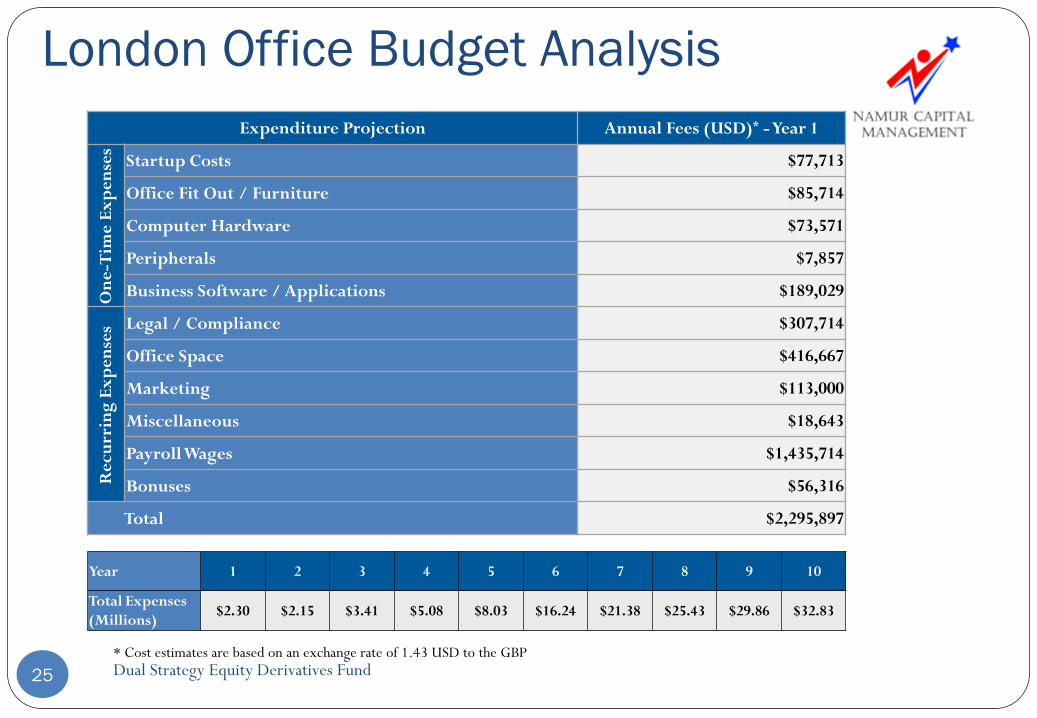
London Office Budget Analysis
Dual Strategy Equity Derivatives Fund25
Expenditure Projection Annual Fees (USD)* -Year 1
On
e-T
ime
Ex
pe
nse
s
Startup Costs $77,713
Office Fit Out / Furniture $85,714
Computer Hardware $73,571
Peripherals $7,857
Business Software / Applications $189,029
Re
cu
rrin
g E
xp
en
ses Legal / Compliance $307,714
Office Space $416,667
Marketing $113,000
Miscellaneous $18,643
Payroll Wages $1,435,714
Bonuses $56,316
Total $2,295,897
* Cost estimates are based on an exchange rate of 1.43 USD to the GBP
Year 1 2 3 4 5 6 7 8 9 10
Total Expenses
(Millions)$2.30 $2.15 $3.41 $5.08 $8.03 $16.24 $21.38 $25.43 $29.86 $32.83
Equity Value – Base Allocation
Dual Strategy Equity Derivatives Fund26
• The mean value of equity computed by discounting the total fees
net of costs is around $260 million
• The required OpEx capital was calculated as $5 million by
taking the mean deficit of management fees over 10,000
iterations and adding three standard deviations of the mean
deficit
• Three standard deviations were added in order to minimize the
odds of being underfunded
Term Sheet Framework
Dual Strategy Equity Derivatives Fund27
A successful launch of this venture requires $5 million in OpEx capital and a minimum of $50 million of assets under management (seed capital).
Prospective investors must invest both seed and OpEx capital to become GPs in the fund
An equity stake of 25% in return for $50 million seed investment provides a funding GP with an IRR of around 35%
To keep GPs interests aligned with those of LPs, funding and sweat equity GPs are expected to be meaningfully invested in the fund (AUM) while the fund is operating

Term Sheet Framework
Dual Strategy Equity Derivatives Fund28
In return for the $5 million OpEx capital, a funding GP will
receive callable cumulative preferred shares at a preferred rate of
8% per annum, paid out quarterly
No bonuses will be paid to fund executives when the fund cannot
meet its dividend obligation on the outstanding preferred shares
The fund will buy back the preferred shares when capital is
available, hence insuring that GPs cover operating expenses in
proportion their equity stake
Fund Manager’s Bio
Dual Strategy Equity Derivatives Fund29
Dual Strategy Equity Derivatives Fund30
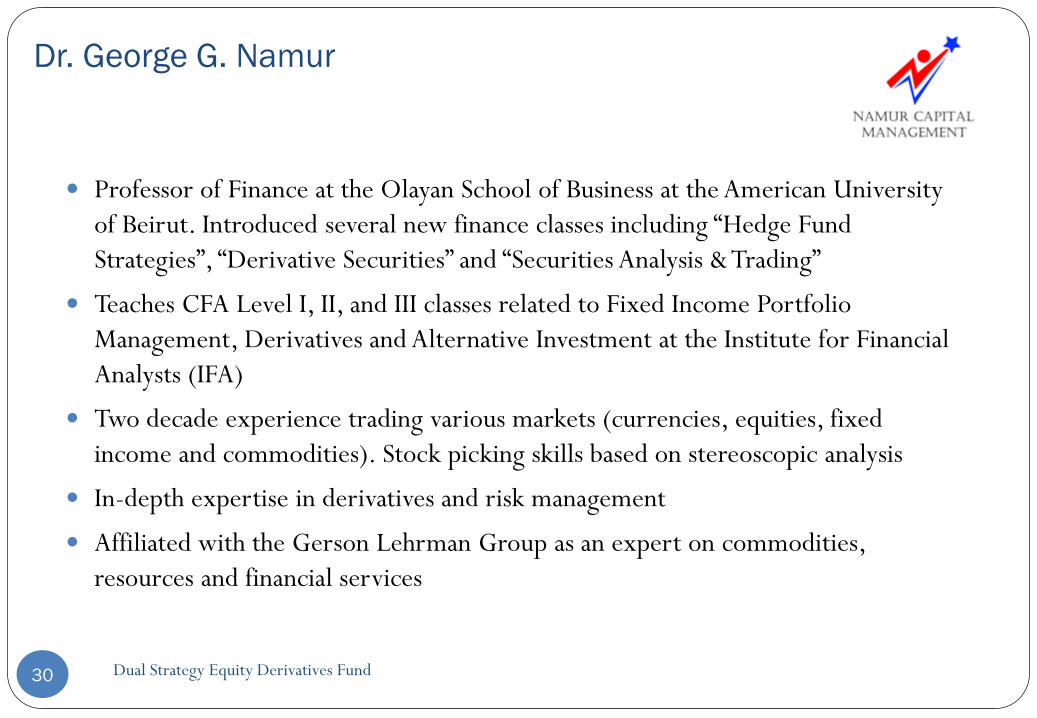
Professor of Finance at the Olayan School of Business at the American University
of Beirut. Introduced several new finance classes including “Hedge Fund
Strategies”, “Derivative Securities” and “Securities Analysis & Trading”
Teaches CFA Level I, II, and III classes related to Fixed Income Portfolio
Management, Derivatives and Alternative Investment at the Institute for Financial
Analysts (IFA)
Two decade experience trading various markets (currencies, equities, fixed
income and commodities). Stock picking skills based on stereoscopic analysis
In-depth expertise in derivatives and risk management
Affiliated with the Gerson Lehrman Group as an expert on commodities,
resources and financial services
Dr. George G. Namur
Dual Strategy Equity Derivatives Fund31
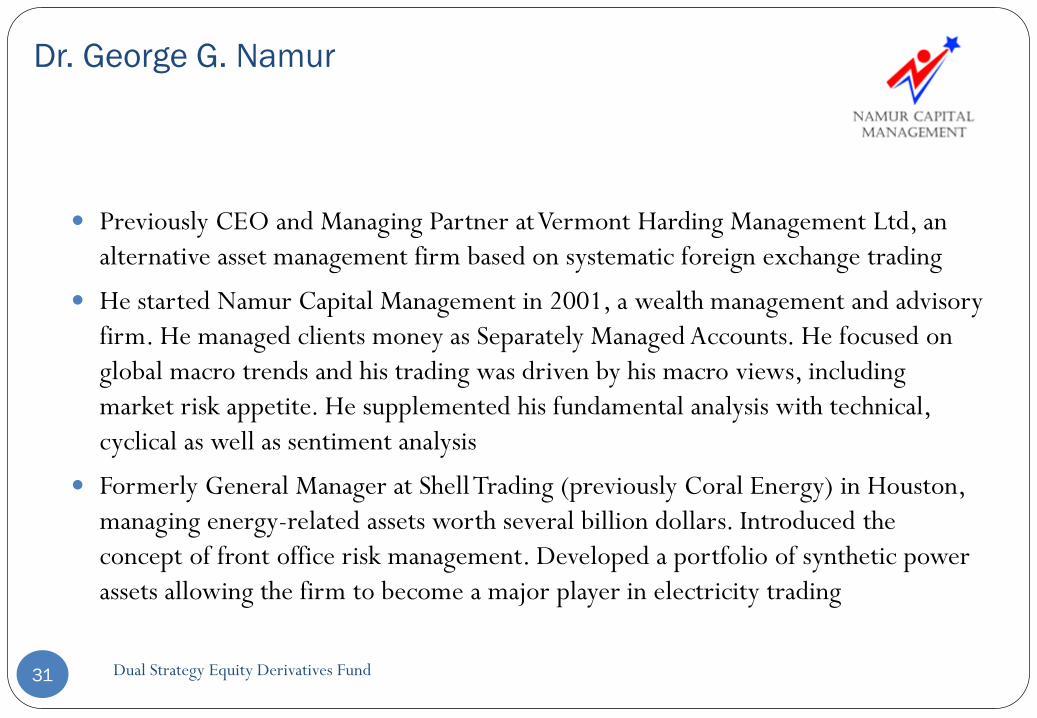
Previously CEO and Managing Partner at Vermont Harding Management Ltd, an
alternative asset management firm based on systematic foreign exchange trading
He started Namur Capital Management in 2001, a wealth management and advisory
firm. He managed clients money as Separately Managed Accounts. He focused on
global macro trends and his trading was driven by his macro views, including
market risk appetite. He supplemented his fundamental analysis with technical,
cyclical as well as sentiment analysis
Formerly General Manager at Shell Trading (previously Coral Energy) in Houston,
managing energy-related assets worth several billion dollars. Introduced the
concept of front office risk management. Developed a portfolio of synthetic power
assets allowing the firm to become a major player in electricity trading
Dr. George G. Namur
Dual Strategy Equity Derivatives Fund32
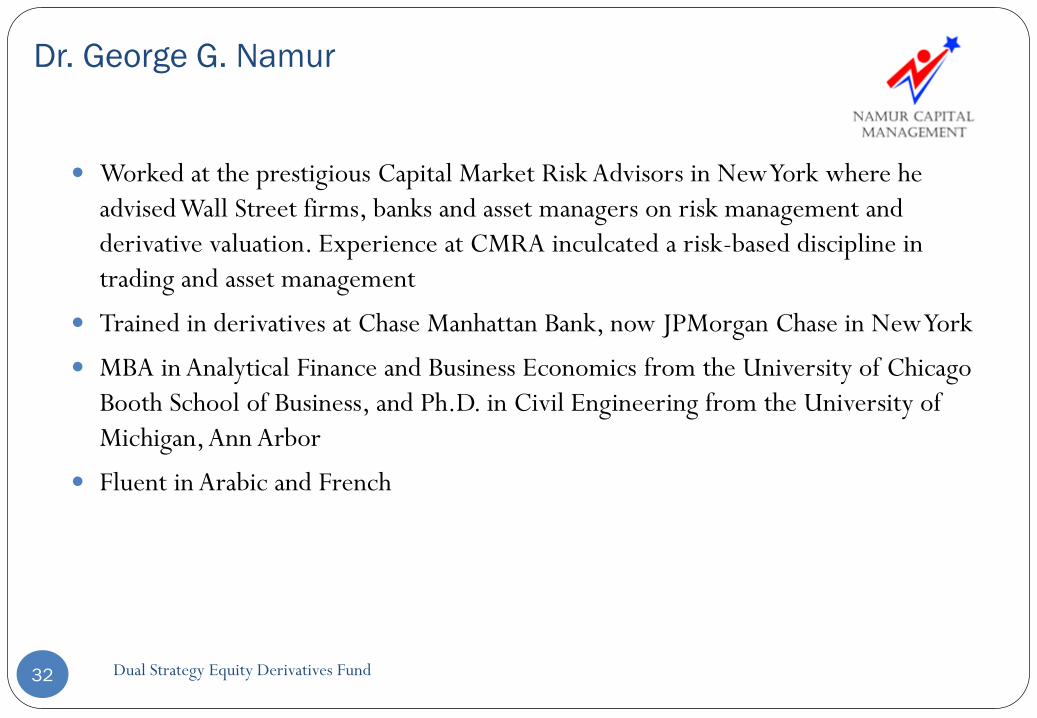
Worked at the prestigious Capital Market Risk Advisors in New York where he
advised Wall Street firms, banks and asset managers on risk management and
derivative valuation. Experience at CMRA inculcated a risk-based discipline in
trading and asset management
Trained in derivatives at Chase Manhattan Bank, now JPMorgan Chase in New York
MBA in Analytical Finance and Business Economics from the University of Chicago
Booth School of Business, and Ph.D. in Civil Engineering from the University of
Michigan, Ann Arbor
Fluent in Arabic and French
Dr. George G. Namur
Quantitative Volatility Portfolio
Manager’s Bio
Dual Strategy Equity Derivatives Fund33
Dual Strategy Equity Derivatives Fund34
Senior equity derivatives trader for a major bank in New York
Joined the bank in 2000 and has been managing the risk on the S&P 500 index
options portfolio since 2004
Main responsibilities include market making, customer facilitation and proprietary
trading as well as overseeing risk on other derivative products
Helped develop volatility marking methodologies that analyze relative value
opportunities in secondary risks
MS in Financial Engineering degree from Columbia University and MBA in Finance
from the City University of New York
Contact Information
Dual Strategy Equity Derivatives Fund35
Dual Strategy Equity Derivatives Fund36
For further enquiries, please contact
George G. Namur, Ph.D.
+1 (917) 421-9866
+961 (71) 100977
Contact Information
Appendix
Dual Strategy Equity Derivatives Fund37
Valuation Model Key Assumptions
Dual Strategy Equity Derivatives Fund38
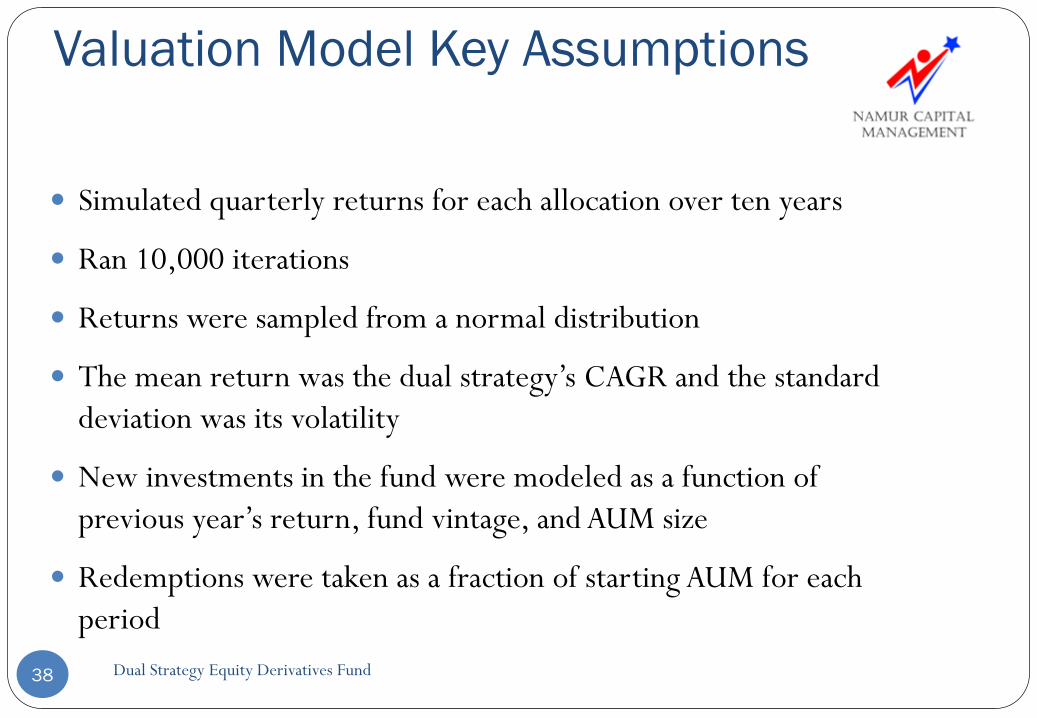
Simulated quarterly returns for each allocation over ten years
Ran 10,000 iterations
Returns were sampled from a normal distribution
The mean return was the dual strategy’s CAGR and the standard
deviation was its volatility
New investments in the fund were modeled as a function of
previous year’s return, fund vintage, and AUM size
Redemptions were taken as a fraction of starting AUM for each
period
Discount Rate Assumptions
Dual Strategy Equity Derivatives Fund39
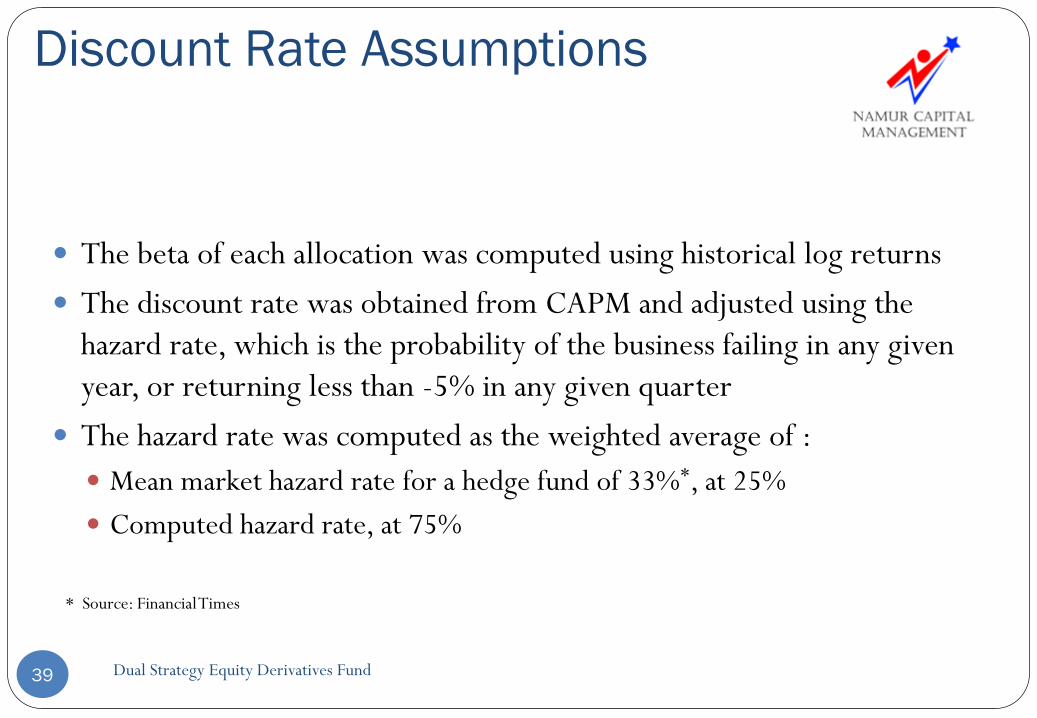
The beta of each allocation was computed using historical log returns
The discount rate was obtained from CAPM and adjusted using the
hazard rate, which is the probability of the business failing in any given
year, or returning less than -5% in any given quarter
The hazard rate was computed as the weighted average of :
Mean market hazard rate for a hedge fund of 33%*, at 25%
Computed hazard rate, at 75%
* Source: Financial Times
Discount Rate
Dual Strategy Equity Derivatives Fund40
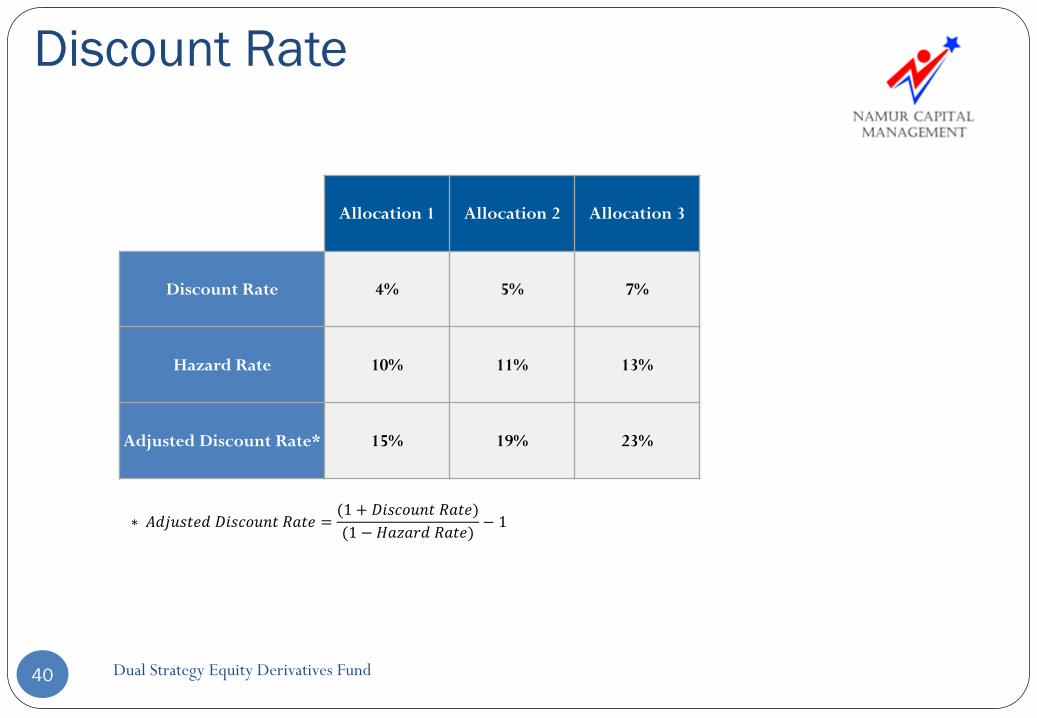
Allocation 1 Allocation 2 Allocation 3
Discount Rate 4% 5% 7%
Hazard Rate 10% 11% 13%
Adjusted Discount Rate* 15% 19% 23%
∗ 𝐴𝑑𝑗𝑢𝑠𝑡𝑒𝑑 𝐷𝑖𝑠𝑐𝑜𝑢𝑛𝑡 𝑅𝑎𝑡𝑒 =(1 + 𝐷𝑖𝑠𝑐𝑜𝑢𝑛𝑡 𝑅𝑎𝑡𝑒)
(1 − 𝐻𝑎𝑧𝑎𝑟𝑑 𝑅𝑎𝑡𝑒)− 1
Dual Strategy Equity Derivatives Fund41
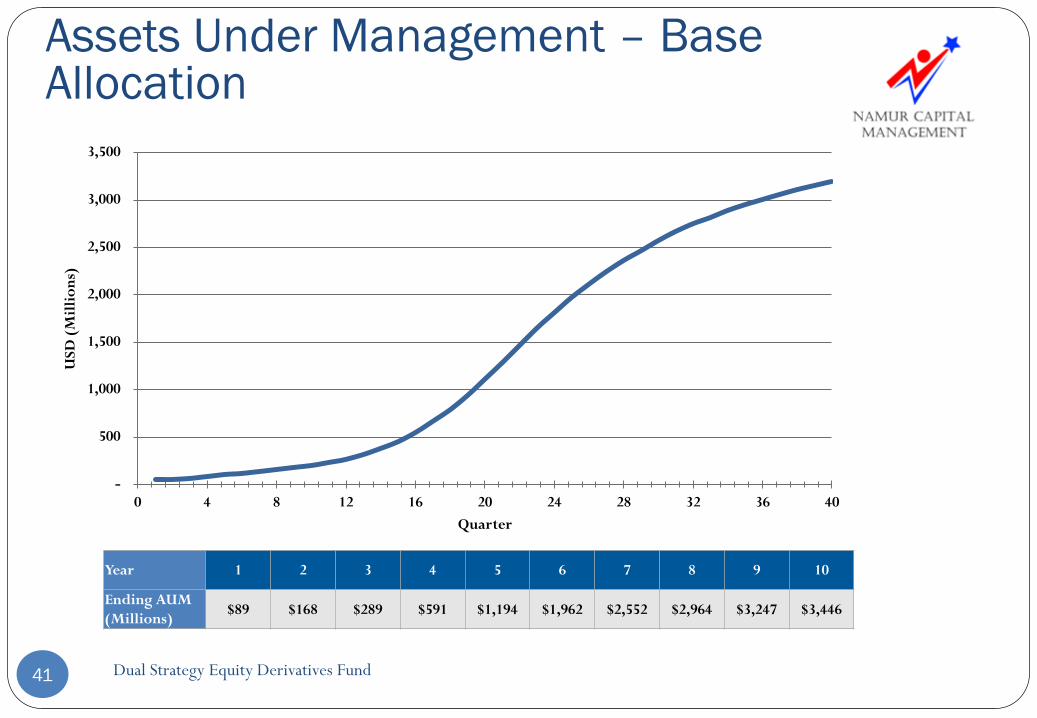
Assets Under Management – Base Allocation
Year 1 2 3 4 5 6 7 8 9 10
Ending AUM
(Millions)$89 $168 $289 $591 $1,194 $1,962 $2,552 $2,964 $3,247 $3,446
-
500
1,000
1,500
2,000
2,500
3,000
3,500
0 4 8 12 16 20 24 28 32 36 40
USD
(M
illi
on
s)
Quarter
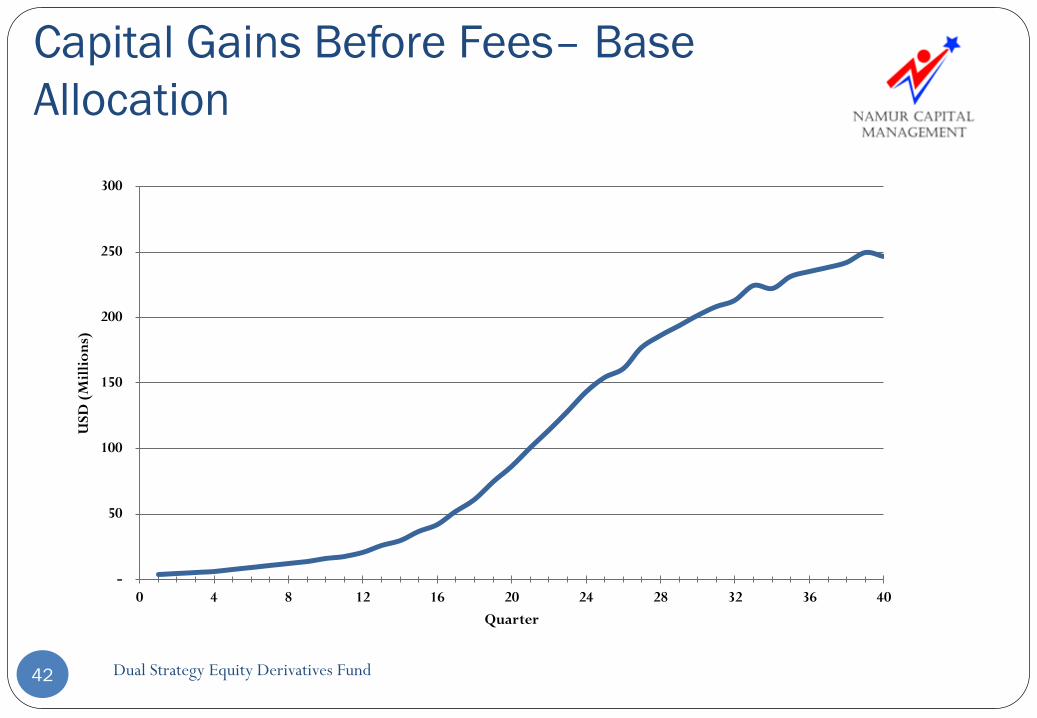
Capital Gains Before Fees– Base
Allocation
Dual Strategy Equity Derivatives Fund42
-
50
100
150
200
250
300
0 4 8 12 16 20 24 28 32 36 40
USD
(M
illi
on
s)
Quarter
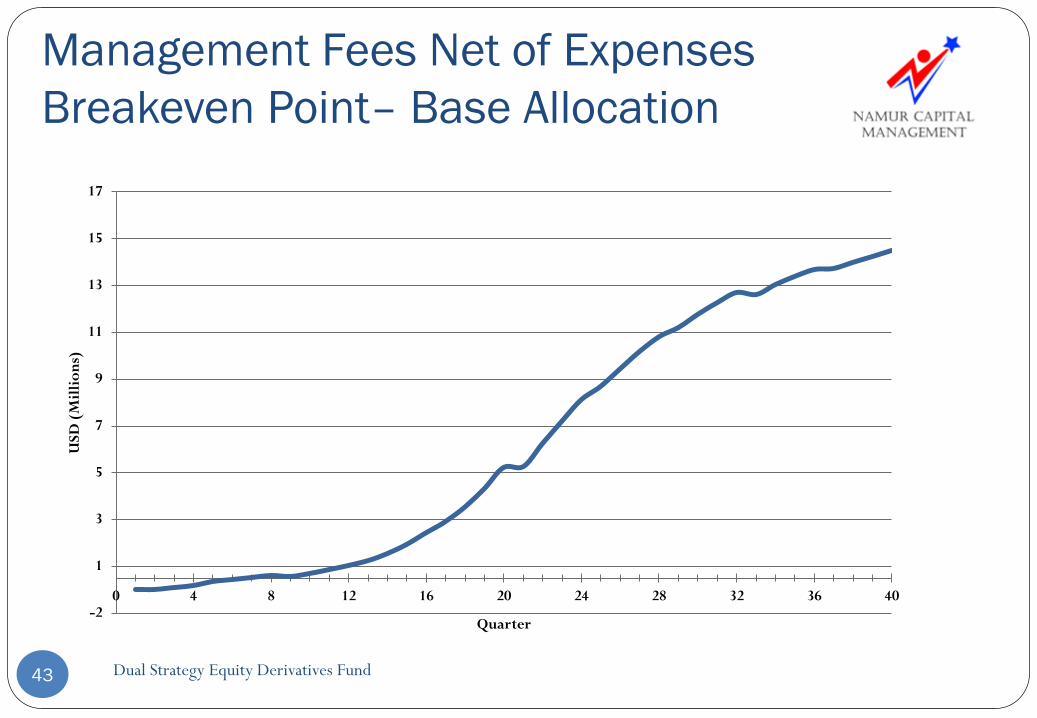
Management Fees Net of Expenses
Breakeven Point– Base Allocation
Dual Strategy Equity Derivatives Fund43
-2
1
3
5
7
9
11
13
15
17
0 4 8 12 16 20 24 28 32 36 40
USD
(M
illi
on
s)
Quarter
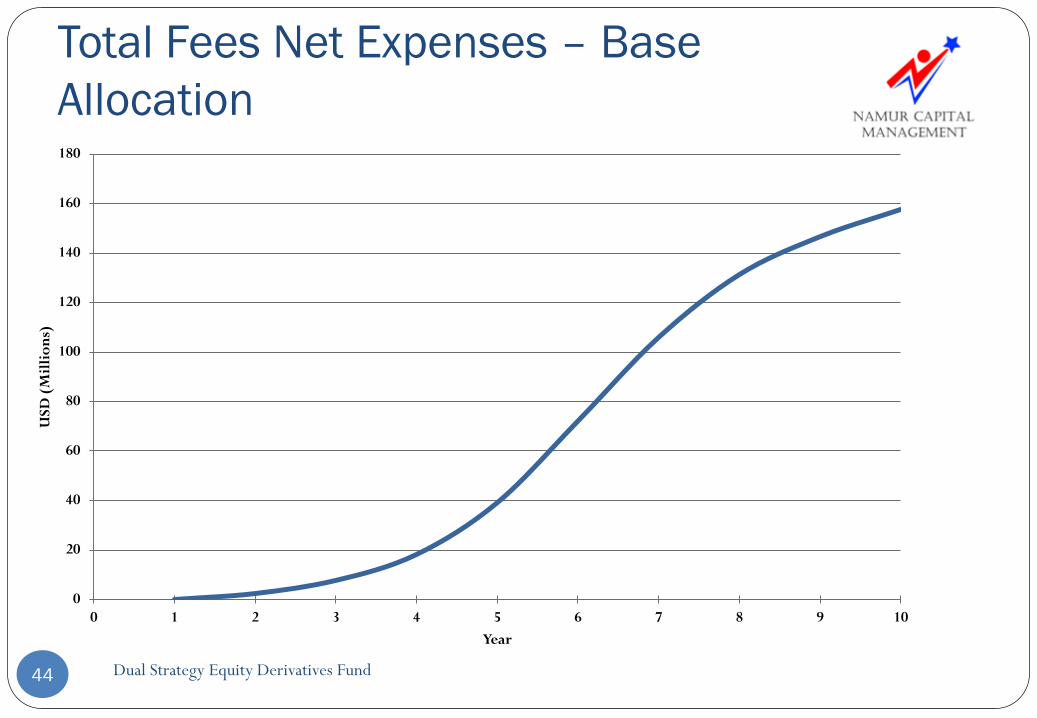
Total Fees Net Expenses – Base
Allocation
Dual Strategy Equity Derivatives Fund44
0
20
40
60
80
100
120
140
160
180
0 1 2 3 4 5 6 7 8 9 10
USD
(M
illi
on
s)
Year
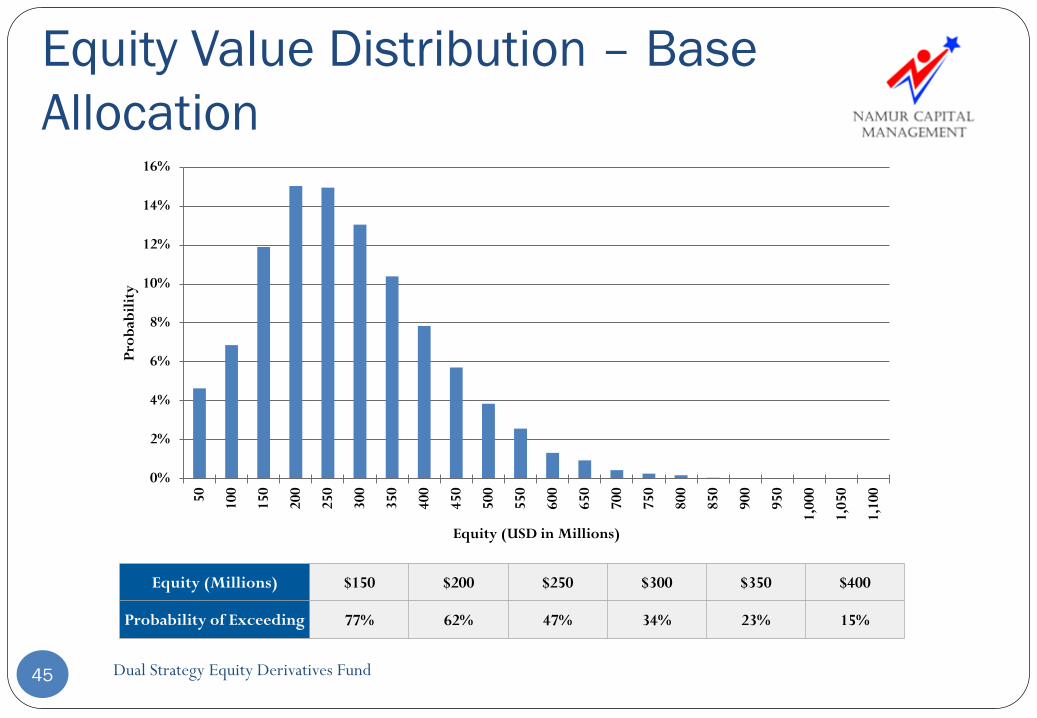
Equity Value Distribution – Base
Allocation
Dual Strategy Equity Derivatives Fund45
Equity (Millions) $150 $200 $250 $300 $350 $400
Probability of Exceeding 77% 62% 47% 34% 23% 15%
0%
2%
4%
6%
8%
10%
12%
14%
16%
50 100
150
200
250
300
350
400
450
500
550
600
650
700
750
800
850
900
950
1,00
0
1,05
0
1,10
0
Pro
bab
ilit
y
Equity (USD in Millions)