pirls 2001 international report, chapter 6 - timss.bc.edu · even though the home plays an...
TRANSCRIPT
PIRLSChapter 6
PIRLS International Report

6

[165]
Chapter 6Teachers andReading Instruction
Even though the home plays an important part in
children’s early literacy activities, there is no doubt
that teachers and the instructional approaches they
use are central in helping students learn to read.
Teachers assign the materials to be read, select
various instructional activities, monitor the
development of students’ comprehension skills and
strategies, and provide opportunities for students
to respond to what they have read.

[166]
Teachers often help students learn to use the library and to use technology toaccess and exchange information and ideas. They may also assign homeworkand conduct informal as well as formal assessments.
Chapter 6 presents teachers’ reports ontheir background and training and theirinstructional practices. Information also is pre-sented about the types of materials used ininstruction, the activities students do in class,the use of libraries and technology, the role ofhomework, and the frequency of various assess-ment approaches.
The data were collected via a question-naire in which PIRLS asked teachers to provide information about their prepa-ration to teach and how they teach reading. Because the sampling for theteacher questionnaires was based on participating students, the teachers arerepresentative of those who teach reading to the students assessed. It is impor-tant to note that when information from the teacher questionnaire is beingreported, the student is always the unit of analysis. That is, the data shown arethe percentages of students whose teachers reported on various characteris-tics or instructional strategies. Using the student as the unit of analysis makesit possible to describe the instruction received by students. Although thisperspective may differ from that obtained by simply collecting and report-ing the information provided by teachers, it is consistent with the PIRLSgoals of providing information about the educational contexts and perform-ance of students.
Since the teachers who completed the questionnaire were the readingteachers of the students who took the PIRLS test, the information aboutinstruction is tied directly to the students tested. Sometimes, however, teach-ers did not complete the questionnaire assigned to them, so most countrieshad some percentage of students for whom no teachers questionnaire infor-mation is available. The exhibits in this chapter have special notations on thispoint. For a country where teacher responses are available for 70 to 84 percentof students, an “r” is included next to its data. Where teacher responses are
chapter 6: teachers and reading instruction
On average, about half thestudents were taught
reading by teachers with auniversity degree.
[167]chapter 6: teachers and reading instruction
available for 50 to 69 percent of students, an “s” is included. Where teacherresponses are available for less than 50 percent, an “x” replaces the data.
What Preparation Do Teachers Have for Teaching Reading?
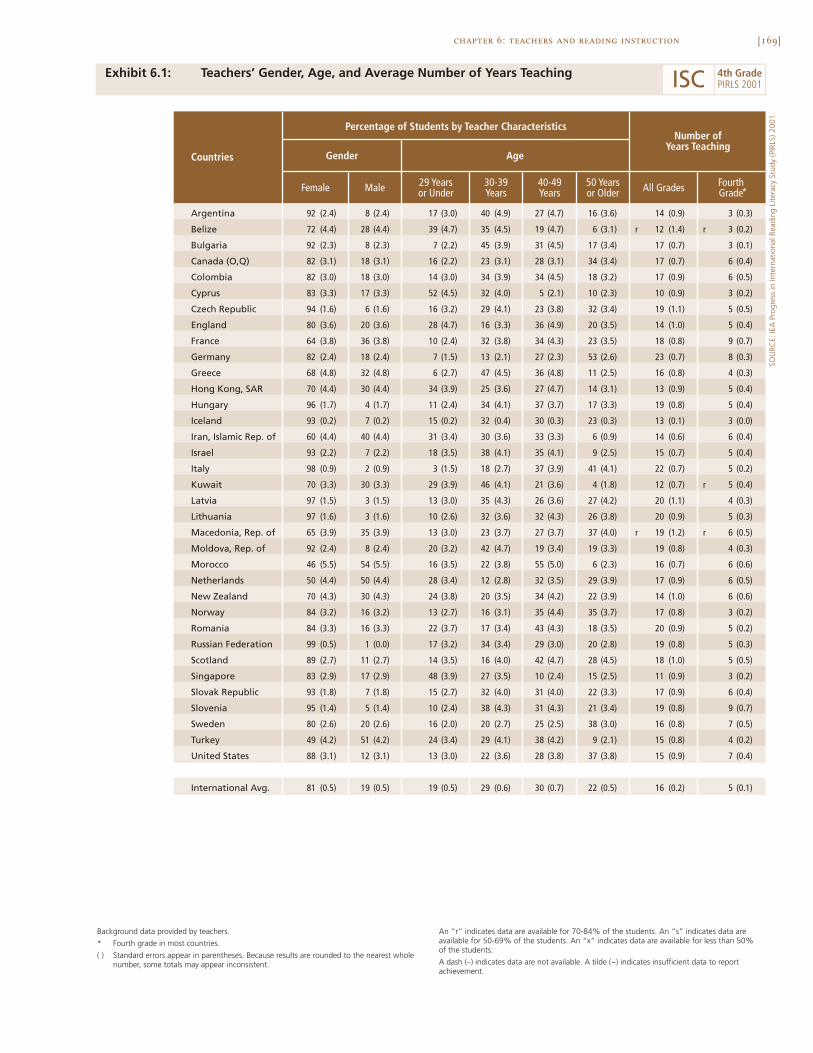
This section presents information about the background characteristics ofreading teachers, including gender, age, experience, and teaching assignment.Information also is included about teachers’ formal education, certification,and major area of study.
As shown in Exhibit 6.1, students in many of the PIRLS countries weretaught reading by female teachers. Internationally, on average, 81 percent of thefourth-grade students were taught reading by women and 19 percent by men.Countries where reading was taught almost exclusively by female teachers(97% or more) include Italy, Latvia, Lithuania, and the Russian Federation.In several countries, however, at least half (50 to 54%) the students had malereading teachers, including Morocco, The Netherlands, and Turkey.
Internationally, on average, approximately half the fourth-grade stu-dents were taught by teachers younger than 40 years old and half by teach-ers 40 or older. If there was a steady replenishing of the teaching force, onemight expect approximately equivalent percentages of students taught byteachers in their 20s, 30s, 40s, and 50s, and, internationally, the situation wasvery close to this picture. There, of course, was considerable variation amongcountries. In Cyprus and Singapore, about half the students were taught byteachers in their 20s and in Germany about half by teachers in their 50s.
Considering that, internationally, students, on average, had readingteachers who reported being about 40 years old, it is not surprising that stu-dents, on average, had teachers who reported being relatively experienced –about 16 years of teaching experience overall, with 5 years at the fourth grade.
Exhibit 6.2 shows that even though students in Canada (O,Q) (91%),England (88%), and the United States (95%) stayed with a teacher only oneyear, this policy varied greatly across countries. Internationally, on average,during primary and elementary school about as many students (27%) stayedwith their teachers four or more years as stayed only one year (31%). Manyof the eastern European countries had students (90% or more) staying with

[168]
their teachers for four or more years, including Bulgaria, Lithuania, Macedo-nia, Moldova, and Romania.
Exhibit 6.3 presents teachers’ reports about their teaching responsi-bilities. Internationally, on average, a slim majority (54%) of the fourth-gradestudents had reading teachers that reported being their only teacher andhaving general responsibilities for teaching all subjects. Teachers reportedthis situation for 80 percent or more of students in Belize, Iceland, Iran,Lithuania, Macedonia, and the Russian Federation. Countries reporting themost specialization for students were Hong Kong (89%), Israel (77%), Italy(85%), and Kuwait (79%). At the fourth grade, sharing teaching responsibil-ities did not seem to be very prevalent (only 7% internationally, on average).Interestingly, the countries with the most students (one-fourth or more) beingtaught by teachers sharing responsibilities included Morocco (25%) as wellas three of the top-performing countries – Bulgaria (25%), The Netherlands(25%), and Sweden (30%).
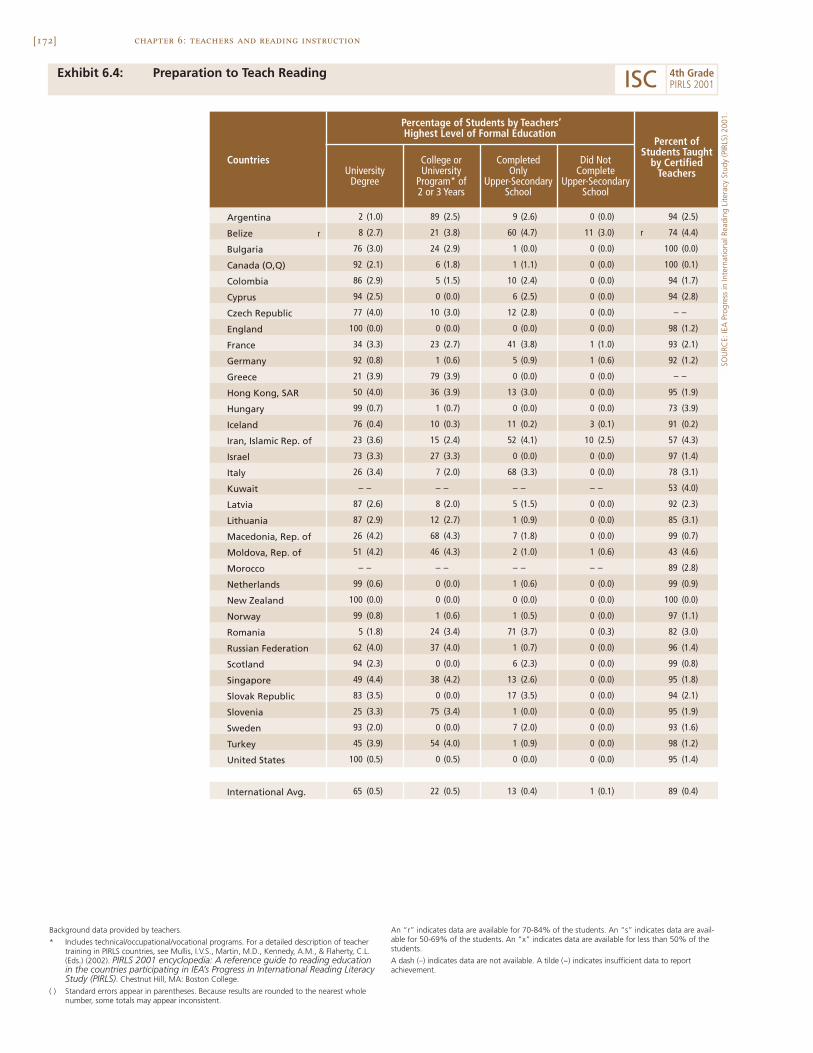
Exhibit 6.4 contains information about teachers’ formal educationand certification. On average, internationally, nearly two-thirds (65%) ofstudents were taught reading by teachers with a university degree and 22percent by graduates of college or university programs of two or three yearsin duration. From the requisites for becoming a fourth-grade reading teacherin each of the participating countries described in the PIRLS 2001 Encyclo-pedia,1 it is clear that there are differences in preparation and certificationpolicies. In some countries, all or nearly all the fourth-grade students (morethan 90%) were taught reading by teachers with university degrees (Canada(O,Q), Cyprus, England, Germany, Hungary, The Netherlands, New Zealand,Norway, Scotland, Sweden, and the United States). In other countries, themajority of students had teachers that graduated from college or universityprograms of 2 or 3 three years, often targeted specifically to teaching(Argentina, Greece, Macedonia, Slovenia, and Turkey). Eighty-nine percentof students, on average, internationally, were taught reading by a teacherhaving a teaching certificate.
Exhibit 6.5 presents teachers’ reports about the areas of emphasis in their formal education and training. The results reveal that, on average,
chapter 6: teachers and reading instruction
1 Mullis, I.V.S., Martin, M.O., Kennedy, A.M., & Flaherty, C.L. (Eds.) (2002). PIRLS 2001 encyclopedia: A reference guide to reading education inthe countries participating in IEA’s Progress in International Reading Literacy Study (PIRLS). Chestnut Hill, MA: Boston College.
[169]chapter 6: teachers and reading instruction
Exhibit 6.1: Teachers’ Gender, Age, and Average Number of Years Teaching
SOU
RCE:
IEA
Pro
gres
s in
Inte
rnat
iona
l Rea
ding
Lite
racy
Stu
dy (P
IRLS
) 200
1.
Argentina 92 (2.4) 8 (2.4) 17 (3.0) 40 (4.9) 27 (4.7) 16 (3.6) 14 (0.9) 3 (0.3)
Belize 72 (4.4) 28 (4.4) 39 (4.7) 35 (4.5) 19 (4.7) 6 (3.1) r 12 (1.4) r 3 (0.2)
Bulgaria 92 (2.3) 8 (2.3) 7 (2.2) 45 (3.9) 31 (4.5) 17 (3.4) 17 (0.7) 3 (0.1)
Canada (O,Q) 82 (3.1) 18 (3.1) 16 (2.2) 23 (3.1) 28 (3.1) 34 (3.4) 17 (0.7) 6 (0.4)
Colombia 82 (3.0) 18 (3.0) 14 (3.0) 34 (3.9) 34 (4.5) 18 (3.2) 17 (0.9) 6 (0.5)
Cyprus 83 (3.3) 17 (3.3) 52 (4.5) 32 (4.0) 5 (2.1) 10 (2.3) 10 (0.9) 3 (0.2)
Czech Republic 94 (1.6) 6 (1.6) 16 (3.2) 29 (4.1) 23 (3.8) 32 (3.4) 19 (1.1) 5 (0.5)
England 80 (3.6) 20 (3.6) 28 (4.7) 16 (3.3) 36 (4.9) 20 (3.5) 14 (1.0) 5 (0.4)
France 64 (3.8) 36 (3.8) 10 (2.4) 32 (3.8) 34 (4.3) 23 (3.5) 18 (0.8) 9 (0.7)
Germany 82 (2.4) 18 (2.4) 7 (1.5) 13 (2.1) 27 (2.3) 53 (2.6) 23 (0.7) 8 (0.3)
Greece 68 (4.8) 32 (4.8) 6 (2.7) 47 (4.5) 36 (4.8) 11 (2.5) 16 (0.8) 4 (0.3)
Hong Kong, SAR 70 (4.4) 30 (4.4) 34 (3.9) 25 (3.6) 27 (4.7) 14 (3.1) 13 (0.9) 5 (0.4)
Hungary 96 (1.7) 4 (1.7) 11 (2.4) 34 (4.1) 37 (3.7) 17 (3.3) 19 (0.8) 5 (0.4)
Iceland 93 (0.2) 7 (0.2) 15 (0.2) 32 (0.4) 30 (0.3) 23 (0.3) 13 (0.1) 3 (0.0)
Iran, Islamic Rep. of 60 (4.4) 40 (4.4) 31 (3.4) 30 (3.6) 33 (3.3) 6 (0.9) 14 (0.6) 6 (0.4)
Israel 93 (2.2) 7 (2.2) 18 (3.5) 38 (4.1) 35 (4.1) 9 (2.5) 15 (0.7) 5 (0.4)
Italy 98 (0.9) 2 (0.9) 3 (1.5) 18 (2.7) 37 (3.9) 41 (4.1) 22 (0.7) 5 (0.2)
Kuwait 70 (3.3) 30 (3.3) 29 (3.9) 46 (4.1) 21 (3.6) 4 (1.8) 12 (0.7) r 5 (0.4)
Latvia 97 (1.5) 3 (1.5) 13 (3.0) 35 (4.3) 26 (3.6) 27 (4.2) 20 (1.1) 4 (0.3)
Lithuania 97 (1.6) 3 (1.6) 10 (2.6) 32 (3.6) 32 (4.3) 26 (3.8) 20 (0.9) 5 (0.3)
Macedonia, Rep. of 65 (3.9) 35 (3.9) 13 (3.0) 23 (3.7) 27 (3.7) 37 (4.0) r 19 (1.2) r 6 (0.5)
Moldova, Rep. of 92 (2.4) 8 (2.4) 20 (3.2) 42 (4.7) 19 (3.4) 19 (3.3) 19 (0.8) 4 (0.3)
Morocco 46 (5.5) 54 (5.5) 16 (3.5) 22 (3.8) 55 (5.0) 6 (2.3) 16 (0.7) 6 (0.6)
Netherlands 50 (4.4) 50 (4.4) 28 (3.4) 12 (2.8) 32 (3.5) 29 (3.9) 17 (0.9) 6 (0.5)
New Zealand 70 (4.3) 30 (4.3) 24 (3.8) 20 (3.5) 34 (4.2) 22 (3.9) 14 (1.0) 6 (0.6)
Norway 84 (3.2) 16 (3.2) 13 (2.7) 16 (3.1) 35 (4.4) 35 (3.7) 17 (0.8) 3 (0.2)
Romania 84 (3.3) 16 (3.3) 22 (3.7) 17 (3.4) 43 (4.3) 18 (3.5) 20 (0.9) 5 (0.2)
Russian Federation 99 (0.5) 1 (0.0) 17 (3.2) 34 (3.4) 29 (3.0) 20 (2.8) 19 (0.8) 5 (0.3)
Scotland 89 (2.7) 11 (2.7) 14 (3.5) 16 (4.0) 42 (4.7) 28 (4.5) 18 (1.0) 5 (0.5)
Singapore 83 (2.9) 17 (2.9) 48 (3.9) 27 (3.5) 10 (2.4) 15 (2.5) 11 (0.9) 3 (0.2)
Slovak Republic 93 (1.8) 7 (1.8) 15 (2.7) 32 (4.0) 31 (4.0) 22 (3.3) 17 (0.9) 6 (0.4)
Slovenia 95 (1.4) 5 (1.4) 10 (2.4) 38 (4.3) 31 (4.3) 21 (3.4) 19 (0.8) 9 (0.7)
Sweden 80 (2.6) 20 (2.6) 16 (2.0) 20 (2.7) 25 (2.5) 38 (3.0) 16 (0.8) 7 (0.5)
Turkey 49 (4.2) 51 (4.2) 24 (3.4) 29 (4.1) 38 (4.2) 9 (2.1) 15 (0.8) 4 (0.2)
United States 88 (3.1) 12 (3.1) 13 (3.0) 22 (3.6) 28 (3.8) 37 (3.8) 15 (0.9) 7 (0.4)
International Avg. 81 (0.5) 19 (0.5) 19 (0.5) 29 (0.6) 30 (0.7) 22 (0.5) 16 (0.2) 5 (0.1)
All Grades FourthGrade
Countries Gender Age
Number ofYears Teaching
Female 50 Yearsor Older
Percentage of Students by Teacher Characteristics
Male 29 Yearsor Under
30-39Years
40-49Years *
Background data provided by teachers.
* Fourth grade in most countries.
( ) Standard errors appear in parentheses. Because results are rounded to the nearest wholenumber, some totals may appear inconsistent.
An “r” indicates data are available for 70-84% of the students. An “s” indicates data areavailable for 50-69% of the students. An “x” indicates data are available for less than 50% of the students.
A dash (–) indicates data are not available. A tilde (~) indicates insufficient data to reportachievement.
ISC 4th GradePIRLS 2001

[170] chapter 6: teachers and reading instruction
Exhibit 6.2: Number of Years Students Typically Stay with the Same Classroom Teacher
Argentina 45 (4.4) 39 (4.6) 12 (2.8) 1 (0.7) 3 (1.3)
Belize 69 (4.3) 11 (3.0) 1 (0.4) 0 (0.0) 20 (4.0)
Bulgaria 0 (0.0) 2 (0.7) 8 (2.0) 90 (2.1) 0 (0.0)
Canada (O,Q) 91 (1.9) 7 (1.6) 0 (0.0) 0 (0.0) 2 (1.0)
Colombia 37 (4.2) 20 (4.0) 12 (2.9) 19 (4.1) 12 (2.6)
Cyprus 43 (4.8) 22 (4.2) 2 (0.1) 0 (0.0) 33 (4.8)
Czech Republic 1 (0.9) 40 (4.4) 34 (4.2) 14 (3.1) 11 (2.9)
England 88 (2.7) 9 (2.0) 0 (0.0) 1 (0.0) 2 (1.7)
France 62 (4.3) 12 (2.4) 3 (0.7) 1 (0.3) 22 (3.8)
Germany 0 (0.0) 37 (2.7) 7 (1.5) 53 (2.9) 4 (1.3)
Greece 15 (2.8) 41 (4.5) 11 (3.5) 2 (0.1) 32 (4.1)
Hong Kong, SAR 29 (3.9) 16 (3.6) 0 (0.0) 0 (0.0) 55 (4.8)
Hungary 0 (0.0) 29 (3.7) 16 (2.5) 53 (3.6) 2 (1.1)
Iceland r 0 (0.0) 15 (0.3) 50 (0.4) 10 (0.2) 26 (0.4)
Iran, Islamic Rep. of 78 (3.8) 5 (1.3) 0 (0.1) 4 (1.8) 13 (3.2)
Israel 16 (3.4) 68 (3.8) 2 (1.3) 1 (0.0) 12 (2.8)
Italy 1 (0.6) 1 (0.9) 14 (2.5) 78 (3.1) 6 (1.9)
Kuwait 27 (3.6) 7 (2.4) 0 (0.0) 1 (0.0) 65 (4.3)
Latvia 2 (1.1) 3 (1.6) 19 (3.6) 74 (4.0) 2 (1.2)
Lithuania 0 (0.0) 0 (0.0) 0 (0.0) 98 (1.3) 2 (1.3)
Macedonia, Rep. of 0 (0.0) 1 (0.7) 0 (0.0) 99 (0.7) 0 (0.3)
Moldova, Rep. of 2 (1.0) 0 (0.0) 4 (1.8) 91 (2.5) 3 (1.4)
Morocco 61 (4.9) 9 (3.1) 3 (2.1) 3 (2.2) 24 (4.2)
Netherlands 75 (4.1) 14 (2.8) 2 (1.2) 0 (0.0) 8 (2.8)
New Zealand 76 (3.5) 15 (2.9) 2 (0.9) 2 (1.4) 4 (2.3)
Norway 0 (0.0) 3 (1.1) 47 (5.0) 39 (4.3) 12 (3.3)
Romania 0 (0.0) 3 (1.3) 3 (1.5) 91 (2.4) 3 (1.7)
Russian Federation 0 (0.0) 0 (0.0) 53 (4.6) 43 (4.4) 4 (1.2)
Scotland 74 (4.2) 21 (3.4) 1 (0.4) 0 (0.0) 5 (2.2)
Singapore 49 (3.6) 48 (3.6) 0 (0.0) 0 (0.0) 2 (1.2)
Slovak Republic 4 (1.6) 32 (3.8) 11 (2.6) 22 (3.3) 31 (3.9)
Slovenia 21 (3.8) 68 (4.2) 4 (1.7) 0 (0.0) 7 (2.2)
Sweden 1 (0.8) 25 (4.0) 70 (4.2) 3 (1.4) 2 (1.2)
Turkey 6 (2.0) 14 (3.1) 22 (4.0) 56 (4.6) 2 (1.2)
United States 95 (2.0) 3 (1.8) 0 (0.0) 0 (0.0) 2 (1.0)
International Avg. 31 (0.5) 18 (0.5) 12 (0.4) 27 (0.4) 12 (0.4)
Percentage of StudentsCountries
VariesGreatly
One SchoolYear or Less Two Years Three Years Four or
More Years
a
Background data provided by schools.
a In the Russian Federation, primary schools have a duration of 3 or 4 years. Students staywith the same primary teacher all though primary school.
( ) Standard errors appear in parentheses. Because results are rounded to the nearest wholenumber, some totals may appear inconsistent.
An “r” indicates data are available for 70-84% of the students. An “s” indicates data are avail-able for 50-69% of the students. An “x” indicates data are available for less than 50% of thestudents.
A dash (–) indicates data are not available. A tilde (~) indicates insufficient data to reportachievement.
SOU
RCE:
IEA
Pro
gres
s in
Inte
rnat
iona
l Rea
ding
Lite
racy
Stu
dy (P
IRLS
) 200
1.
ISC 4th GradePIRLS 2001

[171]chapter 6: teachers and reading instruction
Exhibit 6.3: Teachers’ General or Specialized Teaching Responsibilities
SOU
RCE:
IEA
Pro
gres
s in
Inte
rnat
iona
l Rea
ding
Lite
racy
Stu
dy (P
IRLS
) 200
1.
Argentina 50 (4.9) 37 (4.4) 8 (2.9) 4 (1.9)
Belize r 90 (3.9) 2 (1.6) 3 (1.7) 6 (3.1)
Bulgaria 19 (3.1) 32 (4.2) 25 (3.5) 24 (3.4)
Canada (O,Q) 58 (3.7) 22 (2.8) 7 (1.8) 13 (2.4)
Colombia 54 (4.8) 34 (4.3) 6 (2.5) 6 (2.7)
Cyprus 61 (5.3) 32 (5.4) 1 (0.7) 7 (2.4)
Czech Republic 54 (5.1) 39 (5.0) 2 (1.1) 5 (1.8)
England 52 (4.6) 30 (4.3) 10 (2.7) 8 (2.5)
France 50 (4.3) 30 (4.1) 9 (2.1) 11 (2.8)
Germany 38 (2.4) 50 (3.0) 2 (0.8) 10 (2.1)
Greece 47 (4.1) 41 (4.4) 0 (0.0) 12 (2.8)
Hong Kong, SAR 11 (2.6) 89 (2.7) 1 (0.7) 0 (0.0)
Hungary 28 (3.3) 51 (3.8) 9 (2.6) 11 (2.7)
Iceland 80 (0.3) 8 (0.2) 5 (0.1) 7 (0.2)
Iran, Islamic Rep. of 92 (1.8) 2 (0.8) 2 (0.9) 4 (1.4)
Israel 21 (3.8) 77 (3.8) 2 (1.0) 0 (0.0)
Italy 2 (0.9) 85 (2.6) 11 (2.1) 2 (1.2)
Kuwait r 20 (2.8) 79 (3.0) 0 (0.0) 1 (0.7)
Latvia 55 (4.6) 41 (4.5) 0 (0.0) 4 (1.7)
Lithuania 100 (0.0) 0 (0.0) 0 (0.0) 0 (0.0)
Macedonia, Rep. of 83 (3.3) 12 (2.8) 1 (0.0) 4 (1.8)
Moldova, Rep. of 59 (4.6) 38 (4.6) 0 (0.0) 3 (1.5)
Morocco r 53 (5.5) 22 (4.4) 25 (4.9) 0 (0.0)
Netherlands 59 (4.6) 2 (1.1) 25 (3.9) 14 (3.4)
New Zealand 69 (3.5) 14 (2.9) 5 (1.7) 12 (2.8)
Norway 60 (3.8) 18 (3.1) 16 (3.2) 7 (1.8)
Romania 51 (4.8) 46 (4.9) 0 (0.0) 2 (1.2)
Russian Federation 98 (0.9) 1 (0.8) 0 (0.0) 1 (0.5)
Scotland 70 (4.4) 8 (2.9) 16 (3.5) 6 (2.1)
Singapore 55 (4.0) 37 (3.8) 3 (1.5) 5 (1.6)
Slovak Republic 43 (4.3) 38 (3.9) 3 (1.4) 16 (3.2)
Slovenia 48 (3.8) 34 (3.6) 6 (2.2) 12 (2.6)
Sweden 40 (3.2) 18 (2.8) 30 (3.2) 12 (2.3)
Turkey 57 (4.5) 27 (3.8) 1 (1.0) 14 (3.1)
United States 62 (4.4) 18 (3.5) 9 (1.9) 10 (2.6)
International Avg. 54 (0.7) 32 (0.6) 7 (0.3) 7 (0.4)
Other Situations
Percentage of Students Whose Teachers Reported
Countries Being the Only Teacherfor All or Most of
the Time
That Students HaveDifferent Teachers forDifferent Subjects*
Sharing TeachingResponsibilities with
Another Teacher
Background data provided by teachers.
* May include having different teachers only for art, music, athletics, or other special activities.
( ) Standard errors appear in parentheses. Because results are rounded to the nearest wholenumber, some totals may appear inconsistent.
An “r” indicates data are available for 70-84% of the students. An “s” indicates data are avail-able for 50-69% of the students. An “x” indicates data are available for less than 50% of thestudents.
A dash (–) indicates data are not available. A tilde (~) indicates insufficient data to reportachievement.
ISC 4th GradePIRLS 2001
[172] chapter 6: teachers and reading instruction
Exhibit 6.4: Preparation to Teach Reading
Argentina
Belize r
Bulgaria
Canada (O,Q)
Colombia
Cyprus
Czech Republic
England
France
Germany
Greece
Hong Kong, SAR
Hungary
Iceland
Iran, Islamic Rep. of
Israel
Italy
Kuwait
Latvia
Lithuania
Macedonia, Rep. of
Moldova, Rep. of
Morocco
Netherlands
New Zealand
Norway
Romania
Russian Federation
Scotland
Singapore
Slovak Republic
Slovenia
Sweden
Turkey
United States
International Avg.
Percentage of Students by TeachersHighest Level of Formal Education
Percent ofStudents Taught
by CertifiedTeachers
Did NotComplete
Upper-SecondarySchool
CompletedOnly
Upper-SecondarySchool
College orUniversity
Program* of2 or 3 Years
UniversityDegree
Countries
’
2 (1.0) 89 (2.5) 9 (2.6) 0 (0.0) 94 (2.5)
8 (2.7) 21 (3.8) 60 (4.7) 11 (3.0) r 74 (4.4)
76 (3.0) 24 (2.9) 1 (0.0) 0 (0.0) 100 (0.0)
92 (2.1) 6 (1.8) 1 (1.1) 0 (0.0) 100 (0.1)
86 (2.9) 5 (1.5) 10 (2.4) 0 (0.0) 94 (1.7)
94 (2.5) 0 (0.0) 6 (2.5) 0 (0.0) 94 (2.8)
77 (4.0) 10 (3.0) 12 (2.8) 0 (0.0) – –
100 (0.0) 0 (0.0) 0 (0.0) 0 (0.0) 98 (1.2)
34 (3.3) 23 (2.7) 41 (3.8) 1 (1.0) 93 (2.1)
92 (0.8) 1 (0.6) 5 (0.9) 1 (0.6) 92 (1.2)
21 (3.9) 79 (3.9) 0 (0.0) 0 (0.0) – –
50 (4.0) 36 (3.9) 13 (3.0) 0 (0.0) 95 (1.9)
99 (0.7) 1 (0.7) 0 (0.0) 0 (0.0) 73 (3.9)
76 (0.4) 10 (0.3) 11 (0.2) 3 (0.1) 91 (0.2)
23 (3.6) 15 (2.4) 52 (4.1) 10 (2.5) 57 (4.3)
73 (3.3) 27 (3.3) 0 (0.0) 0 (0.0) 97 (1.4)
26 (3.4) 7 (2.0) 68 (3.3) 0 (0.0) 78 (3.1)
– – – – – – – – 53 (4.0)
87 (2.6) 8 (2.0) 5 (1.5) 0 (0.0) 92 (2.3)
87 (2.9) 12 (2.7) 1 (0.9) 0 (0.0) 85 (3.1)
26 (4.2) 68 (4.3) 7 (1.8) 0 (0.0) 99 (0.7)
51 (4.2) 46 (4.3) 2 (1.0) 1 (0.6) 43 (4.6)
– – – – – – – – 89 (2.8)
99 (0.6) 0 (0.0) 1 (0.6) 0 (0.0) 99 (0.9)
100 (0.0) 0 (0.0) 0 (0.0) 0 (0.0) 100 (0.0)
99 (0.8) 1 (0.6) 1 (0.5) 0 (0.0) 97 (1.1)
5 (1.8) 24 (3.4) 71 (3.7) 0 (0.3) 82 (3.0)
62 (4.0) 37 (4.0) 1 (0.7) 0 (0.0) 96 (1.4)
94 (2.3) 0 (0.0) 6 (2.3) 0 (0.0) 99 (0.8)
49 (4.4) 38 (4.2) 13 (2.6) 0 (0.0) 95 (1.8)
83 (3.5) 0 (0.0) 17 (3.5) 0 (0.0) 94 (2.1)
25 (3.3) 75 (3.4) 1 (0.0) 0 (0.0) 95 (1.9)
93 (2.0) 0 (0.0) 7 (2.0) 0 (0.0) 93 (1.6)
45 (3.9) 54 (4.0) 1 (0.9) 0 (0.0) 98 (1.2)
100 (0.5) 0 (0.5) 0 (0.0) 0 (0.0) 95 (1.4)
65 (0.5) 22 (0.5) 13 (0.4) 1 (0.1) 89 (0.4)
Background data provided by teachers.
* Includes technical/occupational/vocational programs. For a detailed description of teachertraining in PIRLS countries, see Mullis, I.V.S., Martin, M.D., Kennedy, A.M., & Flaherty, C.L.(Eds.) (2002). PIRLS 2001 encyclopedia: A reference guide to reading educationin the countries participating in IEA’s Progress in International Reading LiteracyStudy (PIRLS). Chestnut Hill, MA: Boston College.
( ) Standard errors appear in parentheses. Because results are rounded to the nearest wholenumber, some totals may appear inconsistent.
An “r” indicates data are available for 70-84% of the students. An “s” indicates data are avail-able for 50-69% of the students. An “x” indicates data are available for less than 50% of thestudents.
A dash (–) indicates data are not available. A tilde (~) indicates insufficient data to reportachievement.
SOU
RCE:
IEA
Pro
gres
s in
Inte
rnat
iona
l Rea
ding
Lite
racy
Stu
dy (P
IRLS
) 200
1.
ISC 4th GradePIRLS 2001

[173]chapter 6: teachers and reading instruction
Exhibit 6.5: Areas of Emphasis in Teachers’ Formal Education and/or Training
SOU
RCE:
IEA
Pro
gres
s in
Inte
rnat
iona
l Rea
ding
Lite
racy
Stu
dy (P
IRLS
) 200
1.
Argentina 50 (5.0) 36 (4.8) 46 (4.8) r 32 (5.0) 34 (4.6) 22 (4.3) 37 (4.7) 8 (2.8)
Belize r 76 (4.1) r 46 (5.9) r 33 (5.7) r 41 (5.8) r 15 (5.2) r 14 (4.4) r 18 (4.0) r 22 (5.4)
Bulgaria 96 (1.7) 93 (2.1) 94 (2.3) 87 (2.3) 29 (3.8) 58 (4.6) 59 (4.5) 48 (4.1)
Canada (O,Q) 72 (3.0) 46 (3.7) 51 (3.4) 44 (3.4) 17 (2.5) 22 (3.1) 26 (3.3) 22 (2.9)
Colombia 37 (4.6) 28 (4.2) 30 (4.5) 17 (3.7) 10 (3.0) 18 (3.2) 24 (3.2) 10 (2.5)
Cyprus 79 (3.3) 49 (5.0) 62 (4.3) 60 (4.8) 15 (3.9) 29 (4.3) 43 (4.3) 13 (3.1)
Czech Republic 86 (3.3) 71 (4.1) 74 (3.8) 65 (4.4) 32 (4.6) 31 (4.4) 23 (3.9) 27 (4.3)
England 66 (4.6) 59 (4.8) 41 (5.1) 32 (4.3) 13 (3.2) 20 (4.2) 36 (4.9) 12 (3.2)
France 53 (4.6) 26 (3.2) 32 (3.9) 15 (3.1) 11 (2.3) 14 (2.7) 12 (2.6) 2 (1.0)
Germany 51 (3.1) 38 (2.8) 57 (3.2) 47 (3.3) 14 (2.3) 14 (2.3) 25 (3.1) 2 (1.0)
Greece 69 (4.0) 48 (4.8) 47 (5.4) 49 (5.2) 16 (3.9) r 16 (3.4) 36 (4.7) 10 (2.5)
Hong Kong, SAR 64 (4.2) 35 (4.3) 54 (4.3) 31 (3.8) 7 (2.1) 10 (2.6) 15 (3.3) 10 (2.7)
Hungary 91 (2.4) 81 (3.3) 79 (3.7) 68 (3.7) 10 (2.6) 23 (3.5) 38 (4.1) 5 (2.0)
Iceland 54 (0.4) 47 (0.4) 52 (0.4) 45 (0.4) r 9 (0.2) 26 (0.4) 33 (0.4) r 9 (0.2)
Iran, Islamic Rep. of 39 (3.7) 31 (4.0) 50 (4.0) 23 (3.3) 19 (3.2) 18 (3.2) 23 (3.1) 7 (2.0)
Israel 32 (3.8) 41 (5.2) 37 (4.4) r 8 (2.3) 16 (3.2) 28 (4.2) 19 (3.3) 16 (3.2)
Italy 86 (2.5) 61 (3.7) 34 (2.9) 35 (3.3) 19 (2.5) 18 (2.7) 27 (3.5) 23 (3.3)
Kuwait 84 (2.9) 59 (4.2) 69 (3.8) 37 (4.2) 36 (4.0) 29 (3.9) 35 (3.8) 16 (3.4)
Latvia 74 (3.5) 63 (4.2) 82 (3.5) 61 (4.7) 12 (2.8) 33 (4.4) 37 (4.4) 20 (3.7)
Lithuania 85 (3.1) 65 (3.7) 78 (3.6) 68 (4.2) 17 (3.4) 36 (4.1) 39 (4.2) 32 (4.4)
Macedonia, Rep. of 80 (3.6) 82 (3.3) 81 (3.8) 78 (3.8) 36 (4.2) 42 (4.3) 50 (4.6) r 21 (3.8)
Moldova, Rep. of 77 (3.9) 62 (4.3) 81 (3.1) 63 (4.4) 27 (4.0) 44 (4.8) 49 (4.7) 33 (4.2)
Morocco 87 (3.7) 67 (5.2) r 41 (5.2) r 45 (5.5) r 29 (5.1) r 26 (4.7) r 30 (5.4) 36 (4.6)
Netherlands 47 (4.2) 24 (4.2) 45 (4.5) 21 (3.7) 16 (3.0) 23 (4.0) 27 (4.1) 10 (2.7)
New Zealand 65 (4.4) 54 (4.3) 59 (4.5) 24 (4.2) 17 (2.8) 36 (4.7) 37 (4.2) 11 (2.6)
Norway 74 (3.4) 67 (4.0) 73 (3.9) 34 (4.2) 25 (3.8) 37 (4.0) 56 (4.3) 31 (3.8)
Romania 94 (1.9) 92 (2.6) 90 (2.5) 81 (3.4) 62 (4.1) 54 (4.5) 79 (3.7) 21 (3.4)
Russian Federation 90 (1.8) 80 (3.8) 93 (1.7) 78 (3.2) 9 (2.3) 49 (3.3) 51 (3.4) 5 (1.2)
Scotland 83 (4.0) 53 (5.5) 52 (5.3) 52 (5.0) 11 (3.4) 26 (4.9) 54 (5.2) 11 (3.4)
Singapore 82 (3.2) 45 (3.8) 65 (4.0) 33 (3.5) 7 (2.3) 20 (3.3) 33 (4.2) 5 (1.8)
Slovak Republic 88 (2.9) 82 (2.8) 69 (3.8) 63 (4.0) 9 (2.5) 45 (4.3) 22 (3.7) 9 (2.6)
Slovenia 71 (4.2) 48 (4.1) 45 (4.4) 50 (4.2) 10 (2.5) 18 (3.3) 19 (3.0) 12 (2.3)
Sweden 79 (2.4) 67 (2.7) 46 (3.6) 37 (3.4) 9 (2.0) 24 (3.1) 45 (3.4) 13 (2.5)
Turkey 44 (5.1) 33 (4.3) 63 (4.5) 48 (4.4) 8 (2.6) 29 (4.5) 32 (4.7) 16 (3.3)
United States 70 (3.6) 60 (3.6) 60 (3.7) 25 (4.0) 27 (4.2) 37 (4.0) 47 (4.2) 11 (2.9)
International Avg. 71 (0.6) 55 (0.7) 59 (0.7) 46 (0.7) 19 (0.6) 28 (0.7) 35 (0.7) 16 (0.5)
ReadingTheory
Children'sLanguage
Development
SpecialEducation
Percentage of Students Whose Teachers Studied as an Area of Emphasis
CountriesLanguage Literature
Pedagogy/TeachingReading
Psychology RemedialReading
Background data provided by teachers.
( ) Standard errors appear in parentheses. Because results are rounded to the nearest wholenumber, some totals may appear inconsistent.
An “r” indicates data are available for 70-84% of the students. An “s” indicates data are avail-able for 50-69% of the students. An “x” indicates data are available for less than 50% of thestudents.
A dash (–) indicates data are not available. A tilde (~) indicates insufficient data to reportachievement.
ISC 4th GradePIRLS 2001

[174]
internationally, the majority of students in the PIRLS countries had teacherswith some specialized training in language (71%), literature (55%), and readingpedagogy (59%).
What Instructional Resources Do Teachers Use?
Exhibits 6.6 and 6.7 contain reports from principals or school heads about thetypes of materials forming the basis of their schools’ instructional program inreading and the types used as supplements. On average, internationally, schoolprincipals reported students primarily had reading series (49%) and textbooks(75%) as the basis of their reading instructional programs. In several coun-tries, most fourth-grade students (85% or more) had a reading series as thebasis of their reading instructional program in the Czech Republic, Iceland,and Scotland. In comparison, however, the textbook was used more frequentlyin quite a few countries. Most students (85% or more) had textbooks as thebasis of their reading instructional program in Bulgaria, Cyprus, the CzechRepublic, Germany, Greece, Hong Kong, Hungary, Iran, Italy, Kuwait, Latvia,Lithuania, Macedonia, Norway, Romania, the Russian Federation, Singapore,the Slovak Republic, and Turkey. Interestingly, it can be noted that in theCzech Republic most students had both a series and textbook as the basis oftheir reading instructional program. Several of the other countries using pre-dominantly textbooks supplemented their instructional programs with a readingseries for more than half the students, including Cyprus, Germany, Italy,Norway, Romania, Singapore, and Turkey (see Exhibit 6.7).
Schools seldom reported using a variety of children’s books as thebasis of many students’ reading programs, with the highest percentages inEngland (48%) and France (46%). However, 69 percent of students, on average,internationally, had a variety of children’s books as supplementary materi-als. Most students (85% or more) had children’s books as supplementary mate-rials in the Czech Republic, Germany, Hungary, Latvia, Lithuania, the RussianFederation, Singapore, the Slovak Republic, and Slovenia.
Children’s newspapers and magazines were used as supplementarymaterials for the majority of children, on average, internationally. The onlycountry to report much use of children’s newspapers and magazines as the
chapter 6: teachers and reading instruction

[175]chapter 6: teachers and reading instruction
basis of reading instruction was France (32%), but most programs relied onthese materials as supplements for about half of their students. The most sup-plementary use of children’s newspapers and magazines was in Slovenia (85%).
Reading across the curriculum was encouraged in a number of countries,but rarely formed the basis of reading instructional programs at the fourthgrade. School principals in Morocco reported that materials from differentcurricular areas formed the basis of the reading instructional program for 64percent of their students, but the next highest use was for 47 percent of stu-dents in France and 35 percent in Colombia. On average, internationally,however, 57 percent of students had materials from different curricular areasas supplements to their reading program. Supplementary use was pervasiveacross countries, with the most extensive use in Scotland (86%).
Exhibit 6.8 presents teachers’ reports about how often they used atextbook or a reading series in reading instruction and how often this wasaccompanied by workbooks and worksheets. On average, internationally,two-thirds of the students had daily reading instruction based on a textbookor reading series. Almost all students (95% or more) had such instruction inBulgaria, Cyprus, Greece, Hungary, Latvia, the Russian Federation, and theSlovak Republic. On average, internationally, workbooks were used on a dailybasis for about one-third of the students (32%) and on a weekly basis fornearly half the students (46%). The most popular instructional approach usedfor the majority of students (international average 53%) was daily instructionbased on a textbook or reading series, accompanied by at least weekly exercisesin workbooks or worksheets. As shown in Exhibit 6.9, teachers who reportedusing workbooks and worksheets reported using them less frequently for stu-dents with higher achievement in reading.
As shown in Exhibit 6.10, three-fourths of students (76%) were givenat least two of the following on a monthly basis to supplement their reading instructional program – children’s books, newspapers/magazines, com-puterized activities, or Internet assignments. Nearly all students in all coun-tries (international average 95%) had at least a monthly opportunity to readchildren’s books, and many (international average 72%) to read children’snewspapers and magazines. Although used hardly at all in some countries,

[176]
teachers reported at least monthly use of computerized reading instructionfor 63 to 64 percent of students in Singapore and the United States. Similarly,reading material on the Internet was infrequent in more than half the coun-tries. Monthly use for 50 percent or more of students was reported by Canada(O,Q) (54%), New Zealand (56%), and the United States (50%).
Since PIRLS 2001 assessed two major purposes for reading – literaryand informational, teachers were asked how often they asked their students toread fiction and nonfiction. The results for use of fiction are presented in Exhibit6.11 and for nonfiction in Exhibit 6.13. On average, internationally, the use offiction was much more widespread than the use of nonfiction. Fiction was beingused for reading instruction at least weekly for 84 percent of students com-pared to nonfiction for 56 percent of students. Exhibit 6.12 provides furtherdetail about the different types of fiction used for reading instruction. Onaverage, internationally, teachers reported asking about two-thirds of students(65%) to read stories on at least a weekly basis. Approximately one-third tohalf also were asked to read fables/fairy tales (45%), poems (41%), and longerbooks (31%). Countries reporting the lowest percentages of students readingfiction at least weekly were Greece (58%), Hong Kong (43%), and Kuwait (51%).
Nonfiction reading included descriptions and explanations about things,people or events; instruction or manuals about how things work; and charts,diagrams, and graphs. The countries where teachers reported asking the highestpercentages of students to read nonfiction on at least a weekly basis wereArgentina and the United States (both 88%), with Colombia, Germany, andItaly next (74 to 77%). Countries with the lowest percentages were the CzechRepublic, France, Hong Kong, Iceland, and the Slovak Republic (28 to 34%).
Exhibit 6.14 contains teachers’ reports about using films, videos, andtelevision in their reading instruction. On average, internationally, 43 percentof students were asked to watch a film version of a children’s book or story atleast monthly, 60 percent to watch movies, videos or television to obtaininformation, and 56 percent to compare material presented in different media.Watching movies of stories and to obtain information was especially prevalentfor students (90% or more) in Bulgaria, Macedonia, and Romania.
chapter 6: teachers and reading instruction

[177]chapter 6: teachers and reading instruction
Exhibit 6.6: Materials Schools Used as a Basis for Their Reading Instructional Programs
SOU
RCE:
IEA
Pro
gres
s in
Inte
rnat
iona
l Rea
ding
Lite
racy
Stu
dy (P
IRLS
) 200
1.
Argentina 52 (4.6) 63 (5.0) 40 (4.6) 17 (3.9) 26 (4.2)
Belize 74 (7.3) r 55 (7.0) 8 (4.5) 1 (0.9) r 10 (3.5)
Bulgaria 59 (3.8) 99 (0.6) 5 (1.7) 3 (1.4) 6 (1.9)
Canada (O,Q) 35 (3.5) 41 (3.2) 36 (3.3) 4 (1.6) 21 (3.3)
Colombia 45 (5.0) 52 (5.0) 28 (4.6) 21 (3.4) 35 (4.5)
Cyprus r 8 (3.0) 88 (2.4) 5 (2.2) 3 (1.9) 4 (2.1)
Czech Republic 85 (3.2) 90 (2.5) 4 (2.1) 0 (0.0) 0 (0.0)
England 53 (4.5) 28 (4.0) 48 (4.7) 5 (1.8) 21 (3.7)
France 44 (4.9) 53 (5.2) 46 (4.6) 32 (4.1) 47 (4.9)
Germany 9 (2.4) 93 (1.9) 3 (1.3) 0 (0.0) 17 (2.9)
Greece – – 95 (2.6) 1 (0.0) 0 (0.0) 2 (1.3)
Hong Kong, SAR 16 (3.1) 95 (1.8) 4 (1.9) 3 (1.5) 3 (1.3)
Hungary 70 (3.6) 86 (2.5) 1 (0.6) 1 (1.3) 1 (0.0)
Iceland r 88 (0.3) r 51 (0.4) r 13 (0.3) r 0 (0.1) r 3 (0.1)
Iran, Islamic Rep. of 23 (3.9) 89 (3.0) 8 (3.6) 3 (1.4) 11 (2.8)
Israel 48 (4.4) 74 (3.8) 29 (3.8) 12 (2.6) 28 (3.9)
Italy 8 (1.7) 91 (2.2) 5 (1.7) 2 (1.1) 12 (2.3)
Kuwait 17 (2.8) 97 (0.1) 13 (2.7) 12 (2.6) 9 (1.8)
Latvia 17 (3.0) 86 (2.8) 3 (1.4) 1 (0.9) 2 (1.3)
Lithuania 52 (4.2) 96 (1.6) 3 (1.5) 2 (1.2) 1 (1.0)
Macedonia, Rep. of 73 (4.0) 96 (1.6) 17 (3.4) 16 (3.6) 11 (2.4)
Moldova, Rep. of 72 (3.6) 81 (2.6) 6 (1.8) 2 (1.3) 11 (2.5)
Morocco 52 (5.0) 64 (5.0) 19 (4.0) 12 (3.3) 64 (4.9)
Netherlands 52 (5.1) 46 (4.8) 19 (3.9) 2 (1.0) 4 (1.7)
New Zealand 83 (3.2) 8 (2.3) 33 (4.1) 5 (1.9) 16 (2.8)
Norway 25 (3.9) 85 (3.8) 15 (4.3) 0 (0.0) 10 (3.8)
Romania 24 (3.6) 98 (1.1) 9 (2.5) 3 (1.2) 11 (3.0)
Russian Federation 56 (4.0) 96 (1.5) 1 (0.5) 1 (0.8) 3 (1.2)
Scotland 95 (2.1) 56 (5.5) 16 (3.5) 2 (1.4) 7 (2.5)
Singapore 22 (2.9) 97 (1.3) 2 (0.8) 2 (1.2) 6 (2.0)
Slovak Republic 65 (3.5) 91 (2.6) 6 (2.0) 6 (2.3) 2 (0.7)
Slovenia 81 (3.3) 73 (3.9) 7 (2.3) 1 (0.0) 1 (0.0)
Sweden 65 (4.3) 57 (3.9) 36 (4.8) 3 (1.6) 20 (3.6)
Turkey 11 (2.5) 98 (1.1) 4 (1.7) 1 (0.9) 3 (1.2)
United States 77 (3.6) 54 (3.8) 32 (4.4) 3 (1.5) 16 (2.8)
International Avg. 49 (0.7) 75 (0.6) 15 (0.5) 5 (0.3) 13 (0.5)
Children's Newspapersand/or Magazines
Materials fromDifferent Curricular
Areas
Percentage of Students Attending Schools That Used as a Basis
CountriesReading Series Textbooks Variety of Children’s
Books
Background data provided by schools.
( ) Standard errors appear in parentheses. Because results are rounded to the nearest wholenumber, some totals may appear inconsistent.
An “r” indicates data are available for 70-84% of the students. An “s” indicates data are avail-able for 50-69% of the students. An “x” indicates data are available for less than 50% of thestudents.
A dash (–) indicates data are not available. A tilde (~) indicates insufficient data to reportachievement.
ISC 4th GradePIRLS 2001

[178] chapter 6: teachers and reading instruction
Exhibit 6.7: Materials Schools Used as a Supplement to Their ReadingInstructional Programs
Argentina 30 (4.1) 28 (4.7) 49 (4.2) 69 (4.3) 52 (4.1)
Belize 14 (6.1) r 25 (6.9) 54 (7.6) 40 (5.6) r 45 (4.9)
Bulgaria 36 (3.7) 0 (0.0) 79 (3.3) 50 (4.4) 60 (4.0)
Canada (O,Q) 47 (3.6) 36 (3.1) 53 (3.7) 62 (3.1) 59 (3.7)
Colombia 16 (3.1) 31 (5.2) 39 (5.2) 44 (4.8) 37 (5.1)
Cyprus r 63 (5.8) 11 (2.4) 68 (5.3) 55 (4.8) 66 (4.2)
Czech Republic 12 (2.7) 8 (2.2) 90 (3.0) 64 (4.4) 61 (4.2)
England 34 (4.2) 59 (4.7) 46 (4.8) 49 (4.6) 69 (4.5)
France 39 (5.7) 32 (4.8) 41 (5.0) 48 (4.6) 41 (4.6)
Germany 69 (3.8) 3 (1.3) 86 (2.8) 55 (3.7) 57 (4.3)
Greece – – 2 (2.2) 51 (4.6) 23 (3.7) 56 (4.1)
Hong Kong, SAR 53 (4.7) 1 (0.9) 68 (4.0) 48 (4.1) 52 (4.4)
Hungary 20 (3.2) 9 (2.4) 86 (2.9) 50 (3.9) 52 (4.3)
Iceland r 7 (0.2) r 39 (0.4) r 77 (0.4) r 29 (0.4) r 69 (0.3)
Iran, Islamic Rep. of 34 (4.2) 5 (2.0) 54 (4.2) 53 (4.6) 46 (4.8)
Israel 37 (4.3) 24 (3.8) 61 (4.2) 49 (4.4) 58 (4.7)
Italy 64 (3.8) 3 (1.1) 78 (3.0) 39 (3.8) 54 (4.3)
Kuwait 44 (4.2) 1 (0.0) 57 (3.6) 56 (4.6) 35 (3.0)
Latvia 42 (4.5) 12 (2.9) 90 (2.1) 71 (4.2) 63 (4.4)
Lithuania 34 (4.2) 2 (1.2) 89 (2.4) 66 (3.7) 66 (3.6)
Macedonia, Rep. of 12 (2.9) 3 (1.4) 68 (4.1) 68 (4.3) 50 (4.2)
Moldova, Rep. of 19 (3.4) 15 (2.7) 74 (3.8) 58 (4.3) 52 (4.4)
Morocco 16 (4.3) 14 (3.6) 38 (5.4) 26 (4.7) 16 (4.0)
Netherlands 41 (5.1) 53 (4.9) 79 (4.0) 63 (4.8) 75 (4.1)
New Zealand 10 (2.8) 38 (4.5) 58 (4.2) 70 (4.2) 72 (3.5)
Norway 66 (4.7) 13 (3.6) 76 (4.9) 43 (5.1) 64 (5.1)
Romania 68 (4.2) 0 (0.0) 69 (3.6) 55 (4.7) 47 (4.8)
Russian Federation 41 (3.9) 4 (1.5) 97 (1.1) 71 (3.7) 70 (3.4)
Scotland 3 (1.5) 41 (5.3) 80 (3.6) 38 (5.1) 86 (3.6)
Singapore 60 (3.8) 2 (1.2) 89 (2.4) 69 (3.1) 59 (3.7)
Slovak Republic 13 (2.8) 8 (2.5) 87 (2.7) 75 (3.8) 59 (4.5)
Slovenia 13 (2.6) 19 (3.4) 88 (2.6) 85 (3.3) 64 (4.2)
Sweden 13 (2.9) 19 (3.6) 52 (4.9) 49 (4.8) 63 (4.8)
Turkey 61 (4.3) 2 (1.1) 73 (3.8) 31 (3.8) 40 (3.9)
United States 16 (3.1) 32 (3.9) 62 (5.0) 71 (4.1) 74 (4.2)
International Avg. 34 (0.7) 17 (0.5) 69 (0.7) 54 (0.7) 57 (0.7)
Children's Newspapersand/or Magazines
Materials fromDifferent Curricular
Areas
Percentage of Students Attending Schools That Used as a Supplement
CountriesReading Series Textbooks Variety of Children’s
Books
Background data provided by schools.
( ) Standard errors appear in parentheses. Because results are rounded to the nearest wholenumber, some totals may appear inconsistent.
An “r” indicates data are available for 70-84% of the students. An “s” indicates data are avail-able for 50-69% of the students. An “x” indicates data are available for less than 50% of thestudents.
A dash (–) indicates data are not available. A tilde (~) indicates insufficient data to reportachievement.
SOU
RCE:
IEA
Pro
gres
s in
Inte
rnat
iona
l Rea
ding
Lite
racy
Stu
dy (P
IRLS
) 200
1.
ISC 4th GradePIRLS 2001

[179]chapter 6: teachers and reading instruction
Exhibit 6.8: Teachers’ Use of Textbooks/Reading Series andWorkbooks/Worksheets for Reading Instruction
SOU
RCE:
IEA
Pro
gres
s in
Inte
rnat
iona
l Rea
ding
Lite
racy
Stu
dy (P
IRLS
) 200
1.
Argentina 57 (4.9) 36 (4.7) 7 (2.0) 20 (3.9) 48 (4.5) 32 (4.6) 12 (2.9) 42 (5.0)
Belize 69 (4.3) 29 (4.3) 2 (1.1) r 20 (5.6) 53 (5.5) 27 (4.3) 16 (4.9) 43 (4.8)
Bulgaria 97 (0.9) 3 (0.8) 1 (0.6) 53 (3.4) 23 (2.9) 24 (3.1) 52 (3.4) 73 (3.2)
Canada (O,Q) 41 (3.2) 35 (3.2) 23 (2.9) 29 (3.3) 48 (4.2) 24 (3.2) 19 (2.9) 36 (3.3)
Colombia 49 (4.4) 43 (4.3) 9 (2.2) 21 (3.5) 54 (5.3) 25 (4.8) 12 (3.0) 39 (4.7)
Cyprus 96 (1.8) 3 (1.6) 1 (0.7) 16 (3.9) 52 (5.3) 32 (4.9) 15 (3.8) 64 (5.2)
Czech Republic 68 (4.1) 30 (3.9) 2 (1.3) 19 (3.6) 36 (4.6) 45 (4.4) 18 (3.5) 43 (4.5)
England 43 (4.7) 41 (4.6) 16 (3.5) 23 (3.7) 57 (4.6) 20 (3.4) 14 (3.5) 37 (4.5)
France 28 (4.3) 52 (4.5) 20 (3.2) 15 (3.2) 58 (4.1) 27 (3.8) 9 (2.6) 25 (3.9)
Germany 43 (2.8) 44 (2.9) 13 (2.1) 49 (3.0) 42 (2.9) 9 (1.6) 26 (2.7) 39 (2.8)
Greece 95 (2.0) 2 (1.2) 3 (1.5) 24 (3.9) 52 (4.4) 24 (3.7) 22 (3.7) 69 (4.0)
Hong Kong, SAR 74 (3.9) 18 (3.4) 8 (2.1) 22 (4.1) 59 (4.5) 19 (3.2) 20 (3.9) 67 (3.8)
Hungary 99 (1.0) 1 (1.0) 0 (0.0) 87 (3.0) 12 (2.7) 1 (1.0) 84 (3.0) 95 (1.9)
Iceland 69 (0.4) 26 (0.3) 5 (0.2) 54 (0.4) 39 (0.4) 8 (0.2) 40 (0.3) 61 (0.4)
Iran, Islamic Rep. of 54 (3.5) 36 (3.2) 10 (2.3) 5 (1.6) 27 (3.4) 68 (3.8) 2 (1.0) 19 (2.9)
Israel 61 (4.6) 32 (4.2) 7 (2.5) 44 (4.4) 49 (4.6) 8 (2.5) 32 (4.1) 55 (4.6)
Italy 68 (3.7) 24 (3.2) 8 (1.7) 24 (2.9) 58 (3.3) 18 (2.9) 15 (2.8) 56 (4.0)
Kuwait 79 (2.4) 17 (2.6) 4 (1.3) 38 (3.9) 54 (4.1) 8 (1.9) 24 (3.0) 65 (2.6)
Latvia 95 (1.6) 5 (1.6) 0 (0.0) 57 (3.5) 32 (3.3) 11 (2.5) 56 (3.6) 85 (3.0)
Lithuania 93 (2.1) 7 (2.1) 0 (0.0) 83 (3.4) 13 (3.0) 4 (1.6) 80 (3.6) 89 (2.5)
Macedonia, Rep. of 85 (2.9) 13 (2.5) 3 (1.3) 14 (2.7) 65 (4.3) 22 (3.4) 12 (2.5) 68 (3.5)
Moldova, Rep. of 84 (2.9) 15 (2.7) 1 (0.9) 47 (4.7) 40 (4.6) 13 (2.5) 43 (4.5) 74 (3.4)
Morocco 63 (4.9) 17 (3.8) 20 (3.8) 27 (4.5) 53 (5.3) 20 (4.7) 15 (3.8) 47 (5.3)
Netherlands 22 (3.7) 55 (4.8) 24 (4.1) 14 (3.1) 59 (4.1) 28 (3.9) 8 (2.3) 14 (3.2)
New Zealand 43 (4.7) 35 (4.2) 21 (3.6) 10 (2.4) 57 (4.5) 33 (4.0) 8 (2.2) 32 (4.2)
Norway 63 (4.6) 34 (4.5) 3 (1.4) 27 (3.7) 66 (4.0) 8 (2.0) 22 (3.8) 61 (4.6)
Romania 86 (3.3) 13 (3.3) 0 (0.0) 43 (4.1) 41 (3.9) 15 (3.1) 37 (4.0) 74 (3.9)
Russian Federation 99 (0.7) 1 (0.5) 0 (0.0) 5 (1.8) 15 (2.9) 80 (3.6) 5 (1.8) 20 (3.6)
Scotland 67 (3.9) 32 (3.8) 1 (0.0) 29 (4.7) 60 (4.8) 11 (2.3) 27 (4.6) 60 (4.0)
Singapore 55 (4.2) 43 (4.1) 2 (1.1) 60 (3.6) 39 (3.5) 2 (0.9) 44 (4.1) 55 (4.2)
Slovak Republic 98 (1.2) 2 (1.2) 0 (0.0) 22 (3.3) 50 (4.2) 28 (3.7) 22 (3.3) 72 (3.7)
Slovenia 56 (4.4) 39 (4.5) 5 (1.5) 48 (4.4) 48 (4.5) 4 (1.6) 30 (4.3) 55 (4.5)
Sweden 27 (3.4) 31 (3.5) 42 (3.5) 16 (2.4) 50 (3.2) 34 (3.5) 6 (1.5) 19 (3.0)
Turkey 83 (3.2) 16 (3.2) 1 (0.6) 22 (3.4) 44 (4.4) 34 (4.5) 20 (3.5) 58 (4.7)
United States 57 (3.9) 20 (3.5) 23 (3.9) 29 (3.6) 56 (4.4) 14 (3.3) 25 (3.5) 55 (4.0)
International Avg. 68 (0.6) 24 (0.6) 8 (0.3) 32 (0.6) 46 (0.7) 22 (0.6) 25 (0.6) 53 (0.7)
Both Textbooksand Workbooks
Daily
Textbooks Dailyand Workbooksat Least Weekly
Percentage of Students Whose Teachers Used
Countries
Daily Weekly1-2 Timesa Monthor Less
Textbooks or a Reading Series Workbooks or Worksheets
Daily Weekly1-2 Timesa Monthor Less
Background data provided by teachers.
( ) Standard errors appear in parentheses. Because results are rounded to the nearest wholenumber, some totals may appear inconsistent.
An “r” indicates data are available for 70-84% of the students. An “s” indicates data are avail-able for 50-69% of the students. An “x” indicates data are available for less than 50% of thestudents.
A dash (–) indicates data are not available. A tilde (~) indicates insufficient data to reportachievement.
ISC 4th GradePIRLS 2001

[180] chapter 6: teachers and reading instruction
Exhibit 6.9: Teachers’ Use of Workbooks or Worksheets
Argentina 45 (4.9) 419 (10.0) 44 (5.0) 422 (10.2) 10 (3.2) 426 (11.9) 1 (0.0) ~ ~
Belize 32 (5.5) 324 (10.9) 66 (5.2) 321 (6.3) 2 (1.9) ~ ~ 0 (0.0) ~ ~
Bulgaria 19 (3.0) 550 (11.9) 57 (4.1) 555 (5.1) 21 (3.5) 538 (9.0) 4 (1.2) 548 (15.5)
Canada (O,Q) 16 (2.6) 543 (4.3) 65 (3.2) 545 (2.9) 16 (2.3) 544 (6.2) 2 (1.0) ~ ~
Colombia 50 (5.1) 415 (5.8) 41 (5.0) 430 (7.7) 6 (1.8) 452 (22.2) 3 (1.8) 394 (80.2)
Cyprus 25 (3.9) 496 (5.8) 57 (4.5) 496 (4.0) 16 (3.8) 487 (6.5) 2 (0.0) ~ ~
Czech Republic 81 (3.0) 537 (2.6) 18 (3.0) 536 (4.6) 1 (0.7) ~ ~ 0 (0.0) ~ ~
England 10 (2.7) 547 (10.1) 64 (4.4) 556 (5.2) 24 (4.0) 553 (5.2) 2 (1.2) ~ ~
France 11 (2.4) 511 (10.6) 70 (3.5) 526 (2.7) 18 (3.1) 530 (6.1) 1 (0.9) ~ ~
Germany 15 (2.4) 540 (5.8) 46 (2.7) 538 (2.8) 32 (3.0) 544 (3.6) 8 (1.6) 531 (6.6)
Greece 24 (3.8) 532 (9.2) 42 (4.8) 533 (5.6) 26 (4.2) 516 (6.6) 8 (2.9) 499 (9.7)
Hong Kong, SAR 25 (3.3) 530 (6.0) 50 (4.2) 530 (5.0) 23 (4.4) 527 (6.0) 3 (1.1) 502 (5.4)
Hungary 77 (3.5) 545 (2.4) 22 (3.3) 540 (7.0) 0 (0.1) ~ ~ 1 (0.9) ~ ~
Iceland 26 (0.3) 503 (2.3) 54 (0.4) 517 (1.8) 16 (0.3) 511 (3.7) 5 (0.2) 522 (5.3)
Iran, Islamic Rep. of 41 (3.6) 420 (8.2) 56 (3.5) 408 (5.2) 3 (1.2) 423 (13.3) 0 (0.0) ~ ~
Israel 64 (4.9) 504 (5.5) 30 (4.6) 513 (9.2) 5 (2.3) 525 (21.1) 1 (0.0) ~ ~
Italy 37 (3.6) 531 (4.5) 50 (3.8) 544 (3.4) 11 (2.2) 554 (6.1) 2 (1.2) ~ ~
Kuwait 31 (3.3) 397 (8.0) 49 (4.2) 408 (5.9) 16 (3.1) 392 (13.9) 4 (1.5) 363 (32.1)
Latvia 25 (3.5) 547 (4.3) 47 (3.8) 539 (3.4) 24 (3.6) 550 (6.1) 4 (1.6) 565 (7.9)
Lithuania 57 (4.3) 544 (3.8) 32 (4.0) 542 (5.0) 8 (2.4) 536 (9.8) 3 (1.5) 554 (15.5)
Macedonia, Rep. of 47 (4.3) 427 (7.9) 45 (4.4) 449 (8.3) 7 (2.2) 486 (19.6) 1 (0.8) ~ ~
Moldova, Rep. of 35 (3.9) 494 (6.6) 50 (3.5) 487 (5.8) 14 (2.9) 512 (10.9) 2 (1.0) ~ ~
Morocco 23 (4.8) 325 (16.9) 58 (5.4) 353 (11.1) 7 (2.5) 350 (28.6) 12 (3.7) 331 (19.8)
Netherlands 17 (3.1) 553 (5.0) 70 (3.8) 552 (3.3) 11 (3.0) 565 (5.6) 2 (1.2) ~ ~
New Zealand 22 (3.4) 514 (7.8) 52 (4.6) 537 (5.3) 21 (3.6) 516 (11.5) 6 (1.8) 557 (6.4)
Norway 17 (3.0) 500 (8.3) 54 (4.2) 496 (3.6) 24 (3.8) 509 (6.3) 5 (2.1) 480 (7.1)
Romania 63 (3.9) 508 (6.3) 34 (3.8) 520 (7.0) 3 (1.2) 494 (27.1) 0 (0.0) ~ ~
Russian Federation 2 (1.2) ~ ~ 33 (3.5) 525 (6.8) 48 (4.1) 529 (5.7) 17 (3.6) 536 (7.6)
Scotland 18 (3.9) 538 (10.1) 67 (4.5) 524 (4.4) 14 (2.8) 538 (9.6) 0 (0.5) ~ ~
Singapore 22 (3.4) 527 (9.5) 76 (3.7) 529 (5.9) 3 (1.2) 549 (20.3) 0 (0.0) ~ ~
Slovak Republic 49 (3.9) 520 (4.4) 37 (4.0) 519 (4.7) 13 (2.7) 519 (6.8) 1 (0.9) ~ ~
Slovenia 27 (3.4) 499 (3.4) 62 (3.5) 502 (2.6) 11 (2.5) 505 (8.7) 0 (0.0) ~ ~
Sweden 9 (2.0) 564 (6.7) 43 (3.7) 561 (3.5) 24 (2.8) 556 (4.7) 23 (3.2) 567 (3.5)
Turkey 39 (4.0) 454 (5.9) 61 (4.0) 447 (4.8) 0 (0.0) ~ ~ 1 (0.7) ~ ~
United States 28 (4.2) 522 (6.2) 62 (4.4) 553 (4.5) 7 (2.0) 532 (12.7) 3 (1.4) 540 (21.0)
International Avg. 32 (0.6) 496 (1.3) 50 (0.7) 502 (0.9) 14 (0.5) 509 (2.3) 4 (0.3) 499 (4.5)
Every Day or AlmostEvery Day Once or Twice a Week Once or Twice a Month Never or Almost Never
Percent ofStudents
AverageAchievement
CountriesPercent ofStudents
AverageAchievement
Percent ofStudents
AverageAchievement
Percent ofStudents
AverageAchievement
Background data provided by teachers.
( ) Standard errors appear in parentheses. Because results are rounded to the nearest wholenumber, some totals may appear inconsistent.
An “r” indicates data are available for 70-84% of the students. An “s” indicates data are avail-able for 50-69% of the students. An “x” indicates data are available for less than 50% of thestudents.
A dash (–) indicates data are not available. A tilde (~) indicates insufficient data to reportachievement.
SOU
RCE:
IEA
Pro
gres
s in
Inte
rnat
iona
l Rea
ding
Lite
racy
Stu
dy (P
IRLS
) 200
1.
ISC 4th GradePIRLS 2001

[181]chapter 6: teachers and reading instruction
Exhibit 6.10: Use of Materials for Reading Instruction Other Than Textbooks or aReading Series, Workbooks or Worksheets
SOU
RCE:
IEA
Pro
gres
s in
Inte
rnat
iona
l Rea
ding
Lite
racy
Stu
dy (P
IRLS
) 200
1.
Argentina 85 (3.7) 89 (3.8) 13 (3.2) 10 (2.7) 80 (4.5)
Belize r 93 (2.5) r 56 (4.9) r 1 (1.0) r 10 (4.1) r 52 (5.6)
Bulgaria 97 (0.7) 89 (2.8) 1 (0.9) 1 (0.0) 86 (2.8)
Canada (O,Q) 98 (0.9) 48 (3.2) 45 (3.3) 54 (3.3) 78 (2.8)
Colombia 97 (1.8) 84 (3.7) 9 (2.6) 2 (1.1) 83 (3.9)
Cyprus 96 (1.3) 71 (3.9) 7 (2.7) 22 (3.7) 70 (3.9)
Czech Republic 100 (0.0) 76 (3.8) 10 (2.9) 2 (0.4) 78 (3.7)
England 100 (0.0) 58 (4.1) 46 (4.4) 49 (5.4) 79 (3.5)
France 98 (0.9) 75 (3.4) 23 (3.4) 14 (2.5) 81 (3.3)
Germany 95 (1.3) 61 (3.2) 22 (2.9) 9 (1.9) 64 (3.3)
Greece 88 (3.4) 64 (4.6) 2 (1.2) 6 (2.7) 60 (4.4)
Hong Kong, SAR 90 (2.7) 61 (5.0) 37 (4.6) 29 (3.9) 66 (4.8)
Hungary 100 (0.1) 82 (3.2) 2 (1.2) 5 (2.1) 82 (3.3)
Iceland 98 (0.1) 35 (0.3) 38 (0.4) 24 (0.3) 65 (0.4)
Iran, Islamic Rep. of 74 (3.7) 70 (4.2) 1 (0.6) 2 (0.9) 54 (4.1)
Israel 94 (2.1) 82 (3.5) 30 (3.9) 37 (3.6) 83 (3.6)
Italy 97 (1.3) 67 (3.3) 12 (2.4) 11 (2.4) 69 (3.5)
Kuwait 93 (2.1) r 90 (1.8) r 9 (2.4) r 4 (1.7) r 86 (2.8)
Latvia 100 (0.0) 75 (4.0) 2 (1.2) 2 (1.2) 74 (4.2)
Lithuania 100 (0.0) 91 (2.5) 7 (2.3) 4 (1.7) 90 (2.7)
Macedonia, Rep. of 96 (1.7) 97 (1.2) r 6 (2.2) r 3 (1.6) r 90 (2.6)
Moldova, Rep. of 93 (2.8) 84 (3.3) 9 (3.2) 1 (0.9) 81 (3.6)
Morocco 64 (5.0) r 51 (5.3) r 4 (2.2) r 8 (2.9) r 43 (5.7)
Netherlands 96 (1.5) r 40 (4.8) r 30 (3.6) r 8 (2.6) r 56 (4.6)
New Zealand 100 (0.1) 75 (4.1) 49 (4.7) 56 (4.2) 89 (2.8)
Norway 97 (1.3) 54 (3.9) 28 (3.7) 19 (2.9) 67 (3.9)
Romania 100 (0.1) 87 (2.3) 2 (1.1) 3 (1.4) 86 (2.5)
Russian Federation 100 (0.0) 91 (1.9) 1 (0.6) 1 (0.7) 90 (1.8)
Scotland 98 (1.4) 28 (4.3) 44 (5.0) 18 (3.5) 64 (4.4)
Singapore 92 (2.1) 71 (3.8) 64 (3.6) 44 (4.2) 85 (2.6)
Slovak Republic 100 (0.0) 96 (1.7) 0 (0.0) 0 (0.0) 96 (1.8)
Slovenia 99 (0.7) 90 (2.6) 24 (3.6) 12 (2.9) 90 (2.7)
Sweden 98 (0.7) 73 (2.9) 44 (3.2) 35 (3.4) 82 (2.7)
Turkey 98 (1.1) 77 (3.7) 12 (2.6) 4 (1.4) 76 (4.0)
United States 99 (0.6) 77 (4.2) 63 (3.9) 50 (4.7) 91 (1.8)
International Avg. 95 (0.3) 72 (0.6) 20 (0.5) 16 (0.5) 76 (0.6)
Percentage of Students Whose Teachers Used at Least Monthly
Countries A Variety ofChildren's
Books
Children'sNewspapers and/or
Magazines
ComputerSoftware for
Reading Instruction
Reading Materialon the Internet
Two or More ofthe Previous
SupplementaryMaterials
Background data provided by teachers.
( ) Standard errors appear in parentheses. Because results are rounded to the nearest wholenumber, some totals may appear inconsistent.
An “r” indicates data are available for 70-84% of the students. An “s” indicates data are avail-able for 50-69% of the students. An “x” indicates data are available for less than 50% of thestudents.
A dash (–) indicates data are not available. A tilde (~) indicates insufficient data to reportachievement.
ISC 4th GradePIRLS 2001

[182] chapter 6: teachers and reading instruction
Exhibit 6.11: Teachers’ Use of Fiction for Reading Instruction
Argentina r 78 (4.4) 420 (7.3) 22 (4.4) 431 (16.7)
Belize r 89 (3.1) 323 (7.6) 11 (3.1) 320 (21.7)
Bulgaria 91 (2.5) 553 (3.9) 9 (2.5) 530 (16.0)
Canada (O,Q) 75 (2.5) 547 (2.6) 25 (2.5) 537 (3.7)
Colombia 91 (2.4) 426 (4.5) 9 (2.4) 391 (19.5)
Cyprus 86 (3.4) 496 (3.2) 14 (3.4) 479 (6.5)
Czech Republic 79 (3.6) 539 (2.7) 21 (3.6) 531 (4.9)
England 80 (3.9) 554 (4.4) 20 (3.9) 554 (7.3)
France 78 (3.7) 525 (3.0) 22 (3.7) 524 (6.2)
Germany 68 (3.1) 541 (2.5) 32 (3.1) 536 (3.1)
Greece 58 (4.7) 531 (6.1) 42 (4.7) 515 (4.9)
Hong Kong, SAR 43 (4.2) 531 (5.4) 57 (4.2) 526 (3.9)
Hungary 98 (1.1) 545 (2.2) 2 (1.1) ~ ~
Iceland 92 (0.2) 513 (1.3) 8 (0.2) 514 (4.2)
Iran, Islamic Rep. of 70 (3.3) 416 (5.8) 30 (3.3) 411 (8.0)
Israel 89 (3.0) 508 (4.1) 11 (3.0) 483 (17.3)
Italy 96 (1.5) 542 (2.5) 4 (1.5) 534 (5.5)
Kuwait r 51 (4.4) 401 (7.1) 49 (4.4) 397 (6.0)
Latvia 96 (1.7) 546 (2.4) 4 (1.7) 533 (14.3)
Lithuania 95 (1.7) 543 (2.7) 5 (1.7) 552 (15.6)
Macedonia, Rep. of 80 (3.2) 444 (5.4) 20 (3.2) 446 (12.4)
Moldova, Rep. of 99 (0.7) 493 (4.1) 1 (0.7) ~ ~
Morocco 66 (5.0) 339 (9.7) 34 (5.0) 357 (18.2)
Netherlands r 81 (3.7) 555 (2.9) 19 (3.7) 553 (5.2)
New Zealand 93 (2.2) 530 (4.1) 7 (2.2) 523 (13.7)
Norway 91 (2.1) 500 (3.3) 9 (2.1) 497 (8.9)
Romania 98 (1.0) 512 (4.5) 2 (1.0) ~ ~
Russian Federation 99 (0.8) 527 (4.6) 1 (0.8) ~ ~
Scotland 90 (2.9) 528 (4.1) 10 (2.9) 545 (10.3)
Singapore 72 (3.5) 522 (6.5) 28 (3.5) 544 (9.8)
Slovak Republic 89 (2.5) 519 (3.1) 11 (2.5) 508 (7.5)
Slovenia 90 (2.5) 501 (2.1) 10 (2.5) 503 (8.7)
Sweden 96 (1.3) 562 (2.3) 4 (1.3) 544 (9.1)
Turkey 96 (1.4) 450 (3.7) 4 (1.4) 473 (15.2)
United States 94 (3.0) 542 (3.9) 6 (3.0) 544 (12.1)
International Avg. 84 (0.5) 501 (0.8) 16 (0.5) 495 (2.1)
At Least WeeklyCountries
Percentage of Students Whose TeachersAsked Them to Read Fiction*
Less than Weekly
Percent ofStudents
AverageAchievement
Percent ofStudents
AverageAchievement
( ) Standard errors appear in parentheses. Because results are rounded to the nearest wholenumber, some totals may appear inconsistent.
An “r” indicates data are available for 70-84% of the students. An “s” indicates data are avail-able for 50-69% of the students. An “x” indicates data are available for less than 50% of thestudents.
A dash (–) indicates data are not available. A tilde (~) indicates insufficient data to reportachievement.
SOU
RCE:
IEA
Pro
gres
s in
Inte
rnat
iona
l Rea
ding
Lite
racy
Stu
dy (P
IRLS
) 200
1.
ISC 4th GradePIRLS 2001
*Based on teachers’ responses to having students read the following types oftext when having reading instruction and/or doing reading activities: fablesand fairy tales; stories; longer books with chapters; poems; and plays (seeExhibit 6.12 for details on each text type). Response options Every day oralmost every day and Once or twice a week were combined as At least
weekly. Response options Once or twice a month and Never or almost neverwere combined as Less than weekly.

[183]chapter 6: teachers and reading instruction
Exhibit 6.12: Types of Fiction Used for Reading Instruction
SOU
RCE:
IEA
Pro
gres
s in
Inte
rnat
iona
l Rea
ding
Lite
racy
Stu
dy (P
IRLS
) 200
1.
Argentina 57 (4.9) 59 (4.9) r 7 (2.4) 37 (4.2) r 7 (2.3)
Belize r 73 (5.5) r 70 (5.9) r 13 (4.1) 53 (6.6) r 20 (5.5)
Bulgaria 74 (3.7) 85 (3.1) 22 (3.4) 58 (3.9) 2 (1.0)
Canada (O,Q) 16 (2.4) 65 (2.8) 57 (3.1) 12 (2.2) 3 (1.2)
Colombia 84 (3.5) 42 (4.3) 15 (3.2) 47 (4.8) 11 (2.8)
Cyprus 71 (3.8) 66 (4.9) 14 (3.8) 48 (5.0) 6 (2.3)
Czech Republic 41 (4.4) 62 (4.0) 38 (4.2) 23 (3.4) 13 (3.2)
England 11 (3.4) 72 (4.6) 56 (4.6) 29 (4.2) 12 (3.2)
France 18 (2.7) 44 (3.9) 45 (4.3) 35 (3.7) 7 (1.8)
Germany 9 (1.7) 64 (3.0) 13 (1.9) 12 (2.0) 3 (1.2)
Greece 27 (3.7) 42 (4.2) 7 (1.8) 27 (4.0) 3 (1.5)
Hong Kong, SAR 37 (4.3) 26 (4.0) 8 (2.5) 12 (2.9) 3 (1.6)
Hungary 73 (3.7) 91 (2.2) 20 (2.9) 51 (4.0) 1 (0.6)
Iceland 24 (0.3) 77 (0.4) 62 (0.4) 60 (0.4) 5 (0.2)
Iran, Islamic Rep. of 45 (4.3) 22 (3.2) 17 (2.7) 50 (4.3) 8 (1.9)
Israel 61 (5.0) 76 (4.1) 35 (4.1) 43 (4.9) 12 (2.9)
Italy 50 (3.7) 94 (1.9) 25 (3.5) 37 (3.7) 2 (1.2)
Kuwait r 19 (3.8) r 29 (4.1) r 6 (2.3) r 30 (3.8) r 9 (2.1)
Latvia 54 (3.5) 93 (2.3) 32 (4.0) 53 (4.2) 3 (1.5)
Lithuania 69 (4.1) 77 (3.8) 21 (3.8) 64 (4.0) 11 (2.6)
Macedonia, Rep. of 59 (4.2) 40 (4.3) 8 (2.5) 61 (3.8) 27 (4.0)
Moldova, Rep. of 73 (3.8) 82 (3.2) 19 (3.9) 87 (2.9) 19 (3.8)
Morocco 28 (5.2) 17 (4.6) r 20 (4.8) 53 (4.9) r 6 (2.6)
Netherlands 8 (2.5) r 51 (5.0) r 76 (3.9) 12 (2.8) r 0 (0.0)
New Zealand 22 (3.3) 88 (2.9) 63 (4.2) 54 (4.3) 21 (3.6)
Norway 29 (3.9) 78 (3.5) 52 (4.0) 33 (4.0) 3 (1.3)
Romania 78 (3.5) 74 (3.8) 7 (2.1) 75 (3.5) 5 (1.9)
Russian Federation 44 (2.9) 99 (0.7) 45 (3.5) 66 (3.2) 5 (1.6)
Scotland 10 (3.1) 77 (4.1) 72 (4.5) 21 (4.7) 1 (0.0)
Singapore 49 (4.1) 58 (3.9) 20 (3.1) 26 (3.6) 5 (1.7)
Slovak Republic 65 (3.6) 53 (3.6) 14 (3.2) 63 (4.1) 1 (0.5)
Slovenia 86 (3.1) 69 (3.8) 11 (2.6) 29 (3.8) 14 (3.0)
Sweden 28 (3.1) 80 (2.9) 90 (1.8) 4 (1.6) 2 (0.7)
Turkey 71 (3.4) 60 (4.3) 13 (2.9) 64 (4.0) 23 (3.3)
United States 22 (3.9) 88 (3.3) 74 (4.8) 22 (4.0) 6 (2.2)
International Avg. 45 (0.6) 65 (0.6) 31 (0.6) 41 (0.7) 8 (0.4)
Plays
Percentage of Students Whose TeachersAsked Them to Read at Least Weekly
CountriesFables andFairy Tales Stories Longer Books
with Chapters Poems
Background data provided by teachers.
( ) Standard errors appear in parentheses. Because results are rounded to the nearest wholenumber, some totals may appear inconsistent.
An “r” indicates data are available for 70-84% of the students. An “s” indicates data are avail-able for 50-69% of the students. An “x” indicates data are available for less than 50% of thestudents.
A dash (–) indicates data are not available. A tilde (~) indicates insufficient data to reportachievement.
ISC 4th GradePIRLS 2001

[184] chapter 6: teachers and reading instruction
Exhibit 6.13: Use of Nonfiction for Reading Instruction
Argentina 88 (3.3) 421 (7.4) 12 (3.3) 435 (14.7)
Belize r 69 (6.4) 313 (6.7) 31 (6.4) 348 (12.8)
Bulgaria 37 (3.9) 554 (6.6) 63 (3.9) 549 (5.6)
Canada (O,Q) 60 (3.0) 547 (2.9) 40 (3.0) 541 (3.3)
Colombia 75 (3.6) 422 (4.8) 25 (3.6) 424 (13.4)
Cyprus 65 (4.8) 497 (4.0) 35 (4.8) 490 (4.6)
Czech Republic 31 (4.0) 545 (4.4) 69 (4.0) 533 (2.7)
England 56 (5.1) 552 (5.8) 44 (5.1) 557 (4.9)
France 34 (4.1) 525 (3.9) 66 (4.1) 525 (3.2)
Germany 74 (2.7) 542 (2.5) 26 (2.7) 534 (3.0)
Greece 46 (5.0) 528 (5.6) 54 (5.0) 524 (5.3)
Hong Kong, SAR 28 (3.8) 531 (5.9) 72 (3.8) 527 (3.9)
Hungary 59 (4.1) 547 (2.8) 41 (4.1) 540 (3.9)
Iceland 30 (0.4) 509 (2.1) 70 (0.4) 514 (1.5)
Iran, Islamic Rep. of 49 (3.7) 412 (7.5) 51 (3.7) 415 (4.7)
Israel 49 (3.9) 520 (5.7) 51 (3.9) 490 (6.3)
Italy 77 (3.1) 542 (2.6) 23 (3.1) 538 (5.9)
Kuwait r 46 (3.8) 402 (6.9) 54 (3.8) 396 (6.0)
Latvia 36 (4.8) 544 (3.8) 64 (4.8) 546 (3.5)
Lithuania 52 (4.3) 546 (3.9) 48 (4.3) 541 (3.8)
Macedonia, Rep. of 64 (4.6) 444 (7.6) 36 (4.6) 445 (8.7)
Moldova, Rep. of 64 (4.0) 493 (5.5) 36 (4.0) 493 (6.1)
Morocco 40 (5.3) 326 (12.3) 60 (5.3) 355 (12.6)
Netherlands 53 (4.6) 557 (3.2) 47 (4.6) 550 (4.5)
New Zealand 62 (4.2) 531 (4.9) 38 (4.2) 524 (7.1)
Norway 60 (4.5) 503 (3.9) 40 (4.5) 494 (4.3)
Romania 58 (4.3) 513 (5.9) 42 (4.3) 511 (7.2)
Russian Federation 51 (3.2) 538 (4.0) 49 (3.2) 518 (7.3)
Scotland 69 (4.2) 527 (4.5) 31 (4.2) 533 (6.8)
Singapore 59 (4.0) 524 (7.8) 41 (4.0) 535 (7.7)
Slovak Republic 32 (3.7) 523 (4.4) 68 (3.7) 515 (4.2)
Slovenia 58 (4.1) 499 (2.8) 42 (4.1) 505 (2.8)
Sweden 68 (3.2) 560 (3.2) 32 (3.2) 564 (2.3)
Turkey 58 (4.9) 455 (5.3) 42 (4.9) 444 (6.3)
United States 88 (3.1) 539 (3.7) 12 (3.1) 566 (10.8)
International Avg. 56 (0.7) 501 (0.9) 44 (0.7) 501 (1.2)
Countries
Percentage of Students Whose TeachersAsked Them to Read Nonfiction*
Less than Weekly
Percent ofStudents
AverageAchievement
At Least Weekly
Percent ofStudents
AverageAchievement
( ) Standard errors appear in parentheses. Because results are rounded to the nearest wholenumber, some totals may appear inconsistent.
An “r” indicates data are available for 70-84% of the students. An “s” indicates data are avail-able for 50-69% of the students. An “x” indicates data are available for less than 50% of thestudents.
A dash (–) indicates data are not available. A tilde (~) indicates insufficient data to reportachievement.
SOU
RCE:
IEA
Pro
gres
s in
Inte
rnat
iona
l Rea
ding
Lite
racy
Stu
dy (P
IRLS
) 200
1.
ISC 4th GradePIRLS 2001
*Based on teachers’ responses to having students read the following whenhaving reading instruction and/or doing reading activities: descriptions andexplanations about things, people, or events; instructions or manuals abouthow things work; and charts, diagrams, graphs. Response options Every dayor almost every day and Once or twice a week were combined as At least
weekly. Response options Once or twice a month and Never or almost neverwere combined as Less than weekly.

[185]chapter 6: teachers and reading instruction
Exhibit 6.14: Use of Films and Other Media for Reading Instruction
SOU
RCE:
IEA
Pro
gres
s in
Inte
rnat
iona
l Rea
ding
Lite
racy
Stu
dy (P
IRLS
) 200
1.
Argentina 53 (4.9) 53 (5.3) 67 (4.7)
Belize 20 (3.9) r 30 (5.1) r 39 (4.6)
Bulgaria 22 (3.3) 93 (1.8) 64 (3.8)
Canada (O,Q) 36 (3.9) 53 (3.7) 52 (3.4)
Colombia 46 (4.9) 77 (3.5) 69 (4.1)
Cyprus 25 (4.2) 49 (5.1) 61 (4.2)
Czech Republic 52 (4.4) 67 (4.0) 53 (4.6)
England 44 (4.8) 74 (4.0) 65 (4.7)
France 20 (2.7) 49 (3.5) 38 (3.6)
Germany 22 (2.5) 36 (3.2) 29 (2.6)
Greece 25 (4.5) 59 (4.7) 50 (4.4)
Hong Kong, SAR 80 (3.5) 67 (4.4) 54 (4.5)
Hungary 62 (3.7) 66 (3.4) 55 (3.7)
Iceland 29 (0.4) 48 (0.4) 15 (0.3)
Iran, Islamic Rep. of 78 (3.5) 78 (3.8) 65 (3.8)
Israel 54 (4.6) 57 (4.3) 56 (4.7)
Italy 32 (3.6) 51 (3.3) 44 (3.9)
Kuwait 58 (4.6) 57 (3.6) 75 (3.1)
Latvia 29 (4.4) 44 (4.7) 45 (5.1)
Lithuania 48 (4.1) 62 (4.1) 83 (3.2)
Macedonia, Rep. of 91 (2.4) 96 (1.7) 94 (2.1)
Moldova, Rep. of 61 (4.2) 77 (3.6) 89 (2.4)
Morocco 20 (3.7) 47 (5.4) 33 (4.8)
Netherlands 18 (3.3) 69 (4.1) 25 (4.1)
New Zealand 38 (4.5) 62 (4.4) 61 (3.9)
Norway 47 (4.2) 51 (4.6) 33 (3.9)
Romania 94 (1.9) 92 (2.5) 88 (2.8)
Russian Federation 33 (3.5) 37 (3.4) 51 (3.3)
Scotland 19 (4.5) 67 (4.5) 49 (4.9)
Singapore 31 (3.9) 51 (3.7) 41 (3.7)
Slovak Republic 40 (3.6) 44 (4.1) 66 (3.8)
Slovenia 58 (4.3) 57 (4.0) 70 (4.0)
Sweden 37 (3.6) 78 (2.8) 45 (3.4)
Turkey 35 (4.4) 51 (4.1) 65 (4.1)
United States 58 (4.4) 63 (5.2) 66 (5.2)
International Avg. 43 (0.7) 60 (0.7) 56 (0.7)
Percentage of Students Whose Teachers Reported At Least Monthly
Countries Having StudentsWatch Film Versionsof Children's Books
or Stories
Having StudentsWatch Movies, Videos, or
Television to ObtainInformation
Having StudentsCompare Material
Presented inDifferent Media
Background data provided by teachers.
( ) Standard errors appear in parentheses. Because results are rounded to the nearest wholenumber, some totals may appear inconsistent.
An “r” indicates data are available for 70-84% of the students. An “s” indicates data are avail-able for 50-69% of the students. An “x” indicates data are available for less than 50% of thestudents.
A dash (–) indicates data are not available. A tilde (~) indicates insufficient data to reportachievement.
ISC 4th GradePIRLS 2001

[186]
How Often Do Students Read Aloud and Independently in Class?
This section primarily describes teachers’ and students’ reports about class-room activities related to actually reading, including teachers reading aloudto the class, students reading aloud to the class, and students doing inde-pendent reading.
Regarding instruction in two specific reading skills and strategies –decoding and vocabulary – teachers reported little emphasis on decodingbut considerable attention to vocabulary (see Exhibit 6.15). Presumablybecause these are older students who have by and large mastered decodingskills, on average, internationally, teachers reported daily attention to decod-ing for 23 percent of students and weekly attention for 30 percent of stu-dents. The largest percentages of students receiving daily attention were inHong Kong (53%) and Italy (46%). For vocabulary, on average, internation-ally, according to their teachers 72 percent of students were helped dailyand 24 percent weekly. In Bulgaria, Greece, Lithuania, and Moldova, teach-ers reported that almost all students (97 to 99 percent) received help dailywith vocabulary.
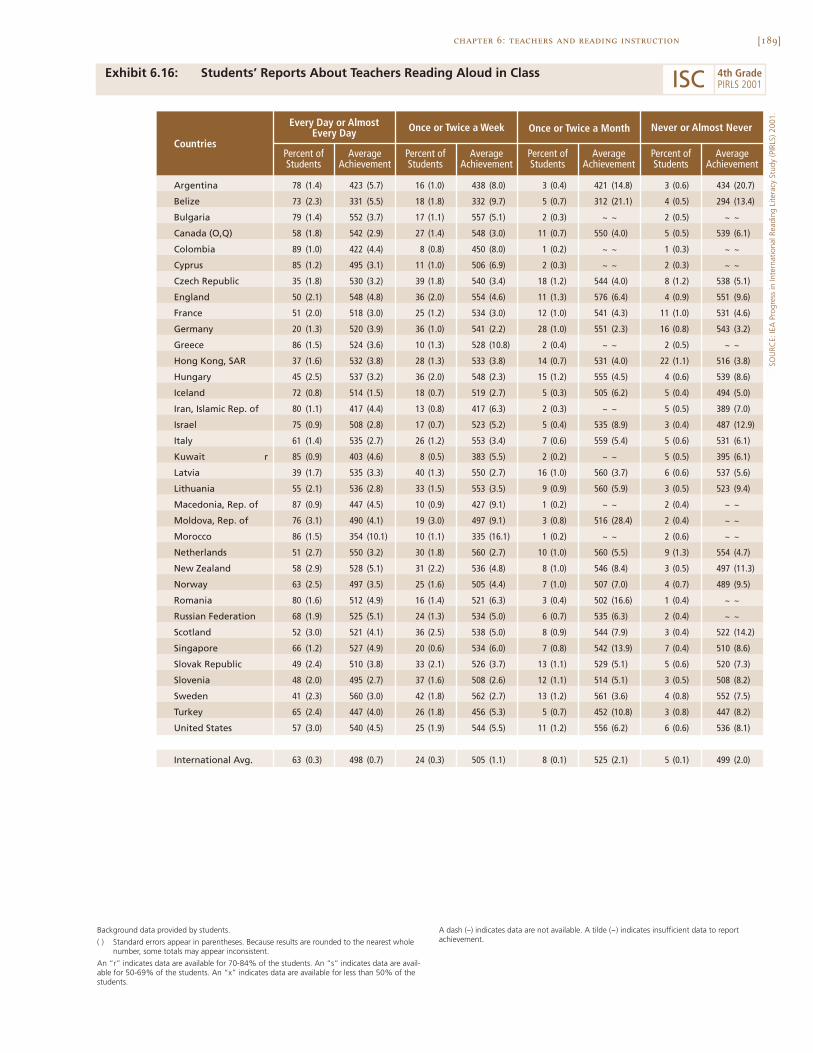
Exhibits 6.16, 6.17, and 6.18 provide students’ reports about how oftenteachers read aloud to the class, students read aloud in class, and studentsengaged in independent reading, respectively. On average, internationally,most students (63%) reported that their teachers read aloud on a daily basis,and about one in four (24%) on a weekly basis (Exhibit 6.16). Interestingly,the few students (8%) who reported being read to only on a monthly basishad the highest achievement.
As shown in Exhibit 6.17, students reported that they themselvesspend rather less time reading aloud in class than do their teachers – 23 percentreported reading aloud daily and 36 percent weekly, on average, across coun-tries. More than 40 percent of students reported reading aloud daily inArgentina, Colombia, Kuwait, Macedonia, Moldova, Morocco, and Romania.Similar to the results for teachers reading aloud, students with the highestachievement reported reading aloud on a monthly basis.
According to students’ reports (Exhibit 6.18), independent silentreading was a more frequent activity in fourth-grade classrooms than reading
chapter 6: teachers and reading instruction

[187]chapter 6: teachers and reading instruction
aloud (either by teachers or students). On average, internationally, two-thirdsof students (66%) reported reading silently on their own daily, and a further27 percent at least weekly. For independent reading compared to reading aloud,however, there was a reversal of the pattern of achievement in relation to fre-quency. The students with the highest reading achievement also reported themost frequent independent reading (daily). Presumably because they werebetter readers, teachers were able to allow them more time on their own.
To provide teachers’ perspectives on the frequency of oral and silentreading, Exhibit 6.19 shows teachers’ reports on how often they read aloudto the class themselves, had students read aloud to the whole class, had studentsread aloud in small groups or pairs, and had students read silently on theirown. On average, internationally, teachers reported that 61 percent of studentswere in classes where they (the teacher) read aloud daily and 31 percent weekly,which agreed well with the students’ reports presented in Exhibit 6.16.
Teachers reported more reading aloud by students in class than didthe students themselves. Teachers reported having 56 percent of students, onaverage, internationally, read aloud to the whole class on a daily basis (whereasthis was just 23 percent according to students). Additionally, teachers reportedthat 13 percent were reading aloud in small groups or pairs on a daily basisand 35 percent weekly.
Agreeing with students that independent silent reading was a frequentclassroom activity, teachers reported that 59 percent of students were in classeswhere silent reading was a daily occurrence.

[188] chapter 6: teachers and reading instruction
Exhibit 6.15: Emphasis on Decoding and Vocabulary
Argentina r 19 (3.9) 26 (4.7) 55 (4.9) 71 (5.0) 24 (4.7) 6 (2.7)
Belize 32 (6.1) 48 (5.6) 20 (4.7) 57 (6.2) 42 (6.2) 1 (0.7)
Bulgaria 41 (3.6) 44 (4.2) 15 (3.0) 97 (1.4) 3 (1.4) 0 (0.0)
Canada (O,Q) 17 (2.7) 42 (3.5) 41 (3.1) 57 (3.8) 39 (3.8) 4 (1.3)
Colombia 28 (3.6) 26 (3.4) 46 (4.5) 68 (4.0) 26 (3.8) 6 (2.0)
Cyprus 14 (3.5) 30 (5.0) 56 (5.1) 76 (4.6) 18 (4.0) 6 (2.3)
Czech Republic 3 (1.4) 12 (3.5) 85 (3.6) 80 (3.1) 18 (3.1) 2 (1.1)
England 24 (3.6) 51 (4.5) 25 (4.0) 54 (4.7) 42 (4.7) 4 (2.0)
France 5 (1.7) 15 (2.5) 79 (3.3) 65 (4.1) 25 (3.6) 9 (1.9)
Germany 13 (2.2) 21 (3.0) 65 (3.1) 57 (3.2) 29 (2.8) 14 (1.9)
Greece 20 (3.5) 16 (3.5) 65 (4.8) 99 (0.9) 1 (0.8) 0 (0.0)
Hong Kong, SAR 53 (4.3) 31 (3.6) 17 (3.4) 55 (4.6) 33 (4.2) 12 (3.1)
Hungary 28 (3.7) 24 (3.5) 48 (4.1) 88 (2.9) 10 (2.6) 1 (0.0)
Iceland 6 (0.2) 15 (0.3) 79 (0.3) 53 (0.4) 31 (0.4) 15 (0.3)
Iran, Islamic Rep. of 28 (3.6) 30 (3.7) 42 (3.8) 72 (3.9) 26 (3.7) 2 (1.4)
Israel 20 (3.5) 36 (4.8) 44 (5.0) 72 (3.9) 22 (3.4) 6 (2.3)
Italy 46 (4.1) 19 (3.1) 36 (3.4) 75 (3.4) 22 (3.3) 3 (1.1)
Kuwait r 28 (3.3) 21 (3.1) 51 (4.1) 86 (2.4) 11 (1.9) 3 (1.6)
Latvia 14 (3.2) 27 (3.9) 58 (4.2) 79 (4.0) 18 (3.8) 3 (1.3)
Lithuania – – – – – – 98 (1.2) 2 (1.2) 0 (0.0)
Macedonia, Rep. of 26 (4.3) 35 (4.4) 39 (3.8) 67 (3.5) 13 (2.7) 20 (3.1)
Moldova, Rep. of 18 (3.8) 32 (4.1) 51 (5.0) 97 (1.4) 3 (1.4) 0 (0.0)
Morocco r 38 (5.7) 18 (4.1) 44 (5.5) 87 (3.3) 11 (3.4) 1 (1.0)
Netherlands 3 (1.0) 29 (4.3) 67 (4.4) 54 (4.0) 37 (4.1) 9 (2.7)
New Zealand 36 (4.0) 44 (4.0) 20 (3.5) 57 (4.8) 38 (4.5) 5 (1.9)
Norway 1 (0.6) 24 (3.8) 75 (3.9) 46 (4.7) 40 (4.4) 14 (2.9)
Romania 29 (3.8) 29 (4.0) 42 (4.4) 91 (2.8) 8 (2.6) 1 (0.9)
Russian Federation 39 (3.8) 32 (3.4) 29 (3.0) 95 (2.3) 5 (2.1) 1 (0.0)
Scotland 28 (4.5) 51 (5.0) 21 (3.9) 53 (5.4) 47 (5.4) 0 (0.0)
Singapore 15 (2.7) 33 (4.1) 52 (4.5) 52 (4.3) 41 (4.4) 7 (2.0)
Slovak Republic 26 (3.5) 30 (3.8) 44 (4.3) 91 (2.3) 9 (2.3) 0 (0.0)
Slovenia 10 (2.3) 25 (3.6) 64 (4.0) 79 (3.7) 19 (3.5) 2 (1.3)
Sweden 2 (0.7) 13 (2.6) 86 (2.6) 51 (3.8) 37 (3.4) 12 (2.1)
Turkey 34 (3.9) 44 (4.2) 23 (3.5) 65 (4.7) 33 (4.7) 2 (1.2)
United States 29 (4.3) 45 (3.8) 26 (3.3) 61 (3.8) 37 (4.1) 1 (1.4)
International Avg. 23 (0.6) 30 (0.7) 47 (0.7) 72 (0.6) 24 (0.6) 5 (0.3)
Less thanWeeklyDaily Weekly
Percentage of Students Whose TeachersReported Various Reading Activities
Countries
Daily Weekly Less thanWeekly
Teach Strategies forDecoding Sounds and Words
Help Understand NewVocabulary in Texts
Background data provided by teachers.
( ) Standard errors appear in parentheses. Because results are rounded to the nearest wholenumber, some totals may appear inconsistent.
An “r” indicates data are available for 70-84% of the students. An “s” indicates data are avail-able for 50-69% of the students. An “x” indicates data are available for less than 50% of thestudents.
A dash (–) indicates data are not available. A tilde (~) indicates insufficient data to reportachievement.
SOU
RCE:
IEA
Pro
gres
s in
Inte
rnat
iona
l Rea
ding
Lite
racy
Stu
dy (P
IRLS
) 200
1.
ISC 4th GradePIRLS 2001
[189]chapter 6: teachers and reading instruction
Exhibit 6.16: Students’ Reports About Teachers Reading Aloud in Class
SOU
RCE:
IEA
Pro
gres
s in
Inte
rnat
iona
l Rea
ding
Lite
racy
Stu
dy (P
IRLS
) 200
1.
Argentina 78 (1.4) 423 (5.7) 16 (1.0) 438 (8.0) 3 (0.4) 421 (14.8) 3 (0.6) 434 (20.7)
Belize 73 (2.3) 331 (5.5) 18 (1.8) 332 (9.7) 5 (0.7) 312 (21.1) 4 (0.5) 294 (13.4)
Bulgaria 79 (1.4) 552 (3.7) 17 (1.1) 557 (5.1) 2 (0.3) ~ ~ 2 (0.5) ~ ~
Canada (O,Q) 58 (1.8) 542 (2.9) 27 (1.4) 548 (3.0) 11 (0.7) 550 (4.0) 5 (0.5) 539 (6.1)
Colombia 89 (1.0) 422 (4.4) 8 (0.8) 450 (8.0) 1 (0.2) ~ ~ 1 (0.3) ~ ~
Cyprus 85 (1.2) 495 (3.1) 11 (1.0) 506 (6.9) 2 (0.3) ~ ~ 2 (0.3) ~ ~
Czech Republic 35 (1.8) 530 (3.2) 39 (1.8) 540 (3.4) 18 (1.2) 544 (4.0) 8 (1.2) 538 (5.1)
England 50 (2.1) 548 (4.8) 36 (2.0) 554 (4.6) 11 (1.3) 576 (6.4) 4 (0.9) 551 (9.6)
France 51 (2.0) 518 (3.0) 25 (1.2) 534 (3.0) 12 (1.0) 541 (4.3) 11 (1.0) 531 (4.6)
Germany 20 (1.3) 520 (3.9) 36 (1.0) 541 (2.2) 28 (1.0) 551 (2.3) 16 (0.8) 543 (3.2)
Greece 86 (1.5) 524 (3.6) 10 (1.3) 528 (10.8) 2 (0.4) ~ ~ 2 (0.5) ~ ~
Hong Kong, SAR 37 (1.6) 532 (3.8) 28 (1.3) 533 (3.8) 14 (0.7) 531 (4.0) 22 (1.1) 516 (3.8)
Hungary 45 (2.5) 537 (3.2) 36 (2.0) 548 (2.3) 15 (1.2) 555 (4.5) 4 (0.6) 539 (8.6)
Iceland 72 (0.8) 514 (1.5) 18 (0.7) 519 (2.7) 5 (0.3) 505 (6.2) 5 (0.4) 494 (5.0)
Iran, Islamic Rep. of 80 (1.1) 417 (4.4) 13 (0.8) 417 (6.3) 2 (0.3) ~ ~ 5 (0.5) 389 (7.0)
Israel 75 (0.9) 508 (2.8) 17 (0.7) 523 (5.2) 5 (0.4) 535 (8.9) 3 (0.4) 487 (12.9)
Italy 61 (1.4) 535 (2.7) 26 (1.2) 553 (3.4) 7 (0.6) 559 (5.4) 5 (0.6) 531 (6.1)
Kuwait r 85 (0.9) 403 (4.6) 8 (0.5) 383 (5.5) 2 (0.2) ~ ~ 5 (0.5) 395 (6.1)
Latvia 39 (1.7) 535 (3.3) 40 (1.3) 550 (2.7) 16 (1.0) 560 (3.7) 6 (0.6) 537 (5.6)
Lithuania 55 (2.1) 536 (2.8) 33 (1.5) 553 (3.5) 9 (0.9) 560 (5.9) 3 (0.5) 523 (9.4)
Macedonia, Rep. of 87 (0.9) 447 (4.5) 10 (0.9) 427 (9.1) 1 (0.2) ~ ~ 2 (0.4) ~ ~
Moldova, Rep. of 76 (3.1) 490 (4.1) 19 (3.0) 497 (9.1) 3 (0.8) 516 (28.4) 2 (0.4) ~ ~
Morocco 86 (1.5) 354 (10.1) 10 (1.1) 335 (16.1) 1 (0.2) ~ ~ 2 (0.6) ~ ~
Netherlands 51 (2.7) 550 (3.2) 30 (1.8) 560 (2.7) 10 (1.0) 560 (5.5) 9 (1.3) 554 (4.7)
New Zealand 58 (2.9) 528 (5.1) 31 (2.2) 536 (4.8) 8 (1.0) 546 (8.4) 3 (0.5) 497 (11.3)
Norway 63 (2.5) 497 (3.5) 25 (1.6) 505 (4.4) 7 (1.0) 507 (7.0) 4 (0.7) 489 (9.5)
Romania 80 (1.6) 512 (4.9) 16 (1.4) 521 (6.3) 3 (0.4) 502 (16.6) 1 (0.4) ~ ~
Russian Federation 68 (1.9) 525 (5.1) 24 (1.3) 534 (5.0) 6 (0.7) 535 (6.3) 2 (0.4) ~ ~
Scotland 52 (3.0) 521 (4.1) 36 (2.5) 538 (5.0) 8 (0.9) 544 (7.9) 3 (0.4) 522 (14.2)
Singapore 66 (1.2) 527 (4.9) 20 (0.6) 534 (6.0) 7 (0.8) 542 (13.9) 7 (0.4) 510 (8.6)
Slovak Republic 49 (2.4) 510 (3.8) 33 (2.1) 526 (3.7) 13 (1.1) 529 (5.1) 5 (0.6) 520 (7.3)
Slovenia 48 (2.0) 495 (2.7) 37 (1.6) 508 (2.6) 12 (1.1) 514 (5.1) 3 (0.5) 508 (8.2)
Sweden 41 (2.3) 560 (3.0) 42 (1.8) 562 (2.7) 13 (1.2) 561 (3.6) 4 (0.8) 552 (7.5)
Turkey 65 (2.4) 447 (4.0) 26 (1.8) 456 (5.3) 5 (0.7) 452 (10.8) 3 (0.8) 447 (8.2)
United States 57 (3.0) 540 (4.5) 25 (1.9) 544 (5.5) 11 (1.2) 556 (6.2) 6 (0.6) 536 (8.1)
International Avg. 63 (0.3) 498 (0.7) 24 (0.3) 505 (1.1) 8 (0.1) 525 (2.1) 5 (0.1) 499 (2.0)
Once or Twice a Week Once or Twice a Month Never or Almost Never
Percent ofStudents
AverageAchievement
Every Day or AlmostEvery Day
CountriesPercent ofStudents
AverageAchievement
Percent ofStudents
AverageAchievement
Percent ofStudents
AverageAchievement
Background data provided by students.
( ) Standard errors appear in parentheses. Because results are rounded to the nearest wholenumber, some totals may appear inconsistent.
An “r” indicates data are available for 70-84% of the students. An “s” indicates data are avail-able for 50-69% of the students. An “x” indicates data are available for less than 50% of thestudents.
A dash (–) indicates data are not available. A tilde (~) indicates insufficient data to reportachievement.
ISC 4th GradePIRLS 2001

[190] chapter 6: teachers and reading instruction
Exhibit 6.17: Students’ Reports About Students Reading Aloud in Class*
Argentina 45 (1.7) 417 (6.6) 31 (1.1) 441 (5.7) 11 (0.9) 444 (11.0) 12 (1.3) 432 (12.4)
Belize 29 (1.6) 327 (6.3) 37 (1.4) 328 (6.6) 16 (0.9) 337 (8.8) 17 (1.3) 328 (8.7)
Bulgaria 34 (1.7) 546 (5.0) 42 (1.3) 559 (3.7) 17 (0.9) 554 (5.6) 7 (0.8) 547 (9.4)
Canada (O,Q) 9 (0.8) 517 (4.7) 30 (1.2) 546 (2.8) 21 (0.9) 549 (3.3) 40 (1.5) 548 (3.2)
Colombia 47 (2.5) 410 (5.0) 34 (1.8) 433 (6.0) 10 (0.7) 443 (7.6) 8 (0.9) 453 (7.2)
Cyprus 33 (1.4) 480 (3.9) 48 (1.3) 503 (3.4) 11 (0.8) 505 (5.2) 8 (0.6) 503 (6.8)
Czech Republic 17 (1.3) 526 (4.1) 39 (1.3) 539 (3.0) 33 (1.5) 540 (3.1) 10 (0.8) 544 (4.8)
England 4 (0.5) 485 (10.7) 29 (1.6) 554 (3.7) 26 (1.2) 561 (4.7) 41 (2.0) 554 (4.3)
France 13 (0.9) 494 (5.4) 35 (1.3) 521 (3.0) 25 (1.0) 538 (3.3) 27 (1.6) 537 (3.1)
Germany 7 (0.4) 511 (4.7) 25 (0.9) 534 (2.8) 23 (0.7) 546 (2.5) 45 (1.1) 545 (2.5)
Greece 30 (1.5) 504 (4.2) 42 (1.8) 529 (5.1) 16 (1.1) 550 (5.7) 11 (1.1) 538 (4.6)
Hong Kong, SAR 3 (0.3) 503 (9.2) 16 (0.8) 528 (5.1) 20 (1.0) 535 (3.7) 61 (1.4) 529 (3.0)
Hungary 17 (1.3) 531 (4.0) 38 (1.3) 545 (2.8) 19 (1.0) 547 (3.9) 27 (1.3) 549 (3.0)
Iceland 5 (0.3) 477 (5.5) 28 (0.7) 517 (2.3) 28 (0.7) 522 (2.7) 38 (0.8) 511 (2.2)
Iran, Islamic Rep. of 34 (1.4) 408 (4.0) 46 (1.6) 421 (5.7) 12 (1.0) 417 (7.5) 9 (0.7) 406 (7.5)
Israel 26 (1.2) 485 (4.3) 35 (1.0) 515 (3.7) 17 (0.8) 524 (5.2) 22 (1.0) 533 (5.1)
Italy 26 (1.2) 522 (3.5) 42 (1.1) 543 (2.8) 18 (0.9) 553 (3.3) 14 (0.9) 556 (4.4)
Kuwait r 41 (1.7) 405 (4.4) 40 (1.3) 402 (5.1) 12 (0.8) 396 (6.9) 8 (0.5) 386 (7.2)
Latvia 21 (1.2) 530 (4.0) 41 (1.4) 547 (3.0) 22 (1.2) 553 (2.9) 16 (1.3) 552 (3.9)
Lithuania 27 (1.4) 528 (4.2) 47 (1.2) 550 (2.9) 17 (1.0) 554 (4.4) 8 (0.7) 545 (6.0)
Macedonia, Rep. of 49 (1.8) 426 (5.4) 39 (1.5) 458 (5.2) 8 (0.7) 497 (6.4) 5 (0.5) 461 (12.9)
Moldova, Rep. of 42 (2.4) 488 (5.0) 42 (1.9) 499 (5.3) 11 (1.3) 488 (6.3) 5 (0.7) 494 (10.8)
Morocco 51 (2.8) 346 (9.5) 39 (2.3) 356 (10.2) 7 (1.2) 348 (17.9) 3 (0.5) 352 (18.1)
Netherlands 3 (0.4) 517 (8.7) 16 (0.9) 549 (4.1) 20 (1.0) 558 (3.1) 61 (1.4) 557 (2.6)
New Zealand 4 (0.5) 464 (9.2) 26 (1.6) 520 (5.0) 22 (1.2) 540 (5.8) 47 (1.7) 539 (4.1)
Norway 7 (0.9) 461 (5.7) 32 (1.9) 501 (4.5) 24 (1.2) 504 (4.5) 36 (2.6) 503 (4.0)
Romania 45 (2.1) 501 (5.5) 39 (1.6) 521 (5.2) 11 (1.0) 540 (7.6) 4 (0.6) 493 (12.0)
Russian Federation 31 (1.4) 518 (6.3) 43 (1.2) 531 (4.5) 19 (1.1) 541 (4.2) 7 (0.8) 534 (6.7)
Scotland 8 (1.2) 506 (8.8) 44 (2.3) 530 (4.3) 28 (1.8) 540 (4.6) 20 (1.6) 519 (6.4)
Singapore 8 (0.5) 485 (9.6) 26 (0.8) 520 (6.4) 21 (0.8) 538 (4.7) 44 (1.3) 538 (5.3)
Slovak Republic 33 (2.0) 499 (4.5) 42 (1.5) 525 (3.1) 18 (1.3) 536 (3.5) 7 (0.6) 535 (5.7)
Slovenia 17 (1.3) 474 (4.5) 41 (1.5) 502 (2.6) 24 (1.2) 513 (3.2) 18 (1.3) 517 (3.8)
Sweden 2 (0.3) ~ ~ 25 (1.5) 560 (3.4) 25 (1.1) 564 (3.0) 48 (2.1) 562 (2.4)
Turkey 29 (1.9) 440 (4.8) 42 (1.6) 454 (4.2) 18 (1.7) 459 (7.8) 11 (1.0) 449 (6.6)
United States 9 (0.7) 518 (8.4) 30 (1.2) 545 (4.8) 20 (0.8) 554 (5.4) 40 (1.5) 541 (4.6)
International Avg. 23 (0.2) 478 (1.1) 36 (0.2) 504 (0.8) 19 (0.2) 511 (1.0) 22 (0.2) 505 (1.2)
Once or Twice a Week Once or Twice a Month Never or Almost Never
Percent ofStudents
AverageAchievement
Every Day or AlmostEvery Day
CountriesPercent ofStudents
AverageAchievement
Percent ofStudents
AverageAchievement
Percent ofStudents
AverageAchievement
( ) Standard errors appear in parentheses. Because results are rounded to the nearest wholenumber, some totals may appear inconsistent.
An “r” indicates data are available for 70-84% of the students. An “s” indicates data are avail-able for 50-69% of the students. An “x” indicates data are available for less than 50% of thestudents.
A dash (–) indicates data are not available. A tilde (~) indicates insufficient data to reportachievement.
SOU
RCE:
IEA
Pro
gres
s in
Inte
rnat
iona
l Rea
ding
Lite
racy
Stu
dy (P
IRLS
) 200
1.
ISC 4th GradePIRLS 2001
*Based on students’ responses to how often they do the following: read aloudto the whole class; and read aloud to a small group of students in class.Average is computed based on a 4-point scale: Once or twice a month = 2,Once or twice a week = 3, and Every day or almost every day = 4. Never oralmost never indicates an average of 1 to less than 1.75, Once or twice a
month indicates an average of 1.75 through 2.5. Once or twice a week indi-cates an average of greater than 2.5 through 3.25. Every day or almost everyday indicates an average of greater than 3.25 through 4.

[191]chapter 6: teachers and reading instruction
Exhibit 6.18: Students’ Reports About Independent Reading*
SOU
RCE:
IEA
Pro
gres
s in
Inte
rnat
iona
l Rea
ding
Lite
racy
Stu
dy (P
IRLS
) 200
1.
Argentina 68 (1.2) 434 (5.6) 26 (0.9) 422 (6.7) 4 (0.4) 420 (12.1) 3 (0.4) 390 (17.2)
Belize 53 (1.9) 349 (6.2) 32 (1.7) 320 (7.0) 9 (0.5) 287 (7.1) 6 (0.6) 266 (11.6)
Bulgaria 69 (1.5) 560 (3.8) 26 (1.3) 546 (4.9) 3 (0.4) 498 (12.7) 2 (0.4) ~ ~
Canada (O,Q) 82 (0.8) 549 (2.4) 14 (0.7) 530 (4.3) 2 (0.2) ~ ~ 1 (0.1) ~ ~
Colombia 70 (1.7) 426 (5.3) 24 (1.6) 422 (5.4) 4 (0.5) 426 (9.7) 2 (0.3) ~ ~
Cyprus 66 (1.2) 504 (3.2) 28 (1.1) 487 (4.1) 4 (0.4) 456 (9.7) 2 (0.2) ~ ~
Czech Republic 51 (1.4) 539 (2.6) 36 (1.1) 535 (3.0) 8 (0.7) 541 (5.5) 5 (0.5) 532 (7.7)
England 83 (1.1) 558 (3.4) 14 (0.9) 535 (5.4) 1 (0.2) ~ ~ 1 (0.2) ~ ~
France 68 (1.1) 528 (2.7) 25 (1.0) 522 (3.1) 4 (0.3) 522 (7.7) 3 (0.3) 506 (10.0)
Germany 62 (0.7) 537 (1.9) 28 (0.6) 545 (2.8) 6 (0.3) 546 (4.4) 4 (0.3) 536 (6.3)
Greece 57 (1.7) 526 (4.2) 33 (1.3) 523 (4.2) 6 (0.6) 526 (8.1) 4 (0.6) 530 (7.4)
Hong Kong, SAR 45 (1.0) 538 (3.2) 42 (0.9) 527 (3.0) 9 (0.5) 507 (4.9) 4 (0.3) 493 (6.3)
Hungary 53 (1.5) 547 (2.2) 38 (1.4) 542 (2.9) 6 (0.5) 542 (6.7) 3 (0.4) 526 (7.7)
Iceland 74 (0.7) 517 (1.6) 20 (0.7) 508 (3.0) 4 (0.3) 502 (8.0) 3 (0.3) 482 (9.6)
Iran, Islamic Rep. of 54 (1.0) 428 (4.2) 35 (1.1) 406 (5.3) 7 (0.6) 383 (6.8) 3 (0.3) 370 (9.2)
Israel 70 (1.1) 525 (2.6) 24 (0.9) 493 (5.1) 4 (0.3) 468 (9.8) 3 (0.2) 442 (12.6)
Italy 57 (1.0) 546 (2.6) 31 (0.9) 537 (3.1) 7 (0.6) 534 (5.9) 5 (0.4) 526 (6.7)
Kuwait r 46 (1.4) 412 (3.6) 38 (1.1) 396 (5.2) 9 (0.6) 388 (7.9) 7 (0.5) 378 (9.9)
Latvia 68 (1.0) 547 (2.5) 26 (0.9) 544 (2.9) 3 (0.6) 535 (10.2) 2 (0.3) ~ ~
Lithuania 73 (1.0) 544 (2.8) 24 (1.0) 549 (3.6) 3 (0.3) 528 (9.9) 1 (0.2) ~ ~
Macedonia, Rep. of 73 (1.4) 453 (4.5) 23 (1.2) 431 (7.1) 3 (0.6) 409 (16.3) 2 (0.3) ~ ~
Moldova, Rep. of 78 (1.7) 497 (4.1) 19 (1.6) 484 (5.8) 2 (0.3) ~ ~ 1 (0.2) ~ ~
Morocco 34 (1.9) 357 (8.7) 47 (2.1) 342 (8.3) 13 (2.2) 351 (19.2) 7 (0.9) 346 (12.1)
Netherlands 68 (1.7) 556 (2.7) 26 (1.3) 555 (2.8) 3 (0.3) 540 (6.4) 3 (0.5) 537 (9.1)
New Zealand 86 (0.8) 538 (3.5) 12 (0.6) 497 (7.0) 1 (0.3) ~ ~ 1 (0.3) ~ ~
Norway 57 (1.6) 499 (3.3) 33 (1.4) 503 (3.5) 6 (0.5) 499 (8.2) 3 (0.4) 482 (8.6)
Romania 63 (1.4) 520 (4.6) 30 (1.3) 511 (6.8) 4 (0.5) 488 (12.3) 3 (0.4) 457 (15.1)
Russian Federation 69 (1.2) 531 (4.1) 25 (1.1) 525 (5.8) 3 (0.3) 520 (9.5) 2 (0.3) ~ ~
Scotland 71 (2.0) 533 (3.8) 23 (1.8) 527 (5.3) 3 (0.4) 494 (13.2) 2 (0.4) ~ ~
Singapore 78 (0.9) 543 (4.7) 18 (0.6) 493 (6.2) 3 (0.3) 441 (11.6) 2 (0.2) ~ ~
Slovak Republic 63 (1.5) 521 (3.1) 32 (1.2) 516 (3.7) 4 (0.4) 514 (7.2) 2 (0.3) ~ ~
Slovenia 76 (1.1) 507 (2.2) 21 (1.0) 491 (3.6) 2 (0.3) ~ ~ 1 (0.2) ~ ~
Sweden 74 (1.1) 562 (2.4) 23 (0.9) 559 (3.0) 2 (0.3) ~ ~ 1 (0.2) ~ ~
Turkey 71 (1.5) 459 (3.7) 24 (1.1) 437 (5.4) 3 (0.5) 396 (8.9) 2 (0.3) ~ ~
United States 84 (0.9) 549 (3.6) 14 (0.8) 518 (6.1) 2 (0.3) ~ ~ 1 (0.1) ~ ~
International Avg. 66 (0.2) 507 (0.6) 27 (0.2) 494 (0.8) 4 (0.1) 474 (1.8) 3 (0.1) 459 (2.3)
Every Day or AlmostEvery Day Once or Twice a Week Once or Twice a Month Never or Almost Never
CountriesPercent ofStudents
AverageAchievement
Percent ofStudents
AverageAchievement
Percent ofStudents
AverageAchievement
Percent ofStudents
AverageAchievement
( ) Standard errors appear in parentheses. Because results are rounded to the nearest wholenumber, some totals may appear inconsistent.
An “r” indicates data are available for 70-84% of the students. An “s” indicates data are avail-able for 50-69% of the students. An “x” indicates data are available for less than 50% of thestudents.
A dash (–) indicates data are not available. A tilde (~) indicates insufficient data to reportachievement.
ISC 4th GradePIRLS 2001
*Based on students’ responses to how often they did the following: readsilently on own; and read books of own choosing. Average is computed basedon 4-point scale: Never or almost never = 1, Once or twice a month = 2, Onceor twice a week = 3, and Every day or almost every day = 4. Never or almostnever indicates an average of 1 to less than 1.75. Once or twice a month
indicates an average of 1.75 through 2.5. Once or twice a week indicates anaverage response of greater than 2.5 through 3.25. Every day or almost everyday indicates an average of greater than 3.25 through 4.

[192] chapter 6: teachers and reading instruction
Exhibit 6.19: Teachers’ Reports About Reading Aloud or Silently in Class
Argentina 72 (4.6) 23 (4.6) 6 (2.4) 63 (4.6) 27 (4.4) 10 (3.3)
Belize 68 (5.3) 30 (5.2) 2 (0.9) 65 (4.5) 31 (4.1) 4 (2.3)
Bulgaria 84 (2.9) 14 (2.7) 2 (1.2) 88 (2.8) 12 (2.8) 0 (0.0)
Canada (O,Q) 66 (3.3) 26 (3.2) 8 (1.6) 39 (2.8) 40 (3.1) 21 (2.7)
Colombia 54 (4.6) 39 (4.4) 7 (2.3) 41 (5.0) 39 (4.5) 19 (3.8)
Cyprus 63 (5.1) 33 (4.6) 4 (2.2) 61 (5.0) 37 (5.1) 2 (0.8)
Czech Republic 34 (3.9) 40 (4.2) 26 (3.9) 77 (3.5) 21 (3.6) 2 (1.4)
England 72 (4.2) 27 (4.1) 2 (1.1) 40 (4.9) 42 (4.7) 18 (3.4)
France 49 (3.8) 34 (4.3) 17 (3.0) 70 (3.4) 27 (3.4) 4 (1.3)
Germany 16 (2.6) 42 (3.0) 42 (3.0) 51 (2.9) 34 (2.9) 15 (2.4)
Greece 67 (4.5) 28 (4.2) 5 (1.8) 76 (3.1) 20 (3.0) 4 (1.8)
Hong Kong, SAR 39 (4.5) 37 (4.3) 24 (3.9) 30 (4.3) 46 (4.3) 24 (3.8)
Hungary 29 (4.1) 58 (4.1) 13 (2.8) 56 (4.1) 33 (4.0) 11 (2.7)
Iceland 83 (0.4) 11 (0.3) 6 (0.2) 28 (0.3) 57 (0.4) 15 (0.4)
Iran, Islamic Rep. of 67 (3.2) 28 (3.2) 5 (1.5) 60 (4.5) 37 (4.6) 4 (1.2)
Israel 66 (4.2) 29 (4.0) 5 (2.0) 54 (3.8) 34 (4.2) 11 (3.0)
Italy 61 (3.8) 33 (3.9) 5 (1.7) 64 (3.3) 31 (3.4) 6 (1.8)
Kuwait r 91 (2.3) 7 (2.0) 2 (1.1) r 62 (3.5) 16 (2.8) 22 (2.5)
Latvia 31 (4.0) 43 (4.4) 26 (4.1) 75 (3.7) 23 (3.5) 2 (1.4)
Lithuania 47 (4.2) 38 (4.2) 15 (3.0) 84 (3.0) 15 (2.8) 1 (0.9)
Macedonia, Rep. of 64 (3.8) 34 (3.9) 2 (1.1) 64 (4.6) 32 (4.5) 5 (1.7)
Moldova, Rep. of 54 (4.4) 33 (4.1) 13 (2.6) 86 (3.0) 11 (2.8) 2 (0.8)
Morocco 90 (3.1) 8 (2.9) 2 (1.4) r 83 (4.0) 8 (3.1) 9 (3.2)
Netherlands 47 (3.8) 41 (4.0) 12 (3.1) 40 (4.6) 40 (4.7) 20 (3.5)
New Zealand 78 (3.5) 18 (3.1) 4 (1.7) 12 (2.6) 38 (4.4) 50 (4.4)
Norway 73 (3.9) 23 (3.5) 4 (2.0) 25 (3.9) 51 (4.7) 24 (4.2)
Romania 66 (4.2) 27 (4.1) 7 (2.4) 95 (1.9) 5 (1.8) 1 (0.4)
Russian Federation 78 (3.4) 18 (2.7) 4 (1.6) 91 (2.2) 8 (2.2) 1 (0.6)
Scotland 49 (5.5) 44 (5.2) 7 (2.5) 13 (3.6) 46 (4.6) 42 (4.9)
Singapore 61 (4.1) 35 (3.8) 4 (1.6) 41 (3.9) 46 (4.0) 13 (2.6)
Slovak Republic 52 (4.3) 36 (4.1) 12 (2.6) 77 (3.5) 19 (3.3) 3 (1.4)
Slovenia 49 (3.7) 49 (3.9) 2 (1.2) 33 (4.1) 50 (4.0) 17 (3.1)
Sweden 60 (3.3) 35 (3.2) 5 (1.2) 10 (2.3) 48 (3.6) 42 (3.8)
Turkey 58 (4.5) 38 (4.4) 4 (1.9) 63 (4.2) 31 (4.0) 6 (2.2)
United States 81 (3.6) 16 (3.0) 4 (1.8) 48 (4.7) 40 (4.5) 13 (3.1)
International Avg. 61 (0.7) 31 (0.7) 9 (0.4) 56 (0.6) 31 (0.6) 13 (0.4)
Daily Weekly
Percentage of Students Whose TeachersReported Various Reading Activities
Countries
Daily Weekly Less thanWeekly
Teacher Reads Aloud to Whole Class Students Read Aloud to Whole Class
Less thanWeekly
Background data provided by teachers.
( ) Standard errors appear in parentheses. Because results are rounded to the nearest wholenumber, some totals may appear inconsistent.
An “r” indicates data are available for 70-84% of the students. An “s” indicates data are avail-able for 50-69% of the students. An “x” indicates data are available for less than 50% of thestudents.
A dash (–) indicates data are not available. A tilde (~) indicates insufficient data to reportachievement.
SOU
RCE:
IEA
Pro
gres
s in
Inte
rnat
iona
l Rea
ding
Lite
racy
Stu
dy (P
IRLS
) 200
1.
ISC 4th GradePIRLS 2001

[193]chapter 6: teachers and reading instruction
Exhibit 6.19: Teachers’ Reports About Reading Aloud or Silently in Class(Continued)
SOU
RCE:
IEA
Pro
gres
s in
Inte
rnat
iona
l Rea
ding
Lite
racy
Stu
dy (P
IRLS
) 200
1.
Argentina 21 (4.3) 33 (5.0) 46 (4.7) 68 (5.2) 28 (5.1) 4 (1.8)
Belize 25 (5.4) 57 (6.4) 18 (5.1) 41 (5.3) 43 (5.7) 16 (4.1)
Bulgaria 19 (3.3) 43 (3.7) 38 (3.6) 86 (2.7) 10 (2.4) 3 (1.3)
Canada (O,Q) 11 (2.1) 37 (3.0) 52 (3.2) 71 (3.1) 24 (2.9) 5 (1.2)
Colombia 12 (3.2) 33 (4.1) 54 (4.4) 43 (4.7) 42 (4.3) 15 (3.2)
Cyprus 9 (2.5) 29 (4.8) 62 (4.9) 55 (4.6) 36 (4.5) 9 (3.5)
Czech Republic 3 (1.5) 31 (3.6) 66 (3.7) 43 (4.5) 46 (4.5) 11 (2.7)
England 23 (4.2) 45 (5.0) 32 (4.1) 76 (4.0) 23 (4.0) 2 (1.2)
France 1 (0.8) 11 (2.4) 88 (2.6) 78 (3.3) 20 (3.3) 2 (1.2)
Germany 5 (1.1) 39 (3.0) 56 (2.9) 63 (3.3) 30 (3.4) 7 (1.6)
Greece 16 (3.2) 25 (4.2) 58 (4.8) 49 (5.0) 33 (4.4) 19 (4.2)
Hong Kong, SAR 6 (2.0) 27 (4.3) 68 (4.3) 39 (4.1) 34 (3.9) 28 (4.2)
Hungary 5 (1.7) 20 (3.4) 75 (3.3) 66 (3.6) 28 (3.4) 5 (1.8)
Iceland 4 (0.2) 12 (0.3) 85 (0.3) 47 (0.4) 44 (0.4) 9 (0.2)
Iran, Islamic Rep. of 11 (2.1) 35 (4.2) 54 (4.2) 34 (3.5) 43 (3.3) 23 (3.6)
Israel 23 (4.1) 45 (4.7) 33 (4.6) 61 (4.5) 32 (4.2) 7 (2.4)
Italy 3 (1.2) 22 (3.3) 75 (3.5) 42 (3.9) 42 (3.6) 16 (2.7)
Kuwait r 12 (2.5) 29 (3.6) 59 (3.6) 34 (3.3) 47 (3.3) 19 (2.3)
Latvia 11 (2.6) 32 (4.1) 57 (4.5) 73 (3.3) 22 (3.1) 5 (1.8)
Lithuania 7 (2.2) 49 (4.6) 44 (4.5) 57 (3.9) 37 (3.8) 6 (1.7)
Macedonia, Rep. of 10 (2.7) 26 (3.6) 64 (4.2) 44 (4.1) 33 (4.4) 23 (4.0)
Moldova, Rep. of 24 (4.0) 55 (4.7) 21 (3.4) 85 (3.2) 10 (2.6) 5 (1.7)
Morocco r 22 (4.3) 19 (3.6) 59 (4.7) 58 (5.0) 34 (5.0) 7 (2.9)
Netherlands 5 (1.9) 48 (4.8) 47 (4.7) 44 (4.4) 50 (4.6) 5 (1.8)
New Zealand 26 (3.9) 54 (4.3) 20 (3.6) 92 (2.1) 8 (2.1) 0 (0.2)
Norway 6 (1.9) 34 (4.3) 60 (4.6) 42 (3.9) 46 (4.1) 12 (2.4)
Romania 7 (1.5) 32 (4.2) 61 (4.1) 71 (3.5) 21 (3.1) 8 (2.2)
Russian Federation 33 (3.2) 43 (3.4) 24 (3.0) 86 (2.3) 11 (2.2) 3 (1.4)
Scotland 36 (4.6) 45 (5.2) 18 (3.9) 62 (4.4) 36 (4.5) 2 (1.3)
Singapore 10 (2.7) 45 (4.7) 45 (4.4) 59 (4.1) 35 (3.9) 6 (1.9)
Slovak Republic 4 (1.5) 34 (3.9) 62 (3.8) 45 (4.2) 40 (4.2) 15 (2.7)
Slovenia 5 (1.6) 31 (3.7) 64 (3.7) 59 (4.1) 35 (4.0) 6 (1.7)
Sweden 5 (1.4) 47 (3.6) 49 (3.4) 78 (2.4) 20 (2.2) 1 (0.7)
Turkey 5 (1.7) 21 (3.5) 74 (3.8) 49 (4.4) 46 (4.2) 5 (2.1)
United States 19 (3.7) 51 (3.9) 30 (3.3) 72 (3.9) 23 (3.9) 5 (2.1)
International Avg. 13 (0.5) 35 (0.7) 52 (0.7) 59 (0.7) 32 (0.6) 9 (0.4)
CountriesStudents Read Aloud inSmall Groups or Pairs
Students Read Silentlyon Their Own
Percentage of Students Whose TeachersReported Various Reading Activities
Daily Weekly Daily WeeklyLess thanWeekly
Less thanWeekly
ISC 4th GradePIRLS 2001

[194]
What Activities Do Students Do in Response to Class Reading?
To provide information on what students do to strengthen and extend theirunderstanding of what they have read, PIRLS asked students and teachersabout activities students engage in after reading something in class. In manycountries, oral questioning by the teacher about students’ reading was aneveryday activity (see Exhibit 6.20), and in all countries it happened with themajority of students at least once a week. Students also reported frequentlyanswering questions in writing about what they had read in class. Exhibit 6.21shows that 80 percent of students, on average, internationally, were in classeswhere this happens at least weekly. Another common activity was to have stu-dents talk with each other about what they have read (Exhibit 6.22). The major-ity of students (55%) were in classes where students reported talking withpeers about their classroom reading at least once a week.
A less frequent activity after reading in class was to do a project aboutwhat was read. As shown in Exhibit 6.23, student projects about their reading,including drawing pictures or doing art work, acting in a play or drama, anddoing a group project with other students, were no more than an occasionalactivity in most countries. Only 31 percent of students were in classes wherestudents reported doing such projects about their reading as often as once aweek. In about one-third of the countries, including the Czech Republic,England, Germany, Hong Kong, Iceland, The Netherlands, Norway, Singapore,Sweden, and the United States, the majority of students were in classes whereprojects about reading were never or almost never done.
Teachers’ reports about the activities they asked their students to doafter they have read something in class are summarized in Exhibit 6.24. Inevery country (except Iceland), most if not all students were in classes whereteachers reported oral questioning about reading at least weekly. Having stu-dents write something about or in response to what they have read, and havingstudents talk to each other about their reading also were frequently reportedactivities, with about two-thirds of students on average in classes where teach-ers reported doing these at least weekly. Drawing pictures, doing a play ordrama, or doing a group project were all activities reported less frequently byfourth-grade teachers. Most teachers reported asking students to engage in
chapter 6: teachers and reading instruction
[195]chapter 6: teachers and reading instruction
several different activities after they had read something in class. On average,59 percent of students were in classes where teachers reported that they hadstudents do at least three of the six activities (write something, answer ques-tions orally, talk to one another, draw pictures or do an art project, do a playor dramatization, or do a group project) after they had read something in class.
Although not an everyday activity in most classes, students did some-times take a written quiz or test about what they had read. Less than half(45%) the students were in classes that took a quiz about what they had readas often as once a week (see Exhibit 6.25), and in the Czech Republic, England,and Iceland, 50 percent or more of the students reported never or almost nevertaking a quiz about their reading. Teachers agreed that they gave a writtenquiz or test about what students had read relatively infrequently. As presentedin Exhibit 6.26, the majority of students (52%) were in classes where teachersreported giving a quiz about reading only once or twice a month, and a further26 percent were in classes where quizzes were almost never given. In Iceland,New Zealand, Norway, Scotland, and Sweden, the majority of students were insuch classes.

[196] chapter 6: teachers and reading instruction
Exhibit 6.20: Students Answer Questions Aloud About Class Reading
Argentina 58 (1.4) 427 (6.1) 24 (1.0) 437 (6.3) 11 (0.8) 429 (9.9) 7 (0.6) 424 (9.0)
Belize 43 (2.1) 330 (6.3) 31 (1.6) 339 (7.2) 14 (0.9) 315 (7.6) 12 (1.2) 318 (6.6)
Bulgaria 70 (1.5) 557 (3.6) 23 (1.1) 552 (4.7) 5 (0.6) 517 (8.9) 2 (0.4) ~ ~
Canada (O,Q) 29 (1.2) 531 (3.2) 34 (1.1) 546 (2.7) 20 (1.0) 559 (3.2) 17 (0.9) 551 (3.9)
Colombia 60 (1.8) 422 (5.0) 25 (1.3) 432 (6.3) 6 (0.6) 420 (8.4) 9 (0.6) 416 (5.9)
Cyprus 68 (1.3) 503 (3.3) 21 (1.2) 488 (4.8) 8 (0.5) 468 (7.9) 3 (0.4) 456 (8.5)
Czech Republic 32 (1.6) 529 (3.3) 34 (1.4) 538 (3.0) 21 (1.1) 549 (3.2) 13 (1.1) 538 (3.3)
England 18 (1.2) 530 (5.1) 35 (1.2) 553 (3.9) 22 (1.0) 563 (4.5) 24 (1.3) 562 (4.8)
France 51 (1.3) 527 (3.0) 29 (1.1) 527 (2.9) 9 (0.6) 534 (5.2) 11 (0.8) 514 (5.5)
Germany 34 (0.8) 536 (2.7) 36 (0.8) 544 (2.1) 18 (0.6) 545 (3.0) 12 (0.6) 536 (3.7)
Greece 79 (1.3) 527 (4.0) 17 (1.1) 525 (5.6) 3 (0.4) 499 (13.5) 2 (0.3) ~ ~
Hong Kong, SAR 32 (1.1) 538 (3.0) 33 (1.2) 534 (3.1) 17 (0.8) 523 (3.9) 18 (0.9) 510 (5.1)
Hungary 52 (1.9) 546 (2.6) 34 (1.4) 544 (2.5) 10 (0.8) 541 (5.2) 4 (0.4) 540 (6.6)
Iceland 21 (0.6) 497 (3.3) 31 (0.6) 520 (2.3) 18 (0.6) 526 (3.4) 30 (0.8) 512 (2.9)
Iran, Islamic Rep. of 59 (1.5) 419 (4.0) 28 (1.2) 420 (6.7) 6 (0.8) 377 (7.6) 6 (0.6) 391 (7.5)
Israel 46 (1.0) 502 (3.6) 33 (0.9) 524 (3.8) 12 (0.6) 514 (5.6) 10 (0.7) 513 (7.3)
Italy 44 (1.2) 534 (2.7) 34 (1.0) 546 (3.2) 14 (0.6) 554 (4.2) 8 (0.5) 543 (5.6)
Kuwait r 64 (1.3) 410 (4.6) 20 (0.8) 388 (5.5) 8 (0.5) 372 (7.6) 8 (0.7) 391 (5.8)
Latvia 44 (1.6) 541 (3.1) 41 (1.2) 552 (2.4) 12 (0.7) 544 (4.5) 4 (0.4) 533 (8.5)
Lithuania 47 (1.4) 539 (3.5) 39 (1.2) 549 (3.9) 11 (0.6) 551 (4.7) 3 (0.4) 531 (9.3)
Macedonia, Rep. of 69 (1.5) 452 (4.5) 24 (1.5) 444 (6.9) 6 (0.6) 394 (13.5) 1 (0.2) ~ ~
Moldova, Rep. of 74 (1.9) 498 (4.2) 21 (1.6) 486 (6.6) 3 (0.4) 465 (10.5) 1 (0.2) ~ ~
Morocco 66 (1.8) 363 (11.4) 23 (1.5) 323 (8.9) 7 (0.8) 331 (13.2) 4 (0.7) 349 (22.8)
Netherlands 17 (1.0) 535 (3.9) 21 (0.8) 559 (3.6) 15 (0.8) 559 (3.1) 47 (1.4) 559 (2.7)
New Zealand 23 (1.1) 492 (5.6) 38 (1.2) 534 (4.4) 22 (1.0) 551 (5.3) 17 (1.0) 547 (5.8)
Norway 28 (1.2) 493 (4.8) 39 (1.2) 504 (3.3) 18 (1.0) 508 (4.2) 15 (1.0) 495 (4.9)
Romania 72 (1.6) 519 (4.8) 22 (1.4) 509 (6.2) 3 (0.3) 455 (12.5) 2 (0.3) ~ ~
Russian Federation 54 (1.7) 532 (5.0) 34 (1.4) 528 (4.8) 7 (0.6) 522 (6.7) 5 (0.4) 499 (7.5)
Scotland 24 (2.7) 503 (5.3) 39 (2.0) 533 (4.6) 18 (1.0) 544 (6.5) 20 (1.6) 537 (5.5)
Singapore 26 (0.9) 519 (6.1) 32 (0.8) 532 (5.7) 17 (0.6) 539 (5.8) 26 (0.8) 527 (5.5)
Slovak Republic 38 (1.5) 507 (4.1) 38 (1.3) 526 (3.0) 17 (0.9) 531 (4.3) 6 (0.7) 522 (6.2)
Slovenia 33 (1.5) 489 (3.6) 41 (1.2) 506 (2.7) 22 (1.1) 512 (3.4) 5 (0.6) 509 (5.9)
Sweden 21 (1.0) 553 (3.5) 38 (0.9) 560 (2.6) 24 (0.9) 567 (2.5) 17 (1.1) 565 (3.4)
Turkey 60 (1.4) 462 (4.0) 29 (1.1) 439 (5.3) 7 (0.5) 400 (7.3) 4 (0.4) 441 (9.1)
United States 32 (1.4) 528 (5.0) 31 (1.2) 548 (3.4) 16 (0.9) 557 (6.3) 21 (1.3) 547 (5.7)
International Avg. 45 (0.2) 497 (0.8) 31 (0.2) 502 (0.8) 13 (0.1) 495 (1.2) 11 (0.1) 496 (1.6)
Percent ofStudents
AverageAchievement
Countries
Every Day or AlmostEvery Day Once or Twice a Week Once or Twice a Month Never or Almost Never
Percent ofStudents
AverageAchievement
Percent ofStudents
AverageAchievement
Percent ofStudents
AverageAchievement
Background data provided by students.
( ) Standard errors appear in parentheses. Because results are rounded to the nearest wholenumber, some totals may appear inconsistent.
An “r” indicates data are available for 70-84% of the students. An “s” indicates data are avail-able for 50-69% of the students. An “x” indicates data are available for less than 50% of thestudents.
A dash (–) indicates data are not available. A tilde (~) indicates insufficient data to reportachievement.
SOU
RCE:
IEA
Pro
gres
s in
Inte
rnat
iona
l Rea
ding
Lite
racy
Stu
dy (P
IRLS
) 200
1.
ISC 4th GradePIRLS 2001

[197]chapter 6: teachers and reading instruction
Exhibit 6.21: Students Answer Questions in Writing About Class Reading*
SOU
RCE:
IEA
Pro
gres
s in
Inte
rnat
iona
l Rea
ding
Lite
racy
Stu
dy (P
IRLS
) 200
1.
Argentina 64 (1.5) 431 (5.4) 27 (1.3) 435 (7.9) 4 (0.5) 422 (15.7) 5 (0.5) 397 (10.8)
Belize 42 (2.2) 329 (6.4) 43 (2.0) 332 (6.1) 9 (0.8) 320 (10.3) 6 (0.6) 327 (11.9)
Bulgaria 40 (1.7) 550 (4.7) 44 (1.5) 561 (3.6) 9 (0.8) 553 (7.1) 7 (0.8) 517 (13.4)
Canada (O,Q) 27 (1.2) 528 (3.1) 45 (0.9) 548 (2.6) 15 (0.7) 558 (3.8) 13 (0.8) 551 (4.2)
Colombia 70 (1.7) 423 (4.7) 24 (1.5) 429 (6.4) 3 (0.5) 428 (16.2) 3 (0.4) 428 (16.4)
Cyprus 55 (1.3) 491 (3.5) 36 (1.2) 502 (4.0) 5 (0.5) 512 (8.0) 3 (0.4) 482 (9.5)
Czech Republic 19 (1.6) 522 (3.9) 42 (1.6) 537 (2.8) 19 (1.1) 545 (3.5) 20 (1.5) 546 (4.1)
England 22 (1.4) 530 (6.7) 47 (1.2) 558 (3.5) 15 (0.8) 569 (4.1) 17 (1.3) 555 (6.2)
France 24 (1.2) 504 (3.2) 46 (1.2) 530 (2.8) 17 (0.7) 538 (3.7) 13 (0.9) 538 (4.1)
Germany 19 (0.7) 521 (2.8) 42 (0.9) 540 (2.3) 17 (0.7) 553 (2.5) 22 (0.8) 548 (3.0)
Greece 54 (1.9) 515 (3.8) 34 (1.7) 536 (4.5) 6 (0.6) 541 (5.4) 6 (0.7) 541 (10.6)
Hong Kong, SAR 30 (1.0) 529 (3.4) 52 (0.9) 531 (3.1) 11 (0.6) 524 (5.0) 7 (0.4) 518 (5.8)
Hungary 51 (1.9) 538 (2.6) 40 (1.7) 552 (2.7) 6 (0.5) 548 (6.2) 3 (0.4) 532 (14.0)
Iceland 26 (0.7) 495 (2.3) 44 (0.7) 521 (1.7) 16 (0.6) 523 (3.3) 15 (0.5) 516 (4.0)
Iran, Islamic Rep. of 49 (2.0) 414 (4.6) 40 (1.2) 421 (5.2) 7 (1.1) 396 (11.2) 4 (0.5) 395 (13.2)
Israel 54 (1.2) 506 (3.4) 37 (1.1) 517 (3.4) 6 (0.5) 533 (8.0) 3 (0.4) 522 (10.9)
Italy 39 (1.2) 528 (3.2) 44 (1.3) 550 (2.5) 10 (0.6) 550 (4.6) 7 (0.6) 546 (5.1)
Kuwait r 48 (1.7) 407 (3.8) 38 (1.4) 402 (5.4) 8 (0.6) 386 (9.1) 6 (0.6) 365 (12.9)
Latvia 34 (1.4) 534 (3.0) 48 (1.4) 549 (2.9) 10 (0.8) 560 (6.0) 8 (0.9) 556 (5.5)
Lithuania 39 (1.4) 526 (2.9) 40 (1.1) 552 (3.2) 10 (0.6) 558 (5.6) 11 (1.0) 566 (5.0)
Macedonia, Rep. of 67 (1.6) 446 (4.8) 30 (1.6) 448 (6.5) 2 (0.3) ~ ~ 1 (0.2) ~ ~
Moldova, Rep. of 43 (2.4) 492 (4.5) 48 (2.6) 496 (5.5) 5 (0.7) 479 (7.9) 4 (0.6) 486 (11.8)
Morocco 47 (2.4) 356 (14.0) 42 (2.4) 347 (10.0) 8 (1.7) 360 (19.5) 3 (0.5) 318 (25.2)
Netherlands 14 (0.9) 538 (4.3) 37 (1.3) 555 (3.1) 20 (0.7) 560 (3.2) 29 (1.3) 559 (2.8)
New Zealand 26 (1.5) 507 (5.1) 45 (1.5) 539 (3.8) 16 (1.1) 542 (7.1) 14 (1.0) 541 (6.8)
Norway 19 (1.1) 480 (5.6) 48 (1.4) 502 (3.4) 17 (0.9) 511 (5.1) 16 (1.1) 508 (5.2)
Romania 60 (2.2) 511 (4.7) 34 (2.0) 519 (6.8) 4 (0.5) 502 (11.3) 3 (0.3) 501 (18.0)
Russian Federation 21 (1.4) 503 (6.9) 47 (1.6) 531 (4.4) 14 (0.9) 539 (5.2) 17 (1.4) 546 (5.2)
Scotland 26 (1.4) 501 (5.2) 50 (1.8) 535 (4.2) 14 (1.1) 552 (5.5) 10 (1.0) 544 (7.8)
Singapore 31 (1.0) 508 (5.9) 43 (0.9) 536 (5.1) 13 (0.5) 545 (6.2) 13 (0.7) 536 (6.1)
Slovak Republic 29 (1.8) 503 (4.7) 47 (1.6) 525 (3.3) 14 (1.0) 530 (4.3) 11 (1.1) 522 (6.1)
Slovenia 34 (1.4) 492 (3.0) 51 (1.4) 506 (2.4) 9 (0.8) 520 (4.5) 5 (0.7) 507 (9.5)
Sweden 10 (0.7) 540 (4.4) 40 (1.7) 560 (2.8) 21 (1.0) 564 (2.8) 29 (1.7) 567 (2.7)
Turkey 51 (2.1) 452 (3.8) 40 (1.8) 450 (5.2) 5 (0.8) 445 (9.5) 3 (0.4) 436 (11.6)
United States 35 (1.4) 522 (5.2) 42 (1.0) 553 (3.8) 13 (0.7) 565 (5.0) 10 (1.0) 546 (7.1)
International Avg. 38 (0.3) 491 (0.8) 42 (0.3) 506 (0.8) 11 (0.1) 510 (1.4) 10 (0.1) 502 (1.8)
Every Day or AlmostEvery Day Once or Twice a Week Once or Twice a Month Never or Almost Never
CountriesPercent ofStudents
AverageAchievement
Percent ofStudents
AverageAchievement
Percent ofStudents
AverageAchievement
Percent ofStudents
AverageAchievement
( ) Standard errors appear in parentheses. Because results are rounded to the nearest wholenumber, some totals may appear inconsistent.
An “r” indicates data are available for 70-84% of the students. An “s” indicates data are avail-able for 50-69% of the students. An “x” indicates data are available for less than 50% of thestudents.
A dash (–) indicates data are not available. A tilde (~) indicates insufficient data to reportachievement.
ISC 4th GradePIRLS 2001
*Based on students’ responses to how often they have done the following afterhaving read something in class: answer questions in a workbook or on aworksheet about what was read; and write something about what was read.Average is computed based on a 4-point scale: Every day or almost every day= 1, Once or twice a week = 2, Once or twice a month = 3, and Never or
almost never = 4. Every day or almost every day indicates an average of 1 toless than 1.75. Once or twice a week indicates an average of 1.75 through2.5. Once or twice a month indicates an average of greater than 2.5 through3.25. Never or almost never indicates an average of greater than 3.25 through4.
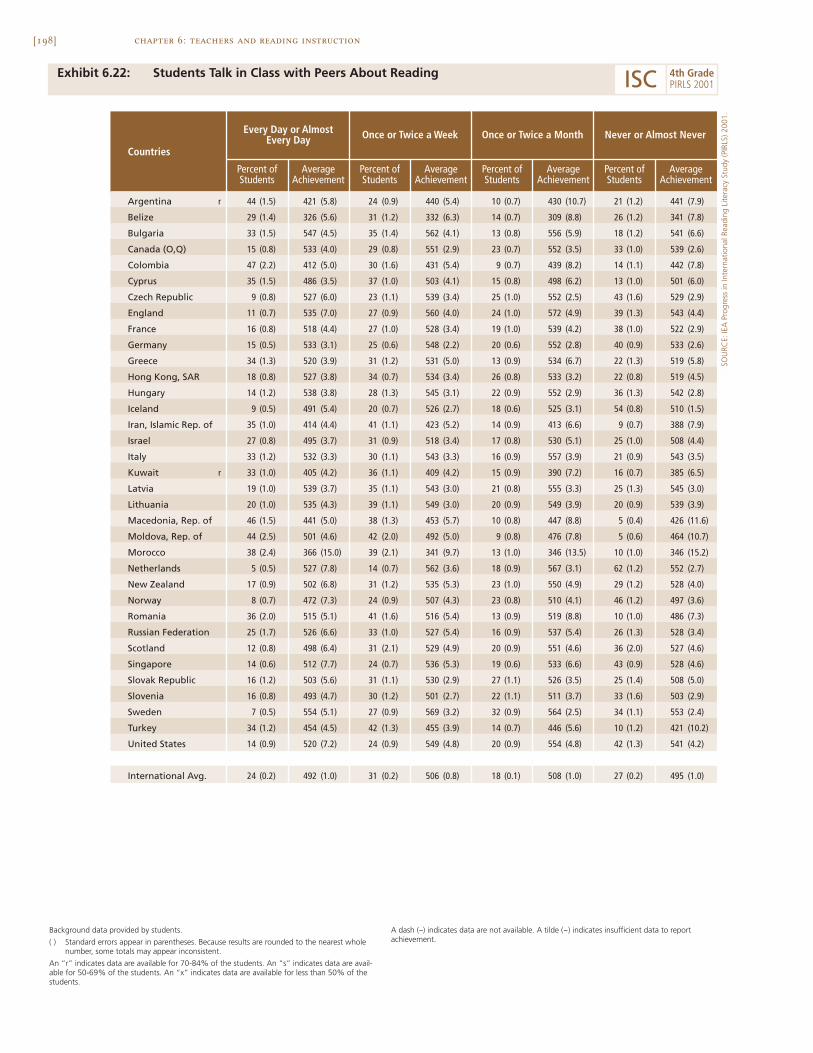
[198] chapter 6: teachers and reading instruction
Exhibit 6.22: Students Talk in Class with Peers About Reading
Argentina r 44 (1.5) 421 (5.8) 24 (0.9) 440 (5.4) 10 (0.7) 430 (10.7) 21 (1.2) 441 (7.9)
Belize 29 (1.4) 326 (5.6) 31 (1.2) 332 (6.3) 14 (0.7) 309 (8.8) 26 (1.2) 341 (7.8)
Bulgaria 33 (1.5) 547 (4.5) 35 (1.4) 562 (4.1) 13 (0.8) 556 (5.9) 18 (1.2) 541 (6.6)
Canada (O,Q) 15 (0.8) 533 (4.0) 29 (0.8) 551 (2.9) 23 (0.7) 552 (3.5) 33 (1.0) 539 (2.6)
Colombia 47 (2.2) 412 (5.0) 30 (1.6) 431 (5.4) 9 (0.7) 439 (8.2) 14 (1.1) 442 (7.8)
Cyprus 35 (1.5) 486 (3.5) 37 (1.0) 503 (4.1) 15 (0.8) 498 (6.2) 13 (1.0) 501 (6.0)
Czech Republic 9 (0.8) 527 (6.0) 23 (1.1) 539 (3.4) 25 (1.0) 552 (2.5) 43 (1.6) 529 (2.9)
England 11 (0.7) 535 (7.0) 27 (0.9) 560 (4.0) 24 (1.0) 572 (4.9) 39 (1.3) 543 (4.4)
France 16 (0.8) 518 (4.4) 27 (1.0) 528 (3.4) 19 (1.0) 539 (4.2) 38 (1.0) 522 (2.9)
Germany 15 (0.5) 533 (3.1) 25 (0.6) 548 (2.2) 20 (0.6) 552 (2.8) 40 (0.9) 533 (2.6)
Greece 34 (1.3) 520 (3.9) 31 (1.2) 531 (5.0) 13 (0.9) 534 (6.7) 22 (1.3) 519 (5.8)
Hong Kong, SAR 18 (0.8) 527 (3.8) 34 (0.7) 534 (3.4) 26 (0.8) 533 (3.2) 22 (0.8) 519 (4.5)
Hungary 14 (1.2) 538 (3.8) 28 (1.3) 545 (3.1) 22 (0.9) 552 (2.9) 36 (1.3) 542 (2.8)
Iceland 9 (0.5) 491 (5.4) 20 (0.7) 526 (2.7) 18 (0.6) 525 (3.1) 54 (0.8) 510 (1.5)
Iran, Islamic Rep. of 35 (1.0) 414 (4.4) 41 (1.1) 423 (5.2) 14 (0.9) 413 (6.6) 9 (0.7) 388 (7.9)
Israel 27 (0.8) 495 (3.7) 31 (0.9) 518 (3.4) 17 (0.8) 530 (5.1) 25 (1.0) 508 (4.4)
Italy 33 (1.2) 532 (3.3) 30 (1.1) 543 (3.3) 16 (0.9) 557 (3.9) 21 (0.9) 543 (3.5)
Kuwait r 33 (1.0) 405 (4.2) 36 (1.1) 409 (4.2) 15 (0.9) 390 (7.2) 16 (0.7) 385 (6.5)
Latvia 19 (1.0) 539 (3.7) 35 (1.1) 543 (3.0) 21 (0.8) 555 (3.3) 25 (1.3) 545 (3.0)
Lithuania 20 (1.0) 535 (4.3) 39 (1.1) 549 (3.0) 20 (0.9) 549 (3.9) 20 (0.9) 539 (3.9)
Macedonia, Rep. of 46 (1.5) 441 (5.0) 38 (1.3) 453 (5.7) 10 (0.8) 447 (8.8) 5 (0.4) 426 (11.6)
Moldova, Rep. of 44 (2.5) 501 (4.6) 42 (2.0) 492 (5.0) 9 (0.8) 476 (7.8) 5 (0.6) 464 (10.7)
Morocco 38 (2.4) 366 (15.0) 39 (2.1) 341 (9.7) 13 (1.0) 346 (13.5) 10 (1.0) 346 (15.2)
Netherlands 5 (0.5) 527 (7.8) 14 (0.7) 562 (3.6) 18 (0.9) 567 (3.1) 62 (1.2) 552 (2.7)
New Zealand 17 (0.9) 502 (6.8) 31 (1.2) 535 (5.3) 23 (1.0) 550 (4.9) 29 (1.2) 528 (4.0)
Norway 8 (0.7) 472 (7.3) 24 (0.9) 507 (4.3) 23 (0.8) 510 (4.1) 46 (1.2) 497 (3.6)
Romania 36 (2.0) 515 (5.1) 41 (1.6) 516 (5.4) 13 (0.9) 519 (8.8) 10 (1.0) 486 (7.3)
Russian Federation 25 (1.7) 526 (6.6) 33 (1.0) 527 (5.4) 16 (0.9) 537 (5.4) 26 (1.3) 528 (3.4)
Scotland 12 (0.8) 498 (6.4) 31 (2.1) 529 (4.9) 20 (0.9) 551 (4.6) 36 (2.0) 527 (4.6)
Singapore 14 (0.6) 512 (7.7) 24 (0.7) 536 (5.3) 19 (0.6) 533 (6.6) 43 (0.9) 528 (4.6)
Slovak Republic 16 (1.2) 503 (5.6) 31 (1.1) 530 (2.9) 27 (1.1) 526 (3.5) 25 (1.4) 508 (5.0)
Slovenia 16 (0.8) 493 (4.7) 30 (1.2) 501 (2.7) 22 (1.1) 511 (3.7) 33 (1.6) 503 (2.9)
Sweden 7 (0.5) 554 (5.1) 27 (0.9) 569 (3.2) 32 (0.9) 564 (2.5) 34 (1.1) 553 (2.4)
Turkey 34 (1.2) 454 (4.5) 42 (1.3) 455 (3.9) 14 (0.7) 446 (5.6) 10 (1.2) 421 (10.2)
United States 14 (0.9) 520 (7.2) 24 (0.9) 549 (4.8) 20 (0.9) 554 (4.8) 42 (1.3) 541 (4.2)
International Avg. 24 (0.2) 492 (1.0) 31 (0.2) 506 (0.8) 18 (0.1) 508 (1.0) 27 (0.2) 495 (1.0)
Countries
Every Day or AlmostEvery Day Once or Twice a Week Once or Twice a Month Never or Almost Never
Percent ofStudents
AverageAchievement
Percent ofStudents
AverageAchievement
Percent ofStudents
AverageAchievement
Percent ofStudents
AverageAchievement
Background data provided by students.
( ) Standard errors appear in parentheses. Because results are rounded to the nearest wholenumber, some totals may appear inconsistent.
An “r” indicates data are available for 70-84% of the students. An “s” indicates data are avail-able for 50-69% of the students. An “x” indicates data are available for less than 50% of thestudents.
A dash (–) indicates data are not available. A tilde (~) indicates insufficient data to reportachievement.
SOU
RCE:
IEA
Pro
gres
s in
Inte
rnat
iona
l Rea
ding
Lite
racy
Stu
dy (P
IRLS
) 200
1.
ISC 4th GradePIRLS 2001

[199]chapter 6: teachers and reading instruction
Exhibit 6.23: Students Do Projects About Class Reading*
SOU
RCE:
IEA
Pro
gres
s in
Inte
rnat
iona
l Rea
ding
Lite
racy
Stu
dy (P
IRLS
) 200
1.
Argentina 36 (1.3) 411 (6.7) 32 (0.9) 429 (6.2) 21 (1.1) 449 (6.5) 11 (1.0) 459 (11.0)
Belize 21 (1.2) 318 (6.4) 34 (1.5) 325 (6.2) 29 (1.2) 331 (6.9) 16 (1.4) 349 (8.3)
Bulgaria 10 (0.8) 516 (5.2) 21 (1.2) 544 (6.1) 35 (1.5) 563 (3.5) 34 (1.6) 558 (5.8)
Canada (O,Q) 8 (0.7) 500 (3.7) 15 (0.8) 519 (3.6) 28 (0.9) 545 (2.9) 49 (1.2) 559 (2.7)
Colombia 36 (2.2) 403 (5.7) 29 (1.1) 424 (4.2) 20 (1.2) 444 (5.7) 15 (1.5) 448 (9.4)
Cyprus 20 (1.1) 466 (4.2) 31 (1.1) 488 (3.4) 31 (1.2) 506 (4.2) 18 (1.0) 526 (4.4)
Czech Republic 3 (0.5) 499 (8.2) 11 (1.0) 512 (5.6) 30 (1.5) 532 (3.2) 56 (1.9) 547 (2.6)
England 4 (0.6) 469 (11.4) 11 (0.9) 509 (6.2) 25 (1.3) 542 (3.7) 61 (2.0) 570 (3.5)
France 6 (0.6) 483 (5.8) 16 (0.8) 500 (3.1) 30 (1.0) 524 (3.0) 48 (1.6) 542 (2.7)
Germany 5 (0.4) 495 (6.3) 13 (0.6) 519 (3.6) 25 (0.6) 535 (2.9) 57 (1.0) 551 (1.8)
Greece 11 (0.8) 476 (4.8) 22 (1.3) 513 (4.8) 33 (1.5) 525 (4.9) 33 (1.6) 551 (4.1)
Hong Kong, SAR 3 (0.3) 499 (7.5) 11 (0.5) 510 (5.2) 31 (0.9) 530 (3.6) 55 (1.0) 533 (2.9)
Hungary 6 (0.5) 500 (5.1) 21 (1.2) 530 (3.3) 37 (1.2) 547 (2.6) 37 (1.4) 556 (2.6)
Iceland 3 (0.4) 458 (9.3) 12 (0.6) 497 (4.2) 27 (0.7) 518 (2.4) 57 (0.8) 519 (1.5)
Iran, Islamic Rep. of 12 (0.8) 394 (5.6) 28 (1.6) 404 (5.2) 29 (1.1) 423 (5.3) 31 (2.1) 425 (7.8)
Israel 15 (0.9) 473 (5.9) 24 (0.8) 489 (3.5) 28 (0.9) 513 (3.8) 32 (1.2) 545 (3.4)
Italy 9 (0.7) 498 (5.3) 19 (0.9) 518 (3.7) 29 (0.9) 541 (3.2) 43 (1.3) 561 (2.6)
Kuwait r 12 (0.9) 398 (5.2) 23 (1.2) 399 (4.1) 27 (1.2) 407 (4.4) 38 (2.1) 398 (7.2)
Latvia 13 (0.8) 519 (3.4) 23 (1.0) 537 (3.1) 31 (1.3) 548 (3.5) 33 (1.6) 558 (3.1)
Lithuania 4 (0.5) 480 (6.8) 23 (1.0) 525 (3.2) 23 (1.0) 546 (3.5) 50 (1.7) 559 (3.0)
Macedonia, Rep. of 29 (1.5) 402 (6.0) 33 (1.3) 444 (4.6) 29 (1.6) 477 (5.8) 9 (0.8) 495 (8.7)
Moldova, Rep. of 13 (1.5) 477 (7.4) 31 (2.0) 494 (4.7) 38 (2.6) 500 (5.5) 18 (2.0) 486 (7.5)
Morocco 12 (1.0) 330 (13.5) 26 (1.9) 333 (9.5) 25 (1.3) 353 (9.3) 37 (2.9) 371 (16.4)
Netherlands 1 (0.3) ~ ~ 4 (0.4) 510 (7.0) 12 (0.7) 541 (3.9) 83 (1.0) 560 (2.3)
New Zealand 10 (0.9) 470 (6.7) 18 (1.2) 497 (5.4) 31 (1.3) 537 (4.5) 42 (1.3) 555 (3.8)
Norway 3 (0.4) 443 (10.4) 10 (0.7) 473 (7.1) 24 (0.8) 492 (4.8) 63 (1.3) 510 (3.1)
Romania 6 (0.7) 446 (12.9) 16 (1.1) 488 (5.9) 30 (1.6) 516 (6.8) 48 (2.3) 527 (5.5)
Russian Federation 10 (0.8) 482 (11.6) 19 (1.2) 515 (6.6) 31 (1.5) 534 (4.7) 40 (2.0) 542 (3.6)
Scotland 8 (0.8) 478 (9.0) 20 (2.3) 508 (5.0) 27 (1.7) 525 (4.5) 45 (2.4) 549 (4.5)
Singapore 6 (0.5) 450 (8.4) 14 (0.7) 473 (8.3) 22 (0.7) 513 (5.7) 58 (1.4) 555 (3.9)
Slovak Republic 5 (0.5) 484 (8.7) 18 (1.3) 508 (4.7) 39 (1.5) 523 (3.2) 38 (1.7) 525 (4.3)
Slovenia 9 (0.7) 449 (6.7) 20 (1.0) 480 (3.7) 34 (1.2) 508 (2.5) 36 (1.6) 523 (3.0)
Sweden 1 (0.2) ~ ~ 8 (0.5) 539 (6.4) 24 (1.1) 556 (3.2) 68 (1.3) 566 (2.0)
Turkey 12 (1.1) 433 (6.8) 24 (1.3) 442 (4.8) 30 (1.1) 456 (4.5) 34 (1.8) 456 (4.7)
United States 6 (0.6) 471 (8.0) 13 (0.8) 490 (5.8) 26 (1.2) 533 (3.9) 55 (1.7) 567 (3.7)
International Avg. 11 (0.1) 457 (1.3) 20 (0.2) 482 (0.9) 28 (0.2) 504 (0.8) 41 (0.3) 517 (1.0)
Countries
Every Day or AlmostEvery Day Once or Twice a Week Once or Twice a Month Never or Almost Never
Percent ofStudents
AverageAchievement
Percent ofStudents
AverageAchievement
Percent ofStudents
AverageAchievement
Percent ofStudents
AverageAchievement
( ) Standard errors appear in parentheses. Because results are rounded to the nearest wholenumber, some totals may appear inconsistent.
An “r” indicates data are available for 70-84% of the students. An “s” indicates data are avail-able for 50-69% of the students. An “x” indicates data are available for less than 50% of thestudents.
A dash (–) indicates data are not available. A tilde (~) indicates insufficient data to reportachievement.
ISC 4th GradePIRLS 2001
*Based on students’ responses to how often they have done the following afterhaving read something in class: draw pictures or do an art project about whatwas read; act in a play or drama about what was read; and do a group projectwith other students in the class about what was read. Average is computedbased on a 4-point scale: Every day or almost every day = 1, Once or twice a
week = 2, Once or twice a month = 3, and Never or almost never = 4. Everyday or almost every day indicates an average of 1 to less than 1.75. Once ortwice a week indicates an average of 1.75 through 2.5. Once or twice amonth indicates an average of greater than 2.5 through 3.25. Never or almostnever indicates an average of greater than 3.25 through 4.

[200] chapter 6: teachers and reading instruction
Exhibit 6.24: Teachers’ Reports About Reading Comprehension Activities After Instruction
Argentina 86 (3.7) 91 (3.2) 82 (4.3) 76 (4.0) 22 (3.4) 52 (5.5) 88 (3.2)
Belize 81 (4.0) 94 (2.2) 69 (6.5) 59 (5.8) 33 (5.4) r 23 (4.3) 73 (5.0)
Bulgaria 57 (3.9) 99 (0.6) 80 (3.5) 38 (3.9) 17 (3.0) 12 (2.5) 61 (4.1)
Canada (O,Q) 54 (2.8) 84 (2.5) 52 (3.4) 26 (2.7) 6 (1.7) 7 (1.5) 41 (3.0)
Colombia 83 (3.8) 84 (3.4) 79 (4.1) 55 (4.5) 15 (3.3) 14 (3.2) 75 (3.9)
Cyprus 83 (4.3) 95 (2.5) 83 (3.8) 33 (4.0) 54 (5.1) 48 (4.8) 83 (3.8)
Czech Republic 80 (3.1) 98 (1.1) 80 (3.1) 46 (4.3) 13 (2.5) 11 (2.8) 74 (3.5)
England 79 (3.7) 94 (2.3) 67 (4.8) 14 (3.8) 8 (2.9) 4 (1.9) 63 (4.9)
France 18 (2.7) 78 (3.3) 32 (3.3) 10 (2.4) 4 (1.4) 10 (2.0) 17 (2.5)
Germany 41 (2.6) 95 (1.4) 95 (1.2) 15 (2.0) 2 (1.0) 14 (2.4) 47 (3.0)
Greece 72 (4.2) 96 (1.7) 60 (4.4) 32 (4.7) 19 (3.6) 12 (2.7) 56 (4.4)
Hong Kong, SAR 44 (4.9) 85 (3.0) 37 (4.7) 6 (1.9) 3 (1.5) 5 (2.0) 24 (3.9)
Hungary 75 (3.3) 99 (0.8) 46 (4.2) 36 (4.5) 19 (3.0) 17 (3.1) 59 (4.2)
Iceland 51 (0.4) 45 (0.4) 21 (0.3) 35 (0.3) 2 (0.1) 13 (0.2) 25 (0.3)
Iran, Islamic Rep. of 67 (3.8) 86 (2.8) 60 (3.9) 28 (3.1) 11 (2.3) 10 (2.3) 49 (4.2)
Israel 96 (1.8) 89 (2.8) 70 (4.3) 42 (4.2) 39 (4.6) 23 (3.2) 74 (4.1)
Italy 63 (3.5) 93 (2.0) 72 (3.1) 56 (3.2) 7 (1.7) 5 (1.8) 67 (3.2)
Kuwait 70 (3.7) 81 (2.8) 60 (4.0) r 22 (3.6) 28 (3.1) 20 (3.2) 56 (4.3)
Latvia 68 (3.5) 98 (1.2) 63 (4.5) 56 (4.3) 23 (4.0) 5 (2.3) 66 (4.5)
Lithuania 72 (3.5) 97 (1.3) 83 (3.1) 32 (3.4) 13 (2.7) 6 (1.8) 66 (3.8)
Macedonia, Rep. of 88 (3.1) 95 (2.0) 80 (2.9) 47 (4.3) 39 (4.2) 20 (3.6) 77 (3.6)
Moldova, Rep. of 83 (3.2) 99 (0.9) 86 (3.0) 59 (4.3) 32 (4.0) 55 (4.2) 84 (3.3)
Morocco 58 (4.3) 96 (1.9) 76 (4.8) 21 (4.9) 14 (4.2) 13 (3.1) 56 (4.4)
Netherlands 40 (4.6) 72 (4.4) 57 (4.5) 18 (3.6) 3 (1.5) 1 (0.9) 29 (4.0)
New Zealand 80 (3.4) 87 (2.9) 78 (3.8) 47 (4.1) 13 (2.9) 9 (2.1) 71 (4.1)
Norway 51 (4.1) 80 (3.4) 32 (3.6) 23 (3.5) 3 (1.2) 1 (0.5) 28 (3.6)
Romania 93 (2.0) 97 (1.5) 75 (4.0) 18 (3.7) 39 (4.2) 6 (2.0) 84 (3.1)
Russian Federation 33 (3.3) 99 (0.7) 79 (3.2) 48 (3.2) 19 (2.9) 6 (1.7) 54 (3.7)
Scotland 62 (4.1) 93 (2.1) 56 (4.9) 23 (4.5) 0 (0.0) 3 (1.7) 43 (5.0)
Singapore 55 (4.4) 92 (2.0) 57 (3.9) 13 (2.7) 7 (2.1) 5 (1.7) 43 (3.9)
Slovak Republic 76 (3.7) 100 (0.4) 68 (3.8) 61 (4.3) 14 (2.8) 8 (2.4) 71 (3.9)
Slovenia 73 (3.4) 93 (2.2) 71 (3.7) 66 (4.2) 29 (4.0) 5 (1.9) 73 (3.8)
Sweden 64 (3.3) 66 (3.4) 45 (4.1) 22 (2.9) 2 (0.9) 6 (1.7) 41 (3.7)
Turkey 95 (1.8) 91 (2.6) 71 (4.0) 35 (4.1) 29 (4.2) 8 (2.4) 74 (3.7)
United States 83 (3.6) 97 (1.8) 70 (4.1) 36 (4.4) 2 (0.8) 13 (3.3) 69 (4.2)
International Avg. 68 (0.6) 90 (0.4) 65 (0.7) 36 (0.6) 17 (0.5) 13 (0.5) 59 (0.7)
Countries
Percentage of Students Whose Teachers Asked Themto Do Various Activities At Least Weekly
WriteSomething in
Responseto TheirReading
OrallyAnswer
Questions orGive OralSummary
Talk WithEach Other
DrawPictures orDo an ArtProject
Do a Play orDramatization
Do a GroupProject
At LeastThree of the
PreviousActivities
Background data provided by teachers.
( ) Standard errors appear in parentheses. Because results are rounded to the nearest wholenumber, some totals may appear inconsistent.
An “r” indicates data are available for 70-84% of the students. An “s” indicates data are avail-able for 50-69% of the students. An “x” indicates data are available for less than 50% of thestudents.
A dash (–) indicates data are not available. A tilde (~) indicates insufficient data to reportachievement.
SOU
RCE:
IEA
Pro
gres
s in
Inte
rnat
iona
l Rea
ding
Lite
racy
Stu
dy (P
IRLS
) 200
1.
ISC 4th GradePIRLS 2001

[201]chapter 6: teachers and reading instruction
Exhibit 6.25: Students’ Reports on Taking a Quiz or Test After Reading
SOU
RCE:
IEA
Pro
gres
s in
Inte
rnat
iona
l Rea
ding
Lite
racy
Stu
dy (P
IRLS
) 200
1.
Argentina 45 (1.4) 423 (6.3) 26 (0.9) 437 (6.6) 17 (0.9) 439 (8.0) 13 (0.8) 431 (8.3)
Belize 30 (2.0) 321 (7.2) 42 (1.9) 338 (6.5) 17 (1.2) 331 (7.1) 12 (1.0) 316 (9.1)
Bulgaria 17 (1.0) 511 (6.5) 34 (1.5) 563 (4.7) 36 (1.7) 562 (4.2) 14 (1.2) 551 (9.9)
Canada (O,Q) 12 (0.6) 518 (3.7) 24 (1.0) 539 (3.4) 31 (1.2) 553 (2.5) 33 (1.2) 550 (3.6)
Colombia 53 (1.8) 417 (5.0) 28 (1.4) 430 (6.1) 12 (1.2) 434 (9.2) 7 (0.5) 438 (8.2)
Cyprus 18 (0.9) 457 (4.9) 25 (1.2) 489 (4.3) 45 (1.3) 512 (3.1) 12 (0.8) 507 (7.1)
Czech Republic 5 (0.6) 484 (5.7) 14 (1.2) 533 (4.6) 27 (1.9) 545 (3.8) 53 (2.1) 540 (3.1)
England 5 (0.5) 483 (8.7) 14 (1.0) 534 (5.8) 31 (1.1) 560 (3.9) 50 (1.6) 561 (3.7)
France 21 (1.5) 499 (3.8) 26 (1.2) 521 (2.9) 31 (1.6) 542 (3.4) 22 (1.2) 535 (3.7)
Germany 9 (0.5) 501 (3.7) 18 (0.7) 530 (2.7) 35 (0.7) 553 (2.5) 39 (0.9) 543 (2.3)
Greece 19 (1.3) 494 (4.6) 41 (1.7) 529 (5.3) 34 (1.8) 534 (4.8) 7 (1.1) 549 (13.2)
Hong Kong, SAR 5 (0.4) 496 (7.5) 14 (0.8) 519 (5.2) 35 (1.3) 531 (3.7) 46 (1.1) 533 (3.2)
Hungary 9 (0.7) 508 (5.7) 27 (1.4) 537 (3.8) 50 (1.6) 552 (2.5) 13 (0.9) 557 (4.2)
Iceland 6 (0.4) 444 (5.2) 11 (0.6) 494 (4.1) 33 (0.8) 518 (2.1) 50 (0.7) 524 (1.8)
Iran, Islamic Rep. of 23 (1.4) 402 (5.7) 39 (1.3) 419 (4.5) 27 (1.5) 423 (6.0) 10 (0.7) 410 (9.5)
Israel 42 (1.1) 501 (3.5) 25 (0.8) 516 (3.4) 19 (1.0) 531 (6.0) 14 (0.7) 514 (5.5)
Italy 28 (1.3) 518 (3.5) 32 (1.2) 547 (2.8) 27 (1.2) 554 (3.2) 13 (0.9) 551 (5.1)
Kuwait r 26 (1.5) 401 (4.2) 32 (1.3) 412 (5.4) 21 (1.0) 394 (5.3) 21 (1.3) 392 (7.5)
Latvia 15 (1.0) 520 (5.0) 25 (1.4) 538 (3.0) 35 (1.2) 553 (3.3) 24 (1.4) 558 (3.2)
Lithuania 8 (0.7) 494 (6.4) 20 (1.0) 527 (4.0) 42 (1.1) 552 (2.8) 30 (1.2) 558 (3.9)
Macedonia, Rep. of 23 (1.4) 399 (5.9) 27 (1.3) 424 (5.9) 27 (1.6) 474 (5.8) 22 (1.5) 492 (6.5)
Moldova, Rep. of 27 (2.1) 487 (4.9) 54 (3.0) 496 (4.9) 16 (1.9) 497 (7.1) 3 (0.5) 459 (14.2)
Morocco 21 (1.6) 324 (12.0) 34 (2.1) 354 (10.1) 26 (1.7) 362 (10.6) 19 (2.4) 356 (29.0)
Netherlands 5 (0.4) 519 (6.6) 19 (1.2) 552 (3.9) 32 (1.0) 561 (2.7) 45 (1.5) 555 (3.1)
New Zealand 10 (0.8) 460 (7.3) 16 (1.1) 508 (4.8) 35 (1.3) 542 (4.4) 39 (1.6) 549 (4.7)
Norway 9 (0.6) 475 (6.7) 18 (1.0) 499 (4.6) 32 (1.1) 508 (3.9) 40 (1.2) 501 (3.7)
Romania 16 (1.1) 475 (5.2) 51 (1.9) 522 (5.5) 26 (1.9) 522 (6.3) 7 (0.6) 498 (7.9)
Russian Federation 16 (0.9) 495 (6.8) 28 (1.2) 522 (6.2) 39 (1.5) 541 (4.0) 16 (1.0) 544 (5.0)
Scotland 8 (0.8) 479 (6.9) 22 (2.5) 519 (5.1) 33 (1.8) 542 (4.0) 37 (2.1) 533 (5.0)
Singapore 9 (0.5) 469 (7.2) 17 (0.6) 500 (6.4) 25 (0.7) 537 (5.7) 49 (1.2) 545 (4.6)
Slovak Republic 7 (0.6) 470 (7.2) 15 (1.0) 511 (4.6) 35 (1.5) 528 (3.1) 42 (1.9) 523 (3.9)
Slovenia 14 (0.9) 469 (4.4) 29 (1.3) 497 (3.4) 36 (1.6) 514 (2.7) 21 (1.4) 513 (3.5)
Sweden 16 (0.9) 538 (3.4) 24 (1.2) 553 (3.4) 36 (1.3) 571 (2.4) 24 (1.5) 569 (2.7)
Turkey 20 (1.5) 445 (5.5) 34 (1.5) 451 (4.6) 37 (2.2) 455 (3.8) 9 (1.3) 433 (11.6)
United States 18 (1.1) 510 (4.3) 32 (1.3) 548 (3.9) 28 (1.2) 559 (4.7) 22 (1.2) 543 (6.2)
International Avg. 18 (0.2) 469 (1.0) 27 (0.2) 497 (0.8) 30 (0.2) 511 (0.8) 25 (0.2) 507 (1.4)
Countries
Every Day or AlmostEvery Day Once or Twice a Week Once or Twice a Month Never or Almost Never
Percent ofStudents
AverageAchievement
Percent ofStudents
AverageAchievement
Percent ofStudents
AverageAchievement
Percent ofStudents
AverageAchievement
Background data provided by students.
( ) Standard errors appear in parentheses. Because results are rounded to the nearest wholenumber, some totals may appear inconsistent.
An “r” indicates data are available for 70-84% of the students. An “s” indicates data are avail-able for 50-69% of the students. An “x” indicates data are available for less than 50% of thestudents.
A dash (–) indicates data are not available. A tilde (~) indicates insufficient data to reportachievement.
ISC 4th GradePIRLS 2001

[202] chapter 6: teachers and reading instruction
Exhibit 6.26: Teachers’ Reports on Giving a Written Quiz or Test After Students Read
Argentina 15 (3.2) 431 (16.0) 36 (4.8) 414 (11.7) 34 (4.8) 424 (11.2) 15 (3.6) 415 (13.3)
Belize 11 (3.3) 323 (20.6) 68 (5.4) 322 (6.2) 21 (4.2) 331 (14.8) 1 (0.5) ~ ~
Bulgaria 2 (1.0) ~ ~ 13 (2.4) 547 (13.3) 72 (3.5) 551 (5.1) 13 (2.6) 552 (7.3)
Canada (O,Q) 0 (0.4) ~ ~ 15 (2.1) 540 (5.4) 62 (3.2) 545 (2.8) 23 (2.7) 548 (6.1)
Colombia 14 (3.5) 398 (13.2) 33 (4.6) 424 (7.8) 42 (4.8) 425 (7.2) 12 (3.0) 439 (21.0)
Cyprus 1 (0.0) ~ ~ 14 (3.8) 507 (6.9) 49 (5.7) 490 (4.4) 35 (4.8) 493 (4.6)
Czech Republic 0 (0.4) ~ ~ 15 (3.3) 538 (6.3) 62 (4.6) 536 (3.6) 23 (3.6) 539 (4.1)
England 0 (0.0) ~ ~ 5 (2.1) 551 (28.1) 45 (4.4) 553 (5.6) 50 (4.5) 556 (4.9)
France 2 (1.0) ~ ~ 21 (3.3) 528 (5.8) 62 (3.8) 524 (2.9) 16 (2.8) 528 (6.3)
Germany 0 (0.0) ~ ~ 3 (1.1) 548 (6.8) 50 (3.8) 537 (2.8) 47 (3.9) 541 (3.7)
Greece 0 (0.0) ~ ~ 22 (4.2) 538 (7.6) 64 (4.5) 520 (4.4) 14 (3.3) 533 (10.4)
Hong Kong, SAR 0 (0.0) ~ ~ 11 (2.6) 514 (9.6) 55 (4.4) 526 (4.6) 34 (4.5) 538 (3.9)
Hungary 1 (0.6) ~ ~ 4 (1.6) 518 (16.2) 84 (3.2) 545 (2.7) 12 (2.7) 550 (9.5)
Iceland 1 (0.0) ~ ~ 3 (0.1) 474 (6.5) 30 (0.4) 501 (2.7) 67 (0.4) 518 (1.3)
Iran, Islamic Rep. of 6 (1.5) 389 (13.4) 34 (4.1) 410 (7.7) 49 (3.9) 417 (6.4) 12 (2.8) 422 (18.9)
Israel 2 (1.4) ~ ~ 17 (3.2) 499 (10.9) 68 (3.9) 508 (4.7) 12 (2.8) 528 (11.5)
Italy 11 (2.3) 529 (7.9) 43 (3.1) 538 (4.6) 40 (3.3) 545 (3.1) 6 (1.7) 555 (15.8)
Kuwait 12 (2.8) 388 (12.5) 39 (3.6) 403 (6.6) 32 (3.6) 400 (9.8) 17 (2.9) 397 (11.3)
Latvia 1 (1.1) ~ ~ 12 (3.1) 547 (9.1) 76 (4.1) 545 (2.9) 11 (2.9) 548 (5.7)
Lithuania 0 (0.0) ~ ~ 12 (2.4) 532 (10.6) 69 (3.7) 544 (3.0) 19 (3.3) 549 (5.7)
Macedonia, Rep. of 3 (1.6) 432 (27.4) 14 (3.0) 428 (16.1) 66 (4.1) 447 (7.1) 16 (3.3) 445 (13.3)
Moldova, Rep. of 10 (2.5) 484 (14.1) 48 (4.5) 490 (5.7) 40 (4.2) 495 (7.4) 2 (1.1) ~ ~
Morocco 1 (1.0) ~ ~ 16 (3.6) 348 (13.1) 48 (5.0) 353 (13.9) 35 (4.9) 329 (16.7)
Netherlands 3 (1.6) 556 (10.1) 24 (3.9) 549 (5.2) 62 (4.5) 554 (3.4) 10 (2.8) 562 (5.7)
New Zealand 0 (0.0) ~ ~ 4 (1.7) 498 (33.2) 20 (3.3) 532 (8.5) 76 (3.6) 530 (4.8)
Norway 0 (0.0) ~ ~ 5 (1.2) 495 (6.4) 30 (3.7) 496 (5.0) 66 (4.0) 501 (3.8)
Romania 2 (1.0) ~ ~ 28 (3.4) 507 (9.7) 68 (3.6) 512 (5.6) 3 (1.4) 506 (22.7)
Russian Federation 2 (1.0) ~ ~ 6 (1.4) 538 (7.1) 67 (2.9) 529 (6.1) 25 (2.8) 525 (4.9)
Scotland 0 (0.0) ~ ~ 4 (1.8) 545 (24.5) 37 (5.2) 524 (6.3) 60 (5.3) 530 (4.4)
Singapore 2 (1.0) ~ ~ 10 (2.0) 507 (15.8) 42 (3.9) 533 (8.6) 46 (3.7) 529 (7.2)
Slovak Republic 1 (0.6) ~ ~ 9 (2.2) 524 (9.2) 48 (3.8) 521 (3.8) 42 (3.7) 513 (5.5)
Slovenia 1 (0.7) ~ ~ 18 (3.3) 496 (5.8) 63 (4.0) 503 (2.6) 18 (3.3) 506 (5.5)
Sweden 1 (0.5) ~ ~ 8 (1.7) 558 (5.9) 35 (3.7) 561 (3.9) 57 (3.6) 562 (2.8)
Turkey 2 (1.0) ~ ~ 18 (3.5) 452 (10.9) 74 (3.9) 450 (4.2) 6 (1.8) 457 (14.1)
United States 2 (1.1) ~ ~ 49 (3.9) 538 (5.1) 40 (3.9) 551 (6.0) 9 (2.1) 529 (10.4)
International Avg. 3 (0.2) 437 (3.6) 19 (0.5) 496 (2.1) 52 (0.7) 501 (1.1) 26 (0.5) 508 (5.6)
Countries
Every Day or AlmostEvery Day Once or Twice a Week Once or Twice a Month Never or Almost Never
Percent ofStudents
AverageAchievement
Percent ofStudents
AverageAchievement
Percent ofStudents
AverageAchievement
Percent ofStudents
AverageAchievement
Background data provided by teachers.
( ) Standard errors appear in parentheses. Because results are rounded to the nearest wholenumber, some totals may appear inconsistent.
An “r” indicates data are available for 70-84% of the students. An “s” indicates data are avail-able for 50-69% of the students. An “x” indicates data are available for less than 50% of thestudents.
A dash (–) indicates data are not available. A tilde (~) indicates insufficient data to reportachievement.
SOU
RCE:
IEA
Pro
gres
s in
Inte
rnat
iona
l Rea
ding
Lite
racy
Stu
dy (P
IRLS
) 200
1.
ISC 4th GradePIRLS 2001

[203]chapter 6: teachers and reading instruction
What Library Resources Are Available and How Are They Used?
Since there is ample evidence that access to books and other print resources isan important support for the process of learning to read,2 PIRLS asked prin-cipals if their schools had a library and if individual classrooms had classroomlibraries or reading corners. As shown in Exhibit 6.27, almost all students(85%) attended schools with a school library, and the majority (65%) withlarge holdings – more than 500 books. Many students also had access to class-room libraries. Only five countries, Belize, Cyprus, Germany, Morocco, TheNetherlands, and Turkey, had less than 70 percent of students in schools withschool libraries, but Cyprus, Germany, The Netherlands, and Turkey com-pensated for this by having large percentages of students in schools where allor most classrooms had a library or reading corner. In some of these countries,also, students make frequent use of mobile libraries, village libraries, and doc-umentation centers. On average, 57 percent of students were in schools wheremost or all classrooms had classroom libraries. These were most often reportedin Cyprus, Hong Kong, New Zealand, and Scotland, in each of which morethan 80 percent of students were in schools where most or all classrooms hadsuch facilities. According to teacher reports, classroom libraries were rela-tively rare in Colombia, Iran, Macedonia, and Morocco.
In addition to asking principals about school and classroom libraries,PIRLS asked teachers about the situation in their own fourth-grade classroom– whether they had a classroom library or reading corner and, if so, how manybooks and magazines it contained, how often they gave students time to use itand whether they could borrow books from it to take home. Exhibit 6.28shows that 69 percent of students, on average, internationally, were in classeswhere the teacher reported having a classroom library, and in some countries,notably Cyprus, Hong Kong, New Zealand, and the United States, almost allstudents (more than 95%) were in such classes.
Despite the widespread availability of classroom libraries, studentswere allowed to use them relatively infrequently, with 62 percent of stu-dents, on average, in classes where the teacher reported giving students timeto use the classroom library no more than weekly. Highest levels of use werereported in New Zealand and the United States, where 85 percent or more
2 For example, IEA’s 1991 Reading Literacy Study found that countries with higher average student reading achievement had larger schoollibraries and especially large classroom libraries (Elley, W.B. (1992). How in the world do students read? The Hague: International Associationfor the Evaluation of Educational Achievement (IEA)).

[204]
of students were taught by teachers reporting daily use. Mostly, where therewere classroom libraries students were allowed to borrow books to take home(82% on average). Borrowing was least often reported in The Netherlands,where only 16 percent of students were allowed to borrow from the class-room library.
Exhibit 6.28 also presents the average number of books and maga-zines in classroom libraries as reported by teachers. Although the data areincomplete because of low response rates in some countries, it is clear thatclassroom library holdings varied considerably in size across countries.Canada (O,Q), England, and the United States, with more than 200 books onaverage per library, were well above the international average of 60 books,while Argentina, Bulgaria, the Czech Republic, Iceland, Kuwait, and Moroccoreported less than 20 books per library. Countries with the highest reportedholdings of magazines in classroom libraries included Canada (O,Q), France,Latvia, and the Russian Federation.
Teachers reported that visits to the school library, for those schoolsthat had a school library, were made by the majority of fourth-grade students(53%, on average, internationally) at least once or twice a week (seeExhibit 6.29). In Moldova, New Zealand, Slovenia, and the United States, 90percent or more of students were in classes where teachers reported this levelof library visits.
Exhibit 6.30 summarizes teachers’ reports on students’ overall libraryuse, including both school and classroom libraries. On average, students werein classes where the teacher reported library use either daily (44%), or once ortwice a week (40%). Students using the library less than weekly had the lowestaverage reading achievement.
chapter 6: teachers and reading instruction

[205]chapter 6: teachers and reading instruction
Exhibit 6.27: Access to Libraries in School
SOU
RCE:
IEA
Pro
gres
s in
Inte
rnat
iona
l Rea
ding
Lite
racy
Stu
dy (P
IRLS
) 200
1.
Argentina 17 (3.3) 21 (3.1) 40 (4.7) 22 (4.2) 86 (3.6) 47 (4.4) 46 (5.4)
Belize 32 (3.0) 27 (7.1) 40 (7.6) 1 (0.7) 58 (3.8) 22 (4.5) r 9 (4.5)
Bulgaria 5 (1.4) 13 (2.6) 47 (3.8) 35 (3.9) 83 (2.7) 66 (3.4) 10 (2.6)
Canada (O,Q) 46 (3.4) 41 (3.7) 11 (1.8) 2 (0.8) 96 (1.1) 91 (1.7) 23 (2.8)
Colombia 14 (3.1) 8 (2.7) 37 (5.3) 41 (4.3) 72 (4.4) 21 (3.2) 26 (4.3)
Cyprus 97 (1.3) 1 (0.1) 2 (1.3) 0 (0.0) 62 (5.5) r 30 (5.9) r 3 (1.9)
Czech Republic 6 (2.2) 14 (3.1) 63 (4.0) 18 (3.3) 92 (2.3) 71 (3.8) 11 (2.9)
England 71 (4.4) 20 (3.9) 9 (2.6) 1 (0.0) 91 (2.6) 84 (3.3) 4 (2.0)
France 52 (5.0) 29 (4.4) 16 (3.7) 2 (1.4) 79 (4.1) 64 (4.5) 10 (2.5)
Germany 45 (3.5) 35 (4.0) 19 (3.1) 1 (0.7) 53 (4.0) 22 (3.0) 1 (0.7)
Greece 49 (4.9) 18 (3.8) 16 (2.4) 17 (3.9) 88 (3.3) 22 (3.6) 9 (2.8)
Hong Kong, SAR 97 (1.5) 1 (0.9) 2 (1.2) 0 (0.0) 72 (4.3) 70 (4.3) 18 (3.6)
Hungary 7 (1.9) 41 (4.2) 51 (4.0) 2 (0.9) 95 (1.3) 92 (2.1) 33 (3.5)
Iceland r 8 (0.3) 25 (0.4) 63 (0.4) 4 (0.1) r 96 (0.2) r 95 (0.2) r 61 (0.4)
Iran, Islamic Rep. of 13 (2.8) 10 (3.2) 21 (3.8) 56 (4.8) 81 (3.0) 35 (4.5) 10 (2.9)
Israel 41 (4.4) 31 (3.7) 25 (4.1) 3 (1.5) 82 (3.5) r 48 (4.6) 1 (0.9)
Italy 24 (3.4) 32 (3.6) 40 (3.7) 5 (1.5) 91 (2.1) 58 (3.5) 11 (2.3)
Kuwait 10 (2.6) 16 (2.5) 50 (4.0) 23 (2.9) 100 (0.0) r 58 (3.8) r 70 (4.0)
Latvia 15 (3.2) 33 (4.5) 42 (4.2) 10 (2.8) 99 (1.3) 96 (1.8) 40 (4.1)
Lithuania 31 (4.1) 33 (4.2) 35 (4.0) 1 (1.0) 98 (0.6) 89 (2.1) 32 (4.2)
Macedonia, Rep. of 5 (1.6) 6 (2.0) 46 (4.0) 43 (4.0) 92 (2.1) 84 (2.8) 4 (1.7)
Moldova, Rep. of 13 (2.6) 17 (3.6) 54 (4.6) 15 (3.1) 100 (0.4) 81 (3.5) 12 (2.8)
Morocco 7 (3.0) 12 (3.4) 33 (4.8) 48 (5.1) 21 (3.4) 0 (0.0) 8 (2.0)
Netherlands 69 (4.7) 17 (3.4) 11 (3.4) 2 (1.4) 63 (4.9) r 34 (4.7) 1 (0.0)
New Zealand 83 (3.2) 16 (3.2) 1 (0.6) 0 (0.0) 99 (0.4) 97 (1.4) 15 (2.9)
Norway 12 (3.0) 27 (4.0) 58 (4.5) 2 (1.5) 98 (1.1) 85 (3.5) 9 (2.5)
Romania 5 (2.0) 10 (2.9) 62 (4.0) 23 (2.9) 96 (1.3) 92 (2.1) 9 (2.8)
Russian Federation 58 (3.1) 24 (2.9) 18 (2.3) 1 (0.6) 95 (1.4) 88 (1.7) 30 (3.0)
Scotland 81 (4.1) 13 (3.5) 4 (1.8) 1 (1.1) 84 (4.3) 66 (5.0) 4 (2.1)
Singapore 48 (3.8) 34 (3.5) 19 (3.2) 0 (0.0) 100 (0.2) 99 (0.6) 33 (3.7)
Slovak Republic 4 (1.7) 19 (3.4) 45 (4.1) 32 (3.9) 95 (1.7) 74 (3.3) 12 (2.8)
Slovenia 3 (1.1) 21 (3.5) 70 (3.8) 6 (2.1) 100 (0.0) 100 (0.0) 83 (2.9)
Sweden 21 (3.5) 37 (4.4) 36 (4.7) 6 (2.2) 89 (2.7) 76 (3.9) 11 (3.2)
Turkey 57 (4.3) 29 (4.1) 7 (2.2) 7 (2.3) 63 (3.6) 31 (4.0) 2 (1.0)
United States 64 (4.1) 28 (3.6) 8 (1.5) 0 (0.0) 99 (0.8) 97 (1.5) 55 (4.0)
International Avg. 35 (0.5) 22 (0.6) 31 (0.6) 12 (0.4) 85 (0.5) 65 (0.6) 20 (0.5)
Countries
Percentage of Students in Schools
With aSchoolLibrary
More than500 Books
With Classrooms Having Libraries
AllClassrooms
MostClassrooms
SomeClassrooms
NoClassrooms
Size of School Libraries
More than10 Magazine
Titles
Background data provided by schools.
( ) Standard errors appear in parentheses. Because results are rounded to the nearest wholenumber, some totals may appear inconsistent.
An “r” indicates data are available for 70-84% of the students. An “s” indicates data are avail-able for 50-69% of the students. An “x” indicates data are available for less than 50% of thestudents.
A dash (–) indicates data are not available. A tilde (~) indicates insufficient data to reportachievement.
ISC 4th GradePIRLS 2001

[206] chapter 6: teachers and reading instruction
Exhibit 6.28: Students’ Use of Classroom Libraries
Argentina 54 (5.0) 18 (3.4) 31 (4.5) 51 (5.2) 89 (3.8) 14 (2.8) 6 (1.4)
Belize 90 (3.3) 67 (4.8) 18 (4.0) 15 (4.0) r 68 (4.9) 37 (4.0) s 8 (1.1)
Bulgaria 34 (3.8) 23 (3.6) 8 (1.9) 69 (3.7) 89 (4.3) 8 (2.0) 2 (0.5)
Canada (O,Q) 88 (2.6) 64 (3.4) 20 (2.4) 16 (2.8) 89 (2.3) 250 (50.8) 15 (2.0)
Colombia 44 (4.6) 22 (3.7) 13 (3.2) 65 (4.6) 54 (6.0) 26 (5.3) r 9 (2.6)
Cyprus 98 (1.0) 9 (2.2) 76 (4.1) 15 (3.7) 98 (1.6) 53 (2.9) 3 (0.6)
Czech Republic 57 (4.2) 35 (4.2) 15 (3.3) 50 (4.2) 66 (6.2) 17 (2.4) 2 (0.6)
England 82 (3.5) 57 (4.7) 21 (3.7) 22 (3.8) 87 (3.3) 211 (37.6) r 4 (1.5)
France 92 (2.3) 54 (4.0) 30 (3.6) 16 (3.0) 85 (2.8) r 84 (6.5) r 14 (1.7)
Germany 82 (2.1) 37 (2.6) 29 (2.7) 35 (2.8) 89 (2.0) 51 (3.9) 5 (1.0)
Greece 61 (4.1) 17 (3.8) 22 (3.5) 61 (4.3) 97 (1.7) 36 (4.9) 4 (2.3)
Hong Kong, SAR 96 (2.5) 15 (3.1) 45 (4.4) 41 (4.7) 99 (0.9) s 167 (15.8) r 5 (1.3)
Hungary 64 (3.2) 48 (4.0) 6 (2.0) 46 (4.0) 82 (3.8) 24 (2.5) 2 (0.5)
Iceland 46 (0.4) 22 (0.3) 21 (0.3) 57 (0.4) r 68 (0.6) 16 (0.2) 1 (0.0)
Iran, Islamic Rep. of 32 (3.9) 4 (1.5) 19 (3.5) 77 (3.6) 97 (2.2) 24 (5.2) r 3 (0.7)
Israel 78 (3.7) 56 (4.3) 17 (2.7) 26 (4.0) 80 (3.4) r 28 (2.8) s 6 (1.2)
Italy 76 (2.8) 18 (2.5) 25 (3.2) 57 (3.5) 96 (1.7) 45 (5.3) s 7 (1.8)
Kuwait 40 (3.5) 3 (1.0) 23 (3.1) 74 (3.3) s 81 (5.6) r 6 (1.0) r 4 (0.7)
Latvia 67 (4.5) 53 (4.6) 6 (1.8) 41 (4.3) 82 (4.8) 61 (9.5) r 11 (2.3)
Lithuania 82 (3.5) 48 (4.5) 19 (3.3) 33 (4.3) 95 (2.1) 45 (4.4) 5 (0.7)
Macedonia, Rep. of 45 (3.6) 13 (3.0) 15 (3.1) 72 (3.4) 87 (3.8) r 21 (4.8) r 2 (1.1)
Moldova, Rep. of 68 (3.8) 42 (4.9) 20 (3.7) 38 (4.3) 94 (2.7) 40 (6.4) 7 (1.6)
Morocco 54 (5.4) 9 (2.7) 32 (5.1) 59 (5.2) r 87 (4.7) 13 (1.7) 6 (0.9)
Netherlands 84 (3.5) 58 (4.5) 23 (3.7) 19 (3.8) r 16 (3.8) r 86 (8.4) r 3 (0.7)
New Zealand 96 (1.6) 86 (3.0) 8 (2.5) 6 (1.9) 65 (4.4) 63 (4.9) 8 (1.4)
Norway 54 (4.5) 15 (3.2) 33 (4.3) 52 (4.5) 79 (5.0) 33 (5.8) 4 (0.9)
Romania 49 (4.2) 22 (3.6) 20 (2.8) 58 (4.2) 91 (3.5) 24 (6.4) 4 (0.7)
Russian Federation 84 (2.5) 64 (3.6) 12 (2.1) 24 (3.1) 94 (2.9) 77 (4.9) 12 (1.4)
Scotland 91 (2.5) 57 (4.9) 29 (4.1) 13 (3.4) 74 (4.5) 104 (8.2) 3 (0.5)
Singapore 77 (3.4) 45 (3.5) 25 (3.4) 30 (3.6) 79 (3.7) 51 (3.4) 3 (0.5)
Slovak Republic 64 (4.0) 21 (3.3) 23 (3.4) 56 (4.2) 82 (4.1) 25 (4.2) 3 (0.5)
Slovenia 66 (4.3) 45 (4.4) 16 (3.3) 39 (4.5) 73 (4.8) 21 (2.0) 3 (0.4)
Sweden 47 (2.9) 33 (3.0) 11 (2.0) 56 (2.7) 83 (3.5) 49 (5.5) r 2 (0.4)
Turkey 93 (2.2) 44 (4.4) 45 (4.4) 11 (2.5) 100 (0.0) 71 (3.5) s 9 (1.3)
United States 96 (1.3) 85 (3.3) 9 (1.9) 7 (2.7) 91 (2.5) 219 (20.5) 9 (1.1)
International Avg. 69 (0.6) 37 (0.6) 22 (0.6) 40 (0.6) 82 (0.6) 60 (2.1) 6 (0.2)
AverageNumber ofMagazne
Titles
Size of Classroom Libraries
Countries AverageNumber of
Books
Having aLibrary orReadingCorner inClassroom
Percentage of Students Whose Teachers Reported
If “Yes”,Students
Can BorrowBooks
Teachers Let Students Use the Library
Daily Weekly Less thanWeekly
Background data provided by teachers.
( ) Standard errors appear in parentheses. Because results are rounded to the nearest wholenumber, some totals may appear inconsistent.
An “r” indicates data are available for 70-84% of the students. An “s” indicates data are avail-able for 50-69% of the students. An “x” indicates data are available for less than 50% of thestudents.
A dash (–) indicates data are not available. A tilde (~) indicates insufficient data to reportachievement.
SOU
RCE:
IEA
Pro
gres
s in
Inte
rnat
iona
l Rea
ding
Lite
racy
Stu
dy (P
IRLS
) 200
1.
ISC 4th GradePIRLS 2001

[207]chapter 6: teachers and reading instruction
Exhibit 6.29: Frequency of Students’ School Library Visits
SOU
RCE:
IEA
Pro
gres
s in
Inte
rnat
iona
l Rea
ding
Lite
racy
Stu
dy (P
IRLS
) 200
1.
Argentina 15 (3.7) 16 (3.6) 41 (5.2) 16 (3.8) 12 (3.3)
Belize r 49 (5.0) 7 (2.2) 15 (3.8) 13 (3.0) 16 (4.6)
Bulgaria 13 (2.6) 13 (2.7) 41 (3.7) 33 (4.1) 0 (0.0)
Canada (O,Q) 3 (1.0) 4 (1.5) 81 (3.0) 11 (2.5) 0 (0.3)
Colombia 25 (4.3) 15 (3.3) 21 (3.6) 25 (4.2) 15 (2.9)
Cyprus 68 (4.2) 0 (0.3) 10 (3.0) 10 (3.3) 12 (3.3)
Czech Republic 7 (2.5) 3 (1.7) 30 (3.4) 47 (4.1) 13 (2.8)
England 7 (2.5) 10 (3.1) 50 (5.2) 26 (4.4) 7 (2.1)
France 19 (3.7) 6 (2.1) 51 (4.3) 16 (3.1) 7 (2.5)
Germany 53 (3.4) 1 (0.6) 19 (2.5) 16 (2.2) 11 (2.3)
Greece 22 (3.1) 4 (1.4) 36 (4.1) 29 (4.4) 9 (2.5)
Hong Kong, SAR 23 (3.9) 6 (2.1) 33 (4.8) 24 (4.3) 14 (2.8)
Hungary 3 (1.4) 11 (2.8) 47 (4.1) 38 (3.8) 1 (0.5)
Iceland 2 (0.1) 27 (0.3) 56 (0.4) 14 (0.3) 0 (0.1)
Iran, Islamic Rep. of 25 (3.5) 3 (1.2) 42 (4.7) 21 (2.6) 9 (2.4)
Israel r 11 (3.0) 8 (2.8) 52 (4.9) 17 (3.4) 11 (2.8)
Italy 20 (3.0) 4 (1.6) 12 (2.8) 33 (3.5) 30 (3.3)
Kuwait 2 (1.3) 1 (0.5) 60 (3.1) 36 (3.2) 2 (0.7)
Latvia 0 (0.0) 13 (3.1) 51 (4.7) 33 (4.4) 3 (1.4)
Lithuania 2 (1.1) 17 (3.1) 56 (4.2) 24 (3.6) 2 (1.3)
Macedonia, Rep. of 12 (2.6) 9 (2.5) 36 (4.1) 42 (4.5) 1 (0.7)
Moldova, Rep. of 9 (3.2) 34 (4.0) 48 (4.6) 6 (2.1) 2 (1.0)
Morocco r 73 (4.3) 0 (0.0) 11 (2.9) 8 (3.0) 8 (2.2)
Netherlands r 30 (4.6) 11 (3.0) 31 (4.5) 17 (3.7) 11 (2.4)
New Zealand 0 (0.1) 2 (1.2) 94 (2.2) 4 (1.9) 0 (0.2)
Norway 2 (0.9) 6 (2.0) 48 (4.5) 38 (4.5) 6 (1.9)
Romania 3 (1.1) 14 (3.0) 54 (4.2) 27 (3.9) 3 (1.5)
Russian Federation 5 (1.5) 17 (2.9) 57 (3.6) 21 (3.9) 1 (0.6)
Scotland 15 (3.4) 1 (1.0) 52 (4.6) 21 (4.0) 11 (3.1)
Singapore 3 (1.5) 3 (1.5) 49 (4.5) 31 (4.0) 14 (2.9)
Slovak Republic 6 (1.9) 4 (1.7) 21 (3.3) 63 (3.9) 5 (1.8)
Slovenia 0 (0.1) 45 (4.6) 46 (4.4) 8 (2.4) 1 (0.0)
Sweden 4 (1.5) 23 (3.1) 48 (3.6) 22 (2.8) 3 (1.1)
Turkey 33 (4.1) 7 (2.3) 28 (3.5) 24 (4.2) 8 (2.5)
United States 1 (0.9) 8 (2.2) 82 (3.3) 7 (2.0) 2 (0.6)
International Avg. 16 (0.5) 10 (0.4) 43 (0.7) 23 (0.6) 7 (0.4)
This SchoolDoes NotHave aLibrary
Never orAlmost Never
Once orTwice aMonth
Every Dayor AlmostEvery Day
Once orTwice a Week
Countries
Percentage of Students Whose Teachers Reported
Library Visits
Background data provided by teachers.
( ) Standard errors appear in parentheses. Because results are rounded to the nearest wholenumber, some totals may appear inconsistent.
An “r” indicates data are available for 70-84% of the students. An “s” indicates data are avail-able for 50-69% of the students. An “x” indicates data are available for less than 50% of thestudents.
A dash (–) indicates data are not available. A tilde (~) indicates insufficient data to reportachievement.
ISC 4th GradePIRLS 2001

[208] chapter 6: teachers and reading instruction
Exhibit 6.30: Students’ Overall Library Use in School*
Argentina 31 (4.3) 408 (9.9) 51 (4.3) 419 (8.9) 18 (4.2) 452 (14.5)
Belize r 72 (4.2) 332 (7.2) 22 (3.9) 306 (14.7) 6 (2.7) 322 (20.5)
Bulgaria 32 (3.8) 559 (7.7) 38 (3.4) 551 (4.9) 31 (3.9) 549 (10.3)
Canada (O,Q) 64 (3.4) 544 (3.0) 32 (3.2) 546 (4.0) 4 (1.8) 539 (7.0)
Colombia r 35 (4.6) 411 (8.3) 36 (4.6) 443 (6.8) 29 (4.8) 437 (11.3)
Cyprus 10 (2.4) 494 (8.0) 84 (3.4) 494 (3.6) 6 (2.7) 479 (10.5)
Czech Republic 36 (4.4) 545 (3.8) 30 (4.1) 533 (6.1) 34 (4.5) 533 (3.1)
England 60 (4.5) 554 (4.3) 34 (4.3) 552 (7.0) 6 (2.3) 568 (11.6)
France 55 (3.9) 527 (3.0) 40 (3.9) 523 (4.6) 5 (1.5) 523 (6.6)
Germany r 45 (3.1) 541 (3.5) 41 (3.3) 537 (3.0) 13 (2.3) 542 (3.9)
Greece r 20 (4.3) 534 (10.8) 50 (4.9) 531 (6.4) 30 (5.1) 517 (6.5)
Hong Kong, SAR r 20 (3.9) 537 (6.5) 58 (5.1) 526 (4.4) 21 (4.1) 524 (8.7)
Hungary 52 (4.3) 550 (3.3) 26 (3.8) 545 (5.8) 22 (3.4) 531 (5.5)
Iceland 40 (0.4) 514 (1.9) 52 (0.4) 511 (1.7) 8 (0.2) 514 (5.1)
Iran, Islamic Rep. of r 8 (2.4) 441 (18.5) 64 (4.4) 425 (7.6) 28 (3.8) 421 (12.1)
Israel 59 (4.0) 528 (4.5) 31 (4.1) 488 (9.5) 10 (2.5) 448 (24.3)
Italy 21 (2.9) 543 (4.7) 33 (3.6) 540 (5.1) 45 (3.7) 541 (4.5)
Kuwait 3 (1.2) 402 (16.4) 66 (3.3) 404 (5.6) 31 (3.3) 397 (6.2)
Latvia 54 (4.4) 547 (3.8) 28 (4.1) 537 (4.9) 19 (2.8) 550 (5.4)
Lithuania 50 (4.3) 540 (3.8) 36 (4.1) 542 (4.7) 14 (3.1) 557 (7.3)
Macedonia, Rep. of r 21 (3.4) 494 (10.0) 42 (4.7) 461 (7.9) 37 (4.6) 428 (9.4)
Moldova, Rep. of 61 (4.7) 497 (5.8) 37 (4.7) 486 (6.6) 2 (1.2) ~ ~
Morocco x x x x x x x x x x x x
Netherlands 61 (4.7) 551 (3.7) 34 (4.4) 559 (3.4) 5 (1.7) 562 (9.9)
New Zealand 86 (2.9) 527 (4.3) 12 (2.8) 543 (11.3) 1 (0.8) ~ ~
Norway 18 (3.5) 501 (6.8) 62 (4.1) 498 (3.9) 20 (3.3) 504 (6.7)
Romania 30 (4.3) 511 (9.6) 52 (4.3) 516 (6.3) 18 (3.5) 508 (12.6)
Russian Federation 68 (3.7) 531 (3.9) 26 (3.7) 520 (9.6) 6 (1.9) 528 (13.5)
Scotland 57 (4.9) 525 (5.4) 39 (4.7) 534 (5.7) 3 (2.0) 526 (9.6)
Singapore 47 (3.5) 528 (7.6) 43 (3.6) 533 (10.2) 10 (2.0) 504 (14.1)
Slovak Republic 25 (3.4) 518 (5.7) 35 (3.5) 521 (4.5) 39 (3.8) 516 (5.8)
Slovenia 66 (4.3) 502 (2.8) 30 (4.0) 502 (3.4) 4 (1.8) 499 (14.1)
Sweden 49 (3.5) 563 (3.5) 37 (3.4) 558 (3.2) 13 (2.6) 564 (5.5)
Turkey 48 (4.8) 461 (6.1) 49 (4.6) 445 (6.3) 3 (1.3) 443 (7.9)
United States 86 (2.7) 544 (4.3) 13 (2.5) 535 (8.5) 1 (0.6) ~ ~
International Avg. 44 (0.7) 509 (1.2) 40 (0.7) 505 (1.1) 16 (0.5) 501 (2.0)
Once or Twice a Week Less than Weekly
Countries
Percent ofStudents
AverageAchievement
Daily
Percent ofStudents
AverageAchievement
Percent ofStudents
AverageAchievement
( ) Standard errors appear in parentheses. Because results are rounded to the nearest wholenumber, some totals may appear inconsistent.
An “r” indicates data are available for 70-84% of the students. An “s” indicates data are avail-able for 50-69% of the students. An “x” indicates data are available for less than 50% of thestudents.
A dash (–) indicates data are not available. A tilde (~) indicates insufficient data to reportachievement.
SOU
RCE:
IEA
Pro
gres
s in
Inte
rnat
iona
l Rea
ding
Lite
racy
Stu
dy (P
IRLS
) 200
1.
ISC 4th GradePIRLS 2001
*Based on teachers’ responses to two questions: How often do you take orsend the students to the school library? How often do you give the studentsin your class time to use the classroom library or reading corner? Daily indi-cates students used either a classroom library (or reading corner) or schoollibrary every day or almost every day. Once or twice a week indicates students
used either a classroom library (or reading corner) or school library once ortwice a week. Less than weekly indicates students used both a classroomlibrary (or reading corner) and a school library once or twice a month or never.
[209]chapter 6: teachers and reading instruction
How Are Computers Used for Reading Instruction?
To explore the use of information technology in teaching reading, PIRLS askedteachers and students about the availability of computers and how they wereused. According to their teachers, half the fourth-grade students across allcountries had access to computers, but computer availability varied dramati-cally from country to country, as shown in Exhibit 6.31. Whereas almost all stu-dents (more than 90%) in Canada (O,Q), England, Iceland, The Netherlands,New Zealand, Scotland, Singapore, Sweden, and the United States had com-puters available in the classroom or elsewhere in the school, the large majority(more than 80%) in Belize, Bulgaria, Colombia, Greece, Iran, Kuwait, Mace-donia, Moldova, the Russian Federation, the Slovak Republic, and Turkey hadno access to computers. Among students with access, less than one-third (29%)were in classes with a computer in the classroom, and less than half (45%)had computers available somewhere else in the school. Classroom computerswere most common in Canada (O,Q), England, The Netherlands, New Zealand,Scotland, Sweden, and the United States.
Internet access for classes with computers available also varied con-siderably. Countries with high levels of computer availability and high levelsof Internet access included Canada (O,Q), Iceland, New Zealand, Sweden, andthe United States, where almost all students had access to computers withInternet connections, according to their teachers.
Exhibit 6.31 also presents teachers’ reports of students’ use of the com-puter for developing reading skills and strategies, reading stories, and writingstories. On average, less than one-third (32%) of students in classes with accessto computers used them for writing stories or other texts at least once a month.Among countries with high levels of computer availability, use of the com-puter for writing was most common in England and New Zealand, where morethan 90 percent of students were in classes where this occurred at least monthly,but Canada (O,Q), Iceland, Scotland, Sweden, and the United States also hadhigh percentages of students in this category. Teachers generally reported lessfrequently asking students to use the computer for reading stories or developingreading skills and strategies – these activities were most common inCanada (O,Q), New Zealand, Singapore, and the United States.

[210]
On average, across countries, 70 percent of students reported that theyhad used a computer at some time, and in about one-third of the countries thisapplied to almost all students (more than 90%). Computer use was more fre-quent at home than in school, on average, but relatively high use both at homeand school was reported in Canada (O,Q), England, Hong Kong, Scotland, andthe United States (Exhibit 6.32).
chapter 6: teachers and reading instruction

[211]chapter 6: teachers and reading instruction
Exhibit 6.31: Computer Availability and Instructional Use
SOU
RCE:
IEA
Pro
gres
s in
Inte
rnat
iona
l Rea
ding
Lite
racy
Stu
dy (P
IRLS
) 200
1.
Argentina 70 (4.0) 4 (1.9) 26 (3.6) 10 (2.4) 10 (2.5) 11 (2.3) 19 (3.3)
Belize r 95 (1.9) r 2 (0.9) r 2 (1.0) r 1 (1.3) r 1 (0.6) r 0 (0.3) r 1 (0.4)
Bulgaria 81 (3.1) 0 (0.0) 18 (3.0) 7 (2.1) 3 (1.4) 6 (2.0) 5 (1.8)
Canada (O,Q) 3 (1.0) 81 (2.6) 92 (1.8) 93 (1.6) 42 (2.7) 60 (3.0) 74 (3.1)
Colombia 89 (2.5) 1 (0.5) 8 (2.1) 4 (1.6) 5 (1.7) 5 (1.7) 6 (1.9)
Cyprus 70 (4.4) 6 (2.8) 28 (4.5) 28 (4.4) 10 (3.4) 16 (3.6) 24 (4.3)
Czech Republic 38 (3.8) r 11 (2.8) 59 (4.0) 43 (4.4) 16 (3.3) 13 (2.8) 10 (2.9)
England 1 (1.2) r 88 (3.2) 95 (2.1) 86 (3.3) 55 (4.7) 56 (4.8) 93 (2.2)
France 17 (3.6) r 41 (4.7) r 76 (4.3) 51 (4.8) 29 (3.8) 30 (3.9) 62 (3.5)
Germany 39 (3.0) 45 (3.9) r 45 (3.5) 28 (3.0) 32 (3.3) 25 (2.9) 35 (3.8)
Greece 82 (3.3) 0 (0.0) 17 (3.3) 9 (1.7) 6 (2.8) 8 (3.0) 7 (2.9)
Hong Kong, SAR 21 (4.2) r 31 (4.5) 75 (4.7) 72 (4.6) 28 (4.0) 31 (4.1) 7 (2.3)
Hungary 61 (4.7) 3 (1.5) 36 (4.6) 26 (3.8) 4 (1.6) 4 (1.4) 10 (2.7)
Iceland 8 (0.2) 63 (0.4) 90 (0.2) 87 (0.3) 53 (0.3) 44 (0.4) 73 (0.3)
Iran, Islamic Rep. of 99 (0.7) 0 (0.5) 1 (0.5) 0 (0.0) 0 (0.1) 0 (0.1) 0 (0.1)
Israel 51 (3.4) r 27 (3.9) 41 (3.6) 33 (3.8) 25 (4.0) 31 (4.2) 45 (3.9)
Italy 37 (3.2) r 5 (1.8) 60 (3.1) 37 (3.8) 19 (2.9) 19 (2.9) 36 (3.4)
Kuwait 96 (2.0) 0 (0.0) 3 (1.7) 0 (0.0) 4 (1.9) 4 (1.9) 3 (1.9)
Latvia 63 (3.8) r 2 (1.4) 34 (3.9) 26 (3.5) 5 (1.8) 8 (2.3) 17 (3.2)
Lithuania 76 (3.7) 1 (1.0) 20 (3.7) 14 (3.2) 4 (1.6) 8 (2.4) 9 (2.6)
Macedonia, Rep. of 85 (3.2) 2 (1.3) 6 (2.0) 2 (1.1) 5 (1.7) 5 (1.7) 3 (1.3)
Moldova, Rep. of r 86 (2.8) r 1 (0.0) r 5 (2.4) r 0 (0.0) r 0 (0.4) r 2 (1.4) r 0 (0.4)
Morocco 76 (4.6) r 1 (0.8) r 5 (2.2) r 1 (0.0) 1 (1.0) 1 (1.0) 1 (1.0)
Netherlands 3 (2.0) r 90 (2.8) s 92 (3.2) 47 (4.6) 29 (4.1) 25 (3.9) 50 (4.7)
New Zealand 0 (0.2) 94 (2.1) r 85 (3.8) 91 (2.7) 44 (4.5) 60 (4.6) 96 (1.6)
Norway 14 (3.2) 58 (4.1) 83 (3.2) 71 (4.4) 47 (3.9) 27 (3.8) 61 (4.3)
Romania 74 (4.0) r 1 (0.0) 17 (3.4) 5 (1.9) 5 (2.1) 10 (2.6) 14 (3.1)
Russian Federation 91 (2.3) 0 (0.0) 9 (2.3) 1 (0.7) 2 (1.0) 4 (1.4) 4 (2.2)
Scotland 2 (1.3) 96 (1.7) r 81 (4.3) 60 (4.0) 49 (4.9) 58 (5.0) 80 (4.2)
Singapore 9 (2.3) 56 (4.2) 88 (2.7) 78 (2.9) 56 (4.1) 67 (3.4) 55 (4.5)
Slovak Republic 84 (3.0) 0 (0.0) 15 (2.9) 5 (1.8) 1 (0.5) 3 (1.5) 3 (1.5)
Slovenia 32 (3.8) 7 (2.2) 66 (4.0) 64 (3.9) 28 (3.7) 33 (3.8) 33 (4.3)
Sweden 1 (0.6) 89 (2.6) r 91 (2.0) 93 (1.6) 48 (3.5) 46 (2.7) 88 (1.5)
Turkey 82 (3.4) 2 (1.2) 18 (3.3) 9 (2.2) 5 (2.2) 7 (2.5) 11 (1.8)
United States 2 (1.1) 92 (2.3) 93 (2.4) 92 (1.8) 66 (4.1) 60 (4.2) 74 (3.8)
International Avg. 50 (0.5) 29 (0.4) 45 (0.5) 36 (0.5) 21 (0.5) 22 (0.5) 32 (0.5)
Countries
Percentage of Students Whose Teachers Reported
In Classroom Elsewherein School
Computers Not Available
Computers Available
Have InternetAccess
Percentage of Students Whose TeachersReported Instructional Uses
at Least Monthly
Students UseInstructionalSoftware to
DevelopReading Skillsand Strategies
StudentsRead Stories orOther Texts onthe Computer
Students WriteStories or Other
Texts on theComputer
Background data provided by teachers.
( ) Standard errors appear in parentheses. Because results are rounded to the nearest wholenumber, some totals may appear inconsistent.
An “r” indicates data are available for 70-84% of the students. An “s” indicates data are avail-able for 50-69% of the students. An “x” indicates data are available for less than 50% of thestudents.
A dash (–) indicates data are not available. A tilde (~) indicates insufficient data to reportachievement.
ISC 4th GradePIRLS 2001

[212] chapter 6: teachers and reading instruction
Exhibit 6.32: Students’ Reports on Computer Use
Argentina r 62 (2.0) r 33 (1.8) r 28 (2.4) r 29 (1.6)
Belize r 47 (3.6) r 24 (2.4) r 10 (1.6) r 20 (1.5)
Bulgaria 60 (2.1) 21 (1.2) r 10 (1.5) 32 (1.4)
Canada (O,Q) 94 (0.4) 76 (0.8) 69 (1.7) 31 (1.0)
Colombia 54 (3.2) 18 (1.6) 37 (3.4) 19 (1.5)
Cyprus 59 (1.7) 44 (1.6) 15 (1.7) 19 (1.1)
Czech Republic 75 (1.3) 50 (1.4) 18 (1.8) 22 (1.0)
England 97 (0.4) 74 (1.0) 67 (2.7) 29 (1.0)
France 95 (0.5) 60 (1.0) 38 (2.8) 24 (0.9)
Germany 85 (0.6) 66 (0.8) 17 (1.5) 19 (0.7)
Greece 62 (2.0) 37 (1.8) 13 (2.4) 26 (1.2)
Hong Kong, SAR 95 (0.5) 61 (1.3) 68 (2.6) 19 (0.6)
Hungary 77 (1.5) 52 (1.2) 28 (3.1) 23 (1.0)
Iceland 91 (0.5) 69 (0.9) 59 (0.8) 28 (0.9)
Iran, Islamic Rep. of 11 (1.1) 7 (0.8) 1 (0.3) 5 (0.5)
Israel 93 (0.6) 78 (0.8) 59 (2.6) 43 (1.0)
Italy 75 (1.2) 53 (1.0) 24 (2.5) 17 (0.7)
Kuwait r 64 (1.7) s 48 (1.6) s 9 (0.9) s 23 (1.1)
Latvia 58 (1.7) 25 (1.2) 17 (2.3) 20 (0.9)
Lithuania 53 (1.7) 29 (1.3) 7 (1.3) 19 (1.0)
Macedonia, Rep. of 60 (2.1) 32 (1.7) 8 (0.9) 28 (1.4)
Moldova, Rep. of r 21 (1.9) r 6 (0.8) r 5 (1.1) r 7 (0.8)
Morocco 32 (3.1) r 18 (2.1) r 9 (1.7) r 12 (1.6)
Netherlands 93 (0.5) 76 (0.9) 50 (2.9) 24 (0.8)
New Zealand 94 (0.6) 70 (1.2) 59 (2.2) 38 (1.4)
Norway 92 (0.7) 70 (1.0) 22 (2.3) 27 (1.2)
Romania 42 (2.4) 18 (1.5) 13 (2.3) 17 (1.4)
Russian Federation 37 (1.8) 12 (0.7) 6 (1.1) 16 (0.8)
Scotland 95 (0.7) 68 (0.9) 63 (3.0) 34 (1.1)
Singapore 94 (0.4) 70 (0.7) 39 (1.9) 25 (0.8)
Slovak Republic 54 (1.6) 34 (1.2) 5 (0.9) 17 (0.9)
Slovenia 78 (1.1) 58 (1.2) 16 (1.5) 28 (1.2)
Sweden 97 (0.3) 75 (0.7) 35 (2.0) 25 (0.8)
Turkey 44 (3.0) 15 (1.3) 22 (3.4) 18 (1.3)
United States 94 (0.5) 71 (1.2) 70 (2.2) 32 (1.3)
International Avg. 70 (0.3) 46 (0.2) 29 (0.4) 23 (0.2)
At Home At School At SomeOther Place
Countries
Percentage ofStudents WhoReported Ever
Using aComputer
Percentage of Students Who ReportedUsing a Computer at Least Weekly
Background data provided by students.
( ) Standard errors appear in parentheses. Because results are rounded to the nearest wholenumber, some totals may appear inconsistent.
An “r” indicates data are available for 70-84% of the students. An “s” indicates data are avail-able for 50-69% of the students. An “x” indicates data are available for less than 50% of thestudents.
A dash (–) indicates data are not available. A tilde (~) indicates insufficient data to reportachievement.
SOU
RCE:
IEA
Pro
gres
s in
Inte
rnat
iona
l Rea
ding
Lite
racy
Stu
dy (P
IRLS
) 200
1.
ISC 4th GradePIRLS 2001

[213]chapter 6: teachers and reading instruction
What Is the Role of Reading Homework?
According to students’ reports presented in Exhibit 6.33, most students (82%)were given reading for homework at least once a week, and 60 percent at leastthree times a week. When they have reading homework, students reportedspending, on average, just over half an hour on it. Countries where studentsreported the greatest amounts of reading homework included Cyprus, Greece,Lithuania, Moldova, Romania, the Russian Federation, and the Slovak Republic,where more than 80 percent reported having homework three or more times aweek. Students in The Netherlands, one of the highest-performing countries,reported being assigned the least homework – 55 percent of students were inclasses where reading homework was assigned less than once a week or never.
To provide the teacher’s perspective on homework, PIRLS developed anIndex of Reading for Homework that combined the amount of reading home-work teachers reported assigning with the frequency with which they assignedit. Students at the high level of the index were expected to spend more than30 minutes on reading homework at least once a week, those at the low levelno more than 30 minutes less than once a week, and those at the medium levelall other combinations. As shown in Exhibit 6.34, reading homework assign-ment practice varies enormously across the PIRLS countries, from 90 percentof students at the high level in Hungary to just 5 percent in The Netherlands.On average, internationally, 44 percent of students were at the high level, 46percent at the medium, and just 10 percent at the low level.

[214] chapter 6: teachers and reading instruction
Exhibit 6.33: Students Assigned Reading for Homework
Argentina r 51 (1.6) 435 (6.5) 24 (1.1) 449 (5.7) 18 (1.2) 435 (6.9) 7 (0.6) 402 (10.4) r 0.6 (0.01)
Belize r 51 (2.4) 329 (6.6) 27 (1.9) 336 (7.7) 20 (1.4) 340 (7.2) 2 (0.4) ~ ~ 0.6 (0.02)
Bulgaria 71 (1.7) 556 (3.9) 18 (1.1) 554 (5.4) 9 (1.0) 556 (5.7) 2 (0.3) ~ ~ 0.7 (0.01)
Canada (O,Q) 51 (1.7) 539 (2.7) 25 (1.3) 556 (3.3) 19 (0.8) 552 (4.3) 6 (0.6) 542 (7.2) 0.5 (0.01)
Colombia 65 (1.7) 421 (4.1) 22 (1.4) 452 (7.5) 10 (0.7) 426 (7.7) 3 (0.4) 379 (13.4) 0.8 (0.01)
Cyprus 85 (0.9) 501 (2.7) 7 (0.5) 470 (8.4) 6 (0.7) 462 (8.8) 2 (0.2) ~ ~ 0.5 (0.01)
Czech Republic 33 (2.9) 537 (2.5) 29 (2.0) 539 (4.0) 29 (1.8) 536 (4.0) 10 (1.4) 546 (6.5) 0.5 (0.01)
England 36 (2.7) 558 (4.7) 35 (2.1) 556 (4.0) 22 (1.6) 553 (4.8) 7 (1.0) 547 (10.0) 0.5 (0.01)
France 44 (2.3) 522 (3.0) 31 (1.7) 536 (3.0) 23 (1.6) 525 (4.1) 2 (0.4) ~ ~ 0.5 (0.01)
Germany 30 (1.8) 529 (3.3) 30 (1.2) 548 (2.1) 37 (1.4) 545 (2.3) 3 (0.4) 547 (8.7) 0.4 (0.01)
Greece 87 (1.2) 531 (3.5) 7 (0.9) 509 (7.9) 5 (0.6) 468 (9.2) 0 (0.1) ~ ~ 0.9 (0.01)
Hong Kong, SAR 31 (1.0) 525 (3.3) 33 (1.0) 539 (3.2) 32 (1.1) 529 (3.5) 4 (0.4) 501 (6.8) 0.5 (0.01)
Hungary 76 (1.7) 543 (2.3) 16 (1.3) 549 (4.8) 8 (0.8) 546 (6.8) 0 (0.2) ~ ~ 0.6 (0.01)
Iceland 79 (0.8) 514 (1.4) 11 (0.7) 527 (4.3) 8 (0.4) 508 (5.6) 2 (0.2) ~ ~ 0.4 (0.01)
Iran, Islamic Rep. of 73 (1.6) 417 (5.0) 14 (1.0) 419 (6.1) 12 (0.9) 408 (6.5) 1 (0.2) ~ ~ 0.9 (0.01)
Israel 48 (1.3) 500 (3.5) 28 (0.9) 529 (4.0) 19 (0.9) 527 (5.6) 5 (0.5) 524 (8.1) 0.6 (0.01)
Italy 60 (1.4) 542 (3.0) 27 (1.4) 550 (3.1) 12 (0.8) 539 (4.7) 1 (0.2) ~ ~ 0.5 (0.01)
Kuwait r 66 (1.4) 400 (3.9) 18 (0.9) 407 (7.0) 12 (0.7) 405 (7.1) 4 (0.4) 400 (12.4) r 0.5 (0.01)
Latvia 76 (1.5) 547 (2.5) 16 (1.1) 545 (3.5) 7 (0.8) 534 (6.2) 1 (0.2) ~ ~ 0.6 (0.01)
Lithuania 85 (1.1) 546 (2.5) 9 (0.8) 551 (5.7) 6 (0.6) 525 (7.2) 1 (0.2) ~ ~ 0.6 (0.01)
Macedonia, Rep. of 79 (1.5) 450 (4.3) 11 (0.8) 459 (9.4) 8 (1.1) 444 (11.3) 2 (0.3) ~ ~ 0.9 (0.01)
Moldova, Rep. of 94 (0.9) 495 (3.9) 4 (0.6) 483 (9.0) 2 (0.4) ~ ~ 1 (0.2) ~ ~ 0.8 (0.02)
Morocco r 74 (2.3) 355 (9.2) 16 (1.9) 357 (17.3) 8 (0.8) 352 (11.6) 1 (0.3) ~ ~ 0.7 (0.01)
Netherlands 19 (1.3) 545 (3.7) 26 (1.5) 552 (3.5) 30 (1.5) 558 (3.2) 25 (2.2) 564 (3.5) 0.3 (0.01)
New Zealand 47 (2.7) 536 (4.8) 23 (1.6) 538 (5.9) 19 (1.4) 529 (7.4) 11 (1.2) 518 (9.9) 0.5 (0.01)
Norway 70 (2.7) 501 (3.5) 24 (2.3) 505 (4.1) 6 (0.7) 466 (6.5) 1 (0.1) ~ ~ 0.3 (0.01)
Romania 80 (1.6) 517 (4.7) 13 (1.2) 524 (8.9) 7 (0.6) 495 (7.9) 1 (0.2) ~ ~ 0.8 (0.01)
Russian Federation 88 (0.8) 531 (3.9) 8 (0.6) 524 (11.8) 4 (0.5) 500 (8.9) 1 (0.2) ~ ~ 0.7 (0.01)
Scotland 34 (3.1) 509 (5.4) 48 (2.9) 548 (3.7) 13 (1.5) 518 (7.2) 5 (1.2) 527 (9.4) 0.4 (0.01)
Singapore 36 (1.4) 513 (5.8) 35 (0.9) 545 (4.9) 22 (0.9) 538 (6.1) 8 (0.5) 546 (7.6) 0.6 (0.01)
Slovak Republic 87 (1.4) 521 (2.8) 7 (0.8) 521 (6.5) 5 (0.8) 511 (14.0) 1 (0.4) ~ ~ 0.5 (0.01)
Slovenia 49 (1.9) 492 (2.9) 26 (1.3) 514 (3.5) 23 (1.2) 511 (3.0) 2 (0.3) ~ ~ 0.4 (0.01)
Sweden 38 (2.0) 557 (3.3) 44 (1.8) 566 (2.7) 16 (1.2) 558 (3.7) 2 (0.3) ~ ~ 0.5 (0.01)
Turkey 78 (1.6) 452 (3.9) 16 (1.3) 447 (7.1) 6 (0.5) 423 (8.1) 0 (0.1) ~ ~ 0.8 (0.01)
United States 44 (2.5) 540 (4.6) 28 (1.7) 547 (4.7) 19 (1.2) 547 (5.6) 8 (1.4) 546 (8.6) 0.5 (0.01)
International Avg. 60 (0.3) 500 (0.7) 22 (0.2) 507 (1.1) 14 (0.2) 496 (1.1) 4 (0.1) 506 (2.9) 0.6 (0.00)
AverageAchievement
3 or More Timesa Week
Percent ofStudents
NeverAverage
Hours perDay Spent onReading forHomework
Countries1-2 Times a Week Less than Once
a Week
AverageAchievement
Percent ofStudents
AverageAchievement
Percent ofStudents
AverageAchievement
Percent ofStudents
Background data provided by students.
( ) Standard errors appear in parentheses. Because results are rounded to the nearest wholenumber, some totals may appear inconsistent.
An “r” indicates data are available for 70-84% of the students. An “s” indicates data are avail-able for 50-69% of the students. An “x” indicates data are available for less than 50% of thestudents.
A dash (–) indicates data are not available. A tilde (~) indicates insufficient data to reportachievement.
SOU
RCE:
IEA
Pro
gres
s in
Inte
rnat
iona
l Rea
ding
Lite
racy
Stu
dy (P
IRLS
) 200
1.
ISC 4th GradePIRLS 2001

[215]chapter 6: teachers and reading instruction
Exhibit 6.34: Index of Reading for Homework (RFH)
SOU
RCE:
IEA
Pro
gres
s in
Inte
rnat
iona
l Rea
ding
Lite
racy
Stu
dy (P
IRLS
) 200
1.
Hungary 90 (2.6) 544 (2.4) 9 (2.5) 548 (10.0) 1 (0.0) ~ ~
Moldova, Rep. of 90 (2.8) 493 (4.4) 10 (2.8) 488 (13.5) 0 (0.0) ~ ~
Macedonia, Rep. of 82 (3.3) 447 (5.9) 16 (3.1) 434 (11.5) 1 (0.9) ~ ~
Greece 79 (3.8) 525 (4.0) 21 (3.8) 527 (7.3) 0 (0.0) ~ ~
Bulgaria 75 (3.8) 553 (3.9) 22 (3.5) 549 (10.2) 3 (1.6) 501 (25.8)
Russian Federation 72 (3.5) 528 (4.4) 26 (3.5) 528 (8.5) 1 (0.7) ~ ~
Romania 72 (3.4) 508 (5.7) 25 (3.5) 522 (6.7) 3 (1.4) 512 (11.7)
Colombia 65 (4.5) 419 (6.8) 27 (4.0) 447 (5.8) 8 (3.4) 412 (24.2)
Turkey 61 (4.6) 447 (4.3) 35 (4.5) 457 (6.4) 4 (1.6) 410 (20.0)
Iran, Islamic Rep. of 58 (4.2) 412 (7.1) 33 (3.4) 422 (6.8) 9 (2.7) 404 (9.2)
Argentina 54 (5.4) 428 (7.7) 39 (5.2) 409 (11.3) 7 (2.4) 407 (12.6)
Sweden 52 (3.0) 561 (3.0) 37 (2.9) 562 (3.8) 11 (2.1) 562 (4.0)
Israel 51 (4.6) 518 (6.5) 41 (4.8) 500 (7.4) 7 (2.4) 474 (32.3)
Belize r 51 (7.5) 325 (9.1) 39 (6.5) 328 (11.3) 10 (4.0) 326 (20.5)
Morocco r 50 (5.2) 355 (16.0) 41 (5.0) 335 (9.7) 9 (3.0) 331 (26.7)
Lithuania 50 (4.0) 546 (4.2) 47 (4.1) 541 (4.0) 3 (1.4) 526 (19.3)
Latvia 50 (3.8) 543 (3.7) 49 (3.9) 548 (3.0) 1 (0.9) ~ ~
Italy 47 (3.8) 536 (3.9) 48 (3.9) 545 (3.9) 4 (1.4) 545 (14.2)
Singapore 39 (3.8) 548 (7.6) 30 (3.5) 511 (9.6) 31 (3.3) 526 (9.2)
United States 33 (3.7) 532 (7.2) 53 (3.8) 548 (5.4) 13 (3.0) 539 (11.0)
Slovenia 32 (3.8) 502 (3.9) 62 (3.9) 502 (2.6) 5 (1.9) 516 (10.9)
Slovak Republic 31 (4.1) 521 (6.1) 68 (4.2) 519 (3.5) 1 (1.0) ~ ~
Kuwait 30 (3.9) 402 (8.6) 58 (4.3) 399 (5.8) 12 (2.8) 386 (15.6)
Hong Kong, SAR 29 (4.6) 527 (6.4) 44 (4.3) 533 (5.0) 27 (3.5) 526 (5.4)
Iceland 29 (0.3) 511 (1.9) 68 (0.4) 514 (1.6) 3 (0.1) 516 (8.3)
England 25 (3.8) 554 (9.5) 61 (4.4) 554 (3.8) 13 (3.1) 565 (8.6)
Norway 21 (3.4) 497 (6.6) 78 (3.3) 500 (3.3) 1 (0.6) ~ ~
Canada (O,Q) 19 (3.0) 551 (4.7) 65 (3.4) 542 (3.0) 15 (2.5) 545 (6.4)
Cyprus 17 (3.8) 490 (7.1) 81 (3.9) 494 (3.3) 2 (1.3) ~ ~
Czech Republic 15 (3.4) 534 (7.9) 75 (3.9) 537 (2.8) 10 (2.7) 542 (6.2)
New Zealand 15 (3.2) 539 (9.1) 69 (4.4) 529 (4.7) 17 (3.6) 516 (14.7)
Scotland 14 (3.3) 519 (9.3) 76 (4.2) 529 (4.1) 10 (3.1) 540 (11.7)
France 13 (2.7) 526 (5.2) 64 (4.1) 527 (3.1) 24 (3.3) 522 (6.6)
Germany 6 (1.8) 529 (8.1) 82 (2.5) 541 (2.0) 12 (1.9) 541 (4.7)
Netherlands r 5 (1.9) 557 (13.5) 24 (3.5) 559 (4.8) 71 (3.6) 554 (3.3)
International Avg. 44 (0.6) 501 (1.2) 46 (0.7) 501 (1.1) 10 (0.4) 490 (2.7)
Percentage of Students atHigh Level of RFH
HighRFH
MediumRFH
Countries
LowRFH
AverageAchievement
Percent ofStudents
AverageAchievement
Percent ofStudents
AverageAchievement
Percent ofStudents
0 50 7525 100
( ) Standard errors appear in parentheses. Because results are rounded to the nearest wholenumber, some totals may appear inconsistent.
An “r” indicates data are available for 70-84% of the students. An “s” indicates data are avail-able for 50-69% of the students. An “x” indicates data are available for less than 50% of thestudents.
A dash (–) indicates data are not available. A tilde (~) indicates insufficient data to reportachievement.
ISC 4th GradePIRLS 2001
Index of Reading for Homework (RFH)
Based on teachers’ responses to two questions: How often doyou assign reading as part of homework (for any subject)? Ingeneral, how much time do you expect students to spend onhomework involving reading (for any subject) each time youassign it? High level indicates students are expected to spend
more than 30 minutes at least 1-2 times a week. Low levelindicates students are never assigned homework or areexpected to spend no more than 30 minutes less than once aweek. Medium level indicates all other combinations of fre-quencies.

[216]
How Do Teachers Assess Reading Progress?
Teachers have a range of options available to them when it comes to moni-toring students’ progress in reading, including a variety of classroom, stan-dardized and diagnostic tests, external examinations, and other less formalmethods such as portfolios of students’ work, and observation of performancein class. As may be seen from Exhibit 6.35, teachers relied most on their ownprofessional opinion when monitoring student progress. On average, 70percent of students were in classes where teachers reported placing majoremphasis on professional opinion, compared to 55 percent where the empha-sis was on classroom tests, 39 percent on diagnostic tests, 23 percent onnational or regional examinations, and 16 percent on standardized tests. InCyprus, Greece, Scotland, and Sweden, more than 90 percent of studentswere taught by teachers placing major emphasis on professional opinion formonitoring progress.
Assembling samples of a student’s work into a collection or portfoliohas become a popular approach to tracking student progress in recent years.Portfolios have the advantage that they serve as a positive record of thestudent’s accomplishments that is readily understood by the student andeasily communicated to parents and to other professionals. Exhibit 6.36 showsthat, internationally, portfolios were a popular supplementary source forassessing student progress in reading, with more than half the students (55%),on average, taught by teachers that used portfolios in this way. In addition, 25percent of students had teachers that reported using portfolios as a majorresource in assessing their students. Teachers in France relied particularly onportfolios for assessment – 72 percent of French students had teachers usingportfolios as a major source of information.
Exhibit 6.37 presents teachers’ reports on their use of a range of otherapproaches for assessing fourth-grade student performance in reading. Oralquestioning of students and listening to students read aloud were most fre-quently reported, with 82 percent and 79 percent of students, respectively,in classes where teachers reported using these methods at least weekly. Theemphasis on oral assessment was particularly strong in Bulgaria, Cyprus,Greece, Iran, Moldova, Morocco, Romania, the Russian Federation, Scotland,
chapter 6: teachers and reading instruction

[217]chapter 6: teachers and reading instruction
and Turkey, where essentially all students were in classes where it was atleast a weekly occurrence.
Next in popularity among teachers for assessment were short answerwritten questions on the material read, and students giving an oral summaryor report of what they have read. More than half the students, internation-ally, on average, had teachers reporting that they used these techniques atleast weekly. Teachers reported using multiple-choice questions and para-graph-length written responses about what they had read for 40 percent and30 percent of students, respectively.

[218] chapter 6: teachers and reading instruction
Exhibit 6.35: Emphasis on Sources to Monitor Students’ Progress in Reading
Argentina r 73 (4.1) 59 (5.1) 58 (4.6) 15 (2.9) r 8 (2.5)
Belize r 55 (5.3) r 74 (3.7) r 39 (5.2) r 15 (3.7) r 16 (4.6)
Bulgaria 84 (2.9) 71 (3.8) 37 (4.0) 28 (3.8) 60 (3.8)
Canada (O,Q) 74 (3.2) 53 (3.4) 23 (2.6) 11 (1.9) 7 (1.7)
Colombia 68 (4.5) 65 (4.0) 60 (4.6) 7 (2.2) 3 (1.4)
Cyprus 91 (3.1) 50 (4.4) 54 (4.5) 3 (2.0) 0 (0.2)
Czech Republic 62 (4.0) 34 (4.9) 19 (3.5) 2 (1.1) 2 (1.7)
England 80 (3.8) 24 (4.5) 31 (4.8) 40 (5.2) 13 (3.3)
France 80 (3.2) 74 (3.4) 44 (4.1) 26 (3.4) 10 (2.0)
Germany 49 (3.2) 33 (3.2) 20 (2.6) r 4 (1.5) r 6 (1.7)
Greece 95 (1.9) 84 (3.4) – – – – 5 (2.2)
Hong Kong, SAR 28 (3.8) 40 (4.6) 27 (4.1) 11 (2.5) 5 (1.9)
Hungary 77 (3.9) 78 (3.3) 41 (4.3) 29 (3.8) 15 (2.9)
Iceland 56 (0.3) 14 (0.3) 31 (0.4) 11 (0.2) 36 (0.4)
Iran, Islamic Rep. of 62 (4.1) 76 (3.2) 61 (4.3) 22 (2.9) 20 (3.2)
Israel 71 (4.3) 64 (4.1) 44 (4.7) 19 (3.6) r 7 (2.1)
Italy 77 (3.4) 82 (3.0) 49 (3.9) 4 (1.8) 16 (2.6)
Kuwait r 56 (4.2) 72 (3.3) r 52 (3.8) r 39 (3.4) r 18 (3.1)
Latvia 63 (4.4) 44 (3.7) 33 (4.0) 24 (2.9) 17 (2.4)
Lithuania 80 (3.9) 66 (4.2) 23 (3.4) – – 12 (3.0)
Macedonia, Rep. of 79 (3.8) 70 (4.0) 35 (4.4) 26 (4.0) 23 (3.7)
Moldova, Rep. of 68 (4.5) 92 (2.3) 55 (4.5) 65 (4.5) 38 (4.9)
Morocco r 77 (4.5) 71 (4.5) r 69 (4.6) r 16 (4.0) r 34 (5.1)
Netherlands 78 (3.6) 58 (4.4) 74 (4.0) 71 (3.8) r 18 (3.2)
New Zealand 68 (4.3) 19 (3.5) 56 (4.7) – – 19 (3.6)
Norway 69 (4.0) 13 (2.9) 29 (3.7) – – 15 (3.0)
Romania 73 (4.4) 85 (3.4) 41 (4.6) 19 (3.8) 17 (3.8)
Russian Federation 71 (3.6) 69 (3.4) 64 (3.8) 27 (3.2) 43 (4.0)
Scotland 92 (2.5) 26 (4.0) 14 (2.6) 51 (5.3) 6 (2.6)
Singapore 45 (3.5) 47 (3.8) 14 (2.7) 52 (3.7) 19 (3.2)
Slovak Republic 47 (4.4) 35 (3.8) 19 (3.1) 3 (1.4) 14 (3.0)
Slovenia 67 (4.1) 49 (4.1) 15 (3.0) 3 (1.5) 3 (1.5)
Sweden 90 (1.8) 12 (1.8) 24 (2.6) 39 (3.1) 11 (1.8)
Turkey 75 (3.9) 80 (3.0) 36 (4.7) 10 (2.4) 16 (3.2)
United States 69 (4.4) 52 (3.3) 24 (4.2) 16 (3.0) 19 (3.2)
International Avg. 70 (0.6) 55 (0.6) 39 (0.7) 23 (0.6) 16 (0.5)
Countries
Percentage of Students Whose Teachers Reported PlacingMajor Emphasis on Various Sources
StandardizedTests
Teacher'sOwn
ProfessionalOpinion
ClassroomTests
DiagnosticTests
National orRegional
Examinations
Background data provided by teachers.
( ) Standard errors appear in parentheses. Because results are rounded to the nearest wholenumber, some totals may appear inconsistent.
An “r” indicates data are available for 70-84% of the students. An “s” indicates data are avail-able for 50-69% of the students. An “x” indicates data are available for less than 50% of thestudents.
A dash (–) indicates data are not available. A tilde (~) indicates insufficient data to reportachievement.
SOU
RCE:
IEA
Pro
gres
s in
Inte
rnat
iona
l Rea
ding
Lite
racy
Stu
dy (P
IRLS
) 200
1.
ISC 4th GradePIRLS 2001

[219]chapter 6: teachers and reading instruction
Exhibit 6.36: Use of Portfolios (Collections of Students’ Work) to MonitorStudents’ Progress in Reading
SOU
RCE:
IEA
Pro
gres
s in
Inte
rnat
iona
l Rea
ding
Lite
racy
Stu
dy (P
IRLS
) 200
1.
Argentina 57 (4.7) 415 (8.1) 38 (5.0) 423 (10.0) 5 (2.3) 416 (18.2)
Belize 19 (3.8) 328 (14.7) 50 (5.6) 323 (8.2) 31 (6.0) 324 (13.9)
Bulgaria 34 (4.1) 554 (6.6) 63 (4.3) 549 (5.0) 3 (1.5) 533 (52.9)
Canada (O,Q) 27 (3.2) 550 (4.2) 49 (3.5) 546 (3.6) 25 (2.6) 539 (4.7)
Colombia 49 (4.5) 422 (7.5) 31 (4.0) 429 (8.9) 19 (3.7) 410 (9.8)
Cyprus 17 (3.3) 504 (7.5) 59 (5.8) 492 (3.9) 24 (5.0) 487 (6.3)
Czech Republic 11 (2.5) 549 (9.9) 59 (4.3) 535 (3.2) 29 (3.9) 537 (3.5)
England 20 (4.3) 542 (7.0) 68 (4.6) 558 (4.7) 12 (3.1) 553 (8.3)
France 72 (3.2) 526 (2.7) 26 (3.0) 521 (4.9) 3 (1.5) 520 (8.5)
Germany 13 (2.2) 525 (6.7) 59 (2.9) 540 (2.9) 28 (3.1) 546 (3.1)
Greece 39 (4.7) 525 (7.2) 47 (4.4) 525 (5.8) 13 (2.9) 530 (8.2)
Hong Kong, SAR 14 (3.1) 519 (8.4) 34 (4.2) 530 (5.8) 52 (4.8) 530 (4.4)
Hungary 28 (3.3) 536 (4.6) 43 (4.3) 549 (3.9) 29 (3.2) 545 (5.0)
Iceland 22 (0.3) 519 (2.3) 64 (0.4) 512 (1.5) 14 (0.3) 509 (3.6)
Iran, Islamic Rep. of 19 (3.4) 422 (11.7) 40 (4.5) 411 (8.9) 41 (4.7) 411 (8.1)
Israel 27 (4.3) 524 (8.0) 64 (4.5) 506 (5.1) 9 (2.6) 481 (22.3)
Italy 31 (3.8) 544 (5.3) 41 (3.4) 536 (3.9) 28 (3.6) 547 (4.2)
Kuwait r 44 (3.7) 405 (7.8) 39 (3.6) 396 (6.2) 17 (3.2) 379 (11.3)
Latvia 7 (2.3) 575 (7.8) 75 (3.9) 541 (2.5) 17 (3.7) 545 (7.6)
Lithuania 30 (4.3) 547 (5.2) 57 (4.5) 543 (3.5) 12 (2.7) 536 (8.9)
Macedonia, Rep. of 16 (3.4) 415 (18.2) 77 (3.9) 449 (6.2) 7 (2.2) 435 (18.0)
Moldova, Rep. of 14 (2.7) 501 (8.3) 66 (4.4) 496 (5.3) 20 (4.0) 478 (12.1)
Morocco r 40 (5.1) 319 (15.2) 35 (4.9) 346 (13.0) 25 (4.7) 371 (14.7)
Netherlands 11 (3.2) 567 (7.3) 56 (4.5) 551 (3.7) 33 (3.6) 555 (3.8)
New Zealand 15 (2.8) 526 (9.2) 73 (3.9) 529 (5.0) 12 (3.1) 517 (13.9)
Norway 22 (3.5) 508 (6.0) 47 (4.4) 494 (3.6) 31 (4.2) 502 (5.8)
Romania 26 (3.5) 514 (10.9) 67 (4.2) 519 (5.8) 7 (2.2) 470 (14.9)
Russian Federation 10 (2.0) 528 (17.8) 67 (3.3) 529 (4.0) 23 (3.0) 527 (7.1)
Scotland 27 (4.0) 522 (6.9) 62 (4.4) 532 (4.7) 10 (3.0) 527 (10.0)
Singapore 17 (3.0) 545 (10.5) 58 (4.1) 520 (7.1) 25 (3.1) 534 (11.3)
Slovak Republic 2 (1.2) ~ ~ 92 (2.1) 521 (2.8) 6 (1.7) 482 (26.9)
Slovenia 13 (3.0) 503 (4.5) 68 (3.9) 500 (2.7) 20 (3.1) 506 (5.6)
Sweden 9 (1.7) 572 (5.3) 43 (3.5) 558 (3.8) 48 (3.9) 563 (2.7)
Turkey 30 (4.0) 451 (6.0) 62 (4.4) 449 (4.8) 9 (2.3) 441 (11.4)
United States 23 (3.7) 526 (8.3) 57 (4.3) 548 (4.5) 20 (3.9) 549 (7.9)
International Avg. 25 (0.6) 501 (1.5) 55 (0.7) 500 (0.9) 20 (0.6) 495 (2.4)
AverageAchievement
Countries As a MajorSource
As a SupplementarySource
Percentage of Students Whose TeachersReported Using Portfolios to Monitor Students’ Progress
Not Used
Percent ofStudents
AverageAchievement
Percent ofStudents
AverageAchievement
Percent ofStudents
Background data provided by teachers
( ) Standard errors appear in parentheses. Because results are rounded to the nearest wholenumber, some totals may appear inconsistent.
An “r” indicates data are available for 70-84% of the students. An “s” indicates data are avail-able for 50-69% of the students. An “x” indicates data are available for less than 50% of thestudents.
A dash (–) indicates data are not available. A tilde (~) indicates insufficient data to reportachievement.
ISC 4th GradePIRLS 2001

[220] chapter 6: teachers and reading instruction
Exhibit 6.37: Approaches to Assessing Students’ Performance in Reading
Argentina 40 (4.5) 73 (4.7) r 32 (4.6) 87 (3.4) 91 (2.8) 68 (4.7)
Belize 52 (5.0) 82 (3.6) r 36 (6.8) r 80 (4.1) r 86 (3.9) 45 (7.0)
Bulgaria 65 (3.3) 42 (4.1) 33 (3.5) 96 (1.6) 94 (2.1) 84 (3.1)
Canada (O,Q) 8 (2.0) 55 (3.8) 32 (3.0) 55 (3.5) 68 (3.2) 33 (3.2)
Colombia 59 (4.8) 70 (4.6) 53 (4.9) 79 (4.0) 83 (3.7) 72 (4.5)
Cyprus 28 (4.4) 70 (4.8) 56 (4.6) 96 (2.3) 99 (0.9) 91 (3.0)
Czech Republic 61 (4.6) 77 (3.7) 15 (3.0) 90 (2.9) 88 (3.0) 38 (4.1)
England 6 (2.4) 33 (4.3) 22 (3.9) 66 (4.4) 77 (4.2) 38 (4.6)
France 30 (3.6) 58 (4.3) 12 (2.6) 65 (3.9) 75 (2.9) 46 (3.5)
Germany r 8 (1.8) 14 (2.2) 4 (1.4) 80 (2.8) 62 (2.8) 58 (3.1)
Greece 48 (4.7) 55 (5.1) 48 (5.3) 98 (1.3) 99 (0.8) 82 (3.4)
Hong Kong, SAR 13 (2.8) 34 (4.6) 21 (3.6) 58 (4.2) 79 (4.2) 33 (4.2)
Hungary 70 (3.7) 84 (2.8) 29 (3.5) 39 (4.0) 39 (3.8) 45 (3.6)
Iceland 16 (0.3) 41 (0.3) 16 (0.2) 73 (0.4) r 27 (0.3) 6 (0.1)
Iran, Islamic Rep. of 28 (3.2) 52 (4.6) 50 (4.4) 90 (2.4) 94 (1.6) 58 (4.7)
Israel 55 (4.9) 71 (4.3) 61 (4.7) 70 (4.3) 91 (2.9) 77 (4.1)
Italy 53 (3.4) 66 (3.4) 54 (3.7) 87 (2.4) 87 (2.5) 61 (3.2)
Kuwait 53 (3.5) 68 (3.4) 36 (3.9) 86 (2.2) 90 (2.0) 25 (3.1)
Latvia 30 (4.2) 43 (3.9) 29 (4.1) 85 (3.3) 85 (3.0) 84 (2.8)
Lithuania 45 (4.1) 30 (4.0) 16 (3.1) 85 (3.4) 90 (2.8) 88 (2.9)
Macedonia, Rep. of 59 (4.0) 76 (4.0) 55 (4.3) 89 (2.6) 85 (3.0) 79 (3.6)
Moldova, Rep. of 60 (4.4) 74 (3.9) 12 (2.8) 92 (2.3) 97 (1.6) 61 (4.3)
Morocco 61 (4.9) 78 (4.3) 37 (5.2) 95 (2.3) 95 (2.1) 44 (4.8)
Netherlands 21 (3.7) 60 (4.2) 33 (4.6) 39 (4.8) 74 (3.9) 20 (3.6)
New Zealand 5 (1.7) 35 (4.3) 15 (3.1) 59 (4.1) 67 (4.0) 26 (3.9)
Norway 22 (3.3) 39 (5.0) 10 (2.4) 85 (3.5) 64 (4.5) 36 (4.3)
Romania 65 (4.0) 83 (3.3) 54 (4.0) 93 (2.3) 95 (2.0) 69 (3.6)
Russian Federation 77 (2.9) 79 (3.4) 16 (2.7) 96 (1.2) 99 (0.5) 84 (2.6)
Scotland 10 (3.1) 59 (4.9) 9 (3.0) 91 (3.0) 94 (2.0) 44 (5.1)
Singapore 55 (4.0) 66 (3.7) 17 (2.8) 69 (3.9) 84 (2.8) 32 (3.6)
Slovak Republic 54 (4.1) 30 (3.8) 23 (3.6) 92 (2.4) 85 (2.7) 76 (3.5)
Slovenia 40 (3.9) 57 (3.9) 26 (3.9) 80 (3.4) 73 (3.6) 73 (3.8)
Sweden 12 (2.2) 23 (2.8) 8 (1.7) 51 (3.2) 60 (3.3) 37 (3.1)
Turkey 37 (4.7) 51 (4.0) 39 (4.5) 94 (1.8) 95 (1.8) 93 (1.8)
United States 49 (5.2) 63 (5.4) 43 (5.3) 75 (3.7) 83 (3.9) 45 (3.7)
International Avg. 40 (0.6) 57 (0.7) 30 (0.7) 79 (0.5) 82 (0.5) 56 (0.6)
Percentage of Students for Whose TeachersReported Using at Least Weekly
Countries Multiple-Choice
Questions onMaterial Read
Short-Answer WrittenQuestions onMaterial Read
Paragraph-Length WrittenResponses onMaterial Read
Listening toStudents Read
Aloud
OralQuestioning of
Students
StudentsGiving an Oral
Summary/Report on
Material Read
Background data provided by teachers.
( ) Standard errors appear in parentheses. Because results are rounded to the nearest wholenumber, some totals may appear inconsistent.
An “r” indicates data are available for 70-84% of the students. An “s” indicates data are avail-able for 50-69% of the students. An “x” indicates data are available for less than 50% of thestudents.
A dash (–) indicates data are not available. A tilde (~) indicates insufficient data to reportachievement.
SOU
RCE:
IEA
Pro
gres
s in
Inte
rnat
iona
l Rea
ding
Lite
racy
Stu
dy (P
IRLS
) 200
1.
ISC 4th GradePIRLS 2001

[221]chapter 6: teachers and reading instruction