introduction - timss and pirls home
TRANSCRIPT

INTRODUCTION TIMSS 2019 ENCYCLOPEDIA 1
Introduction
The TIMSS 2019 Encyclopedia: Education Policy and Curriculum in Mathematics and Science presents a profile of mathematics and science education in each of the countries and benchmarking systems that participated in TIMSS 2019. Each country and benchmarking participant completed the TIMSS 2019 curriculum questionnaire and prepared a chapter describing aspects of its mathematics and science education. Together, the curriculum questionnaire data and country chapters present a concise yet rich portrait of mathematics and science education around the world.
In the TIMSS 2019 Encyclopedia, a series of exhibits presents information from the curriculum questionnaire about aspects of the structure of countries’ education systems; characteristics of early childhood education; aspects of mathematics and science curricula, including recent reforms, instructional time and content in the intended curricula, examinations, and policies related to the use of information and communication technology (ICT) in instruction; and preparation routes and requirements for teachers and principals. Countries’ chapters describe the structure of each education system; the mathematics and science curricula in the primary and lower secondary grades; policies related to mathematics and science education, including teacher professional development and monitoring student progress; and special mathematics and science initiatives. The chapters were prepared from each country’s viewpoint and were written primarily by experts from ministries of education, research institutes, or institutions of higher education with extensive knowledge about their country’s education system.
The international results from TIMSS 2019 are presented in TIMSS 2019 International Results in Mathematics and Science (forthcoming, December 2020). The international report presents fourth and eighth grade students’ achievement in mathematics and science, as well as trends in achievement for countries around the world that participated in TIMSS 2019. To put mathematics and science achievement in the context of schools and classrooms with diverse policies, practices, and resources, the students assessed in TIMSS 2019 and their parents or caregivers, teachers, and school principals completed questionnaires about home, school, and classroom conditions. Much of this information is presented in the international report in relation to achievement in mathematics and science. The TIMSS 2019 Encyclopedia provides a qualitative complement to the TIMSS 2019 international report and is a valuable compendium of how mathematics and science are taught around the world.
TIMSS 2019
IEA’s TIMSS—the Trends in International Mathematics and Science Study—aims to help countries improve teaching and learning in mathematics and science. Inaugurated in 1995, TIMSS has been conducted every four years since, providing 24 years of trends in mathematics and science achievement.

INTRODUCTION TIMSS 2019 ENCYCLOPEDIA 2
TIMSS 2019 continues the long history of international assessments in mathematics and science conducted by IEA—the International Association for the Evaluation of Educational Achievement. An independent international cooperative of national research institutions and government agencies, IEA pioneered international comparative assessments of educational achievement in the 1960s to gain a deeper understanding of the effects of policies across countries’ different systems of education. IEA has been conducting international assessments of mathematics and science and collecting data about the factors associated with achievement in countries around the world for more than 50 years. TIMSS at the fourth grade is complemented by IEA’s PIRLS—Progress in International Reading Literacy Study—conducted every five years since 2001.
TIMSS and PIRLS are directed by IEA’s TIMSS & PIRLS International Study Center at Boston College, in close cooperation with IEA Amsterdam, IEA Hamburg, and Statistics Canada. Each participating country has a National Research Coordinator who is responsible for implementing TIMSS in accordance with international procedures and to TIMSS’ standards of technical excellence.
Sixty-four countries participated in TIMSS 2019, including some distinct education systems within countries that have always participated separately throughout IEA’s long history (e.g., the Dutch-speaking part of Belgium and Hong Kong Special Administrative Region (SAR) of the People’s Republic of China). In addition, TIMSS 2019 had 8 benchmarking participants (e.g., regional entities, such as provinces and municipalities). Countries and benchmarking participants could choose to participate in the fourth grade assessment, the eighth grade assessment, or both. In 2019, 58 countries and 6 benchmarking entities participated in the TIMSS fourth grade assessment, and 39 countries and 7 benchmarking participants participated in the eighth grade assessment.
The Importance of Country and School Contexts
in Making International Comparisons
The results of high quality international assessments such as TIMSS 2019 can make important contributions to improving education quality. However, countries differ from one another in fundamental ways, and education systems reflect these differences. TIMSS aims to improve understanding of the effects of education policies and practices within and across countries, and expends substantial effort to address the more substantive and important questions about the meaning of the achievement results.
The TIMSS 2019 Encyclopedia provides an overview of the context in which learning mathematics and science takes place in each country. A country’s education system is the result of a series of decisions made in response to the specific goals, priorities, politics, resources, and historical traditions of its government representatives and citizens, and the information in the encyclopedia provides an opportunity to better understand each participant’s contexts for mathematics and science instruction.
INTRODUCTION TIMSS 2019 ENCYCLOPEDIA 3
Organization of the TIMSS 2019 Encyclopedia
The TIMSS 2019 Encyclopedia has two major parts: (1) the results from the TIMSS 2019 curriculum questionnaires completed by the countries and benchmarking participants and (2) the chapters authored by each country and benchmarking participant.
Curriculum Questionnaire Results
TIMSS routinely includes a curriculum questionnaire to collect background information from each country and benchmarking participant about mathematics and science curricula and policies that support mathematics and science teaching and learning. The curriculum questionnaire data support the encyclopedia chapters by providing comparative information about participants’ education systems and curricula that can be answered in a questionnaire format.
The compilation of responses from the TIMSS 2019 curriculum questionnaire enables comparisons across countries on the following topics:
• Structure and organization of their education systems • Aspects of early childhood education • Status and content of and instructional time devoted to mathematics and science curricula • Policies regarding “high stakes” examinations • Policies regarding the use of ICT and digital devices in instruction and examinations • Education routes and requirements for teachers and principals
Country Chapters
Each chapter was written by a TIMSS 2019 country or benchmarking participant. An important purpose of the chapters is to instill an appreciation of the uniqueness of each educational setting represented in TIMSS 2019. All the countries have the common goal of teaching their students mathematics and science, yet national and regional contexts and instructional situations can differ dramatically depending on particular country characteristics, such as resources, culture, demographics, and education philosophies.
Together with the curriculum questionnaire data, the information provided in the countries’ chapters furnishes an important vehicle for beginning to compare and contrast the common and unique features of the country contexts and curricular goals used in teaching mathematics and science around the world.
Demographic and Economic Characteristics of the TIMSS 2019 Countries
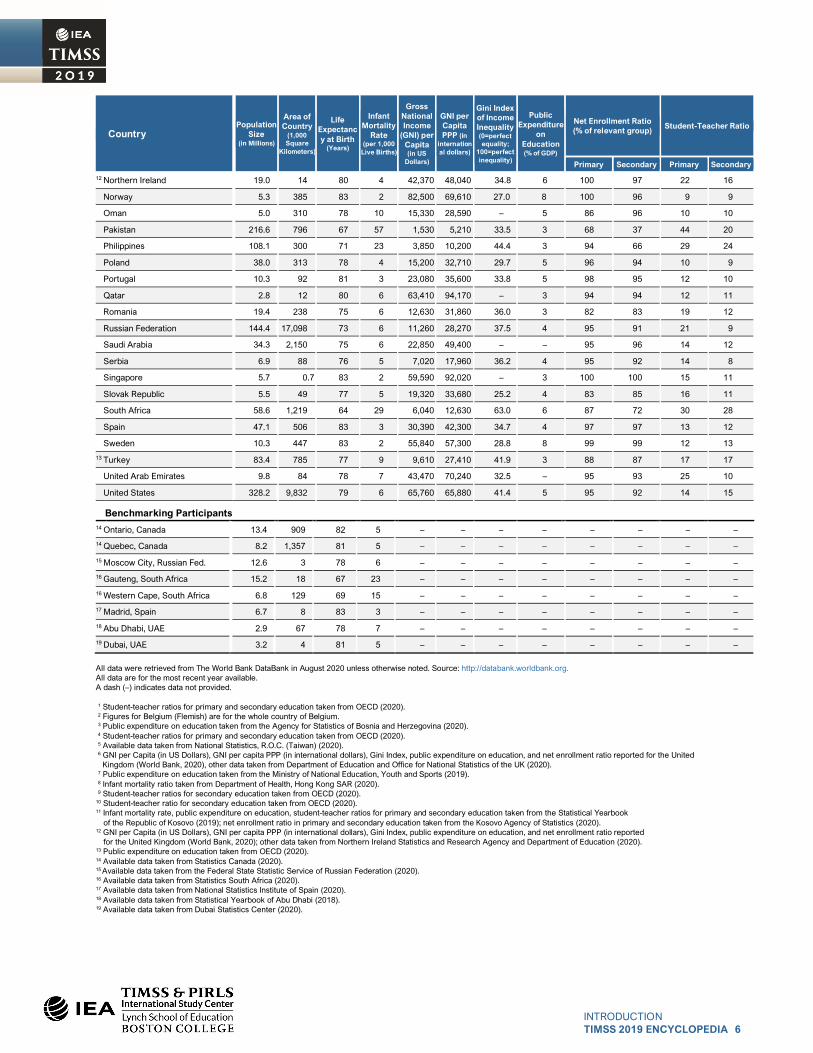
TIMSS 2019 included countries from all around the world that represent a wide range of geographic and economic diversity. Because factors such as population size and economic resources can impact education policies and the provision of education, the following table presents selected information about the demographic and economic characteristics of the TIMSS 2019 countries. These data are taken primarily from the World Bank’s DataBank

INTRODUCTION TIMSS 2019 ENCYCLOPEDIA 4
(http://databank.worldbank.org), a repository of databases that include a range of economic, education, and human development indicators.
As the table shows, the TIMSS 2019 countries vary widely in population size and geographic area, from nations with half a million to nearly 330 million people, and with geographic areas ranging from 300 to more than 17,000,000 square kilometers. The TIMSS 2019 countries also vary considerably on indicators of health, such as life expectancy and infant mortality rate. Nearly all the countries had life expectancies of 70 years or higher except Pakistan (67) and South Africa (64). Most of the TIMSS 2019 countries had infant mortality rates ranging from 1 to 14 out of 1,000 live births. However, this was as high as 57 out of 1,000 live births in Pakistan.
Economic indicators, such as gross national income per capita, reveal great disparity in the economic resources available among TIMSS 2019 countries, as well as differences in policies regarding the percentage of funds spent on education. Economically, the countries ranged from Qatar and Singapore, with per capita gross national incomes of more than 90,000 USD (adjusted for purchasing power parity), to Morocco, Pakistan, and the Philippines, with gross national incomes per capita of about 10,000 USD or less (adjusted for purchasing power parity). Public expenditure on education ranged from as high as 8 percent of gross national product in Denmark, Norway, and Sweden to 2 percent in Albania, Azerbaijan, Bahrain, and Lebanon.
The Gini index of income inequality is a measure of the distribution of income among the population, with lower coefficients indicating greater income equality and higher coefficients indicating greater income inequality. Gini coefficients ranged from 24.9 in the Czech Republic and 25.2 in the Slovak Republic, indicating relatively higher income equality, to 63.0 in South Africa, indicating relatively higher income inequality. Most countries had Gini coefficients of about 30 to 40.
Although about two-thirds of the TIMSS 2019 countries had 95 percent or more of their students of primary school age enrolled in school, there was some variation in enrollment rates, especially in secondary school. Still, more than three-quarters of the countries had 85 percent or more of their students of secondary school age enrolled in school.

INTRODUCTION TIMSS 2019 ENCYCLOPEDIA 5
Exhibit 1: Selected Characteristics of TIMSS 2019 Countries
Country Population
Size (in Millions)
Area of Country
(1,000 Square
Kilometers)
Life Expectancy at Birth
(Years)
Infant Mortality
Rate (per 1,000
Live Births)
Gross National Income
(GNI) per Capita (in US
Dollars)
GNI per Capita PPP (in
international dollars)
Gini Index of Income Inequality (0=perfect equality;
100=perfect inequality)
Public Expenditure
on Education (% of GDP)
Net Enrollment Ratio (% of relevant group)
Student-Teacher Ratio
Primary Secondary Primary Secondary
Albania 2.9 29 78 8 5,240 14,350 33.2 2 95 87 18 11
Armenia 3.0 30 75 11 4,680 14,460 34.4 3 91 88 15 8
1 Australia 25.4 7,741 83 3 54,910 51,560 34.4 5 96 92 15 12
Austria 8.9 84 82 3 51,300 59,060 29.7 6 89 87 10 9
Azerbaijan 10.0 87 73 19 4,480 14,360 – 2 92 89 15 8
Bahrain 1.6 0.8 77 6 22,110 44,140 – 2 97 90 12 10
2 Belgium (Flemish) 11.5 31 82 3 47,350 54,730 27.4 7 99 95 11 9
3 Bosnia and Herzegovina 3.3 51 77 5 6,150 15,770 33.0 4 – – 17 9
Bulgaria 7.0 111 75 6 9,410 23,880 40.4 4 86 89 15 13
4 Canada 37.6 9,985 82 4 46,370 50,810 33.8 5 100 100 16 13
Chile 19.0 757 80 6 15,010 24,140 44.4 5 95 89 18 18
5 Chinese Taipei 23.6 36 80 4 25,501 – – 3 97 96 12 13
Croatia 4.1 57 78 4 14,910 29,520 30.4 5 88 92 14 7
Cyprus 1.2 9 81 2 27,710 39,830 31.4 6 97 95 12 8
Czech Republic 10.7 79 79 3 22,000 40,660 24.9 6 89 91 19 12
Denmark 5.8 43 81 4 63,240 61,410 28.7 8 99 91 11 11
Egypt 100.4 1,001 72 18 2,690 11,810 31.5 4 97 83 24 15
6 England 56.0 130 81 4 42,370 48,040 34.8 6 100 97 21 16
Finland 5.5 338 82 1 49,580 51,210 27.4 7 99 96 14 14
7 France 67.1 549 83 3 42,400 50,390 31.6 7 99 95 18 13
Georgia 3.7 70 74 9 4,740 15,020 36.4 4 96 96 9 8
Germany 83.1 358 81 3 48,520 57,690 31.9 5 90 85 12 12
8 Hong Kong SAR 7.5 1 85 2 50,840 65,600 – 3 95 96 13 11
Hungary 9.8 93 76 4 16,140 32,750 30.6 5 91 89 11 10
Iran, Islamic Rep. or 82.9 1,745 76 12 5,420 14,560 40.8 4 100 81 29 19
9 Ireland 4.9 70 82 3 62,210 68,050 32.8 4 96 99 16 13
10 Israel 9.1 22 83 3 43,290 42,140 39.0 6 97 99 12 11
Italy 60.3 301 83 3 34,460 44,580 35.9 4 96 95 11 10
Japan 126.3 378 84 2 41,690 44,780 32.9 3 – – 16 11
Jordan 10.1 89 74 14 4,300 10,240 33.7 4 81 63 19 12
Kazakhstan 18.5 2,725 73 9 8,810 24,050 27.5 3 87 100 17 8
Korea, Rep. of 51.7 100 83 3 33,720 43,430 31.6 5 97 98 16 13
11 Kosovo 1.8 11 72 11 4,640 12,090 29.0 4 98 91 13 13
Kuwait 4.2 18 75 7 34,290 59,720 – – 83 87 9 8
Latvia 1.9 64 75 3 17,730 31,770 35.6 5 96 94 12 8
Lebanon 6.9 10 79 6 7,600 15,260 31.8 2 – – 12 8
Lithuania 2.8 65 76 3 18,990 37,010 37.3 4 98 98 14 8
Malaysia 31.9 330 76 7 11,200 28,680 41.0 5 100 72 12 11
Malta 0.5 0.3 82 6 27,290 41,690 29.2 5 100 93 13 7
Montenegro 0.6 14 77 2 9,010 23,070 39.0 – 97 89 – –
Morocco 36.5 447 76 19 3,190 7,680 39.5 5 99 64 27 19
Netherlands 17.3 42 82 3 53,200 59,890 28.5 5 99 93 12 15
New Zealand 4.9 268 82 5 42,670 42,710 – 6 99 97 15 14
North Macedonia 2.1 26 76 9 5,910 17,110 34.2 – 95 – 15 9
All data were retrieved from The World Bank DataBank in August 2020 unless otherwise noted. Source: http://databank.worldbank.org. All data are for the most recent year available. A dash (–) indicates data not provided.
INTRODUCTION TIMSS 2019 ENCYCLOPEDIA 6
Country Population
Size (in Millions)
Area of Country
(1,000 Square
Kilometers)
Life Expectancy at Birth
(Years)
Infant Mortality
Rate (per 1,000
Live Births)
Gross National Income
(GNI) per Capita (in US
Dollars)
GNI per Capita PPP (in
international dollars)
Gini Index of Income Inequality (0=perfect equality;
100=perfect inequality)
Public Expenditure
on Education (% of GDP)
Net Enrollment Ratio (% of relevant group)
Student-Teacher Ratio
Primary Secondary Primary Secondary
12 Northern Ireland 19.0 14 80 4 42,370 48,040 34.8 6 100 97 22 16
Norway 5.3 385 83 2 82,500 69,610 27.0 8 100 96 9 9
Oman 5.0 310 78 10 15,330 28,590 – 5 86 96 10 10
Pakistan 216.6 796 67 57 1,530 5,210 33.5 3 68 37 44 20
Philippines 108.1 300 71 23 3,850 10,200 44.4 3 94 66 29 24
Poland 38.0 313 78 4 15,200 32,710 29.7 5 96 94 10 9
Portugal 10.3 92 81 3 23,080 35,600 33.8 5 98 95 12 10
Qatar 2.8 12 80 6 63,410 94,170 – 3 94 94 12 11
Romania 19.4 238 75 6 12,630 31,860 36.0 3 82 83 19 12
Russian Federation 144.4 17,098 73 6 11,260 28,270 37.5 4 95 91 21 9
Saudi Arabia 34.3 2,150 75 6 22,850 49,400 – – 95 96 14 12
Serbia 6.9 88 76 5 7,020 17,960 36.2 4 95 92 14 8
Singapore 5.7 0.7 83 2 59,590 92,020 – 3 100 100 15 11
Slovak Republic 5.5 49 77 5 19,320 33,680 25.2 4 83 85 16 11
South Africa 58.6 1,219 64 29 6,040 12,630 63.0 6 87 72 30 28
Spain 47.1 506 83 3 30,390 42,300 34.7 4 97 97 13 12
Sweden 10.3 447 83 2 55,840 57,300 28.8 8 99 99 12 13
13 Turkey 83.4 785 77 9 9,610 27,410 41.9 3 88 87 17 17
United Arab Emirates 9.8 84 78 7 43,470 70,240 32.5 – 95 93 25 10
United States 328.2 9,832 79 6 65,760 65,880 41.4 5 95 92 14 15
Benchmarking Participants
14 Ontario, Canada 13.4 909 82 5 – – – – – – – –
14 Quebec, Canada 8.2 1,357 81 5 – – – – – – – –
15 Moscow City, Russian Fed. 12.6 3 78 6 – – – – – – – –
16 Gauteng, South Africa 15.2 18 67 23 – – – – – – – –
16 Western Cape, South Africa 6.8 129 69 15 – – – – – – – –
17 Madrid, Spain 6.7 8 83 3 – – – – – – – –
18 Abu Dhabi, UAE 2.9 67 78 7 – – – – – – – –
19 Dubai, UAE 3.2 4 81 5 – – – – – – – –
All data were retrieved from The World Bank DataBank in August 2020 unless otherwise noted. Source: http://databank.worldbank.org. All data are for the most recent year available. A dash (–) indicates data not provided. 1 Student-teacher ratios for primary and secondary education taken from OECD (2020). 2 Figures for Belgium (Flemish) are for the whole country of Belgium. 3 Public expenditure on education taken from the Agency for Statistics of Bosnia and Herzegovina (2020). 4 Student-teacher ratios for primary and secondary education taken from OECD (2020). 5 Available data taken from National Statistics, R.O.C. (Taiwan) (2020). 6 GNI per Capita (in US Dollars), GNI per capita PPP (in international dollars), Gini Index, public expenditure on education, and net enrollment ratio reported for the United
Kingdom (World Bank, 2020), other data taken from Department of Education and Office for National Statistics of the UK (2020). 7 Public expenditure on education taken from the Ministry of National Education, Youth and Sports (2019). 8 Infant mortality ratio taken from Department of Health, Hong Kong SAR (2020). 9 Student-teacher ratios for secondary education taken from OECD (2020). 10 Student-teacher ratio for secondary education taken from OECD (2020). 11 Infant mortality rate, public expenditure on education, student-teacher ratios for primary and secondary education taken from the Statistical Yearbook
of the Republic of Kosovo (2019); net enrollment ratio in primary and secondary education taken from the Kosovo Agency of Statistics (2020). 12 GNI per Capita (in US Dollars), GNI per capita PPP (in international dollars), Gini Index, public expenditure on education, and net enrollment ratio reported
for the United Kingdom (World Bank, 2020); other data taken from Northern Ireland Statistics and Research Agency and Department of Education (2020). 13 Public expenditure on education taken from OECD (2020). 14 Available data taken from Statistics Canada (2020). 15 Available data taken from the Federal State Statistic Service of Russian Federation (2020). 16 Available data taken from Statistics South Africa (2020). 17 Available data taken from National Statistics Institute of Spain (2020). 18 Available data taken from Statistical Yearbook of Abu Dhabi (2018). 19 Available data taken from Dubai Statistics Center (2020).

INTRODUCTION TIMSS 2019 ENCYCLOPEDIA 7
Highlights from the Curriculum Questionnaire
Countries’ responses to the TIMSS 2019 curriculum questionnaire, presented in Exhibits 1 through 23, underscore the dynamic nature of education policy, with many countries implementing recent reforms to increase the amount of education that children receive, revising mathematics and science curricula to reflect emerging priorities, and increasing the rigor of teaching requirements. Responses also demonstrate that countries prioritize mathematics and science education. Many countries start early with mathematics education and, to a lesser extent, science education, with early childhood curriculum guidance focused on these subjects. Countries’ mathematics and science curricula largely cover the topics in the TIMSS 2019 mathematics and science frameworks by the end of the fourth and eighth grades. Moreover, many countries have policies in place regarding the use of technology in mathematics and science instruction, from increasing digital literacy broadly to specific uses of technology to support instruction in mathematics and science topics.
Early Preparation
In most TIMSS countries, children start primary school around age 6, though the specific policies vary (for example, some policies stipulate that children start in the calendar year in which they turn 6 years old, and others require children to turn 6 by a particular date); some countries start primary school as early as 4, and several start at age 7, or the calendar year in which they turn 7 (Exhibit 2). Though policies for age of entry have been mostly stable over time, in 17 countries, these policies changed in the last 10 years, and in all but 2 of those cases, the official age of entry was lowered.
TIMSS countries provide opportunities for children to participate in preprimary education (Exhibit 4). Most countries report that universal preprimary education (PPE) programs for children ages 3 to 6 are available, and in close to half of the countries, universal early childhood educational development (ECED) programs for children under 3 are also available. Programs targeted to specific populations are less common, but still, about one-third of countries provide either targeted ECED or PPE programs, or both.
Most countries have national early childhood education documents that outline the content of early childhood education programs (Exhibit 5). In all cases, these documents address social-emotional learning and physical development and health in PPE (programs for children ages 3–6). Mathematics is addressed in all but 3 of 57 documents for this age group. Science is covered less often but still frequently, in all but 12 of 57 documents.
Updating and Monitoring the Implementation of Mathematics and Science Curricula
Nearly all countries have national mathematics and science curricula. The exceptions at the fourth grade are Belgium (Flemish), Bosnia and Herzegovina, Canada, Germany, and the United States, and at the eighth grade, the one exception is the United States.

INTRODUCTION TIMSS 2019 ENCYCLOPEDIA 8
Mathematics and science curricula are always evolving, as countries expend considerable time and effort keeping their mathematics and science curricula (national curricula or subnational) current (Exhibit 6 and 7). Since 2010, two-thirds of the 58 countries (38 in mathematics and 40 in science) have introduced or implemented new curricula at the fourth grade. A further 14 are currently revising their mathematics curriculum and 11 are revising their science curriculum, and about as many countries are already revising their newly implemented curriculum. The situation is similarly dynamic in the eighth grade, with new mathematics and science curricula introduced or implemented during the last decade in 27 of the 39 countries, and a handful more currently revising their curricula.
Countries’ mathematics and science curricula largely cover the topics in the TIMSS 2019 mathematics and science frameworks by the end of the fourth and eighth grades (Exhibits 11–14). In mathematics, more than 80 percent of the topics, on average, are included in the curricula for all or almost all students in both grades. In science, there is somewhat less uniformity, with just under 75 percent of the topics included for all or almost all students in fourth grade, on average, and 85 percent included at the eighth grade.
Countries rely on a variety of approaches to monitor the implementation of the curriculum: visits by school inspectors, school self-evaluation, research programs, and national or regional examinations (Exhibits 15 and 16). In the fourth grade, most countries report using visits by school inspectors and school self-evaluation, and less than half use research programs. In the eighth grade, nearly all countries report relying on school self-evaluation. Use of research programs was the least reported approach (about half of countries). In both grades, most countries use two or three of these approaches to monitor the implementation of the curriculum, though some indicate that they use all four.
Instructional Emphasis in Mathematics and Science
According to countries’ reports, in most countries, approximately 15 to 20 percent of instructional time in the fourth grade is devoted to mathematics, with another 7 to 14 percent of instructional time devoted to science (Exhibit 8). In many countries, the amount devoted to science instruction is half of what is devoted to mathematics. There is a range, however, with as little as 10 percent and as much as 28 percent devoted to mathematics and as little as 2 percent and as much as 20 percent devoted to science, across countries. By eighth grade, typical instructional time decreases somewhat in mathematics and increases in science. In mathematics, most countries report that between about 10 to 16 percent of instructional time is devoted to mathematics and 7 to 20 percent is devoted to science (Exhibit 9). Again, though, there is a range, with some countries reporting less time and some reporting more time devoted to these subjects in eighth grade.
Technology in Mathematics and Science Instruction
Reflecting the growing use of technology, many countries reported having national policies for the use of ICT and digital devices in mathematics and science instruction (Exhibits 18 and 19). In mathematics, about four-fifths of countries reported that policies are in place for fourth grade and

INTRODUCTION TIMSS 2019 ENCYCLOPEDIA 9
for eighth grade. In science, policies are less prevalent, but still, about two-thirds or more of the countries have policies for the fourth grade and for the eighth grade.
The nature of these policies varies, however. In some countries, policies for ICT and digital devices are general or cut across curricular areas, such as countries in which the use of digital devices is encouraged but not mandated (e.g., Australia) or in which the curriculum encourages the use of devices to develop “digital competence” (e.g., Hungary). In other countries, the curriculum provides direction for the use of technology to support specific curricular goals, such as stipulating that digital hardware and software be used to solve problems or to work with data, as in Canada; using ICT tools to help students understand mathematical concepts through visualizations, simulations, and representations, as in Singapore; or using ICT to acquire, process, and present information and measurement results in science, as in Finland. Curriculum guidance may refer only to policies related to the use of calculators or may include guidance on the use of computers, various software programs, digital white boards, and other types of technology. Policies regarding calculators, particularly at the fourth grade, include guidance on their use and when they may not be used.
Preparation of Mathematics and Science Teachers
The specific education routes to becoming a teacher vary across countries, and even within countries there can be multiple paths to becoming a teacher (Exhibits 21 and 22). All countries currently require a university degree—though the type and duration of programs that teachers have experienced can vary from a 2-year teacher training program under an older system, to a 4-year bachelor’s degree, to a master’s degree, with variations in between. Nearly all countries require a supervised practicum, though the duration of practicums ranges widely, from a matter of weeks to one or more years. Teachers of eighth grade more frequently are required to have a major in or a focus on the subject they will teach compared to fourth grade teachers. This finding reflects the increasing complexity of mathematics and science content in the higher grades and also is consistent with countries’ reports about when specialist teachers begin to teach mathematics and science, often in fifth grade or later (reported in Exhibit 10). In the fourth grade, close to three-quarters of the countries require teacher candidates to pass a qualifying examination, and more than half require completion of a probationary period. Less than half require participation in a mentoring program. In eighth grade, 27 of the 39 countries require candidates to pass a qualifying examination (about 70 percent), just over half require a probationary period, and just over half require participation in a mentoring program.
More than half of the countries have implemented policy changes for fourth grade teachers in the last decade, and half have done so for eighth grade teachers. Changes include heightening the education requirements (to a bachelor’s or master’s degree, or lengthening the duration of a teacher training program), increasing minimum practicum requirements, implementing more stringent admissions requirements for teacher education programs, and requiring that candidates pass an examination.

INTRODUCTION TIMSS 2019 ENCYCLOPEDIA 10
Highlights from Country Chapters
Mathematics and Science Curricula in the TIMSS Countries
The chapters written by the TIMSS 2019 countries provide extensive detail about the mathematics and science curricula across the countries at the fourth and eighth grades. There is substantial similarity across curricula, but no two curricula are exactly alike.
Countries’ reports about their mathematics and science curricula at the primary and lower secondary grades show good correspondence between their curricular goals and the TIMSS 2019 mathematics and science frameworks. As described in the TIMSS 2019 assessment frameworks, the updates to the frameworks for 2019 were reviewed and discussed by the TIMSS 2019 National Research Coordinators to ensure that the assessments were responsive to the countries’ concerns. Following the initial discussions, the coordinators consulted with their national experts and responded to a topic-by-topic survey about how best to update the content and cognitive domains for TIMSS 2019. This high degree of correspondence between the frameworks and countries’ curricula is also reflected in countries’ responses to the curriculum questionnaire in which they indicated which topics in the TIMSS frameworks are taught to all or almost all students by the end of the fourth and eighth grades (reported in Exhibits 11 through 14).
Mathematics Curricula
At the fourth grade, as described in the TIMSS 2019 mathematics framework, 50 percent of the assessment is devoted to number topics (including whole numbers; expressions, simple equations, and relationships; and fractions and decimals), 30 percent to measurement and geometry, and 20 percent to data (including reading, interpreting, and representing data and using data to solve problems). Countries’ curricula, as described in the chapters, largely reflect the relative emphasis of these mathematics domains, with a substantial emphasis on number topics at the fourth grade, then measurement and geometry topics, and then data topics. In number, nearly all countries included operations with whole numbers and almost as many mentioned fractions and decimals. About one-fifth included percentages, some countries included negative numbers, and some explicitly mentioned the use of calculators to check calculations. About two-thirds of the countries mentioned algebra concepts such as writing expressions or simple equations and identifying or using relationships or patterns. In measurement and geometry, nearly all countries mentioned identifying or working with two-dimensional shapes and figures and somewhat fewer explicitly mentioned three-dimensional shapes and solids. Most countries addressed understanding and working with points, lines, and angles and about two-thirds referred to measuring length, perimeter, area, and volume. Most of the countries’ curricula included data topics, including reading, interpreting, and representing data in a variety of charts and graphs, such as tables, bar graphs, pictographs, pie charts, and line graphs and, to a lesser extent, using data to solve problems. Just under one-third of countries included introductory probability (e.g., identifying likelihood of events).

INTRODUCTION TIMSS 2019 ENCYCLOPEDIA 11
At the eighth grade, as described in the TIMSS 2019 mathematics framework, 30 percent of the assessment is devoted to number topics (including integers, fractions and decimals, and ratio, proportion, and percent), 30 percent to algebra (including expressions, operations, and equations, and relationships and functions), 20 percent to geometry (geometric shapes and measurements), and 20 percent to data and probability (with an emphasis on data). In number, most of the TIMSS eighth grade countries included integers—including understanding properties, conducting operations, computing with positive and negative integers, and working with square roots and exponents—and problems involving proportion and percent. The specificity of algebra topics varied considerably across countries, though all countries included content related to expressions and equations, with about two-thirds including linear inequalities. Most countries also included content related to interpreting or representing linear functions. In geometry, nearly all countries mentioned two-dimensional shapes and their properties, including perimeter, circumference, and area. More than half mentioned the Pythagorean theorem. Geometric transformations as well as congruence and similarity were also addressed by most countries. In data and probability, about three-quarters of the countries included content related to reading, interpreting, and drawing conclusions from data and calculating and understanding measures of central tendency and dispersion. About as many also included the calculation of probability.
Beyond mathematics content, in their summaries most countries articulated essential skills and processes in their curricula that cut across domains, such as conceptual understanding, reasoning, and communication skills. Many countries emphasized the importance of problem solving for developing and applying mathematical understanding. Ireland’s chapter articulates the centrality of problem solving in their mathematics curriculum this way: “Problem solving (i.e., engaging in a task for which the solution is not immediately obvious) is integral to the lower secondary mathematics classroom. The syllabus stipulates that problem solving should not be met in isolation; rather, it should permeate all aspects of the teaching and learning experience.” As another example, Singapore puts problem solving at the center of its curriculum framework, with five interrelated components—concepts, skills, processes, metacognition, and attitudes—supporting the development of problem solving abilities.
Science Curricula
At the fourth grade, as described in the TIMSS 2019 science framework, 45 percent of the assessment is devoted to life science topics, 35 percent to physical science, and 20 percent to Earth science. Countries’ science curricula mirror this in terms of relative emphases, with a heavier emphasis on life science topics, then physical science, and a lesser emphasis on Earth science topics. Although countries place similar levels of emphasis on these areas of science, there is considerable diversity across countries’ curricula in the topics specified in each area. Most countries’ life science curricula included characteristics and life processes of living things (humans, animals, and plants), and human body systems were included in half of the curricula. Life cycles of living things, and physical features of living things that support their survival were included in about a third of

INTRODUCTION TIMSS 2019 ENCYCLOPEDIA 12
countries’ curricula. Many also address aspects of ecosystems, such as food chains and relationships among organisms, and most address human health, nutrition, and safety. In physical science, curricula up through the fourth grade in most countries address states of matter and physical changes observed in everyday life. Energy topics that were widely covered include light and sound in everyday life. In Earth science, many countries addressed physical characteristics of the Earth system, weather and climate on Earth, and the solar system, and more than half mentioned Earth’s resources and the impact of human behavior on the Earth system.
At the eighth grade, as described in the TIMSS 2019 science framework, 35 percent of the assessment is devoted to biology, 20 percent to chemistry, 25 percent to physics, and 20 percent to Earth science. Compared with fourth grade, there was a higher degree of similarity in topics addressed in countries’ eighth grade science curricula. In biology, most countries’ curricula addressed characteristics and life processes, structure and functions of cells, and life cycles and reproduction. Relationships among organisms in ecosystems was another common topic, as were topics related to human health. In chemistry, about half the countries included topics related to properties of matter, mixtures and solutions, and more than half included chemical changes and chemical reactions. The periodic table was mentioned by about one-third of the countries. In physics, most countries included topics related to matter and energy, including changes of state, forms of energy, and energy transfer. More than half of the countries included electricity and magnetism, and more than two-thirds included topics related to forces and motion. More than half mentioned light and sound. In Earth science, which in some countries is addressed in the geography curriculum, most countries addressed Earth’s structure and features, including physical characteristics and atmosphere and Earth’s processes and various systems, including weather and climate. Most countries included the solar system, with many mentioning understanding the Earth’s place in the solar system, the Sun, the moon, and other planets. More than half of the countries also mentioned human impact on the environment.
An important part of many countries’ science curriculum is the development of science inquiry skills, from asking questions to designing and executing experiments and being able to communicate findings. For example, in Australia, “science inquiry skills” is one of three strands of the science curriculum, with science inquiry described as involving “identifying and posing questions; planning, conducting, and reflecting on investigations; processing, analyzing, and interpreting evidence; and communicating findings. The Science Inquiry Skills strand is concerned with evaluating claims, investigating ideas, solving problems, drawing valid conclusions, and developing evidence-based arguments.” As another example, Korea’s new science curriculum, implemented in 2015, places an even greater emphasis on science inquiry than the previous curriculum. More than half the countries mentioned the development of students’ interest in the world around them and more broadly positive attitudes towards science. For example, Korea’s new science curriculum aims “to help students develop lifelong learning skills based on recognition of the joy and value of learning science.”

INTRODUCTION TIMSS 2019 ENCYCLOPEDIA 13
Special Initiatives in Mathematics and Science
There is widespread appreciation across countries for the need to strengthen mathematics and science education and boost students’ preparation for and interest in careers in science, technology, engineering, and mathematics (STEM) fields. Many initiatives and programs underway in countries are intended to do just that. Some efforts focus on coordinating and harnessing support from across government, provide a framework for action, or link universities and schools to promote STEM education—or, in some countries, STEAM, in which the “A” refers to the inclusion of the arts along with traditional STEM subjects.
For example, as explained in the chapter by the United States, the United States’ Committee on Science, Technology, Engineering, and Mathematics Education (CoSTEM) reviews and coordinates STEM education programs and initiatives across federal agencies to ensure they are effective. The chapter by New Zealand describes “A Nation of Curious Minds—He Hirihi i te Mahara,” a joint initiative between the Ministry for Business, Innovation, and Employment, the Chief Science Advisor to the Prime Minister, and the Ministry of Education. One of its three strategic action areas focuses on enhancing the role of education, with recommended actions that aim to: improve initial teacher training and in-service professional development related to science and technology teaching and build stronger links in the classroom and in the community between science and technology educators, learners, technologists, and scientists. In Latvia, as described in the chapter, the Innovation Center of Interdisciplinary Education at the University of Latvia aims to form a bridge between the university and schools and to promote young people’s interest in science and mathematics; facilitate innovation in the general education system; promote succession and cooperation between general education and higher education; popularize science among students and the society at large; and strengthen research activity and inquiry in general education.
Many countries have programs aimed at giving students opportunities to develop their STEM skills and grow their interest in mathematics and science through national competitions, enrichment programs, camps, and celebratory events. For example, in Singapore, students can apply their knowledge of science, mathematics, and technology to solving real-world problems through the STEM Applied Learning Program, which was developed by Singapore’s Science Centre in partnership with secondary schools. The Slovak Republic has mathematics, physics, and biology Olympiads in which students compete. In South Africa, the national government provides grants to provinces to support special mathematics and science initiatives. Australia’s STEM Professionals in Schools program connects STEM professionals with teachers and their students to provide real world experiences that engage students and promote careers in STEM.
Professional Development of Teachers
Recognizing the need for teachers’ ongoing learning and growth, all countries provide in-service professional development to teachers, with the aim of continuing to develop and strengthen teachers’ skill sets. However, just as preservice teacher education routes and requirements vary across countries, so too does professional development, in terms of what is required, how it is

INTRODUCTION TIMSS 2019 ENCYCLOPEDIA 14
provided or delivered, and what it entails. In-service professional development is required of teachers in many countries, but in some countries, it is expected but not mandated. Professional development may be organized and provided by the Ministry of Education (or regional equivalent), teacher training institutions, or other private organizations, or a combination.
A number of countries have instituted programs or initiatives that recognize teachers as professionals and incentivize them to engage in sustained professional development and growth and raise their stature in the profession. For example, primary school teachers in Korea can undertake a qualification training program to become a “Grade I certificate teacher” by participating in an intensive professional career development program that covers subject content knowledge, pedagogical knowledge, instructional strategies and assessment, leadership, and classroom management. Teachers with a Grade I certificate can be promoted to more senior positions. Though this opportunity is not mandatory, the majority of Korean teachers take advantage of it. Chile’s Ministry of Education offers the Teaching Excellence Allowance (Asignación de Excelencia Pedagógica), which aims to improve the quality of education by recognizing the professional excellence of teachers from public and private subsidized schools based on performance on a voluntary assessment consisting of a portfolio and a pedagogical and disciplinary test. Based on the assessment results, teachers may receive a bonus and may apply to join the Expert Teachers Network (Red Maestros de Maestros). Georgia offers teachers the opportunity to elevate their status from practitioner teacher to senior teacher, lead teacher, or mentor teacher based on participation in required and supplemental courses and activities for each level.
~~~~~~
The countries and education systems that participated in TIMSS 2019 have their own unique national contexts in which their children live and learn. Understanding these contexts is important for interpreting and making sense of the TIMSS achievement results and for understanding more broadly the varied ways in which mathematics and science education works around the world. With exhibits presenting the TIMSS curriculum questionnaire data and countries’ own descriptions of their mathematics and science curricula and education policies, the TIMSS 2019 Encyclopedia is an indispensable resource for policy and research in comparative education and a valuable companion to the international report of student achievement, TIMSS 2019 International Results in Mathematics and Science.