pininfarina group quarterly report at march 31, 2007
TRANSCRIPT

PININFARINA GROUP
Quarterly Report at March 31, 2007
Pininfarina S.p.A – Share capital: 9, 317,000 euros, fully paid in – Registered Office: 6, Via Bruno Buozzi, Turin
Tax I.D. and Turin Company Register No. 00489110015

PININFARINA GROUP Quarterly Report at March 31, 2007 Approved by the Board of Directors on May 11, 2007
2
Honorary Chairman Sergio Pininfarina
Board of Directors
Chairman and Chief Executive Officer * Andrea Pininfarina (3)
Vice Chairman Paolo Pininfarina (2) (3)
Directors Franco Bernabè (1) (3)
Elisabetta Carli
Mario Renzo Deaglio (2) (3)
Edoardo Garrone (1) (3)
Carlo Pavesio (2) (3)
Lorenza Pininfarina (3)
Sergio Pininfarina (1)
(1) Member of the Appointments and Compensation Committee
(2) Member of the Internal Control Committee
(3) Member of the Strategy Committee
Board of Statutory Auditors
Chairman Giacomo Zunino
Statutory Auditors Fabrizio Cavalli
Piergiorgio Re
Alternates Nicola Treves
Pier Vittorio Vietti
Secretary to the Board of Directors Gianfranco Albertini Independent Auditors PricewaterhouseCoopers S.p.A.
*Powers Under Article 22 of the Bylaws, the Chairman and Chief Executive Officer is the legal representatives of the Company in front of external parties and courts. Accordingly, he is empowered to carry out all actions that are consistent with the Bylaws and do not conflict with the provisions of Article 2384 of the Italian Civil Code.
3

4

CONTENTS
Review of Operating and Financial Performance page 7
Consolidated Financial Highlights page 10
Reclassified Consolidated Income Statement page 11
Reclassified Consolidated Balance Sheet page 12
Consolidated Net Financial Position page 13
Consolidated Balance Sheet page 14
Consolidated Income Statement page 16
Statement of Changes in Shareholders’ Equity page 17
Consolidated Cash Flow Statement page 18
Companies of the Pininfarina Group page 19
Notes to the Quarterly Consolidated Financial Statements page 20
Other Information page 41
5

6
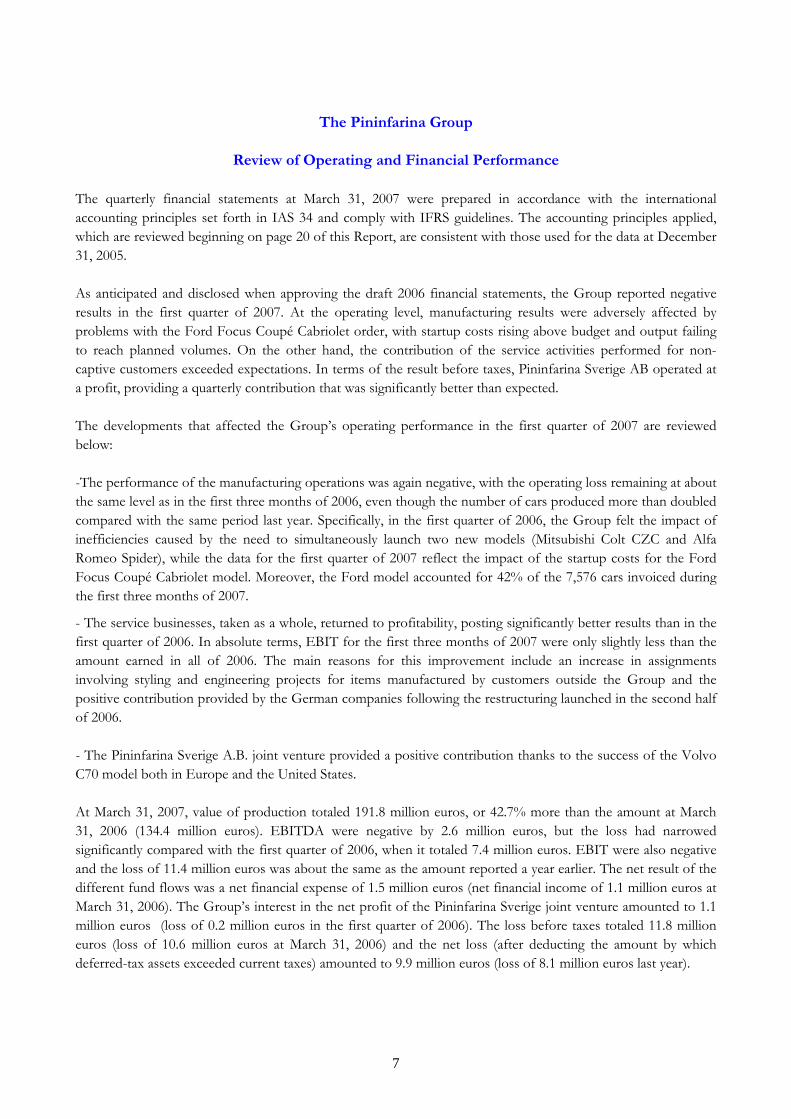
The Pininfarina Group
Review of Operating and Financial Performance
The quarterly financial statements at March 31, 2007 were prepared in accordance with the international accounting principles set forth in IAS 34 and comply with IFRS guidelines. The accounting principles applied, which are reviewed beginning on page 20 of this Report, are consistent with those used for the data at December 31, 2005.
As anticipated and disclosed when approving the draft 2006 financial statements, the Group reported negative results in the first quarter of 2007. At the operating level, manufacturing results were adversely affected by problems with the Ford Focus Coupé Cabriolet order, with startup costs rising above budget and output failing to reach planned volumes. On the other hand, the contribution of the service activities performed for non-captive customers exceeded expectations. In terms of the result before taxes, Pininfarina Sverige AB operated at a profit, providing a quarterly contribution that was significantly better than expected.
The developments that affected the Group’s operating performance in the first quarter of 2007 are reviewed below:
-The performance of the manufacturing operations was again negative, with the operating loss remaining at about the same level as in the first three months of 2006, even though the number of cars produced more than doubled compared with the same period last year. Specifically, in the first quarter of 2006, the Group felt the impact of inefficiencies caused by the need to simultaneously launch two new models (Mitsubishi Colt CZC and Alfa Romeo Spider), while the data for the first quarter of 2007 reflect the impact of the startup costs for the Ford Focus Coupé Cabriolet model. Moreover, the Ford model accounted for 42% of the 7,576 cars invoiced during the first three months of 2007.
- The service businesses, taken as a whole, returned to profitability, posting significantly better results than in the first quarter of 2006. In absolute terms, EBIT for the first three months of 2007 were only slightly less than the amount earned in all of 2006. The main reasons for this improvement include an increase in assignments involving styling and engineering projects for items manufactured by customers outside the Group and the positive contribution provided by the German companies following the restructuring launched in the second half of 2006.
- The Pininfarina Sverige A.B. joint venture provided a positive contribution thanks to the success of the Volvo C70 model both in Europe and the United States.
At March 31, 2007, value of production totaled 191.8 million euros, or 42.7% more than the amount at March 31, 2006 (134.4 million euros). EBITDA were negative by 2.6 million euros, but the loss had narrowed significantly compared with the first quarter of 2006, when it totaled 7.4 million euros. EBIT were also negative and the loss of 11.4 million euros was about the same as the amount reported a year earlier. The net result of the different fund flows was a net financial expense of 1.5 million euros (net financial income of 1.1 million euros at March 31, 2006). The Group’s interest in the net profit of the Pininfarina Sverige joint venture amounted to 1.1 million euros (loss of 0.2 million euros in the first quarter of 2006). The loss before taxes totaled 11.8 million euros (loss of 10.6 million euros at March 31, 2006) and the net loss (after deducting the amount by which deferred-tax assets exceeded current taxes) amounted to 9.9 million euros (loss of 8.1 million euros last year).
7
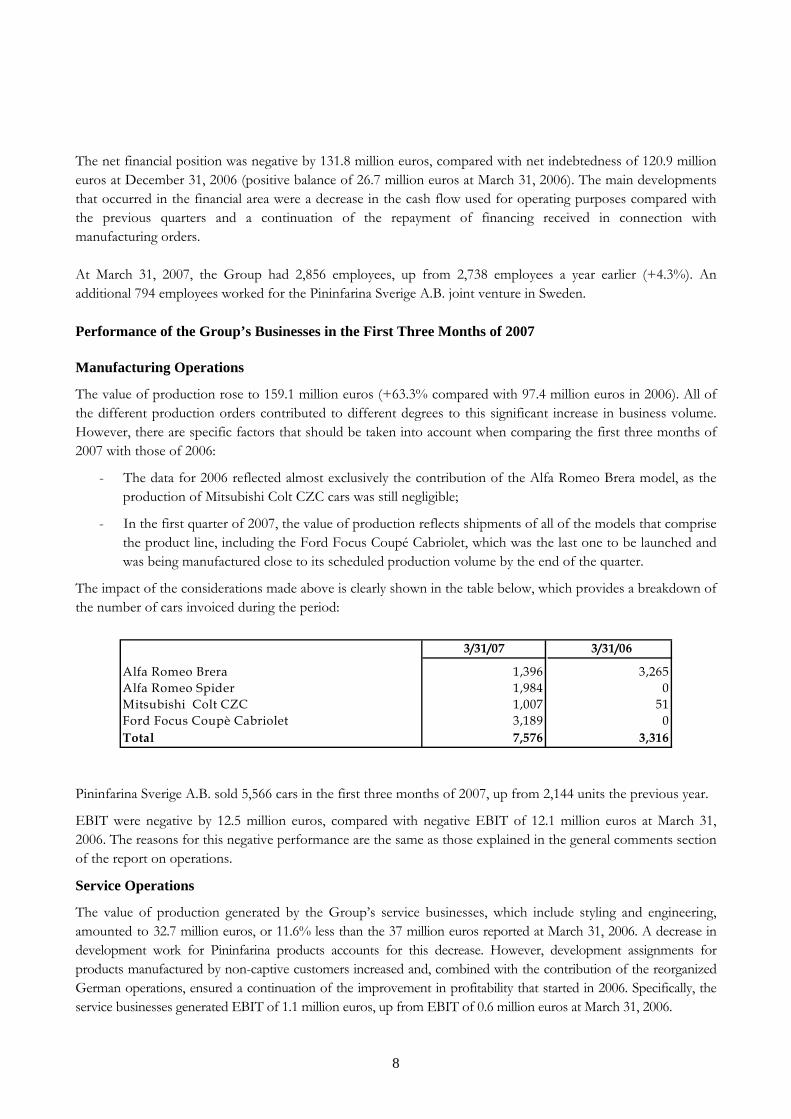
The net financial position was negative by 131.8 million euros, compared with net indebtedness of 120.9 million euros at December 31, 2006 (positive balance of 26.7 million euros at March 31, 2006). The main developments that occurred in the financial area were a decrease in the cash flow used for operating purposes compared with the previous quarters and a continuation of the repayment of financing received in connection with manufacturing orders.
At March 31, 2007, the Group had 2,856 employees, up from 2,738 employees a year earlier (+4.3%). An additional 794 employees worked for the Pininfarina Sverige A.B. joint venture in Sweden.
Performance of the Group’s Businesses in the First Three Months of 2007
Manufacturing Operations
The value of production rose to 159.1 million euros (+63.3% compared with 97.4 million euros in 2006). All of the different production orders contributed to different degrees to this significant increase in business volume. However, there are specific factors that should be taken into account when comparing the first three months of 2007 with those of 2006:
- The data for 2006 reflected almost exclusively the contribution of the Alfa Romeo Brera model, as the production of Mitsubishi Colt CZC cars was still negligible;
- In the first quarter of 2007, the value of production reflects shipments of all of the models that comprise the product line, including the Ford Focus Coupé Cabriolet, which was the last one to be launched and was being manufactured close to its scheduled production volume by the end of the quarter.
The impact of the considerations made above is clearly shown in the table below, which provides a breakdown of the number of cars invoiced during the period:
3/31/07 3/31/06
Alfa Romeo Brera 1,396 3,265Alfa Romeo Spider 1,984 0Mitsubishi Colt CZC 1,007 51Ford Focus Coupè Cabriolet 3,189 0Total 7,576 3,316
Pininfarina Sverige A.B. sold 5,566 cars in the first three months of 2007, up from 2,144 units the previous year.
EBIT were negative by 12.5 million euros, compared with negative EBIT of 12.1 million euros at March 31, 2006. The reasons for this negative performance are the same as those explained in the general comments section of the report on operations.
Service Operations
The value of production generated by the Group’s service businesses, which include styling and engineering, amounted to 32.7 million euros, or 11.6% less than the 37 million euros reported at March 31, 2006. A decrease in development work for Pininfarina products accounts for this decrease. However, development assignments for products manufactured by non-captive customers increased and, combined with the contribution of the reorganized German operations, ensured a continuation of the improvement in profitability that started in 2006. Specifically, the service businesses generated EBIT of 1.1 million euros, up from EBIT of 0.6 million euros at March 31, 2006.
8
Outlook for the Balance of the Year and Significant Events Occurring Since March 31, 2007
Forecasts for the balance of the year call for consolidated value of production to amount to about 800 million euros. The increase over the 589 million euros reported in 2006 will be mainly the result of a complete renewal of the Group’s product line.
EBIT for all of 2007 are expected to be positive, with projections calling for the Group’s regular operations to show a significant increase in profitability during the remainder of the year. The Group should achieve operating breakeven as early as the second quarter of the year.
During the rest of the year, the cash flow from operations, which reflects changes in working capital, will still be insufficient to cover debt services. Consequently, the net financial position is expected to deteriorate further compared with the first quarter of 2007.
No events involving Group companies have occurred to date that would significantly alter the Group’s balance sheet or financial position compared with December 31, 2006.
May 11, 2007
Andrea Pininfarina Chairman
of the Board of Directors
9
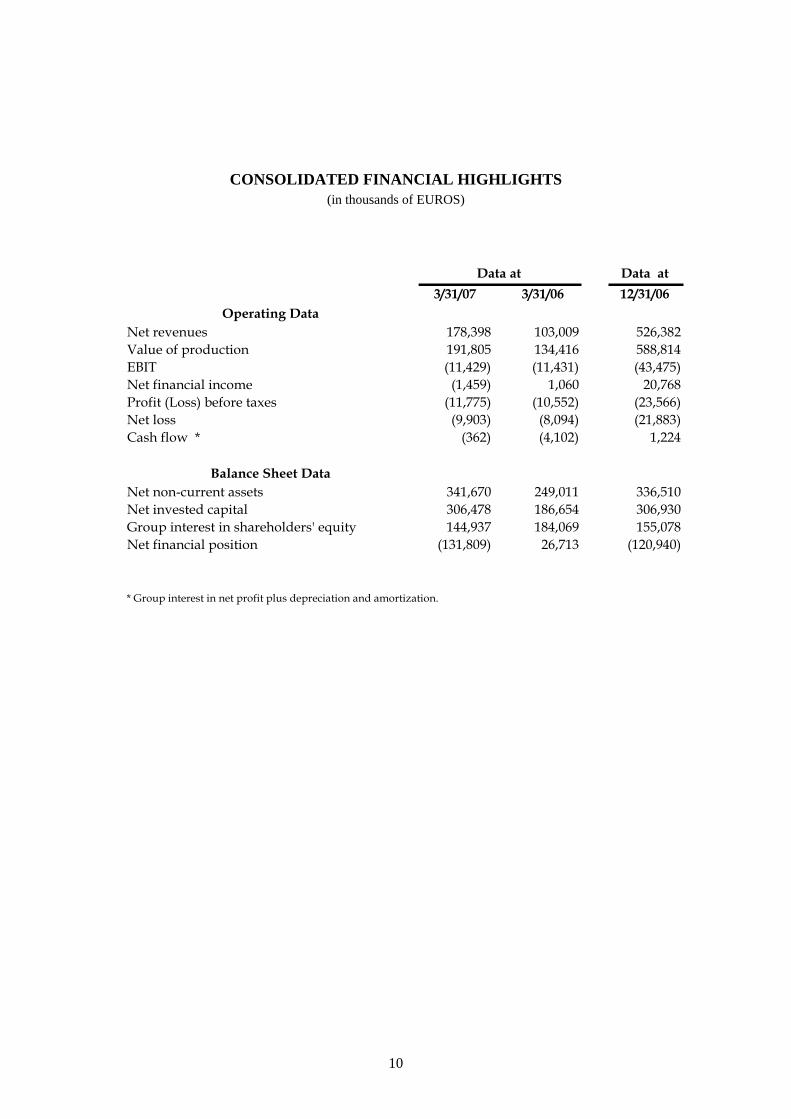
CONSOLIDATED FINANCIAL HIGHLIGHTS (in thousands of EUROS)
Data at 3/31/07 3/31/06 12/31/06
Operating Data Net revenues 178,398 103,009 526,382Value of production 191,805 134,416 588,814EBIT (11,429) (11,431) (43,475)Net financial income (1,459) 1,060 20,768Profit (Loss) before taxes (11,775) (10,552) (23,566)Net loss (9,903) (8,094) (21,883)Cash flow * (362) (4,102) 1,224
Balance Sheet Data Net non-current assets 341,670 249,011 336,510Net invested capital 306,478 186,654 306,930Group interest in shareholders' equity 144,937 184,069 155,078Net financial position (131,809) 26,713 (120,940)
* Group interest in net profit plus depreciation and amortization.
Data at
*
10
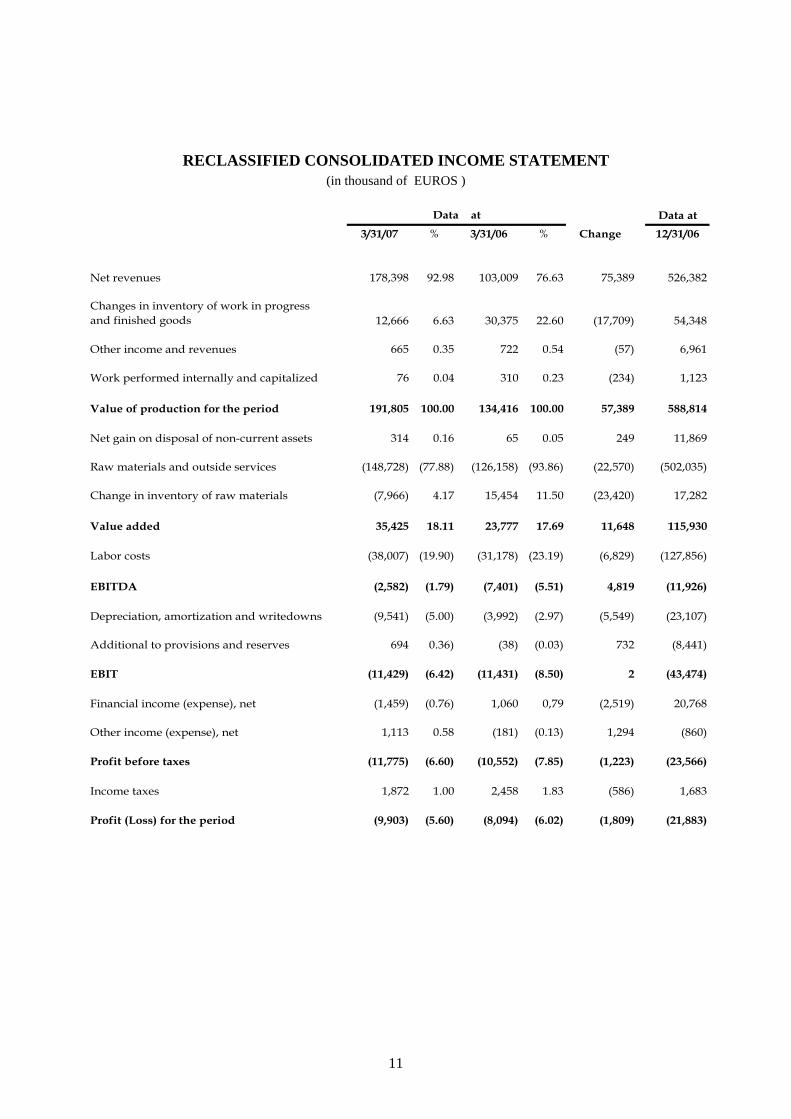
RECLASSIFIED CONSOLIDATED INCOME STATEMENT (in thousand of EUROS )
Data at
3/31/07 % 3/31/06 % Change 12/31/06
Net revenues 178,398 92.98 103,009 76.63 75,389 526,382
Changes in inventory of work in progressand finished goods 12,666 6.63 30,375 22.60 (17,709) 54,348
Other income and revenues 665 0.35 722 0.54 (57) 6,961
Work performed internally and capitalized 76 0.04 310 0.23 (234) 1,123
Value of production for the period 191,805 100.00 134,416 100.00 57,389 588,814
Net gain on disposal of non-current assets 314 0.16 65 0.05 249 11,869
Raw materials and outside services (148,728) (77.88) (126,158) (93.86) (22,570) (502,035)
Change in inventory of raw materials (7,966) 4.17 15,454 11.50 (23,420) 17,282
Value added 35,425 18.11 23,777 17.69 11,648 115,930
Labor costs (38,007) (19.90) (31,178) (23.19) (6,829) (127,856)
EBITDA (2,582) (1.79) (7,401) (5.51) 4,819 (11,926)
Depreciation, amortization and writedowns (9,541) (5.00) (3,992) (2.97) (5,549) (23,107)
Additional to provisions and reserves 694 0.36) (38) (0.03) 732 (8,441)
EBIT (11,429) (6.42) (11,431) (8.50) 2 (43,474)
Financial income (expense), net (1,459) (0.76) 1,060 0,79 (2,519) 20,768
Other income (expense), net 1,113 0.58 (181) (0.13) 1,294 (860)
Profit before taxes (11,775) (6.60) (10,552) (7.85) (1,223) (23,566)
Income taxes 1,872 1.00 2,458 1.83 (586) 1,683
Profit (Loss) for the period (9,903) (5.60) (8,094) (6.02) (1,809) (21,883)
Data at
11
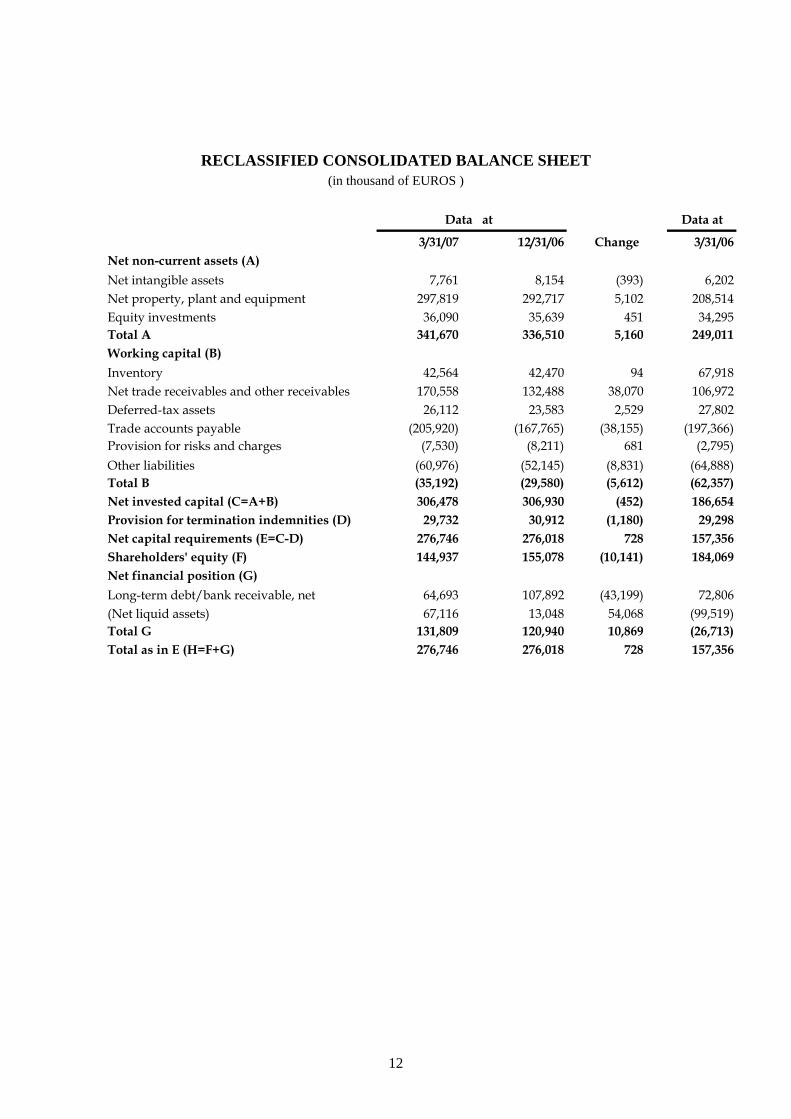
RECLASSIFIED CONSOLIDATED BALANCE SHEET (in thousand of EUROS )
Data at
3/31/07 12/31/06 Change 3/31/06Net non-current assets (A) Net intangible assets 7,761 8,154 (393) 6,202Net property, plant and equipment 297,819 292,717 5,102 208,514Equity investments 36,090 35,639 451 34,295Total A 341,670 336,510 5,160 249,011Working capital (B)Inventory 42,564 42,470 94 67,918Net trade receivables and other receivables 170,558 132,488 38,070 106,972Deferred-tax assets 26,112 23,583 2,529 27,802Trade accounts payable (205,920) (167,765) (38,155) (197,366)Provision for risks and charges (7,530) (8,211) 681 (2,795)Other liabilities (60,976) (52,145) (8,831) (64,888)Total B (35,192) (29,580) (5,612) (62,357)Net invested capital (C=A+B) 306,478 306,930 (452) 186,654Provision for termination indemnities (D) 29,732 30,912 (1,180) 29,298Net capital requirements (E=C-D) 276,746 276,018 728 157,356Shareholders' equity (F) 144,937 155,078 (10,141) 184,069Net financial position (G)Long-term debt/bank receivable, net 64,693 107,892 (43,199) 72,806(Net liquid assets) 67,116 13,048 54,068 (99,519)Total G 131,809 120,940 10,869 (26,713)Total as in E (H=F+G) 276,746 276,018 728 157,356
Data at
12

CONSOLIDATED NET FINANCIAL POSITION
(in thousand of EUROS)
Data at3/31/07 12/31/06 Change 3/31/06
Cash and cash equivalents 13,734 16,933 (3,199) 29,795Current assets held for trading 62,821 61,864 957 60,835Current loans receivable and other receivables 43,652 66,912 (23,260) 50,534Available-for-sale current assets 0 0 0 0Loans receivable from associates and joint ventures 0 0 0 0Bank account overdrafts (32,073) (31,331) (742) (280)Current liabilities under finance leases (90,695) (74,001) (16,694) (41,365)Loans payable to associates and joint ventures 0 0 0 0Current portion of long-term bank debt (64,555) (53,425) (11,130) 0Net liquid assets (67,116) (13,048) (54,068) 99,519Long-term loans and other receivables fromoutsiders 204,320 185,806 18,514 158,062Long-term loans and other receivables from associates and joint ventures 99,711 98,473 1,238 117,485Available-for-sale non current assets 0 0 0 32,092Long-term liabilities under finance leases (264,119) (282,274) 18,155 (221,373)Long-term bank debt (104,605) (109,897) 5,292 (159,072)Long-term debt/loans receivable, net (64,693) (107,892) 43,199 (72,806)Net financial position (131,809) (120,940) (10,869) 26,713
Data at
13

Consolidated Balance Sheet – Assets Note ref. 3/31/07 12/31/06
Property, plant and equipment 297,818,914 292,717,136Land and buildings 5 96,501,904 97,262,193
Land 25,777,809 25,778,147Buildings 59,765,397 60,435,711Leased property 10,958,698 11,048,335
Plant and machinery 5 194,524,419 187,852,130Machinery 38,062,205 27,261,570Plant 41,652,945 42,168,914Leased machinery and equipment 114,809,269 118,421,646
Furniture, fixtures and other property, plant and equipment 5 5,540,665 6,046,720Furniture and fixtures 2,166,836 2,252,706Hardware & software 2,260,273 2,537,988Other property, plant and equipment (including vehicles) 1,113,556 1,256,026Other leased property, plant and equipment 0 0
Assets under construction 5 1,251,926 1,556,093Intangible assets 7,760,915 8,153,782
Goodwill 6 2,301,012 2,301,012Licenses and trademarks 6 4,967,525 5,327,799Other intangibles 6 492,378 524,971
Equity investments 36,090,082 35,638,952Subsidiaries 0 0Associated companies 7 744,800 744,800Joint ventures 7 34,813,130 34,362,000Other companies 7 532,152 532,152
Deferred-tax assets 26,111,653 23,583,203Non-current financial assets 304,031,360 284,278,983
Held-to-maturity long-term investments 0 0Loans and other receivables form: 304,031,360 284,278,983
Outsiders 8 204,320,383 185,806,003Related parties and joint ventures 8 99,710,977 98,472,980
Available-for-sale non-current financial assets 0 0Held-for-sale other non-current assets 0 0TOTAL NON-CURRENT ASSETS 671,812,924 644,372,056Inventory 9 41,335,039 42,067,352
Raw materials 20,580,166 28,603,622Work in process 13,708,455 9,263,584Finished goods 7,046,418 4,200,146
Contract work in progress 9 1,229,114 403,014Current financial assets 106,472,488 128,775,402
Current assets held for trading 8 62,820,740 61,863,888Current loans receivables and other receivables from: 43,651,748 66,911,514
Outsiders 8 43,651,748 66,911,514Related parties and joint ventures 0 0
Available-for-sale current financial assets 0 0Held-to-maturity current investments 0 0
Derivatives 0 0Trade receivables and other receivables 170,558,382 132,487,751
Trade receivables from: 159,753,819 110,224,618Outsiders 151,554,106 101,472,545Related parties and joint ventures 8,199,713 8,752,073
Other receivables 10,804,563 22,263,133Cash and cash equivalents 13,733,592 16,933,218
Cash on hand 870,625 271,608Short-term bank deposits 12,862,967 16,661,610
TOTAL CURRENT ASSETS 333,328,615 320,666,737TOTAL ASSETS 1,005,141,539 965,038,793
14

Consolidated Balance Sheet – Liabilities and Shareholders’ Equity Note ref. 3/31/07 12/31/06
Common shares 10 9,300,547 9,288,847Additional paid-in capital 34,795,951 34,604,184Reserve for treasury stock 12,000,000 12,000,000Statutory reserve 2,231,389 2,231,389Revaluation reserve 0 0Stock option reserve 2,482,280 2,232,280Derivative hedging reserve 0 0Reserve for currency translations 797,357 1,506,737Fair value reserve 0 0Other reserves 97,827,350 103,152,036Retained earnings (Loss) (4,594,759) 11,945,400Profit (Loss) for the period 11 (9,903,182) (21,883,216)GROUP INTEREST IN SHAREHOLDERS' EQUITY 144,936,933 155,077,657Minority interest in shareholders' equity 0 0TOTAL SHAREHOLDERS' EQUITY 144,936,933 155,077,657
Long-term borrowings 368,724,003 392,170,705Collateralized indebtedness 0 0Liabilities under finance leases 12 264,118,717 282,273,753Other indebtedness owed to: 104,605,286 109,896,952
Outsiders 12 104,605,286 109,896,952Related parties and joint ventures 0 0
Deferred-tax liabilities 17,731,359 18,083,673Provision for termination indemnities 29,732,050 30,912,023
Provision for pensions and severance pay 938,632 933,938Provision for termination indemnities 28,793,418 29,978,085
Provision for other liabilities and charges 0 0Decommissioning costs 0 0
TOTAL NON-CURRENT LIABILITIES 416,187,412 441,166,401Current borrowings 187,323,466 158,756,819
Due to banks 12 32,073,452 31,331,116Collateralized indebtedness 0 0Liabilities under finance leases 12 90,694,850 74,000,953Bonds outstanding and other borrowings owed to: 64,555,164 53,424,750
Outsiders 12 64,555,164 53,424,750Related parties and joint ventures 0 0
Other payables 32,769,388 24,955,282Wages and salaries 15,904,077 11,091,264Due to social security institutions 6,443,413 6,407,532Vacation days, sick days and personal days 616,572 411,827Other liabilities 9,805,326 7,044,659
Trade accounts payable 205,920,371 167,764,794Accounts payable to outsiders 204,366,225 165,282,937Account payable to associated companies and joint ventures 1,176,190 1,973,083Advances received for work in progress 377,956 508,774
Provision for current taxes 3,150,621 1,674,522Direct taxes 667,305 253,755Other taxes 2,483,316 1,420,767
Financial derivatives 0 0Provision for other liabilities and charges 7,529,574 8,211,041
Provision for warranties 13 1,057,585 1,021,850Provision for lawsuits 0 0Provision for restructuring programs 13 4,018,142 4,464,000Other provisions 13 2,453,847 2,725,191
Other liabilities 7,323,774 7,432,277TOTAL CURRENT LIABILITIES 444,017,194 368,794,735TOTAL LIABILITIES 860,204,606 809,961,136TOTAL LIABILITIES AND SHAREHOLDERS' EQUITY 1,005,141,539 965,038,793
15

Consolidated Income Statement
Note ref. 3/31/07 3/31/06
Sales and service revenues 178,398,330 103,008,671Increase in Company-produced non-current assets 75,699 309,936Change in inventories of finished goods and work in progress 12,666,205 30,375,495
Change in contract work in progress 5,323,184 22,774,971
7,343,021 7,600,524
Other income and revenues 16 665,069 722,324Total value of production 191,805,303 134,416,426
Gain on the sales of non-current assets 17 336,848 65,006Amount earned on the sale of equity investments 0 0
Raw materials and consumables used (135,958,209) (83,319,356)Raw materials and components (127,992,056) (98,772,949)
(7,966,153) 15,453,593Provision for inventory risk 0 0
Other variable production costs (2,631,724) (2,390,118) Consumables (1,384,179) (1,169,837) Utilities (169,701) (232,666) External maintenance costs (1,077,844) (987,615)External variable engineering services (8,172,841) (14,625,111)Wages, salaries and employee benefits (38,007,046) (31,177,608)
Production staff, office staff and managers (33,333,608) (29,673,756)Independent contractors (3,441,925) (142,799) Social security and other post-employment benefits (1,231,513) (1,361,053)Cost of profit sharing compensation 0 0
Depreciation, amortization and writedowns (9,563,943) (3,991,886) Depreciation of property, plant and equipment 18 (9,056,509) (3,483,783) Loss on disposals of property, plant and equipment (22,791) 0Amortization of intangibles 19 (484,643) (508,103) Writedowns 0 0
Utilization of negative goodwill 0 0Foreign exchange gains (losses) (1,247) (15,710)Other expenses (9,236,127) (10,392,591) Profit (Loss) from operations (11,428,986) (11,430,948)Financial income (expense), net 20 (1,459,053) 1,060,185Dividends 0 0Value adjustments 21 1,121,033 (187,565)Non-recurring income (expense) (8,087) 6,415Profit (Loss) before taxes (11,775,093) (10,551,913)Income taxes for the period 22 1,871,911 2,458,315Profit (Loss) for the period (9,903,182) (8,093,598)
3/31/07 3/31/06
Profit (Loss) for the period (9,903,182) (8,093,598)Number of common share, net 9,300,547 9,316,280Basic earnings (loss) per share (1.06) (0.87)
Change in inventories of work in progress, semifinished and finished goods
Change in inventories of raw materials, subsidiary materialsand consumables
16

Statement of Change in Consolidated Shareholders’ Equity
12/31/04Fair value
gains (losses) Translation
restatementsProfit (Loss) for the year
Employee stock option plan
Changes to reserves
Dividends Purchases /Sales of
treasury shares 12/31/05
Common Shares 9,182,502 129,653 9,312,155Additional paid-in capital 33,910,650 2,305,211 36,215,861Reserve for trasury stock 27,434,512 (15,434,512) 12,000,000Statutory reserve 2,231,389 2,231,389Stock option reserve 527,691 793,042 1,320,733Reserve for currency translations 3,726 (256,590) (252,864)Fair value reserve 8,265,701 4,241,812 12,507,513Other reserves 97,522,513 16,542,470 (3,122,051) 110,942,932
Retained earnings 15,895,428 (3,512,637) 12,382,791Profit (Loss) for the year (2,404,679) (8,103,394) 2,404,679 (8,103,394)
192,569,433 4,241,812 (256,590) (8,103,394) 793,042 (3,122,051) 2,434,864 188,557,116Minority interest in shareholders' equity TOTAL SHAREHOLDERS' EQUITY 192,569,433 4,241,812 (256,590) (8,103,394) 793,042 (3,122,051) 2,434,864 188,557,116
12/31/05Fair value
gains (losses) Translation
restatementsProfit (Loss) for the year
Employee stock option plan
Changes to reserves Dividends
Purchases /Sales of
treasury shares 12/31/06
Common Shares 9,312,155 (23,308) 9,288,847Additional paid-in capital 36,215,861 (1,611,677) 34,604,184Reserve for trasury stock 12,000,000 12,000,000Statutory reserve 2,231,389 2,231,389Stock option reserve 1,320,733 911,547 2,232,280Reserve for currency translations (252,864) 1,759,601 1,506,737Fair value reserve 12,507,513 (12,507,513) 0Other reserves 110,942,932 (7,790,896) 103,152,036
Retained earnings 12,382,791 (437,391) 11,945,400Profit (Loss) for the year (8,103,394) (21,883,216) 8,103,394 (21,883,216)
188,557,116 (12,507,513) 1,759,601 (21,883,216) 911,547 (124,893) (1,634,985) 155,077,657Minority interest in shareholders' equity TOTAL SHAREHOLDERS' EQUITY 188,557,116 (12,507,513) 1,759,601 (21,883,216) 911,547 (124,893) (1,634,985) 155,077,657
12/31/06Fair value
gains (losses) Translation
restatementsProfit (Loss) for the year
Employee stock option plan
Changes to reserves Dividends
Purchases /Sales of
treasury shares 3/31/07
Common Shares 9,288,847 11,700 9,300,547Additional paid-in capital 34,604,184 191,767 34,795,951Reserve for trasury stock 12,000,000 12,000,000Statutory reserve 2,231,389 2,231,389Stock option reserve 2,232,280 250,000 2,482,280Reserve for currency translations 1,506,737 (709,380) 797,357Fair value reserve 0 0Other reserves 103,152,036 (5,324,686) 97,827,350
Retained earnings 11,945,400 (16,540,159) (4,594,759)Profit (Loss) for the year (21,883,216) (9,903,182) 21,883,216 (9,903,182)
155,077,657 (709,380) (9,903,182) 250,000 18,371 203,467 144,936,933Minority interest in shareholders' equity TOTAL SHAREHOLDERS' EQUITY 155,077,657 (709,380) (9,903,182) 250,000 18,371 203,467 144,936,933
GROUP INTEREST IN SHAREHOLDERS' EQUITY
GROUP INTEREST IN SHAREHOLDERS' EQUITY
GROUP INTEREST IN SHAREHOLDERS' EQUITY
17
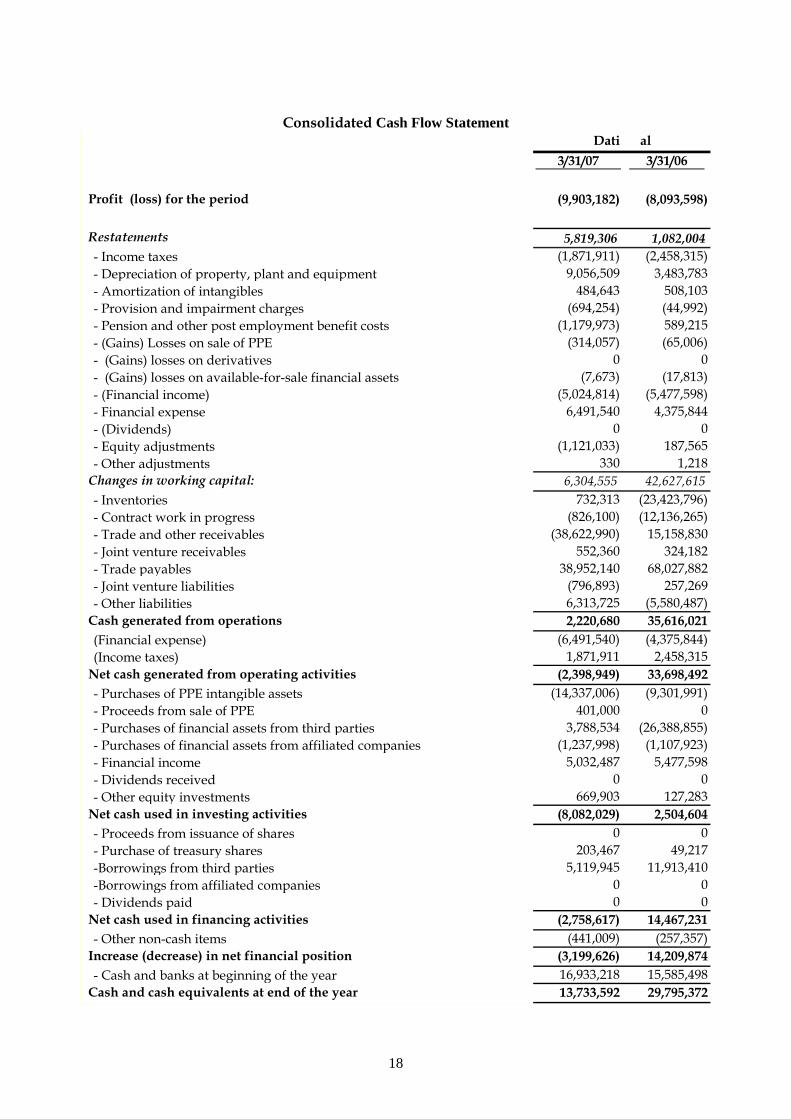
Consolidated Cash Flow Statement
3/31/07 3/31/06
Profit (loss) for the period (9,903,182) (8,093,598)
Restatements 5,819,306 1,082,004- Income taxes (1,871,911) (2,458,315)- Depreciation of property, plant and equipment 9,056,509 3,483,783- Amortization of intangibles 484,643 508,103- Provision and impairment charges (694,254) (44,992)- Pension and other post employment benefit costs (1,179,973) 589,215- (Gains) Losses on sale of PPE (314,057) (65,006)- (Gains) losses on derivatives 0 0- (Gains) losses on available-for-sale financial assets (7,673) (17,813)- (Financial income) (5,024,814) (5,477,598)- Financial expense 6,491,540 4,375,844- (Dividends) 0 0- Equity adjustments (1,121,033) 187,565- Other adjustments 330 1,218
Changes in working capital: 6,304,555 42,627,615- Inventories 732,313 (23,423,796)- Contract work in progress (826,100) (12,136,265)- Trade and other receivables (38,622,990) 15,158,830- Joint venture receivables 552,360 324,182- Trade payables 38,952,140 68,027,882- Joint venture liabilities (796,893) 257,269- Other liabilities 6,313,725 (5,580,487)
Cash generated from operations 2,220,680 35,616,021(Financial expense) (6,491,540) (4,375,844)(Income taxes) 1,871,911 2,458,315
Net cash generated from operating activities (2,398,949) 33,698,492- Purchases of PPE intangible assets (14,337,006) (9,301,991)- Proceeds from sale of PPE 401,000 0- Purchases of financial assets from third parties 3,788,534 (26,388,855)- Purchases of financial assets from affiliated companies (1,237,998) (1,107,923)- Financial income 5,032,487 5,477,598- Dividends received 0 0- Other equity investments 669,903 127,283
Net cash used in investing activities (8,082,029) 2,504,604- Proceeds from issuance of shares 0 0- Purchase of treasury shares 203,467 49,217-Borrowings from third parties 5,119,945 11,913,410-Borrowings from affiliated companies 0 0- Dividends paid 0 0
Net cash used in financing activities (2,758,617) 14,467,231- Other non-cash items (441,009) (257,357)
Increase (decrease) in net financial position (3,199,626) 14,209,874- Cash and banks at beginning of the year 16,933,218 15,585,498
Cash and cash equivalents at end of the year 13,733,592 29,795,372
Dati al
18

Companies of the Pininfarina Group at March 31, 2007 (data presented in accordance with the new IAS accounting principles)
The Pininfarina Extra Group ended the first quarter of 2007 with value of production of 1.1 million euros (1.2 million euros in the same period last year). The net profit for the period amounted to 177,000 euros, compared with 190,000 euros in the first three months of 2006.
At March 31, 2007, the Matra Automobile Engineering Group reported value of production of 16.3 million euros and a consolidated loss of 0.3 million euros, compared with 13.5 million euros and 0.6 million euros, respectively, in the first quarter of 2006. Thanks to the increase in value of production and an improvement in operating efficiency, the group was able cut its loss in half during the year’s opening quarter and expects to report a profit for the year as a whole. The Pininfarina Deutschland Group booked value of production of 3.7 million euros in the first three months of 2007 (1.4 million euros at March 31, 2006) and a net profit of 233,000 euros (net loss of 0.5 million euros a year earlier). The sharp improvement compared with the first quarter of 2006 reflects the positive impact of the restructuring of this German group, which was carried out in the second half of 2006 and resulted in the divestiture of the manufacturing operations and the acquisition of MPX Entwicklung GmbH, a company based in Munich, Germany, that specializes in the provisions of engineering services. RHTU AB had value of production of 1.1 million euros (0.9 million euros in the first quarter of 2006) and reported a net loss of 88,000 euros (virtual breakeven the previous year). The rise in value of production is due to an increase in orders by Pininfarina Sverige A.B. of retractable hard tops that are being installed in the Volvo C70. In the first three months of 2007, Pininfarina Sverige AB reported value of production of 147.8 million euros and a net profit of 1.9 million euros, compared with value of production of 105.7 million euros and a net loss of 0.5 million euros at March 31, 2006 (data at 100% for this joint venture). In the first quarter of 2007, the company manufactured 5,566 cars, up from 2,144 units the previous year. The significant improvement in quarterly data is explained by the fact that the company reached full operating efficiency in 2007, while it was still in the process of starting up production for the Volvo C70 order. Pininfarina S.p.A., the Group’s Parent Company, reported value of production of 169.7 million euros at March 31, 2007, compared with 118.4 million euros in the first three months of 2006 (+43.3%). The loss for the period came to 10.3 million euros, compared with a loss of 7 million euros in the first quarter of 2006. The net financial position showed a negative balance of 102.7 million euros (positive balance of 44.6 million euros in the same period last year). Most of the remarks made in the review of the Group’s performance in the first three months of 2007 apply to the Parent Company as well.
19
Notes to the Quarterly Consolidated Financial Statements
1. General Information
The Pininfarina Group is an industrial enterprise that is centered around a core of automotive operations and based on the establishment of comprehensive collaborative relationships with carmakers. Pininfarina operates as a global partner. Its highly flexible approach enables it to work with customers through the entire product development process — design, planning, development, industrialization and manufacturing — or to provide support during any one of these phases. The Group has production and development facilities in Italy, France, Germany, Sweden and Morocco. Its customers are located mainly in Italy, France, Great Britain and China. Pininfarina is a corporation that has its registered office at 6 via Bruno Buozzi, in Turin. The Company’s shares are traded on the regular segment of the Borsa Italiana securities market. The consolidated quarterly report was approved by the Board of Directors on May 11, 2007.
2. Accounting Principles
2.1 Presentation Criteria
As required by: − Legislative Decree No. 38 of February 28, 2002; − European Regulation No. 1606 of July 19, 2002 ; − Article 82 of Issuers’ Regulation No. 11971, as amended by CONSOB Resolution No. 14990 of April
14, 2005; the Pininfarina Group prepared its Quarterly Report at March 31, 2007 in accordance with the IFRSs. With regard to the adoption of IAS 1, the Group chose to use the following financial statement presentation formats, because of their ability to deliver reliable and more meaningful information:
• Balance sheet: assets and liabilities are divided into the current and non-current categories; • Income statement: the individual items have been classified by type.
No changes have occurred in the accounting principles that would require a restatement of the opening balances. The methods used to compute estimates have also remained the same. 2.2 Consolidation
(a) Subsidiaries
These are companies over which the Group exercises control, as defined in IAS 27 – Consolidated Financial Statements and Separate Financial Statements. Control is presumed to exist when the Group controls more than half of the voting rights, either directly or as a result of shareholders’ agreements or potential voting rights. Subsidiaries are consolidated from the moment the Group is able to exercise control and are deconsolidated when control ends.
The Group accounts for the acquisition of controlling interests by the purchase method. This method, which is provided in IFRS 3, Business Combinations, requires that the acquiree’s identifiable assets and liabilities be recognized at their fair value as of the acquisition date. The cost of acquisition in the sum of the price paid plus any incidental charges.
20

Any difference between the cost paid and the Group’s pro rata interest in the fair value of the net assets it acquired is capitalized and recognized as goodwill, if positive, or charged directly to income, if negative. Revenues and expenses and receivables and payables that arise from transactions between Group companies are eliminated in the consolidation process. When necessary, the accounting principles of subsidiaries are amended to make them consistent with those of the Group’s Parent Company.
(b) Associated Companies and Joint Ventures The Group is deemed to exercise a significant influence when it controls between 20% and 50% of the voting rights. Investments in associated companies and joint ventures are recognized initially at cost and are then valued by the equity method. The Group’s investments in associated companies and joint ventures include any goodwill that was recognized at the time of acquisition, less accumulated impairment losses. The Group’s income statement reflects the Group’s pro rata interest in the result of associated companies and joint ventures. If an associated company or a joint venture recognizes an adjustment that entails a direct charge to shareholders’ equity, the Group recognizes its pro rata share of the charge and shows it in its statement of changes in shareholders’ equity. The Group’s pro rata interest in losses incurred by an associated company or a joint venture is recognized on the Group’s financial statements until the value of the corresponding equity investment is written off. Any additional loss is posted to the provisions for risks and losses only to the extent that the Group has undertaken obligations or made payments on behalf of the associated company or joint venture. Gains generated through transactions with an associated company or a joint venture are eliminated against the value of the investment. The same is done for losses, unless the losses stem from an impairment of the assets subject of the transaction. When necessary, the accounting principles of associated companies and joint ventures are amended to make them consistent with those of the Group’s Parent Company. (c) Other Companies Investments in other companies that constitute available-for-sale financial assets are valued at fair value, if available, and any resulting gains or losses are recognized in equity until the assets are sold or their value is impaired. At that point, accumulated gains or losses previously recognized in equity are reflected on the income statement for the period. Investments in small companies for which a fair value may not be available are carried at cost, adjusted for any impairment losses. Dividends received from these companies are recognized as Other income (expense) generated from equity investment transactions. 2.3 Translation of Items Denominated in Foreign Currencies
(a) Functional Currency and Presentation Currency The financial statements of subsidiaries, associated companies and joint ventures are presented in the corresponding functional currency, which is the currency used in their primary business environment. The presentation currency of the Pininfarina Group is the euro. (b) Assets, Liabilities and Transactions in Currencies Other Than the Euro Transactions executed in currencies other than the euro are recognized initially at the exchange rate in force on the date of the transaction.
21

Monetary assets and liabilities denominated in currencies other than the euro are converted into euros at the exchange rate in force on the balance sheet date. All translation differences are recognized in the income statement, except for differences stemming from loans in foreign currencies that hedge investments in foreign subsidiaries. These differences, and the corresponding tax consequences, are recognized directly in equity until the equity investment is sold, at which point the translation differences are recognized in the income statement. Non-monetary items that are carried at historical cost are translated into euros at the exchange rate in force when the underlying transaction was first recognized. Non-monetary items that are carried at fair value are translated into euros at the exchange rate in force on the date when each item’s fair value was determined. (c) Group Companies No company of the Pininfarina Group operates in a high-inflation economic environment. The assets and liabilities of Group companies that use a functional currency different from the euro are translated into euros at the exchange rate in force on the balance sheet date. The income statement is translated at the average exchange rate for the reporting period. Translation differences are recognized directly in equity and are shown separately in the Translation reserve. When an investee company is sold, the corresponding portion of this reserve is reflected in the income statement. Goodwill and fair value adjustments to the assets and liabilities of foreign companies are translated into euros at the year-end exchange rate. 2.4 Property, Plant and Equipment
All classes of property, plant and equipment are carried at their historical cost, less accumulated depreciation and impairment losses, except for land, which is carried at its historical cost less impairment losses. Cost includes all expenses directly attributable to the purchase. Costs incurred after an asset has been acquired can be capitalized only if it is likely that they will produce future economic benefits and if the costs can be measured reliably. The depreciation of property, plant and equipment is computed on a straight-line basis, so as to distribute each asset’s residual carrying value over its remaining useful life. Extraordinary maintenance costs that have been capitalized and added to the carrying value of an existing asset are depreciated over the residual useful life of the asset or over the period of time until the next maintenance overhaul, whichever is shorter. The residual values and useful lives of property, plant and equipment are reviewed, and changed if necessary, on the balance sheet date. Gains and losses on the sale of property, plant and equipment are recognized in the income statement. They represent the difference between an item’s carrying amount and its sales price. In this and subsequent sections of these notes, the term “impairment” shall mean the adjustment made to the carrying amount of a non-current asset to make it consistent with the asset’s recoverable value. 2.5 Intangible Assets
(a) Goodwill Goodwill represents the excess of the price paid for net identifiable assets at the time of their acquisition over their fair value, determined on the date when control was acquired. Goodwill generated by the acquisition of an interest in a subsidiary is recognized as an intangible asset. Goodwill generated by the acquisition of an interest in an associated company is recognized as an addition to the value of the underlying equity investment.
22

Goodwill is recognized in the financial statements at the value determined on the date control is acquired and is thereafter adjusted for any impairment loss, based on a test performed at least once a year. The calculation of a gain or loss on the sale of an equity investment must take into account the carrying amount of the applicable goodwill. An impairment test is made by comparing the carrying amount of goodwill against the present value of the future cash flow that homogeneous groups of assets are expected to produce. (b) Software and Other Licenses The cost actually incurred to secure software licenses and other similar licenses, including the expenses required to put them into use, are capitalized and amortized over the estimated useful lives of the licenses (three to five years). The costs incurred to develop and maintain software are treated as operating expenses and charged to income in the year they are incurred. Costs incurred to develop software that can be identified and controlled by the Pininfarina Group and which has a high probability of producing greater economic benefits than the cost incurred during a single year are capitalized as an intangible asset and amortized over the useful life of the corresponding asset (not more than three years). (c) Research and Development Costs Research costs are charged to income in the year they are incurred. Development costs, other than those referred to in the paragraph below, are capitalized as intangible assets only if they can be measured reliably and it is clear that the project for which they are being incurred has a high chance of success, both in terms of technical feasibility and commercial acceptance. Development costs that do not meet these characteristics are treated as operating expenses. Development costs that were charged to income in previous years may not be capitalized at a later date, even if they then meet the requirements for capitalization. Development costs with a finite useful life are amortized from the date the resulting product was brought to market over the length of time during which they are expected to produce economic benefits, but not more than five years. The Pininfarina Group carries out development work on behalf of its clients under contracts that involve the styling, engineering and manufacture of automobiles or just design and engineering work. These contracts, which are covered by the provisions of IAS 11 – Construction Contracts, are handled on an inventory basis and, consequently, do not generate capitalized intangible assets. Styling activities carried out for internal use are deemed to be the same as research activities and the resulting costs are charged to income when incurred. (d) Other Intangibles Other intangibles acquired separately are capitalized at cost. Those acquired through business combinations are capitalized at their fair value as of the date of acquisition. After initial recognition, intangibles with a finite useful life are carried at cost less depreciation and impairment losses. Intangibles with an undefined useful life are carried at cost less impairment losses. The useful lives of other intangibles are reviewed once a year. Any resulting changes are applied from that point on. 2.6 Recoverable Amount of Assets The recoverable amount of intangibles with an indefinite useful life that are not amortized should be tested for impairment at least once a year. Assets that are amortized are tested for impairment only when there is an indication that their carrying amount may not be recoverable.
23

The amount of the impairment writedown should be equal to the difference between an assets’ carrying amount and its recoverable amount, computed as the greater of the asset’s sales price (net of transaction costs) and its value in use. The recoverable amount of the assets is determined by grouping basic cash generating units. 2.7 Financial Assets The Group divides its investments into four categories: a) financial assets carried at fair value, with changes in value recognized in earnings; b) loans and other financial receivables; c) held-to-maturity investments; and d) held-for-sale financial assets. The basis for this classification is the reasoning behind an asset’s acquisition. Management allocates financial assets to the appropriate category at the time of purchase and reviews this allocation at the end of each year. (a) Financial Assets Carried at Fair Value, with Changes in Value Recognized in Earnings This category is divided into two classes: 1) financial assets held for trading and 2) assets held as negotiable assets from the time of acquisition. An asset is included in this category if it was acquired mainly to be resold over the short term or if it was placed in this category by the Company’s management. Any derivatives that do not qualify as hedges are included in the held-for-trading class. Financial assets that fall into these two classes are listed as current assets when they are held for trading or are expected to be sold within 12 months from the balance sheet date. (b) Loans and Other Financial Receivables Loans and other financial receivables are non-derivative financial assets that entail fixed or determinable payments, are not traded on a regulated market and are not held for trading. They are listed as current assets, except for the portion due after one year, which is classified under non-current assets. (c) Held-to-maturity Investments These are non-derivative financial assets that entail fixed or determinable payments and have a fixed maturity and which the Group plans and has the financial ability to hold to maturity. (d) Held-for-sale Financial Assets Held-for-sale financial assets are those non-derivative financial assets that are designated as available for sale and those non-derivative financial assets that do not fall into any of the previous categories. These assets are listed as current assets, unless management decides not to sell them within 12 months from the balance sheet date. Purchases and sales of financial assets are recognized on the transaction date, which is the date when the Group agrees to buy or sell an asset. All financial assets (except for financial assets carried at fair value) whose changes in value are recognized in earnings, are initially recognized at their fair value, plus transaction costs. Financial assets are removed from the financial statements when they cease to deliver cash flow, or the right to receive such cash flow is transferred, or when the Group effectively transfers all of the risks and benefits inherent in ownership to a third party. Following their purchase, assets that are categorized either as Held-for-sale financial assets or as Financial assets carried at fair value (whose changes in value are recognized in earnings) are valued at fair value. The assets included in the other two categories (Loans and other financial receivables and Held-to-maturity investments) are valued at their amortized cost, computed by the effective interest method.
24
Realized and unrealized gains and losses from changes in the fair value of financial assets categorized as Financial assets carried at fair value (whose changes in value are recognized in earnings) are reflected in the income statement in the year when they are generated. Unrealized gains and losses from changes in the fair value of non-monetary securities categorized as Held-for-sale assets are recognized in equity. When securities categorized as Held-for-sale assets are sold or their value is impaired, adjustments to their fair value that have accumulated in a separate shareholders’ equity reserve are recognized in earnings as a gain or loss on the sale. The fair value of investments in listed securities is based on current bid prices. If an active market is not available for these financial assets or they are unlisted equity securities, fair value is determined by the Group using such valuation techniques as making reference to market transactions involving similar instruments or discounting future cash flows, adjusted as necessary to reflect the specific characteristics of the issuers. At the end of each fiscal year, the Group tests its financial assets for objective indications of the existence of impairment losses. In the case of financial assets that represent equity investments categorized as Held-for-sale assets, a significant and prolonged decline in their fair value, as compared to their cost, is one of the elements that should be considered in determining a loss of value. If this type of evidence exists for a financial asset categorized as a Held-for-sale asset, the accumulated loss, calculated as the difference between the asset’s cost and its current fair value (net of previous writedowns), is reversed out of shareholders’ equity and posted to the income statement. Writedowns that have been recognized in earnings cannot be reversed. 2.8 Inventory Inventory is carried at cost or estimated net realizable value, whichever is smaller. Net realizable value is the selling price in the ordinary course of business, less the variable costs necessary to make the sale. Cost is determined by the FIFO (“first-in, first-out”) method. The cost of finished goods and semifinished goods includes design, raw materials and direct labor costs, as well as other direct costs and other indirect costs that can be allocated to the manufacturing operations based on a normal level of production capacity. This costing formula does not include borrowing costs. 2.9 Trade Receivables and Other Receivables Trade receivables are initially recognized at fair value. Subsequently, they are valued at amortized cost computed by the effective interest rate method, net of writedowns for uncollectible accounts. Writedowns of receivables are accounted for as if there was objective evidence that the Group will be unable to collect the full amounts that customers have agreed to pay on the dates due. The amount of the writedown, which should correspond to the difference between the carrying amount of the receivables and the present value of future collections, discounted at the effective interest rate, is recognized in the income statement. 2.10 Cash and Cash Equivalents The Cash and cash equivalents account includes cash on hand, readily available bank deposits, overdraft facilities and liquid investments due within three months. Overdraft utilizations are recognized as current liabilities. 2.11 Share Capital The Company’s common share capital is listed in the shareholders’ equity section of the balance sheet. Incidental expenses incurred to issue share capital or options are recognized under shareholders’ equity. If a Group company buys shares of Pininfarina S.p.A. or Pininfarina S.p.A. purchases treasury shares (within the constraints of the applicable statutes), the price paid, net of any directly attributable incidental charges, is deducted from shareholders’ equity until the shares are canceled, reissued, awarded to employees or sold.
25
2.12 Borrowings Initially, borrowings are recognized at fair value, net of any incidental charges. Subsequently, they are valued by the amortized cost method. Any difference between the collection amount, net of any incidental charges, and the redemption amount is recognized in earnings on an accrual basis, computed by the effective interest rate method. The portion of borrowings that is due within one year is listed among current liabilities. The portion due after one year is recognized as a non-current liability only if the Group has an unconditional contractual right to defer repayment. 2.13 Deferred Taxes Deferred taxes are computed on all temporary differences between the carrying amount of assets and liabilities and the amount attributed to those assets and liabilities for tax purposes. Temporary differences are not computed on:
- Goodwill generated by a business combination; - Initial recognition of assets and liabilities upon the execution of a transaction that is not a business
combination and has no impact on reported results for the period or on taxable income. Deferred-tax liabilities are computed using the tax rates in force in the business environments in which the companies of the Group operate and in accordance with the tax laws that have been enacted, or which can be deemed to have been virtually enacted as of the balance sheet date and which are expected to apply when the temporary differences that required the recognition of a deferred-tax liability are reversed. Deferred-tax assets are recognized only if it is likely that the Company will have earned sufficient taxable income to offset them when the temporary differences that required their recognition are reversed. Deferred-tax assets are reviewed at each balance sheet date and are adjusted to reflect changes in the expectation that the Company will earn sufficient taxable income in the future to utilize all or part of the deferred-tax assets. Deferred-tax liabilities are computed on temporary differences generated in connection with equity investments in subsidiaries, associated companies and joint ventures, except in those cases where the reversal of the temporary differences can be controlled by the Group and it is unlikely to occur in the near future. Temporary differences on components of shareholders’ equity are posted directly to shareholders’ equity. 2.14 Employee Benefits (a) Pension Plans The employees of the Pininfarina Group have access to defined-contribution and defined-benefit plans. None of these plans has dedicated plan assets. Based on IFRS guidelines (IAS 19), the Provision for termination indemnities attributable to employees of the Pininfarina Group, computed in accordance with Article 2120 of the Italian Civil Code, is a defined-benefit pension plan. Defined-benefit plans are pension plans in which the pension benefit that an employee will receive at the end of the employment relationship is defined based on such factors as age, years of services and salary earned. Defined-contribution plans are plans under which the Group pays a fixed contribution to a separate entity. The Group has no further statutory or implied obligations to pay additional sums, should the plan’s assets prove to be inadequate to pay benefits for current or past service.
26

The liability recognized in the financial statements for defined-benefit plans is the present value of the obligation on the balance sheet date, adjusted for actuarial gains and losses and for the cost of benefits paid for past service. This liability is determined annually by an independent actuary, who must be a member of the relevant national board, using the Projected Unit Credit Method. The present value of the liability is determined by discounting future outlays at the exchange rate of government securities that are denominated in the same currency as that in which the benefits will be paid and have a maturity that approximates the due date of the underlying pension liability. The portion of the cumulative amount of the actuarial gains and losses generated by changes in estimates that is larger than 10% of the fair value of plan assets or 10% of the plan’s liabilities, whichever is greater, is recognized in the income statement on a pro rata basis over the average remaining working life of the employees who are enrolled in the plan. Benefit costs for past service are recognized immediately in the income statement, except in those cases where changes in benefits are not predicated on the length of service of employees (vesting period). In such cases, benefit costs for past service are amortized on a straight line over the vesting period. Under defined-contribution plans, the Group makes contributions to public and private pension funds on a statutory, contractual or voluntary basis. Once the Group has made these contributions, it incurs no further obligation. Contributions are reflected in the income statement as part of labor costs when they become due. Contributions made in advance are recognized as a prepaid expense only if the Group expects to receive a refund or a reduction in future payments. (b) Incentives, Bonuses and Profit Sharing Plans The Group recognizes the costs and liabilities that arise from profit sharing plans in accordance with a formula that is based on the profit attributable to shareholders, with appropriate adjustments. The Group sets aside a provision only if it is contractually obligated to do so or if established practice is to establish such a provision. (c) Employee Benefits Paid in Shares of Stock The Group’s management, at its sole discretion and from time to time, awards bonuses to key employees in the form of options to buy Company shares. The right to exercise the options vests after one year of service, if certain personal objectives are reached. The fair value of the options is a labor cost of the fiscal year and is added to a special equity reserve for the duration of the option vesting period. When the options are exercised, the amount collected, net of any transaction costs, is added to share capital (the portion corresponding to the par value of the shares) and to additional paid-in capital (the amount paid in excess of par value). 2.15 Provisions for Risks and Charges Additions are made to the provisions for risks and charges when:
- The Group incurs a statutory or implied obligation as a result of past events; - It is likely that resources will have to be expended to satisfy this obligation; - The amount of the obligation can be determined reliably.
Additions to these provisions are based on the present value of the best estimates made by the Company’s management of the costs that the Pininfarina Group will incur on the balance sheet date to satisfy the obligations. The provisions for risks and charges reflect primarily the best available estimates of the Group’s liability for future warranty costs on the pool of cars in circulation that the Group has manufactured. The warranty commitment stems from contractual obligations to customers. The provisions for risks and charges also include amounts set aside to cover the Group’s pro rata share in losses of associated companies and joint ventures, in those cases where Pininfarina is contractually obligated to cover those losses.
27

2.16 Revenue Recognition Revenues should reflect the fair value of the goods and services sold, net of VAT, returns, discounts and intra-Group transactions. Revenues are recognized as follows: (a) Sales of Goods Revenues are recognized when the Company has transferred all significant risks and benefits inherent in ownership, and the revenue amount can be estimated reliably. (b) Provision of Services Service revenues are recognized based on the progress made in delivering the services in question during the year in which they are being provided. (c) Interest Interest income is recognized on an accrual basis at amortized cost computed by the effective interest rate method. The effective interest rate is the rate used to accurately discount the cash flows that a financial instrument is expected to generate over its life. (d) Royalties Royalty income is recognized on an accrual basis, taking into account the terms of the underlying contracts. (e) Dividends Dividends are recognized in the year in which the shareholders acquire the right to receive payment. 2.17 Leases (a) When the Pininfarina Group Is the Lessee Leases covering property, plant and equipment are deemed to be finance leases when the Pininfarina Group assumes substantially all of the risks and rewards incidental to the ownership of an asset. An asset acquired under a finance lease is recognized as a component of Property, plant and equipment and depreciated over the life of the asset or the term of the lease, whichever is shorter. Leased assets are capitalized at the start of the lease at the fair value of the leased asset or at the present value of the lease payments, whichever is smaller. Lease payments are broken down into principal repayment and interest, which is determined by applying a constant interest rate to the outstanding balance. The current portion of the indebtedness to the lessor is recognized as a current liability and the portion due after one year is booked as a non-current liability. The interest paid is charged to income over the term of the lease. Leases in which the lessor (third party) retains substantially all of the risks and rewards incidental to ownership are recognized as operating leases. Payments, net of any incentives received from the lessor, are recognized in the income statement on an accrual basis over the term of the lease. (b) When the Pininfarina Group Is the Lessor The Pininfarina Group applies IFRIC 4 (Determining Whether an Arrangement Contains a Lease) to investments in plant and machinery acquired for special purposes under some contracts for the design, engineering and production of automobiles.
28
IFRIC 4 applies to those arrangements that, while not having the legal formalities of a lease, convey to one of the parties the right to use certain assets in exchange for a series of payments. According to IFRIC 4, an arrangement contains a lease if the following conditions are met: - Fulfillment of the arrangement is dependent on the use of a specific asset; - The arrangement conveys to the buyer the right to control the use of the asset subject of the
arrangement; - The determination that the arrangement contains a lease is made at the inception of the arrangement; - It is possible to separate lease-related payments from other payments required under the arrangement. In other words, IFRIC 4 can be used to identify a lease and separate it from an underlying arrangement between the parties and measure the lease in accordance with IAS 17 (Leases). When a finance lease exists, the Pininfarina Group recognizes a receivable of an amount equal to the present value of minimum lease payments. The difference between the gross amount of the receivable and its present value, which represents the interest income component, is reflected in the income statement over the term of the lease at a constant periodic interest rate. The Group does not own assets leased to third parties under operating leases. 2.18 Dividend distributions The Pininfarina Group recognizes a liability for dividends that become payable when a dividend distribution is approved by the Shareholders’ Meeting. 2.19 Financial Expense Consistent with Paragraph 7 of IAS 23, financial expense is charged to income in the year it is incurred. 2.20 Construction Contracts Costs incurred in connection with construction contracts are recognized when incurred. When the outcome of a construction contract cannot be estimated reliably, revenue is recognized only to the extent of contract costs incurred and presumed recoverable. When the outcome of a construction contract can be estimated reliably and it is likely that the contract will be profitable, revenues are recognized on an accrual basis over the life of the contract. Conversely, if it is likely that the contract will produce a loss (that is, total contract costs exceed contract revenues), the entire loss should be recognized in the year in which the Company’s management becomes aware of the loss. The Pininfarina Group allocates contract costs and revenues to each fiscal year by the percentage of completion method. The percentage of completion is the ratio of total costs incurred through the reporting date and the overall estimated costs needed to complete the contract. Costs incurred in a given fiscal year in connection with activities that have not yet been performed are excluded from the percentage of completion computation. Instead, they are recognized as inventory, advances or other assets, depending on their nature. Progress billings on account are included in Contract work in progress. 2.21 Government grants Government grants are recognized in the financial statements at fair value only when there is reasonable certainty that the Group has satisfied all of the requirements set forth in the terms of the grants.
29

Government grant revenues are reflected in the income statement in proportion to the costs incurred. Government grants toward the purchase of property, plant and equipment are recognized as deferred income and credited to the income statement in proportion to the depreciation of the assets for which they were awarded. 2.22 Valuations That Affect the Financial Statements (a) Seasonal Factors The operations of the Pininfarina Group are not affected by seasonal factors. On the other hand, the Pininfarina Group is affected by the cycles of orders placed with its manufacturing operations to design, engineer and, most importantly, produce automobiles. (b) Current and Deferred taxes The computation of current taxes made in the financial statements represents a best estimate of the weighted average of the tax liability that will be reflected in the annual financial statements. Estimates of deferred taxes are made based on the tax rates in force in the countries in which the Group operates at the time the estimates are made. As a result, these estimates are subject to change. (c) Estimate of Fair Value The fair value of financial instruments that are traded on an active market is based on their market value on the balance sheet date. The reference market price for financial assets held by the Pininfarina Group is their current sales price (purchase price for financial liabilities). The Group does not hold financial instruments that are not traded on an active market. Consequently, it does not use valuation techniques or make assumptions about the market conditions on the balance sheet date. The fair value of receivables is assumed to approximate their face value, net of valuation adjustments made to reflect collectibility.
The fair value of financial liabilities is determined for reporting purposes by discounting the contractual cash flows at an interest rate that approximates the market rate at which the Group borrows.
(d) Impairment of Goodwill
An estimate of the impairment of goodwill is made by discounting the cash flows anticipated in the business plan prepared by the Group’s management. Actual results can vary from the estimates in the business plan due to a variety of factors that are outside the control of the Group. (e) Financial Plans of Leases in Which the Group Is Either the Lessor or the Lessee Financial plans prepared to account for leases in which the Group is either the lessor or the lessee are by their very nature affected by the trend of future cash flows. In any event, leases in which the Group is either the lessor or the lessee are accounted for in compliance with the terms of the leases. Contracts covering design, engineering and production orders are subject to change while they are being performed (e.g., engineering change requests) and these changes are anticipated and provided for in the contracts. As a result, it is possible for the cash flows expected from these contracts to change.
30

(f) Accounting for the Provision for Termination Indemnities The provision for termination indemnities is akin to a defined-benefit plan (a defined-benefit plan is one in which the pension benefit payable to employees at the end of the employment relationship is predefined based on such factors as age, years of service and salary). Estimates of these factors, while made conservatively based on historical Company data, are subject to change. As of January 1, 2007, the Budget Law and related implementation decrees introduced significant changes to the regulations that govern the PTI, which include giving employees the right to decide how their vesting PTI should be invested. Specifically, employees will be allowed to decide whether new PTI contributions should be channeled to a pension investment of their choice or should be held by the Company (in which case, the Company will deposit the PTI contribution in a treasury account at the INPS). (g) Stock Option Plans The fair value of the benefits awarded to beneficiaries of stock option plans is incorporated in the value of the options the beneficiaries are entitled to receive. The value of options, estimated in accordance with the binomial lattice model, is affected by the following: - Expected volatility, which is based on the historical price volatility of Pininfarina S.p.A. shares; - The free risk rate, which is based on the gross yield on five-year Italian government bonds as
determined by the Bank of Italy; - An estimate of expected dividend distributions, based on dividend expectations for the years 2002 to
2005; - The possibility of early expiration, which, based on the actual results of previous plans, is deemed to be
nil. 3 Financial Risk Factors The financial instruments that the Group uses to finance its operations include bank borrowings, leases in which it is the lessee, leases in which it is the lessor and recognizes in accordance with IFRIC 4 and short-term bank deposits. The Group uses other financial instruments, such as trade payables and receivables, for operating purposes. The Group’s cash resources are managed centrally by Pininfarina S.p.A. The Group does not execute transactions involving derivatives such as interest rate swaps and forward currency contracts, either for speculative purposes or as cash flow hedges or to hedge changes in fair value. The financial risks that affect the Group are summarized below:
- The risk that the value of a financial instrument could fluctuate as a result of changes in foreign exchange rates (currency risk);
- The risk that the fair value of a financial instrument could change as a result of changes in market interest rates (interest rate risk on fair value);
- The risk that the value of a financial instrument could fluctuate due to changes in market prices (price risk);
- The risk that the counterpart could fail to perform its obligations (credit risk); - The risk of facing difficulties in securing the financial resources needed to meet commitments
arising from financial instruments (liquidity risk); - The risk that future financial flows of a financial instrument could fluctuate due to changes in
market interest rates (interest risk on financing instruments). Currency Risk: The Group borrows in euros. It operates in an international environment and is exposed to fluctuations in currency translation rates, particularly with regard to the value of the Swedish krona (SEK) and U.S. dollar (USD) versus the euro. The currency risk arises from the following commercial transactions:
- Sales of automobiles to Volvo through the Swedish joint venture Pininfarina Sverige AB. In this case, the currency risk is assumed by the counterpart pursuant to the terms of the underlying contracts.
31
- Purchases of automobile components in U.S. dollars. In this case, the currency risk is minimal
because the underlying contract sets maximum variability thresholds. Risk of Changes in Fair Value: The investment portfolio of Pininfarina S.p.A. consists of securities of top-rated companies. These assets are subject to significant changes in fair value caused by changes in stock market prices. Price Risk: The Group’s exposure to price risk is minimal because the price at which it sells cars is defined contractually. Credit Risk: The Group does business with a limited number of customers. In all cases, the Group’s customers are deemed to be reliable counterparts, and financial transactions are executed exclusively with financial institutions the reliability of which is beyond question. The high credit standing that the Group enjoys with financial institutions is demonstrated by the fact that none of its assets have been used to collateralize loans and these loans are not subject to restrictive covenants. Receivables recognized upon the accounting of leases in which the Group is the lessor identified in accordance with IFRIC 4 are booked under the assumption that the Group will continue to operate as a going concern and that such receivables will be collected upon the payment of the price of its cars and not based on a right held by the Group, even in the event of liquidation or other composition with creditors proceedings. Liquidity Risk: The Group has entered into finance leases as lessee to finance capital investments. All or part of these capital investments will be reimbursed by the Group’s customers when they pay for their cars. The Group also holds a very substantial amount of highly liquid, unrestricted assets. As a result, viewing the Group as a going concern, the liquidity risk is deemed to be low. Interest Risk on Fair Value and Financing Instruments: The Group receives financing from credit institutions at regular market rates. The Group is exposed to changes in interest rates, but its exposure in terms of interest payable is substantially offset by changes in interest receivable. 4 Accounting for Derivatives The Group has not executed transactions involving derivatives, either for hedging or speculative purposes. The paragraphs that follow are not applicable to the Group at this point. They are provided solely for information purposes. Derivatives are recognized in the financial statements at fair value when the contracts are signed. Valuations made subsequent to the purchase of the financial instruments are made at fair value, but the accounting treatment of gains and losses differs according to whether a financial instrument is classified as a hedge. There are three types of hedges:
- Fair value hedge; - Cash flow hedge; - Hedging of a net investment in foreign operations.
Before entering into a hedging contract, the Group documents the relationship between the hedge and the instrument that is being hedged and the Group’s risk management strategies and objectives. The Group also assesses whether the derivative possesses and will continue to possess over its life the effectiveness requirements needed to qualify it for recognition as a hedge. Changes in the fair value of hedging instruments are recorded in the fair value reserve listed in the statement of changes in shareholders’ equity. (a) Fair Value Hedge Changes in the fair values of fair value hedges are reflected in the income statement together with the changes in fair value of the hedged assets or liabilities.
32

(b) Cash Flow Hedge The portion of the gain or loss on a hedging instrument that can be classified as effective is recognized directly in equity. The non-effective portion is reflected in earnings when incurred. The amounts accumulated in a shareholders’ equity account are transferred to the income statement in the year or years in which the planned transaction covered by the hedge has an impact on the income statement (for example when a planned sale is executed). When a financial instrument matures and/or is sold, or when it no longer meets the requirements for classification as a hedge, the gains and/or losses accumulated in a shareholders’ equity account are held in that account until the planned transaction covered by the hedge has an impact on the income statement. If, instead, the Group no longer believes that the planned transactions will be executed, the gains and/or losses accumulated in a shareholders’ equity account are transferred to the income statement. (c) Hedging of a Net Investment in Foreign Operations Instruments that hedge a net investment in foreign operations are accounted for in the same manner as cash flow hedges. (d) Financial Instruments That Do Not Meet the Requirements to Be Classified as Hedges Financial instruments that do not meet the requirements to be classified as hedges are classified among financial assets or liabilities carried at fair value, with changes of value recognized in earnings.
5. Segment Information
a) Primary Segment
Business Segment
Segment information at March 31, 2007 shows that the Group is organized on a global scale and operates in two main business segments: vehicle production and styling/engineering.
The results for the first quarter of 2007 are as follows:
€/000
Production Styling &
Engineering Total for the
Group Value of production 168,762 36,856 203,618 Intra-segment value of production (9,654) (2,159) (11,813) Value of production 159,108 32,697 191,805 EBIT (12,507) 1,078 (11,429) Financial income (expense) (1,467) Interest in results of associates 1,121 - 1,121 Profit (Loss) before taxes (11,775) Income taxes 1,872 Profit (Loss) for the period (9,903)
33

The results for the first quarter of 2006 were as follows: €/000
Production Styling &
Engineering Total for the
Group Value of production 107,257 36,495 143,752 Intra-segment value of production (9,831) 495 (9,336) Value of production 97,426 36,990 134,416 EBIT (12,053) 622 (11,431) Financial income (expense) 1,067 Interest in results of associates (188) 0 (188) Profit (Loss) before taxes (10,552) Income taxes 2,458 Profit (Loss) for the period (8,094)
A breakdown of assets and liabilities at March 31, 2007 by business segment is as follows: €/000 Production
Styling &
Engineering Not allocated Total for the
Group
Assets 769,642 105,385 130,115 1,005,142 Liabilities 589,046 145,095 126,064 860,205
A breakdown of assets and liabilities at March 31, 2006 by business segment is as follows: €/000 Production
Styling &
Engineering Not
allocated Total for the
Group Assets 742,381 104,268 118,390 965,039 Liabilities 563,570 137,051 109,340 809,961
The assets of the segments consist mainly of property, plant and equipment, intangible assets, inventory and receivables. The above figures do not include deferred-tax assets, equity investments and financial assets.
The liabilities of the segments consist of operating liabilities. The above figures do not include such items as income tax liabilities and borrowings.
b) Secondary segment
Geographic Destination of Sales
A breakdown of sales by geographic destination is as follows (in millions of euros):
3/31/07 3/31/06 ITALY 82,1 73,9 EU 94,0 28,1 COUNTRIES OUTSIDE THE EU 2,3 1,0 Total 178,4 103,0
34

6. List of Companies Included in the Scope of Consolidation
Name Registered office Country Share capital Currency
%interest held directly or indirectly Consolidated companies
% capital share
Parent Company
Parent Company
Pininfarina S.p.A. Turin Via Bruno Buozzi 6 IT 9,317,000 EUR - - -
List of companies consolidated line by line
Italian subsidiaries
Pininfarina Extra S.r.l. Turin Via Bruno Buozzi 6 IT 388,000 EUR 100 Pininfarina S.p.A. 100
Foreign subsidiaries
Pininfarina Extra USA Corp. New York 1, Penn Plaza Suite 3515 USA 10,000 USD 100 Pininfarina Extra S.r.l. 100
Pininfarina Deutschland GmbH LeonbergRiedwiesenstr. 1 DE 3,100,000 EUR 100 Pininfarina S.p.A. 100
MPX Entwicklung GmbH Munich Bavarian 29 DE 25,000 EUR 100 Pininfarina Deutschland GmbH 100
Matra Automobile Engineering SASTrappes - cedex8, avenue J. D'Alembert FR 971,200 EUR 100 Pininfarina S.p.A. 100
CERAM SAS Mortefontaine FR 1,000,000 EUR 100 Matra Automobile Engineering SAS 100
D3 SASCourbevoie 11, rue Paul Bert FR 306,000 EUR 100 Matra Automobile Engineering SAS 100
Plazolles Modelage S.a.r.l.Garges Les GonessesZac de l'Argentine - 9, rue J. Anquetil FR 8,000 EUR 100 D3 SAS 70
Matra Automobile Engineering SAS 30
Matra Automobile EngineeringMaroc SAS
Zenata Casablanca - Sidi Bernoussi Km 12, Autoroute de Rabat MA 8,000,000 MAD 100 Matra Automobile Engineering SAS 99,9
CERAM SAS 0,1
Matra Developpement SASParc d'Activites Pissaloup - Trappes8, Avenue J. D'Alembert FR 37,000 EUR 100 Matra Automobile Engineering SAS 100
Numero Design S.a.r.l.Sceaux Sentier des Torque, 4 Chemin du rue d'Aulnay FR 8,000 EUR - D3 SAS 40
RHTU Sverige A.B.Uddevalla Varsvagen 1 SV 100,000 SEK 100 Pininfarina S.p.A. 100
List of companies consolidated by the equity method
Pininfarina Sverige A.B. Uddevalla Varvsvagen 1 SV 8,965,000 SEK 60 Pininfarina S.p.A. 60
Pasiphae S.a.r.l. Luxembourg4, Boulevard Royal LU 5,000,000 EUR 20 Pininfarina S.p.A. 20
There have been no changes in the scope of consolidation compared with December 31, 2006.
35

7. Property, plant and equipment
3/31/07 12/31/06 Change Land and buildings 96,501,904 97,262,193 (760,289) Plant and machinery 194,524,419 187,852,130 6,672,289 Furniture, fixtures and other prop., plant and equip. 5,540,665 6,046,720 (506,055) Assets under construction 1,251,926 1,556,093 (304,167) Total 297,818,914 292,717,136 5,101,778
As allowed by one of the options provided in Paragraphs 16 to 19 of IFRS 1, the Group’s land and buildings were revalued as of January 1, 2004 based on valuations provided by independent appraisers.
The entry offsetting the revaluation amount, net of deferred taxes, was posted to shareholders’ equity.
The increase in plant and machinery reflects primarily the recognition in accordance with IAS 17 of leased assets acquired for new manufacturing programs.
8. Intangible assets 3/31/07 12/31/06 Change Goodwill 2,301,012 2,301,012 0 Licenses and trademarks 4,967,525 5,327,799 (360,274) Other intangibles 492,378 524,971 (32,593) Total 7,760,915 8,153,782 (392,867)
9. Equity investments
Equity investments in associated companies 3/31/07 12/31/06 Change
Pasiphae S.a.r.l 744,800 744,800 - Total 744,800 744,800 -
The carrying value of the investment in Pasiphae Sarl did not change. Equity investments in joint ventures
3/31/07 12/31/06 Change Pininfarina Sverige AB 34,813,130 34,362,000 451,130 Total 34,813,130 34,362,000 451,130
The change reflects the adjustment made to the investment’s carrying amount to reflect the Group’s pro rata interest in the underlying shareholders’ equity and the net difference between the amount reflected in the income statement and the corresponding change in the reserve for currency translations.
36

Equity investments in other companies 3/31/07 12/31/06 Change Banca Passadore S.p.A. 257,196 257,196 0 Idroenergia Soc. cons. a r.l. 516 516 0 Unionfidi S.c.r.l.p.A. Turin 129 129 0 Midi Ltd 214,311 214,311 0 Other investments in managed portfolios 60,000 60,000 0 Total 532,152 532,152 0
10. Non-current financial assets
Loans and other receivables from outsiders 3/31/07 12/31/06 Change Non-current loans and other receivables 204,320,383 185,806,003 18,514,380 Current loans and other receivables 43,651,748 66,911,514 (23,259,766) Total 247,972,131 252,717,517 (4,745,386)
Loans and other receivables from outsiders, which decreased by a total of 4,745,386 euros, refer to loans receivable under leases in which the Group’s Parent Company is the lessor that were identified as such in accordance with IFRIC 4. Loans and other receivables from associated companies and joint ventures
3/31/07 12/31/06 Change
Pininfarina Sverige AB 99,710,977 98,472,980 1,237,997 Total 99,710,977 98,472,980 1,237,997
The increase in receivables owed by Pininfarina Sverige AB reflects services provided in connection with the development of the P15 project, the collection of which has been deferred to provide this company with the necessary financing. Even though Pininfarina S.p.A. owns 60% of Pininfarina Sverige AB, this company is valued by the equity method, as required by IAS 31, Paragraph 38 and IAS 27, Paragraph 14. Held-for-sale current assets
Equity
securities Fixed income
securities
Mutual funds
Total Value at December 31, 2006 6,076,382 42,625,109 13,162,397 61,863,888Fair value adjustments posted to the income statement (408,877) (29,871) 223,698 (215,050)Purchases 5,648,502 19,776,830 2,675,533 28,100,865Sales (7,508,958) (15,578,236) (3,841,769) (26,928,963)Impairment losses/Writedowns 0 0 0 0Value at March 31, 2007 3,807,049 46,793,832 12,219,859 62,820,740
11. Inventory and contract work in progress
3/31/07 12/31/06 Change
Raw materials 20,580,166 28,603,622 (8,023,456) Work in process 13,708,455 9,263,584 4,444,871 Finished goods 7,046,418 4,200,146 2,846,272 Total 41,335,039 42,067,352 (732,313)
3/31/07 31/03/06 Change Contract work in progress 1,229,114 403,014 826,100 Total 1,229,114 403,014 826,100
37
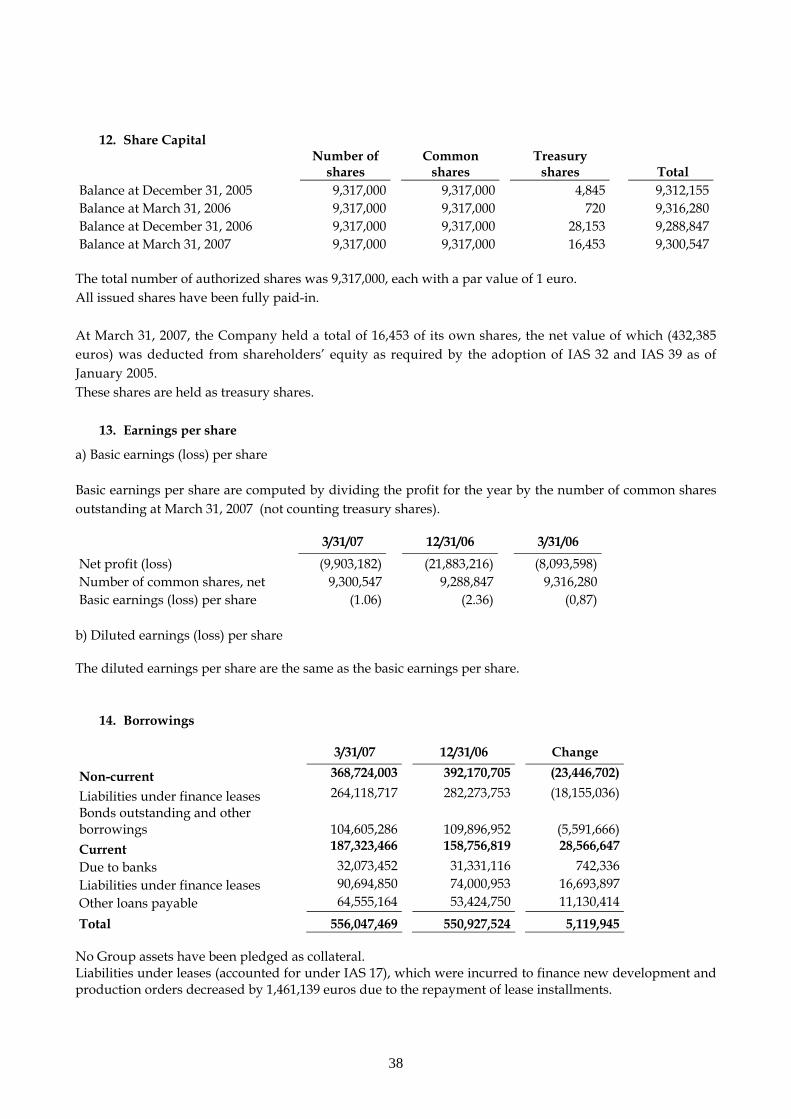
12. Share Capital
Number of
shares Common
shares Treasury
shares Total Balance at December 31, 2005 9,317,000 9,317,000 4,845 9,312,155 Balance at March 31, 2006 9,317,000 9,317,000 720 9,316,280 Balance at December 31, 2006 9,317,000 9,317,000 28,153 9,288,847 Balance at March 31, 2007 9,317,000 9,317,000 16,453 9,300,547
The total number of authorized shares was 9,317,000, each with a par value of 1 euro. All issued shares have been fully paid-in.
At March 31, 2007, the Company held a total of 16,453 of its own shares, the net value of which (432,385 euros) was deducted from shareholders’ equity as required by the adoption of IAS 32 and IAS 39 as of January 2005. These shares are held as treasury shares.
13. Earnings per share
a) Basic earnings (loss) per share Basic earnings per share are computed by dividing the profit for the year by the number of common shares outstanding at March 31, 2007 (not counting treasury shares). 3/31/07 12/31/06 3/31/06 Net profit (loss) (9,903,182) (21,883,216) (8,093,598) Number of common shares, net 9,300,547 9,288,847 9,316,280 Basic earnings (loss) per share (1.06) (2.36) (0,87)
b) Diluted earnings (loss) per share
The diluted earnings per share are the same as the basic earnings per share.
14. Borrowings 3/31/07 12/31/06 Change
Non-current 368,724,003 392,170,705 (23,446,702)
Liabilities under finance leases 264,118,717 282,273,753 (18,155,036) Bonds outstanding and other borrowings
104,605,286
109,896,952
(5,591,666)
Current 187,323,466 158,756,819 28,566,647 Due to banks 32,073,452 31,331,116 742,336 Liabilities under finance leases 90,694,850 74,000,953 16,693,897 Other loans payable 64,555,164 53,424,750 11,130,414 Total 556,047,469 550,927,524 5,119,945
No Group assets have been pledged as collateral. Liabilities under leases (accounted for under IAS 17), which were incurred to finance new development and production orders decreased by 1,461,139 euros due to the repayment of lease installments.
38

A breakdown of long-term borrowings by maturity is as follows:
3/31/07 due within 12 months 187,323,466 due between 1 and 5 years 367,599,003 due after 5 years 1,125,000 Total 556,047,469
15. Provisions for Other Liabilities and Charges
3/31/07 12/31/06 Change
Provision for warranties 1,057,585 1,021,850 35,735 Provision for restructuring programs 4,018,142 4,464,000 (445,858) Other provisions 2,453,847 2,725,191 (271,344) Total 7,529,574 8,211,041 (681,467)
16. Other income and revenues
3/31/07 3/31/06 Change Rebilling of lease payments 6,622 39,337 (32,715) Out-of-period income 86,008 63,260 22,748 Insurance settlements 3,800 0 3,800 Royalties 125,000 125,000 0 Amounts rebilled 76,268 76,325 (57) Operating grants 60,634 65,935 (5,301) Sundry items 306,737 352,467 (45,730) Total 665,069 722,324 (57,255)
17. Gain on the sale of non-current assets
3/31/07 3/31/06 Change Gain on the sale of equity investments 0 0 0 Gain on the sale of other assets 336,848 65,006 271,842 Total 336,848 65,006 271,842
18. Depreciation of property, plant and equipment
3/31/07 3/31/06 Change Land and buildings 764,090 837,477 (73,387) Plant and machinery 8,071,767 2,391,727 5,680,040 Furniture, fixtures and other property, plant and equip.
220,652 254,579 (33,927)
Total 9,056,509 3,483,783 5,572,726
19. Amortization of intangibles
3/31/07 3/31/06 Change Licenses and trademarks 447,691 486,364 (38,673) Other intangibles 36,952 21,739 15,213 Total 484,643 508,103 (23,460)
39
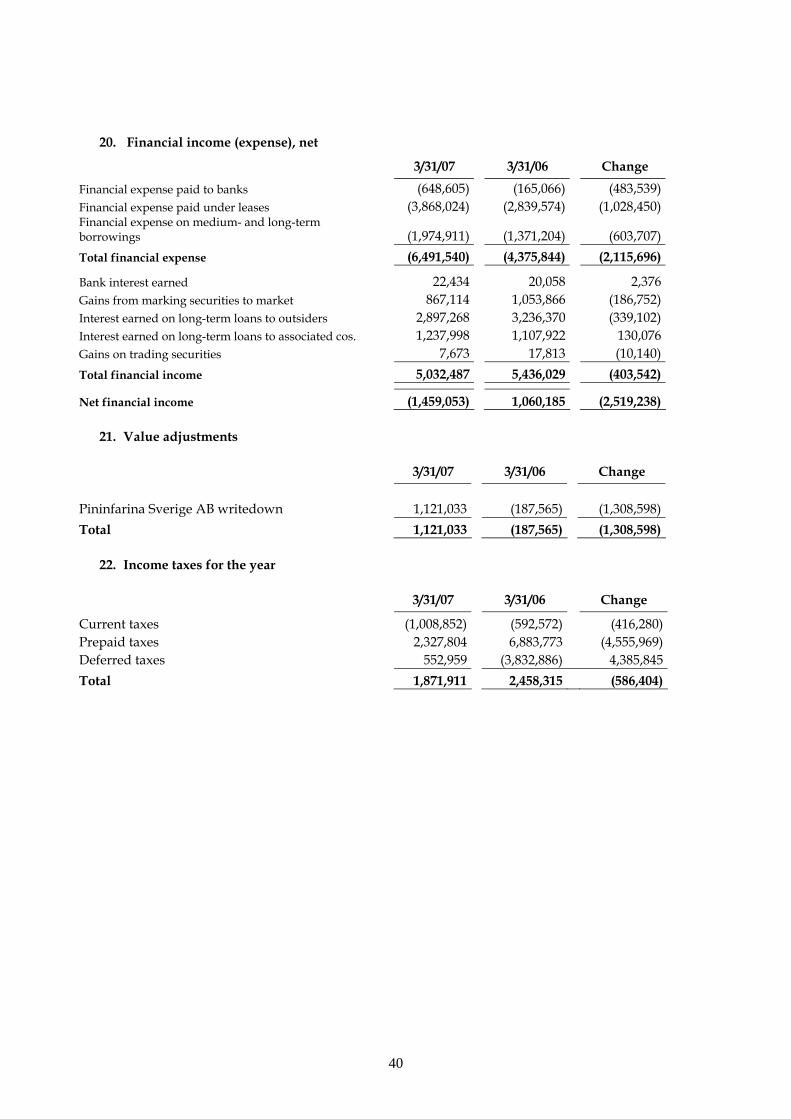
20. Financial income (expense), net
3/31/07 3/31/06 Change
Financial expense paid to banks (648,605) (165,066) (483,539) Financial expense paid under leases (3,868,024) (2,839,574) (1,028,450) Financial expense on medium- and long-term borrowings (1,974,911) (1,371,204) (603,707) Total financial expense (6,491,540) (4,375,844) (2,115,696) Bank interest earned 22,434 20,058 2,376 Gains from marking securities to market 867,114 1,053,866 (186,752) Interest earned on long-term loans to outsiders 2,897,268 3,236,370 (339,102) Interest earned on long-term loans to associated cos. 1,237,998 1,107,922 130,076 Gains on trading securities 7,673 17,813 (10,140) Total financial income 5,032,487 5,436,029 (403,542) Net financial income (1,459,053) 1,060,185 (2,519,238)
21. Value adjustments
3/31/07 3/31/06 Change
Pininfarina Sverige AB writedown
1,121,033 (187,565) (1,308,598) Total 1,121,033 (187,565) (1,308,598)
22. Income taxes for the year
3/31/07 3/31/06 Change
Current taxes (1,008,852) (592,572) (416,280) Prepaid taxes 2,327,804 6,883,773 (4,555,969) Deferred taxes 552,959 (3,832,886) 4,385,845 Total 1,871,911 2,458,315 (586,404)
40
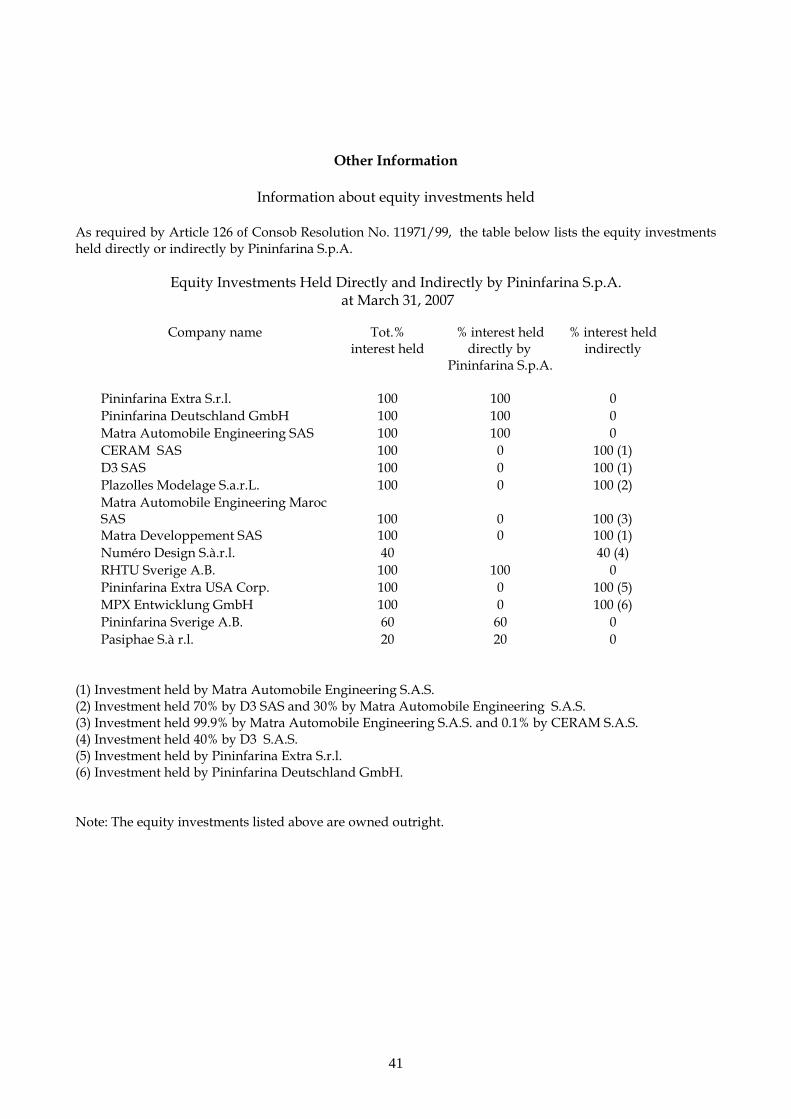
Other Information
Information about equity investments held
As required by Article 126 of Consob Resolution No. 11971/99, the table below lists the equity investments held directly or indirectly by Pininfarina S.p.A.
Equity Investments Held Directly and Indirectly by Pininfarina S.p.A. at March 31, 2007
Company name Tot.%
interest held % interest held
directly by Pininfarina S.p.A.
% interest held indirectly
Pininfarina Extra S.r.l. 100 100 0 Pininfarina Deutschland GmbH 100 100 0 Matra Automobile Engineering SAS 100 100 0 CERAM SAS 100 0 100 (1) D3 SAS 100 0 100 (1) Plazolles Modelage S.a.r.L. 100 0 100 (2) Matra Automobile Engineering Maroc
SAS
100
0
100 (3) Matra Developpement SAS 100 0 100 (1) Numéro Design S.à.r.l. 40 40 (4) RHTU Sverige A.B. 100 100 0 Pininfarina Extra USA Corp. 100 0 100 (5) MPX Entwicklung GmbH 100 0 100 (6) Pininfarina Sverige A.B. 60 60 0 Pasiphae S.à r.l. 20 20 0 (1) Investment held by Matra Automobile Engineering S.A.S. (2) Investment held 70% by D3 SAS and 30% by Matra Automobile Engineering S.A.S. (3) Investment held 99.9% by Matra Automobile Engineering S.A.S. and 0.1% by CERAM S.A.S. (4) Investment held 40% by D3 S.A.S. (5) Investment held by Pininfarina Extra S.r.l. (6) Investment held by Pininfarina Deutschland GmbH. Note: The equity investments listed above are owned outright.
41

Printed internally by Pininfarina S.p.A.
42