pilot project to research the need to update hse on … · wood dust in the construction industry...
TRANSCRIPT

Prepared by the Health and Safety Laboratory for the Health and Safety Executive 2014
Health and Safety Executive
Pilot project to research the need to update HSE on the occupational health risks in the woodworking industry
RR1011Research Report

Andrew Simpson, Susan Hambling, Andrew Easterbrook andJames WheelerHealth and Safety LaboratoryHarpur HillBuxtonDerbyshire SK17 9JN
This report presents the findings of a pilot project to research the need to update HSE’s evidence base for wood dust exposure risks in GB manufacturing and construction industries.
Information was sourced from businesses which had participated in previous exposure surveys, contact with manufacturing (woodworking) businesses and trade associations, a literature review of papers reporting wood dust exposure data, and occupational hygiene surveys for wood dust exposure at three construction sites. The report finds there to be:
n uncertainty whether the control of occupational exposure to wood dust has improved since 2000; n limited understanding of exposure risk to wood dust in construction; n a lack of reliable, current intelligence on exposure risk to wood dust; n limited understanding of the changing patterns of wood usage; n lack of clarity on the changing profile of the woodworking industry
Further research is now planned by HSE to work in partnership with industry to establish a baseline occupational exposure dataset characterising good controls practice
This report and the work it describes were funded by the Health and Safety Executive (HSE). Its contents, including any opinions and/or conclusions expressed, are those of the authors alone and do not necessarily reflect HSE policy.
Pilot project to research the need to update HSE on the occupational health risks in the woodworking industry
HSE Books
Health and Safety Executive

© Crown copyright 2014
First published 2014
You may reuse this information (not including logos) free of charge in any format or medium, under the terms of the Open Government Licence. To view the licence visit www.nationalarchives.gov.uk/doc/open-government-licence/, write to the Information Policy Team, The National Archives, Kew, London TW9 4DU, or email [email protected].
Some images and illustrations may not be owned by the Crown so cannot be reproduced without permission of the copyright owner. Enquiries should be sent to [email protected].
Acknowledgements
HSE would like to thank the three construction companies for their assistance during the collection of exposure data, those companies that participated in the telephone survey and other enquiries, and the Trade Associations and other experts who responded to the questionnaire on the conclusions from the telephone survey.
ii

KEY MESSAGES The key messages arising from this project are:
There is uncertainty whether the control of occupational exposure to wood dust has improved since 2000. The telephone survey conducted as part of this project suggested modest improvements in some aspects of control have been achieved.
There is a lack of knowledge amongst those questioned about how to control wood dust, in particular: • There is a limited understanding of exposure to wood dust in construction. Three visits
carried out as part of this project, and Olympic Park data, suggested that many exposures would exceed the workplace exposure limit (WEL) but data are very limited. The management of wood dust exposure in the construction industry can be complicated by the widespread use of (sub) contractors and self-employed workers.
• There is a general lack of reliable, current intelligence on exposure to wood dust. There has been no evaluation of the magnitude and extent of wood dust exposure data in HSE’s National Exposure Database (NEDB) data since 2003 and no significant efforts to increase the stock of current wood dust exposure data since 1999/2000.
• There is a limited understanding of wood dust exposures in wooden boat-building. A single wood dust exposure, recorded in the woodworking shop of a fibre-glass boat builder, significantly exceeded the WEL.
• There is a limited understanding of the changing pattern of wood usage within Great Britain. e.g. developments such as flat-pack assembly, manufacture of veneer, plywood and board, use of isocyanate lacquers and production of wood biofuels. Anecdotal evidence suggests a change in the use of flat-packs for furniture, and the use of pre-formed components in construction has significantly increased.
• The changing profile of the woodworking industry is unclear. Consultation with woodworking industry stakeholders indicated a possible decline in overall numbers exposed to wood dust in Great Britain. The number of large woodworking companies is believed to be declining, but the number of new small companies within the industry may be being underestimated. There is no information on the adherence of new small and medium sized enterprises (SMEs) to good control practice in managing exposure, nor on employment patterns in the larger areas of the woodworking industry.

EXECUTIVE SUMMARY
RESEARCH AIM AND OBJECTIVES The aim of this research was to: • carry out pilot survey visits during 2011/12 to research the need for undertaking further
occupational hygiene survey visits, • compare results with those from the two surveys undertaken in 1989/90 and 1999/2000 to inform
HSE of any trend in exposures and their relation to current WELs, and • draft an overview report, presenting information gathered from a variety of specified sources, to
identify the current state of knowledge within HSE on occupational exposures to wood dust and to inform the need for any further surveys of workers exposed to wood dust and isocyanates in woodworking industries.
METHODOLOGY The following sources of information were used to update the profile of health risks in the woodworking industries and to make recommendations as to any further knowledge gathering required in this area: • a telephone survey of previous exposure survey participants, looking at current work activity and
control issues, • contact with specific wood industry companies and trade associations to identify any knowledge
gaps, • consultation with industry on findings from the telephone survey and information from the
additional contacts, • a literature review of papers reporting wood dust exposure data, and • three visits to construction sites to assess wood dust exposure levels. MAIN FINDINGS Comparison of HSE exposure surveys, carried out at different companies, in 1989/1990 and 1999/2000 showed a reduction in the proportion of exposures exceeding 5 mg/m³ from 40% to 27%. Analysis of NEDB data, by the Institute of Occupational Medicine (IOM) [6], showed a decline in wood dust exposures of 8.1% per year between 1985 and 2003. This is based on data from both survey and reactive work. Exposure data from NEDB are similar for both hardwood and softwood dust, but the exposures cannot be differentiated when both are present, and there is often exposure to mixed wood dust. A telephone survey of participants who took part in the 1999/2000 survey revealed that there is uncertainty in industry over whether wood dust exposure control has improved since 2000. There are significant gaps in HSE’s evidence base for data on exposures to: • wood dust in a wide range of activities, including board and veneer manufacture, assembly of flat-
pack furniture and boat building, • the spraying of isocyanate lacquers and varnishes, and • wood dust in the construction sector. Visits to three sites for this project found exposures to wood dust above the WEL, even on sites judged to be well-managed. Information from the Olympic Park appeared to confirm that exposures above the WEL are not uncommon in construction [17]. The management of occupational exposure to

wood dust in the construction industry can be complicated by the widespread use of (sub) contractors and self-employed workers.
The changing pattern of wood usage in the GB woodworking industry is unclear. Whilst there is only anecdotal evidence of a change in the use of flat-packs for furniture manufacture/assembly, the use of pre-formed components in construction has significantly increased. The extent of manufacture of veneer, plywood and board, the use of isocyanate lacquers, and the amount of medium-density fibreboard (MDF) used are not well-defined. Other sections of the industry are unmapped. The woodworking industry tends to be made up of small companies. The number of large woodworking companies is believed to be declining, but anecdotal evidence suggest that they are being replaced by new smaller companies. RECOMMENDATIONS The findings of this work suggest that HSE could consider: • Examining exposure data for wood dust on the NEDB to establish the trend from 2003 to the
present and to compare with the trend from 1985 – 2003 as reported by IOM [5,6]. This would enable us to illustrate whether more recent technological developments, and the explicit inclusion of good control practices introduced into the Control of Substances Hazardous to Health (COSHH) Regulations, when amended in 2005, are having a greater impact on reducing exposure to wood dust.
• Undertaking a monitoring survey, to measure exposures and identify appropriate controls, to
establish a baseline occupational exposure dataset characterising good control practice. This should include:
o some manufacturing (woodwork) sites that were visited in 1999/2000 to assess whether
control of wood dust exposure has improved since the 1999/2000 survey,
o some boat-building sites where wood use is significant to improve the currency of our expertise in this area and compare and contrast our findings with predicted/modelled data as published in the scientific literature,
o some construction sites which include woodworking activities, (to cover new build housing, refurbishment of both commercial and domestic premises, and large scale wood construction projects). This should include a review of the processes employed to manage control of occupational exposure to wood dust for sub-contractors,
o some manufacturing (woodwork) sites engaged in the assembly of flat-pack imported products; the manufacture of veneer sheets, plywood panels and board; the application of isocyanate-containing lacquers to enhance wood product finishes; and wood biofuel production, to build expertise in these newly developed areas, and
o some new SME woodworking businesses, and assess to what degree of adherence to the
principles of good control practices in managing exposures to wood dust is built into their business plan.


CONTENTS PAGE
ACKNOWLEDGEMENTS ................................................................. 1
KEY MESSAGES .............................................................................. 2
EXECUTIVE SUMMARY ................................................................... 3
CONTENTS PAGE ............................................................................ 5
1. INTRODUCTION ...................................................................... 1 1.1 Background 1 1.2 General Overview 1 1.3 Current Work 2
2. METHODOLOGY ..................................................................... 3 2.1 Telephone Survey of 1999/2000 Survey Participants 3 2.2 Trends in the WoodWorking Industry 3 2.3 Additional Data 3
3. RESULTS ................................................................................. 5 3.1 Telephone Survey of 1999/2000 Survey Participants 5
3.1.1 LEV .......................................................................................................................... 5 3.1.2 RPE .......................................................................................................................... 5 3.1.3 Cleaning ................................................................................................................... 5 3.1.4 Health Surveillance .................................................................................................. 6 3.1.5 HSE Woodworking Consultation ............................................................................ 6
3.2 Trends in the WoodWorking Industry 7 3.2.1 Timber Usage ........................................................................................................... 7 3.2.2 Industry Profile ........................................................................................................ 7 3.2.3 Exposure Data Trends .............................................................................................. 8 3.2.4 Trends in Control Measures and Other Indicators of Good Management ............. 13
3.3 Additional Data 13 3.3.1 Boat Building ......................................................................................................... 13 3.3.2 Use of MDF ........................................................................................................... 14 3.3.3 Film Set Construction ............................................................................................ 14 3.3.4 Wood Recycling .................................................................................................... 14 3.3.5 Wood Biofuel ......................................................................................................... 14 3.3.6 Building Construction ............................................................................................ 14 3.3.7 Flat-Packs ............................................................................................................... 16 3.3.8 Laminates / Veneers ............................................................................................... 17 3.3.9 Spray Lacquers / Varnishes / Paints ...................................................................... 17
4. DISCUSSION ......................................................................... 18 4.1 Telephone Survey of 1999/2000 Survey Participants 18 4.2 Trends in the WoodWorking Industry 18
4.2.1 Exposure Data Trends ............................................................................................ 18 4.2.2 Trends in Control Measures and Other Indicators of Good Management ............. 19
4.3 Additional Data 19
5. CONCLUSIONS ..................................................................... 21

6. REFERENCES ....................................................................... 22
APPENDIX A. WOODWORKING INDUSTRY CONSULTATION QUESTIONNAIRE ........................................................................... 24

1
1. INTRODUCTION
1.1 BACKGROUND
HSE last examined occupational exposure to wood dust over ten years ago during a survey conducted in 1999/2000 [1]. Since that time there have inevitably been changes to the industry, and it is recognised that there are knowledge gaps, e.g. developments in areas such as the production of flat-pack furniture and the use of isocyanate lacquers. It is believed, by HSE, that there may be an increasing use of cheaper woods with paints/lacquers being used to provide the required high quality finishes. Spraying isocyanates can lead to workers developing occupational asthma and may contribute to respiratory ill-health in wood workers. It is also recognised that HSE does not have any occupational exposure data for wood dust exposure for large sectors of industry e.g. woodworking in the construction industry.
A benchmarking exercise was commissioned to gather current intelligence on the present state of the woodworking industry. The exercise was also intended to identify gaps in HSE’s knowledge on exposure to wood dust, and propose recommendations for future work. This is especially pertinent in view of the fact that the EU is currently discussing a possible reduction in the occupational exposure limit for hardwood dust to an 8 h time weighted average of either 3 mg/m3 or 1 mg/m3 (the current GB Workplace Exposure Limit, WEL, is 5 mg/m3). Most companies work with both types of wood, and so would have to comply with the new lower value.
This document reviews the information, both qualitative and quantitative, that has been gathered by HSE recently on exposure to, and control of, wood dust in Great Britain. The sources of information include a telephone survey of participants of the last wood dust exposure survey, consultation with wood suppliers and Trade Associations, very limited site monitoring at construction sites and reported exposures in peer reviewed and grey literature.
1.2 GENERAL OVERVIEW
Wood dust is a general term covering a wide variety of dusts generated by the machining and working of wood and wood-containing materials such as chipboard and fibreboard. Operations such as sawing, turning and routing produce relatively coarse dust, while sanding and assembly operations generate fine dust. Wood is divided into two different groups:
• hardwoods are timbers from deciduous trees such as beech, ash, oak, mahogany and teak, and
• softwoods are mainly from coniferous trees such as Scots pine, yew and cedar.
Both types of wood dust can cause respiratory sensitisation, whilst hardwood dust can cause sino-nasal cancer. In 2005, it was estimated that there were 19 cancer deaths and 53 registrations attributable to wood dust [2]. Over ten years the SWORD scheme (Surveillance of Work-related and Occupational Respiratory Disease) has consistently identified wood dust as the sixth most common cause of occupational asthma. In GB both hardwood and softwood dust have a WEL of 5 mg/m³ for inhalable dust [3].
The wood manufacturing industry involves a number of different operations:
• Primary production (logging) involving the initial felling of trees generally involves coarse cutting of the wood creating large chips, and the wood is wet wood i.e. not seasoned which would suggest airborne dust exposure may be partially limited.
• Further processing of wood (in sawmilling), including log debarking and preliminary sawing of timber, is also from unseasoned (damp) wood. The subsequent manufacture of boards

2
(either rough sawn or smooth-surfaced) or mouldings from seasoned wood (i.e. dried) with a fine surface finish would be expected to produce finer dust.
• The production of plywood, particle-board (the generic name for chipboard, hardboard and medium-density fibreboard or MDF), Oriented Strand Board etc. is a separate sector within manufacturing of wood products. These boards will usually be manufactured on specialised process machinery so should be subject to engineered exposure controls. Dust exposure may occur during the initial handling or preparation of the wood particle feedstock and then if the product is cut to size for distribution.
• The manufacture of numerous components from wood and wood products (e.g. MDF) including roof trusses, studding walls, floors, doors, and door and window frames for construction; wood containers (e.g. pallets, barrels and boxes); and furniture for commercial or domestic use (e.g. office, bedroom, bathroom, kitchen and shop fitting).
Wood is also widely recycled. Whilst some second-hand timber is reused, most is processed for other uses e.g. unused clean softwood can be shredded to make clean animal bedding, whilst coarser end-of-life wooden items can be used to produce particle boards or for landscaping.
1.3 CURRENT WORK
This project did not consider forestry and only considered sawmills in limited detail. There is conflicting evidence on the changing number of sawmills. The following sources of information were used to update the profile of health risks in the woodworking industries and to make recommendations as to further knowledge gathering required in this area: • a telephone survey of previous exposure survey participants, looking at current work activity and
control issues,
• additional contacts with specific wood industry companies and trade associations identifying any further knowledge gaps,
• a consultation with industry on findings from the telephone survey and information from the
additional contacts,
• a literature review of papers reporting wood dust exposure data, and
• Three visits to construction sites to assess wood dust exposure levels.
The report presents the information gathered from these various sources, in order to update the HSE evidence base for wood dust exposure and to make recommendations as to further knowledge gathering required on workers exposed to wood dust and isocyanates in woodworking industries. This report also compares any results obtained with those from the two surveys undertaken in 1989/90 and 1999/2000 to inform HSE of any discernible trend in exposures and their relation to current WELs.

3
2. METHODOLOGY
2.1 TELEPHONE SURVEY OF 1999/2000 SURVEY PARTICIPANTS
HSE undertook a telephone survey of the businesses included in the 1999/2000 wood dust survey. No site visits were made to verify these comments. The principal data were gathered and initial analysis was performed in December 2011. A standard approach was used to explore the current level of activity, the types of exposure controls in use and some control issues such as Thorough Examination and Test (TExT) of Local Exhaust Ventilation (LEV), Respiratory Protective Equipment (RPE) and the use of health surveillance.
The degree to which the responses represented the industry as a whole was tested by consultation with industry via contacts in HSE’s Wood Consultancy Group. This is a group primarily composed of the Wood Safety Group (an industry run/chaired body that HSE sits on) with additional industry experts (e.g. LEV). The questionnaire used is reproduced in Appendix A.
2.2 TRENDS IN THE WOODWORKING INDUSTRY
Information on trends in the woodworking industry was obtained by several methods:
• Trends in wood usage, including production and import, were sought from the Timber Trade Federation.
• Trends in industry profile were estimated by identifying the surviving companies from the representative sample taken in 1999/2000 and assessing how their sizes have altered using information obtained from the original survey and telephone follow-up survey (above).
• Trends in exposure to wood dust were identified from HSE and IOM reports. The data collected in two HSE wood dust exposure survey reports (1989/90 [4] and 1999/2000 [1]) and two IOM reports, one looking at the impact of changing EU regulation on hardwood dust (using exposure data 1999-2003 [5]), and the other reviewing wood dust exposure data in the National Exposure Database (NEDB, data 1985-2003 [6]) were evaluated. No data more recent than 2003 has been considered.
• Trends in use of controls e.g. LEV, RPE, cleaning practices and health surveillance were sought via the telephone survey (above).
2.3 ADDITIONAL DATA
The IOM impact assessment [5] estimated exposures across a wide range of activities in countries throughout the EU, using databases and mathematical modelling. There are very limited data available to confirm the exposures estimated. Note that occupational exposure to wood dust in the wood recycling industry was not considered in the report.
Enquiries, mainly by telephone, were made to Trade Associations and/or relevant Companies to try to find out more about the level of activity and wood dust exposure in some areas of woodworking that were of potential concern to HSE, such as boat building, use of MDF and film set construction. For wood recycling a recent HSE project was carried out to determine exposure to wood dust [7].
Three site visits to construction companies were made to measure exposure and assess controls. These were reported as individual HSE/L site visit reports. The exposure data were collated and examined within this project. In addition, information was sought from these companies on the extent to which pre-formed components e.g. roof trusses, door frames etc. were used in construction.

4
From anecdotal evidence, there was a suggestion that some processes e.g. flat-pack assembly, production of laminates and veneers, and use of spray coatings (e.g. lacquers, varnishes, and paints) may have changed since the original 1999/2000 survey although no baseline evidence had been acquired in 1999/2000. Current practices in these areas were sought, from the companies involved in the 1999/2000 survey via the 2011 telephone survey.

5
3. RESULTS
3.1 TELEPHONE SURVEY OF 1999/2000 SURVEY PARTICIPANTS
Out of the 47 companies originally involved in the last survey [1], 15 are out of business or in liquidation and two could not be contacted. Of the 30 still in business and contactable, three are known to have moved site, five have transferred ownership and two are changing business direction.
Analysis of HSE’s Corporate Operational Information System (COIN) revealed that twenty-three of the thirty companies still in business and contactable received some form of HSE intervention activity between 2000 and 2011. The records indicate that nine companies failed to maintain/test LEV, three had a lack of COSHH risk assessment and controls for wood dust and three indicated a lack of, or inadequate, health surveillance. For the other companies, records related to non-COSHH matters such as guarding of woodworking machinery, use of fork-lift trucks, pedestrian-vehicle segregation etc.
3.1.1 LEV
In the 1999/2000 wood survey 59% of companies carried out either a 14-month thorough examination and test (TExT) or weekly checks or both [1]. Where both were carried out wood dust exposure was better controlled, although a significant proportion of exposures did not comply with the WEL of 5 mg/m³. This may be because the LEV system was inappropriately designed, incorrectly used, badly maintained between the thorough examinations or due to other factors.
The follow-up telephone survey in 2011 showed that 22 of the 30 companies spoken to (73%) had the 14-month TExT done. Six companies were still not aware of the legal requirement for them to do this. Two companies had changed business to doing lamination or refurbishments and said they had no LEV.
Only five companies reported having any air flow gauge on the LEV, although two others were looking into getting gauges as a result of either HSE advice during an inspection or a recommendation from a LEV supplier.
3.1.2 RPE
In the 1999/2000 survey all companies except one sawmill provided RPE. RPE tended to be used for dusty tasks, but information and training on its correct use was rarely provided.
Half (15) of the companies contacted in the 2011 telephone survey reported that they were using FFP2 or FFP3 masks, however two companies were still using FFP1 masks and one company was using nuisance dust masks. Twelve companies could not say what type of masks they were using. Only five companies had heard of face fit testing and only one had had this done (in 2005). Only seven companies indicated that training in the use of RPE had been provided, and three still said it was up to the worker to decide whether to wear the mask provided.
3.1.3 Cleaning
In the 1999/2000 wood survey it was noted that 79% of sites had a vacuum cleaner, but brushing was observed at 96% of them, and a compressed air-line was used to clean machinery and clothing at 64% of sites [1].
During the telephone survey most companies indicated that they generally cleaned up dust from the floor by either brushing together the dust and then using the extraction power from the LEV, or using a vacuum. One company said they damped down dust before brushing it up, and two companies mentioned that they would use an air-line to clean down equipment.

6
3.1.4 Health Surveillance
In the 1999/2000 survey only five companies (11%) - generally the larger ones - carried out health surveillance. This included a combination of nasal cancer screening, lung function tests and skin inspection and questionnaires.
Information on health surveillance was sought from 21 companies during the telephone survey, and only five had not heard of it. Of the 76% who were aware of health surveillance, eight were undertaking health questionnaires, and five were undertaking other forms of health surveillance - some including lung function and /or sino-nasal checks. One company had stopped doing health surveillance two years ago as they deemed it too expensive to do for about 50 workers exposed to wood dust, whilst two others indicated that they now did lung function tests less frequently than previously or only irregularly.
3.1.5 HSE Woodworking Consultation
The results from the telephone survey were collated and sent out to the Wood Consultancy Group to seek their views on whether the results were realistic and representative. Replies from the 16 responding members of the Group (out of 23 members) were analysed and a summary of the responses has been provided with the questionnaire in Appendix A. Responses to many of the questions were variable, possibly due to the varying roles of members of the Wood Consultancy Group within the woodworking industry.
Almost half (40%) agreed with the statement that ‘about a quarter of woodworking companies still do not have a 14 month thorough examination and test carried out’, 40% indicated that the proportion of companies not having a TExT was likely to be higher and the remainder offered no opinion. The lack of airflow indicators was put down to poor awareness and concern over cost.
Almost half (45%) agreed with the statement that ‘about 50% of the woodworking companies provide workers with inappropriate or unidentified RPE’ and 25% expected there to be higher levels of inappropriate or unidentified RPE in use. The remainder did not comment. There was thought to be a lack of awareness especially in small companies regarding RPE. RPE use was considered to be inconsistent, incorrectly managed and poorly understood.
The members of the consultancy group thought that there would be a higher level of industry unaware of health surveillance than the approximately 60% found in the telephone survey. Possible reasons for a reluctance to participate in health surveillance included a lack of knowledge on the subject, cost, and fear of outcome.
Responses over the methods for cleaning up dust were very varied. Four respondents believed that there were many companies using vacuum systems, eight that there were not. Others suggested that the situation was improving, with possibly up to 50% using vacuum systems but this could be dependent on the size of company. Three suggested that a combination of brush and vacuum was used and three companies still believed that air-line use was common.
Most respondents broadly agreed with the survey’s findings concerning data on flat-pack work, production of veneers and laminates, and use of spray products. Hence it appears that about 10% of companies do flat-pack work, 20-50% do lamination and about 40% use spray products. Most also agreed that MDF was widely used, with about 85% being used in office, bedroom, bathroom and kitchen furniture and shop fitting, and 15% for caravans, coffins and other uses. Some also indicated that MDF is used in virtually all woodworking shops and that the tonnage used in GB may be higher than the 1.5 million tonnes suggested.
Most respondents could not comment on exposure in construction. Of those that did (seven respondents) most (five respondents) agreed that wood dust exposures above 3 mg/m³ commonly occur. A similar number of responses were received on exposure to wood dust in construction of film

7
sets with views being that it was not appropriate to single out this industry. Wood cutting would be initially done in work shops, with the higher risk occurring if done on-site and in small areas with limited equipment. A drive towards waste reduction is meaning more parts can be disassembled and reused.
Most sectors involved in processing seasoned wood were cited as generating high occupational exposures to wood dust. Operations included sawmilling, wood-turning, sanding and high-speed routing. Small enterprises, colleges and jobbing workshops were mentioned as of some concern because controls may be inadequate. One organisation said that the process and type of equipment was more important for wood dust generation and exposure than the type of industry.
Information on the profile of the woodworking industry was also sought. About half of the respondents agreed with the statement that the number of woodworking companies was declining and that ‘about 20% companies had less than 10 employees, about 70% had less than 50 employees and 30% had greater than 50 employees’. However others thought that the number of companies with less than ten employees were not being accurately picked up and could be as high as 75-90%.
Overall there was a lack of consensus on many issues from this group.
3.2 TRENDS IN THE WOODWORKING INDUSTRY
3.2.1 Timber Usage
In GB, data from the wood industry for 2009-2010 [8] indicate that hardwood represents about 6-7% of the total wood usage (see Table 1).
Table 1 Change in wood use
Type of Wood Import (2010) Production (2009) Total Soft 5,186,000 m3 2,830,000 m3 8,016,000 m3 Hard 467,000 m3 48,000 m3 515,000 m3
The woodwork industry is predominantly made up of small and medium sized enterprises (SMEs). At the time of the 1999/2000 wood dust survey, furniture and wooden product manufacturing and sawmilling employed 219,000 workers in 16,000 registered work sites, with about 79% of the sites employing less than ten workers and 96% less than 50 [1]. In 2006 the UK still had a lot of companies involved in woodworking, with around 8,396 in the manufacture of wood products, 16,395 in manufacture of furniture and 22,308 in joinery [5]. These two reports would appear to show an increase in the number of companies using wood, however this may be due to inconsistencies in how the data are classified.
3.2.2 Industry Profile
The available data from the companies in the 1999/2000 survey show that about a third of the companies had gone out of business in the intervening 11 years.
Table 2 shows the company size distribution for all companies in the 1999/2000 survey and ones still in business in 2011. The number of companies with greater than 100 employees is much reduced.

8
Table 2 Employment Size Band (number of companies) of survey participants
No. Employees: 0 - 4 5 - 9 10 - 19 20 - 49 50 - 99 100 - 249 >250 Total
number of companies
Companies in 1999/2000 survey 2 8 12 11 4 7 2 46
Companies still in business in 2011 4 2 6 8 4 3 0 27
It is not clear from this table how the profile of any individual (surviving) company has changed over the 11 year period. A comparison of the size of each surviving company in 1999/2000 and 2011, for which data are available, is illustrated in Figure 1.
Figure 1 Comparison of individual company profiles between 1999/2000 and 2011
0
50
100
150
200
250
300
350
400
1 2 3 4 5 6 7 8 9 10 11 12 13 14 15 16 17 18 19 20 21 22 23 24 25
Company identification number
Num
ber o
f em
ploy
ees
1999/2000 data
2011 data
The largest decreases in number of employees occurred in the bigger companies (> 100 employees). For those with the greatest decline (companies 1,3, and 4) partial explanations were a move away from flat-pack work and use of sprays, mechanisation of processes and change in business focus from manufacture towards retail.
Most growth in the number of employees in companies occurred in smaller companies (< 50 employees). For those showing a proportionately larger expansion (companies 19, 20 and 25) explanations included an increase in business, purchase of a timber merchants to supplement a sawmill business and a move towards more manufacture, rather than assembly, of pallet boards.
3.2.3 Exposure Data Trends
3.2.3.1 HSE Survey 1989/1990
A GB survey of occupational exposure to wood dust was carried out by HSE in 1989/1990 [4]. This survey did not analyse exposure data by industry but included furniture manufacturing and sawmills and focussed on hard wood. Overall, 60% of the 363 exposures to (hard) wood dust were below the WEL of 5 mg/m³.

9
3.2.3.2 HSE Survey 1999/2000
The HSE survey in 1999/2000 [1] focussed on the furniture and wooden product manufacturing and sawmilling industries, which employed 219,000 workers. The profile of companies visited was considered representative with the proportion of sites in each standard industrial classification (SIC) mirroring the proportion on the HSE database (however still representing a very small proportion of the industry as a whole). This survey reported results from 46 companies, and included 406 samples. (There were originally 47 companies in the survey, however three were excluded from the subsequent paper because of high non-wood content or insufficient survey information, and an additional two sites were incorporated.) There was no attempt to focus on hard or soft wood. A number of industries including construction and boat building were not included in this survey.
The eight hour time-weighted average (TWA) exposure data gave median values for sectors ranging from 1.5 mg/m³ to 2.8 mg/m³ across the selected industry groups (Table 3), although the statistical significance of any differences between industries has not been investigated.
Table 3 Eight hour TWA wood dust exposure (HSE survey 1999/2000) summary statistics by industry
Industry No. of Sites
No. of Samples
Median (mg/m³)
90th Percentile (mg/m³)
Percent <5 mg/m³
Furniture manufacture
19 195 2.8 15.9 67
Joinery manufacture
15 106 2.6 11.4 80
Other manufacture
5 38 2.4 20.3 68
Sawmilling
7 67 1.5 9.7 84
When considering activities (Table 4), the highest median values were for cleaning (10.8 mg/m³), circular sawing (4.6 mg/m³) and sanding (3.2 mg/m³). All other activities gave median values between 1 mg/m³ and 3 mg/m³, except for planing which gave a median value of 0.5 mg/m³. Again, the statistical significance of any apparent differences has not been investigated

10
Table 4 Eight hour TWA wood dust exposure (HSE survey 1999/2000) summary statistics by activity
Activity No. of Sites
No. of Samples
Median (mg/m³)
90th Percentile (mg/m³)
Percent <5 mg/m³
Cleaning 5 5 10.8 * * Circ saw 16 30 4.6 21.3 44 Sander 20 79 3.2 15.5 79 Tenon machine 4 4 2.9 * 67 Lathe 3 4 2.8 * 75 Other 20 56 2.7 14.7 63 Multitask 32 102 2.6 15.9 78 Router 6 12 2.3 5.6 71 Assembly 11 21 2.1 10.6 50 Cross cut saw 17 22 1.8 4.4 90 Moulder 13 38 1.5 5.7 92 Bandsaw 10 22 1.4 4.4 90 Planing 4 7 0.5 * 100 *too few samples for reliable statistical analysis.
A retrospective re-analysis of the data estimated the geometric mean to be 2.7 mg/m³ and the 90th percentile to be 14.7 mg/m³. The 5 mg/m³ wood dust WEL was exceeded by 27% of the measured exposures.
One company involved in bespoke joinery who participated in the 1999/2000 survey provided further exposure data for wood dust from personal air monitoring carried out by the company in 2009 [9]. Eight hour TWA values indicated that:
the maximum exposure was 2.6 mg/m³ (for hand tool sanding) compared to a maximum of 48.7 mg/m³ in 1999/2000,
the geometric mean was 1.32 mg/m³ compared to 2.95 mg/m³ in 1999/2000, and
the 90th percentile was 2.36 mg/m³ compared to 5.64 mg/m³ in 1999/2000.
It is not clear how these reduced exposures were achieved. This unvalidated data, from a single company, cannot be extrapolated to indicate wider trends in exposure.
3.2.3.3 IOM Impact Assessment
The Institute of Medicine (IOM) carried out an impact assessment of changing EU regulation on hardwood dust exposure in 2011 [5]. The key areas of wood use (and wood dust generation) considered were initial processing of raw wood (i.e. forestry, sawmilling, planing and treating) to further processing (joinery & carpentry) and manufacturing of goods.
The number of UK workers, in the different areas of the woodworking industry was indicated based on NACE codes and Eurostat data for 2001 i.e. the estimates are now more than 10 years old. (NACE codes are an EU equivalent to the UK Standard Industrial Classification of Economic Activities (SIC) system.) Hard wood dust exposure data for these workers (1999-2003) were also estimated by modelling data originating from a number of databases (Eurostat, UNECE and WOODEX).

11
Table 5 IOM impact assessment – hardwood dust
Work Area NACE Code (v.1)
Estimated No. of
workers
Geometric mean 8 h TWA (mg/m3)
Forestry 02 6,210 < 0.1 Saw-mills 201 219 1.1 Manufacture of wooden boards 202 4,521 1.0 Manufacture of builders carpentry and joinery 203 25,560 0.3 Manufacture of wooden containers (e.g. pallets and packaging)
204 4,408 0.2
Manufacture of wooden products 205 4,295 0.1 Boat building and repairing 351 1,681 2.6 Manufacture of furniture 361 58,114 1.3 Construction 45 156,521 0.5 Other Other 102,007 0.4 All Work Areas --- 363,540 0.51* * the corresponding 90th percentile is 2.8 mg/m3
The exposure estimates (8 h TWA values) presented in Table 5 are derived from exposure modelling and are significantly lower than the actual measurement data (NEDB data 1985-2003) available to HSE (in Tables 7 to 9). The higher actual exposures may partially reflect the inclusion of older exposure data and actual working practices, whilst the modelled data may be more closely aligned to what is achievable using best practice. It is unclear whether the modelled exposure estimates are reasonably achievable in an ordinary work place using current exposure control solutions.
3.2.3.4 IOM Analysis of NEDB Data
The results from IOM’s analysis of the wood dust data from the NEDB is included in HSE research report RR460 ‘Trends in inhalation exposure Mid 1980s till present’ [6].
In total, 1,651 wood dust measurements from 168 locations or plants, obtained between 1985 and 2003 were extracted from the NEDB. After excluding the results from 192 measurements, results from 1,459 measurements from 153 plants were analysed to detect trends in exposure. (Data from cleaners and ‘miscellaneous occupations’ were excluded as there were too few measurements, as were short term, static and passive samples.) Exposures ranged from 0.01 to 501.6 mg/m³ with a geometric mean of 5.2 mg/m³ calculated based on data in Table 6. Analysis by IOM showed a decline in wood dust exposures of 8.1% per year between 1985 to 2003. Data were also analysed by industry and occupation (Tables 7 to 9).

12
Table 6 Eight hour TWA wood dust exposure (NEDB 1985-2003) geometric mean by year
Year Number of samples
Geometric mean (mg/m³)
Maximum (mg/m³)
1985 24 6.4 110.0 1986 125 15.2 305.5 1987 120 8.0 83.0 1988 321 4.0 501.6 1989 125 5.3 120.0 1990 17 12.1 35.8 1991 104 10.0 77.0 1992 81 5.2 40.0 1993 46 6.5 65.7 1994 37 4.5 17.7 1995 20 5.0 75.7 1996 21 4.6 23.2 1997 16 11.6 95.0 1998 1 0.1 0.1 1999 13 2.5 12.0 2000 345 2.7 305.3 2001 27 11.5 449.0 2002 5 5.4 9.2 2003 11 5.9 21.5
Table 7 Eight hour TWA wood dust exposure (NEDB 1985-2003) analysis of data by industry
Industry Number of samples
Geometric mean (mg/m3)
Maximum (mg/m³)
Manufacture of non-wood products
54 7.7 104.0
Manufacture of builder/construction. wood products
311 5.7 501.6
Manufacture of furniture
825 5.0 391.0
Manufacture of wood products (non furniture)
269 4.9 449.0
The geometric mean exposures presented in Table 7, which relate to actual measurement data, are substantially higher than the modelled exposures presented in Table 5 for comparable industries.

13
Table 8 Eight hour TWA wood dust exposure (NEDB 1985-2003) analysis of data by occupation
Occupation Number of samples
Geometric mean (mg/m3)
Maximum (mg/m³)
Sanders/Polishers 335 6.1 258.0 Carpenters 212 5.7 115.0 Wood Machinists 912 4.8 501.6
Table 9 Eight hour TWA wood dust exposure (NEDB 1985-2003) analysis of data by wood type
Wood Type Number of samples
Geometric mean (mg/m3)
Maximum (mg/m³)
Soft 82 7.8 95.0 Hard 853 6.3 501.6 Mixed 524 3.6 305.3
3.2.4 Trends in Control Measures and Other Indicators of Good Management
Data were collected on the application of LEV, RPE, cleaning procedures and health surveillance. Data on these were acquired via the HSE telephone survey and consultation with the Wood Consultancy Group, and have been reported in detail in Section 3.1. In summary:
• LEV - the number of companies carrying out a 14-month TExT rose from 59% in 1999/2000 to 73% in 2011.
• RPE – in 1999/2000 use of RPE tended to be for dusty tasks, but information and training on its correct use was rarely provided. Information obtained in 2011 suggested that half of the companies contacted either used incorrect masks or could not say what type of mask they were using. Only six out of 30 companies had heard of face fit testing which has become a requirement since 1999/2000.
• Cleaning – brushing and vacuuming still seem to be the main means of cleaning up wood dust, although the use of air-lines appears to have decreased from occurring on about 64% of sites in 1999/2000 (observed) to about 7% of sites in 2011 (self-reported).
• Health Surveillance – this was only carried out by 11% of companies in 1999/2000. By 2011 76% of companies were aware of health surveillance, with 40% of these only carrying out a questionnaire and 25% undertaking higher level surveillance. The remaining companies who were aware of health surveillance, did not appear to carry out any health surveillance.
3.3 ADDITIONAL DATA
3.3.1 Boat Building
Although enquiries were made to the British Marine Federation, data on wood dust exposure for wooden boat building within GB does not appear to exist. It is recognised to be a niche industry and mainly made up of small or one-man operations [10]. IOM estimated that there might be about 1700 boat builders in the UK exposed to wood dust with a geometric mean for exposure of 2.6 mg/m³ (based on French & Finnish exposure data) [5]. An HSE investigation, from 2007, indicated that wood dust exposure within the woodworking area of a fibreglass boat builders was high – the static measurement was 18.6 mg/m³ whilst a single personal 8 h TWA value was 23.6 mg/m³ [11].

14
3.3.2 Use of MDF
The use of MDF (medium-density fibreboard) has not been established recently. Information from a MDF supplier [12] indicated that the estimated current annual usage of MDF in GB was 1.5 million tonnes compared to 0.75 million tonnes of plywood and 1 million tonnes of chipboard. MDF has a wide range of uses as it is cheaper than solid wood and good for complex processes e.g. routing staircase rails. About 85% of MDF sold by one company was for office, bedroom, bathroom and kitchen furniture and shop fitting, whilst the remaining 15% was used for caravans, coffins, pool tables etc. Caravans may account for up to 100 cubic metres per month of raw and melamine-coated MDF [13].
3.3.3 Film Set Construction
The construction of film (and theatre) sets may be done in a woodworking shop and transported to site for assembly, or built on site where facilities, equipment and exposure controls may be more limited. Plywood is often used for flattage (scenery) and floors as it is lighter than MDF, a smooth surface is not required, and it may be coated with a flame-retardant. Where detailed small items, or smooth surfaces are required, MDF is often used, however the amount varies very significantly between sets [14]. There is no exposure data or data on employee numbers.
3.3.4 Wood Recycling
Wood recycling involves the chipping and grading of waste wood and this generates a substantial amount of airborne wood dust. Fifteen personal air samples were taken from four site visits for a HSE project in 2010. The 8 h TWA exposures ranged from 0.29 mg/m³ to 52.4 mg/m³ with the higher values for those involved in cleaning of the machinery [7]. Cleaning was often carried out using compressed air and manual sweeping, and task based exposures ranged from 0.23 mg/m³ to 150 mg/m³.
3.3.5 Wood Biofuel
There is increasing use of wood as a biofuel in the form of pellets and briquettes. The Forestry Commission estimate that the amount of wood pellets and briquettes produced has increased from 118,000 tonnes in 2009 to 244,000 tonnes in 2011 [15].
Wood pellets are made from dry sawdust compressed under high pressure and extruded through a die. They typically range in size from 6 mm to 12 mm. Briquettes are similar to wood pellets, but are physically larger, usually between 60 mm and 150 mm in length. The combination of low moisture content, high density and the ability to flow and pack closely, gives a fuel with a high bulk energy density, requiring less storage space than lower density fuels such as wood chips [16].
3.3.6 Building Construction
The number of workers with wood dust exposures in the construction industry has been estimated to be 165,000 compared to 219,000 engaged in the manufacture of wooden products and sawmills.
The three visits performed as part of this work were each reported individually, and the ten exposures measured are summarised in Table 10.
15
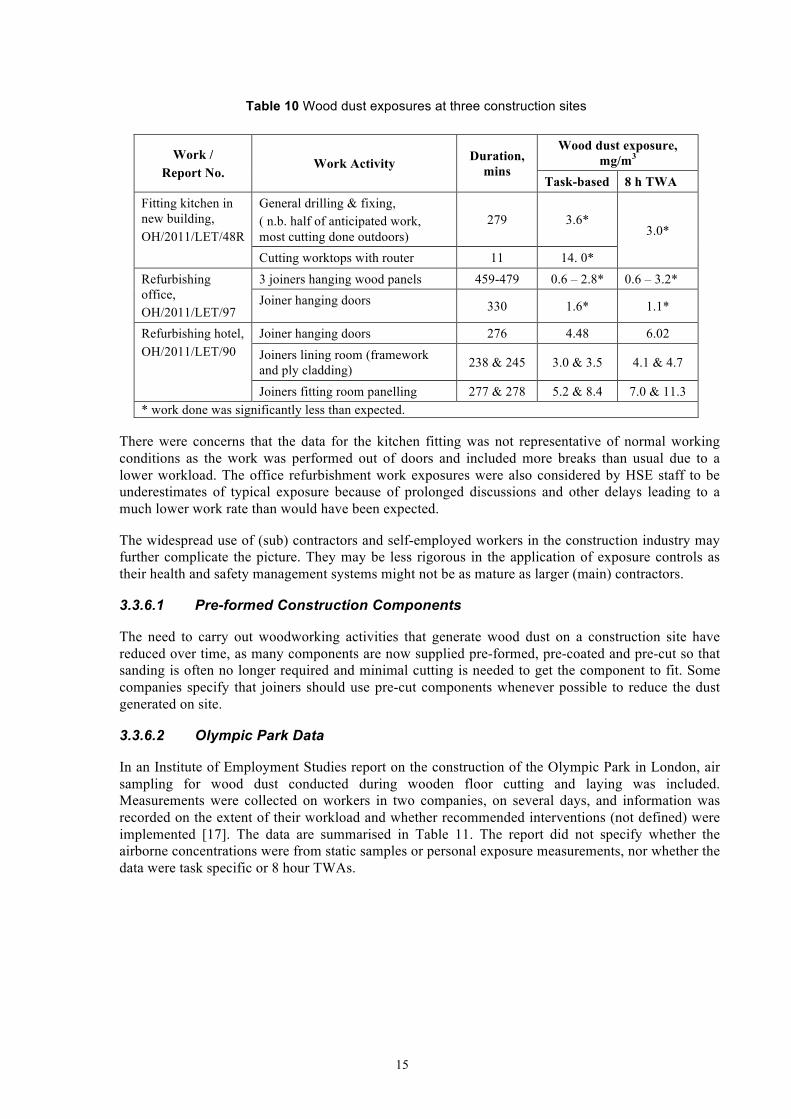
Table 10 Wood dust exposures at three construction sites
Work / Report No.
Work Activity Duration, mins
Wood dust exposure, mg/m3
Task-based 8 h TWA Fitting kitchen in new building, OH/2011/LET/48R
General drilling & fixing, ( n.b. half of anticipated work, most cutting done outdoors)
279 3.6* 3.0*
Cutting worktops with router 11 14. 0* Refurbishing office, OH/2011/LET/97
3 joiners hanging wood panels 459-479 0.6 – 2.8* 0.6 – 3.2* Joiner hanging doors 330 1.6* 1.1*
Refurbishing hotel, OH/2011/LET/90
Joiner hanging doors 276 4.48 6.02 Joiners lining room (framework and ply cladding) 238 & 245 3.0 & 3.5 4.1 & 4.7
Joiners fitting room panelling 277 & 278 5.2 & 8.4 7.0 & 11.3 * work done was significantly less than expected.
There were concerns that the data for the kitchen fitting was not representative of normal working conditions as the work was performed out of doors and included more breaks than usual due to a lower workload. The office refurbishment work exposures were also considered by HSE staff to be underestimates of typical exposure because of prolonged discussions and other delays leading to a much lower work rate than would have been expected.
The widespread use of (sub) contractors and self-employed workers in the construction industry may further complicate the picture. They may be less rigorous in the application of exposure controls as their health and safety management systems might not be as mature as larger (main) contractors.
3.3.6.1 Pre-formed Construction Components
The need to carry out woodworking activities that generate wood dust on a construction site have reduced over time, as many components are now supplied pre-formed, pre-coated and pre-cut so that sanding is often no longer required and minimal cutting is needed to get the component to fit. Some companies specify that joiners should use pre-cut components whenever possible to reduce the dust generated on site.
3.3.6.2 Olympic Park Data
In an Institute of Employment Studies report on the construction of the Olympic Park in London, air sampling for wood dust conducted during wooden floor cutting and laying was included. Measurements were collected on workers in two companies, on several days, and information was recorded on the extent of their workload and whether recommended interventions (not defined) were implemented [17]. The data are summarised in Table 11. The report did not specify whether the airborne concentrations were from static samples or personal exposure measurements, nor whether the data were task specific or 8 hour TWAs.

16
Table 11 Summary of wood dust measurements from floor cutting and laying at the Olympic Park
Survey Details Date of Sampling Range of Airborne
Concentrations (mg/m3)
Comments
Floor cutting / laying by Company 1
18/03/11 5.08 – 22.96 No intervention 08/04/11 7.27 – 16.89 Implementation of
some recommended interventions from management
27/04/11 3.38 – 6.86 Implementation of all recommended implementations from management
Floor cutting / laying by Company 2
22/03/11 6.08 – 6.09 No intervention and reduced workload
18/04/11 11.04 – 21.14 No intervention and normal workload
08/06/11 30.61 No recommendations implemented
08/06/11 10.69 Recommendations implemented
3.3.7 Flat-Packs
Flat-pack assembly is considered to be the activity in which pre-cut/pre-formed/standard wooden components are purchased, assembled and their appearance enhanced, as required. Production of flat-packs would be classified as manufacture rather than assembly.
• The wooden components may vary from small parts for a kitchen unit to large panels for building a pre- fabricated dwelling.
• The assembly may include gluing, screwing the parts together, other joining techniques and some minor cutting/shaping to fit the surroundings. It could be carried out in wood product manufacturing companies, by fitters on customer site, or by customers in their own homes.
• Finishing (e.g. sanding) and coating (e.g. spray painting, varnishing) can also occur.
Anecdotal evidence suggests that there is scope for companies to buy less expensive wood and use advancing coating technologies to make the final wood product look of a higher quality. However, the telephone survey revealed that only three of the thirty companies were doing any flat-pack work in 2011. Two of these were kitchen furniture manufacturers who were doing a little flat-pack work (but a lot less than ten years ago), whilst one (a garden furniture manufacturer) is developing into this area.
The British Furniture Manufacturers Association (BFM) has indicated in 2012 [18], that there was a move towards importing pre-made goods with finishing conducted in GB. However, they are now seeing this trend reversed with large companies bringing their manufacturing back to GB due to the increased cost of labour overseas, coupled with rising shipping costs and a change in exchange rates. The total value of goods imported for finishing in GB is much less significant than the total value of GB manufactured furniture.
There is a lack of robust data to indicate whether flat-pack assembly is increasing and could contribute to reducing worker exposure to wood dust in the GB woodworking industry.

17
3.3.8 Laminates / Veneers
The telephone survey revealed that six of the thirty companies were involved in the production of laminates and veneers. Four furniture companies made veneers, one joinery did some bespoke veneer work, and one furniture manufacturer made plywood panels.
3.3.9 Spray Lacquers / Varnishes / Paints
The telephone survey revealed that thirteen of the thirty manufacturers used spray products, ranging from polyurethane resins to lacquers, stains and paints.

18
4. DISCUSSION
The telephone survey and industry consultation provides self-reported evidence which has not been validated. None of the sites have been visited to verify the comments made and therefore the degree of credibility that can be given to the evidence is limited.
4.1 TELEPHONE SURVEY OF 1999/2000 SURVEY PARTICIPANTS
The telephone survey revealed that there is uncertainty in industry over whether control of exposure to wood dust has improved since 2000, and hence whether there is still scope for further progress in controlling wood dust. There remains a lack of knowledge amongst many companies about control of wood dust exposure.
4.2 TRENDS IN THE WOODWORKING INDUSTRY
The woodworking industry tends to be made up of small to medium sized enterprises and the number of woodworking companies is perceived to be declining. The HSE wood consultancy group identified that the number of new small companies (< 10 people) has not been accounted for in this project. The management of occupational exposure to wood dust in the construction industry can be complicated by the widespread use of contractors and self-employed workers. It is possible to specify appropriate exposure control measures in contracts with contractors and the self-employed, and suitable equipment can be provided. Supervision should be provided by the site contact and principal contractor to ensure controls are used effectively. However the main duty for control under COSHH rests with those that create the risk i.e. the subcontractor.
Anecdotal evidence has suggested that there has been a decline in hardwood usage over recent years, but this appears to have bottomed out at about 6-7% of the total wood usage, (part of which may be in wood based board manufacture). Hardwood dust exposures feature disproportionately in the NEDB. This may be because its EU classification as a carcinogen makes exposure a greater concern. Many woodworking shops used both hard and softwood. 4.2.1 Exposure Data Trends Comparison of HSE exposure surveys in 1989/1990 and 1999/2000 showed a reduction of exposures exceeding 5 mg/m³ from 40% to 27%. This is similar to the estimate of 21% of exposures in the UK being above 5 mg/m³ made by Kauppinen et al in 2006 [19]. However this information was based on the WOODEX database, which is assumed to be taken from the HSE NEDB, much of which would have originated from this HSE survey. For comparison, Kauppinnen estimated similar proportions exceeding 5 mg/m³ in Ireland (20%) and the Netherlands (22%), however other major industrialised EU countries had a lower proportion: Germany 16%, Spain 16%, France 15%, Italy 15% and Poland 14%. Analysis of NEDB data by IOM showed a decline in wood dust exposures of about 8% per year between 1985 and 2003. A total of 1459 wood dust samples from 153 worksites were analysed. The majority of the data (69%) were stated to be from inspection visits (1009 samples) compared to representative surveys (450 samples) [6]. However, the data from the HSE survey in 1999/2000 appear to have been misclassified as inspection data. It is unclear whether the trend reported is representative of the industry. No study has been made of NEDB data since 2003.
The survey in 1989/90 examined exposure to hardwood dust, whilst the survey in 1999/2000 looked at exposure to dust from hardwood, softwood and composite wood based board. Limited data allowed a tentative comparison of softwood and composite wood dust exposure, finding no significant difference. The NEDB data did not show a great difference between hard and soft wood dust exposure

19
(geometric means 6.3 and 7.8 mg/m³ respectively), but for some reason exposures were lower where there was mixed exposure (3.6 mg/m³). Hardwood and softwood dust exposure can only be differentiated when only one sort is present in the workshop.
4.2.2 Trends in Control Measures and Other Indicators of Good Management
The main type of engineering control in the woodworking industry is LEV, but this can range from larger systems in established workshops to dust collectors on portable equipment. Companies are becoming more aware of the need for the ‘formal’ 14-monthly TExT, but the need for regular checks (e.g. airflow indicator pressure gauge on the system) and maintenance (e.g. emptying dust bags on portable saws) is not fully appreciated.
RPE, although a last resort in the hierarchy of control, seems to be widely available and relied upon in woodworking companies. However a significant number of companies did not know what masks they were using, left the option to use RPE to workers, and failed to realise the need for face fit testing. There appears to be a general lack of understanding of how to implement effective hygiene controls.
Cleaning still seems to occur by a mixture of brushing and vacuuming. Several companies have indicated that they brush wood dust to an LEV extraction point and then use the extraction as the vacuum. HSE discourage brushing and advise using vacuum equipment that meets at least the dust class M (medium hazard) classification [20]. Awareness of health surveillance is now better within woodworking companies, but there seems to be little consistency or clarity over what is required, with some companies doing a questionnaire and some doing lung function and/or nasal checks. HSE requires health surveillance for workers exposed to wood dust [21]. This includes skin checks for dermatitis and questionnaires and lung function tests for asthma [22]. 4.3 ADDITIONAL DATA Data were acquired on changing practices within the woodworking industry and exposures to wood dust in industries about which little was known. The changing practices for wood use in GB are unclear, but those considered are:
• The use of MDF – it is not known whether there is an increasing use of MDF (or other particle board), now that spray/lacquer technology is improving such that less expensive wood with coating is becoming a viable business option.
• Use of flat-packs – anecdotal evidence suggested an increase in the use of flat-packs for furniture, although the BFM has since indicated that this is being reversed with more manufacturing in GB due to increase costs incurred with production overseas and subsequent import. The use of pre-formed components in construction has significantly increased.
• Veneer production – this is carried out by furniture manufacturers and bespoke joineries but there is very little exposure data from manufacture of veneer sheets and wood based panels.
• Spray products – the spraying of lacquers and varnishes is common. The telephone survey indicated that no attempt was made to differentiate isocyanate based polyurethane finishes from other sprayed applications.
Wood dust exposure data were sought for:
• Wooden boat building – no data were forth-coming despite a request being put in the trade journal of the British Marine Federation. A single data point, for woodworking within a fibre-

20
glass boat building company indicated an exposure of 23.6 mg/m³. While this cannot be extrapolated more widely, it illustrates a potential for high exposures in boat building.
• Film set construction – no exposure data were found, but a response from the consultation suggested that this sector of the industry should not be treated differently to any other.
• Construction sites – limited exposure data from construction (three sites) showed high exposures are possible. The quantity of data from the construction visits is minimal in proportion to the size of the industry, but even at reputable contractors working for large client companies, significant exposures were found. The exposures were significantly higher than the geometric mean hard wood dust exposure predicted in the IOM impact assessment (0.5 mg/m³) [5]. Wood is used in construction in many ways and at transient sites therefore providing challenging conditions to effective use of controls such as LEV.
• The wood recycling industry – this is a relatively new industry, and results from four sites visited have shown high exposures to wood dust (task specific exposures up to 150 mg/m3, 8 hour TWA exposures up to 52.4 mg/m3), so improvements in control are required at the sites visited.
• The wood biofuel industry is relatively new and HSE have no information on worker exposure to wood dust and controls used during the production and storage of pellets and briquettes, nor the size of the industry.

21
5. CONCLUSIONS
There is uncertainty whether the control of occupational exposure to wood dust exposure has improved since 2000. There are gaps in HSE’s evidence base on occupational exposure data for wood dust and on the methods of control of exposure in a wide range of activities, including board and veneer manufacture, assembly of flat-pack furniture, boat building, wood recycling and wood biofuel production. Although commonly applied, there are also limited data on the spraying of lacquers and varnishes. There are also significant gaps in HSE’s evidence base for wood dust exposure in the construction sector. Visits to just three sites for this project found exposures above the WEL, even on sites judged to be well-managed. The range of tasks leading to these exposures is not understood. The management of wood dust exposure in the construction industry can be complicated by the widespread use of (sub) contractors and self-employed workers. The changing pattern of wood usage in the GB woodworking industry is unclear. Whilst there is only anecdotal evidence of a change in the use of flat-packs for furniture manufacture/assembly, the use of pre-formed components in construction has significantly increased. The extent of manufacture of veneer, plywood and board, the use of isocyanate lacquers, and amount of MDF used are not well-defined. Other sections of the industry are unmapped. The woodworking industry tends to be made up of small companies. The number of large woodworking companies is believed to be declining, but the number of new small companies has not been accounted for.

22
6. REFERENCES [1] Occupational Exposure to Wood Dust in the British Woodworking Industry in 1999/2000. N Black, M Dilworth & N Summers. Annals of Occupational Hygiene 51(3) 249-260 (2007)
[2] Lesley Rushton, Sanjeev Bagga, Ruth Bevan, Terry P Brown, John W Cherrie, Philip Holmes, Sally J Hutchings, Lea Fortunato, Rebecca Slack, Martie van Tongeren, Charlotte Young (2010) The burden of occupational cancer in Great Britain - Overview report. HSE Research Report RR800,
[3] EH40/2005 Workplace exposure limits. Containing the list of workplace exposure limits for use with the Control of Substances Hazardous to Health Regulations (as amended) 2nd edition HSE Books, ISBN 978 0 7176 6446 7. (HSE 2011)
[4] HSE Technical Development Survey Report: Exposure to hardwood dust. HSE internal report (1990)
[5] IOM Health, socio-economic and environmental aspects of possible amendments to the EU Directive on the protection of workers from the risks related to exposure to carcinogens and mutagens at work. Hardwood Dust. JW Cherrie, M van Tongeren, M Gorman Ng, O Warwick, C Corden, R Mintry, M-H Bouhier, L Rushton, S Hutchings, T Kauppinen, P Heikkila, H Kromhout & L Levy. Institute of Medicine. IOM Report P937/1 (May 2011, unpublished)
[6] Trends in inhalation exposure – Mid 1980s till present RESEARCH REPORT 460 Prepared by the Institute of Occupational Medicine
[7] EXTEND topic report. Occupational Hygiene implications of recycling wood (OH/2010/97). HSL internal report (2010) & Summary Report Occupational Hygiene implications of recycling wood. HSL internal report OH/2011/25.
[8] Information in email from the Head of Technical & Trade Policy, Timber Trade Federation to John McAlinden (HSE) on 21st March 2011
[9] Wood dust exposure data, from 2009, provided by one company who had participated in the HSE survey in 1999/2000. Email to Susan Hambling (HSE) on 15th August 2011
[10] Email from Wooden Boat Builders Trade Association dated 29th November 2011
[11] HSL Report: OH/LET/2007/FSA/20 (JS5010429E) Internal use only (2007)
[12] Telephone call between MD of a timber merchant and Susan Hambling (HSE) on 23rd November 2011
[13] Telephone call between manufacturer of wood panel products and Susan Hambling (HSE) on 28th November 2011
[14] Telephone call between the Director of a film set construction company and Susan Hambling (HSE) on 28th November 2011
[15] Forestry Statistics 2012 - UK-Grown Timber, accessed on the Forestry Commission website on 28th March 2013 http://www.forestry.gov.uk/website/forstats2012.nsf/LUContents/436AB0E21DFB39D3802575EE00543495
[16] BIOMASS Energy Centre website, accessed 28th March 2013 http://www.biomassenergycentre.org.uk/portal/page?_pageid=73,1&_dad=portal&_schema=PORTAL

23
[17] Occupational Hygiene at the Olympic Park and Athletes’ Village. Can workplace health management be cost effective? Claire Tyers, Stefan Speckesser, Ben Hicks, Karen Baxter, Melodie Gilbert, Eric Ball. Report 497 from Institute of Employment Studies (IES) 2012.
[18] Email from Alistair Bromhead (BFM) to Cliff Seymour (HSE) regarding trends in use of flat-packs (August 2012). Stored as TRIM 2012/432505.
[19] Occupational exposure to inhalable wood dust in the member states of the European Union. T Kauppinen, R Vincent & T. Liukkonen. Annals of Occupational Hygiene 50 549-561 (2006)
[20] COSHH and the woodworking industries, Woodworking Information Sheet No 6 (HSE 2007)
[21] Wood dust - Controlling the risks, Woodworking Information Sheet No 23 (HSE 2012)
[22] Health surveillance for occupational asthma, COSHH essentials general guidance G402 (HSE 2006)

24
APPENDIX A. WOODWORKING INDUSTRY CONSULTATION QUESTIONNAIRE
The degree to which the telephone survey represented the industry as a whole was tested by consultation with industry via contacts in HSE’s Wood Consultancy Group. This is a group primarily composed of the Wood Safety Group (an industry run/chaired body that HSE sits on) with additional industry experts. The questionnaire is reproduced here with summaries of responses annotated following each question.
Wood Consultancy Group British Furniture Manufacturers Association (BFM) British Woodworking Federation (BWF) Construction Skills Engineering Employers Federation (EEF) Institute of Woodworking Technology National Association of Shopfitters (NAS) Proskills Timber Packaging and Pallet Confederation (TIMCON) Timber Trade Federation (TTF) Trussed Rafter Association (TRA) United Kingdom Forest Products Association (UKFPA) Woodworking Machinery Suppliers Association (WMSA) and various additional independent industry experts as well as the General, Municipal, Boilermakers and Allied Trade Union (GMB).

25
Review of evidence for wood dust exposure in the woodworking industry Introduction HSE last carried out a survey of occupational exposure to wood dust in the British woodworking industry in 1999/2000 (http://annhyg.oxfordjournals.org/content/51/3/249.full.pdf+html). Of the measured values for wood dust 27% exceeded the workplace exposure limit of 5 mg/m3. Now, a little over 10 years on, HSE is piloting a proposed new project to review whether wood dust exposures are likely to have reduced due to improved controls and/or changes in industry work practices. A telephone survey of companies that participated in the 1999/2000 survey was carried out, to identify the changes in the nature of their business and the extent of use of local exhaust ventilation (LEV) and respiratory protective equipment (RPE) (as qualitative indicators of possible changes in control measures). Information was obtained verbally and assumed to be accurate, with no check visits carried out to consolidate the responses. Many of the companies had however received some form of HSE intervention between the 1999/2000 survey and the new telephone survey. In addition, contacts were made with the boat-building, wood recycling and construction industries as these were not included in the 1999/2000 survey. Our observations, based on limited data from verbal responses, are listed below. We are unsure to what degree they are representative of the various sectors of the woodworking industry, and would appreciate your feedback on this. You can either answer the questions posed and/or just comment on the observations in terms of your knowledge and whether you consider them representative. Some observations may not be relevant for your sector, and if so please just indicate this. Please could you send your responses to Mrs Wendie Drammeh (email: [email protected], tel no: 0113-283-4397) by 15th February 2012 . Thank you for your anticipated help. Your industry – Please give brief details of your industry group …………………………………………………………………………………………………………………………………………………………………………………………………………………………. Observations Observation 1 – LEV (Local Exhaust Ventilation) More companies (73% compared with up to 59% 10 years ago) said they carry out the 14 month thorough examination and test (TExT) for LEV systems providing extraction on woodworking machinery. It was found to be the case in the 1999/2000 survey that wood dust exposure was better controlled at those companies which carried out a TExT. Only five of the thirty companies had any air flow indicator on the LEV, although two were looking into fitting simple static pressure gauges, as a result of either HSE advice during an inspection or a recommendation from a LEV supplier. o Do you believe that about a quarter of woodworking companies still do not have a 14
month thorough examination and test carried out?
About 40% agree, and 40% think may be higher. One organisation thinks that 25% may be correct for the number of companies, but not for the volume/value of products nor number of employees protected, whilst another
26
thinks that 25% may be correct for companies that have had HSE interventions but more other companies would not use LEV.
o Few companies appear to have an air flow indicator on their LEV to indicate the system
is working. Is this your view and if so, do you know why (e.g. cost, no obvious benefit etc?)
Wide range of responses – the main points are poor awareness (suppliers/testers need to promote), understanding of benefits, and concern over costs of installation. One organisation indicated that it was a misunderstanding of cost, rather than cost per se (~ £100 per AFI) and that benefits should be promoted e.g. one can tell instantly when the filter is ineffective, no need to buy & maintain calibrated equipment to check airflow, and less regular checks of system needed (so temporary rather than permanent safe access requirements and much cheaper). Also thought HSE steps retrograde to not require AFI on all systems and in action plans for LEV improvements (where absent).
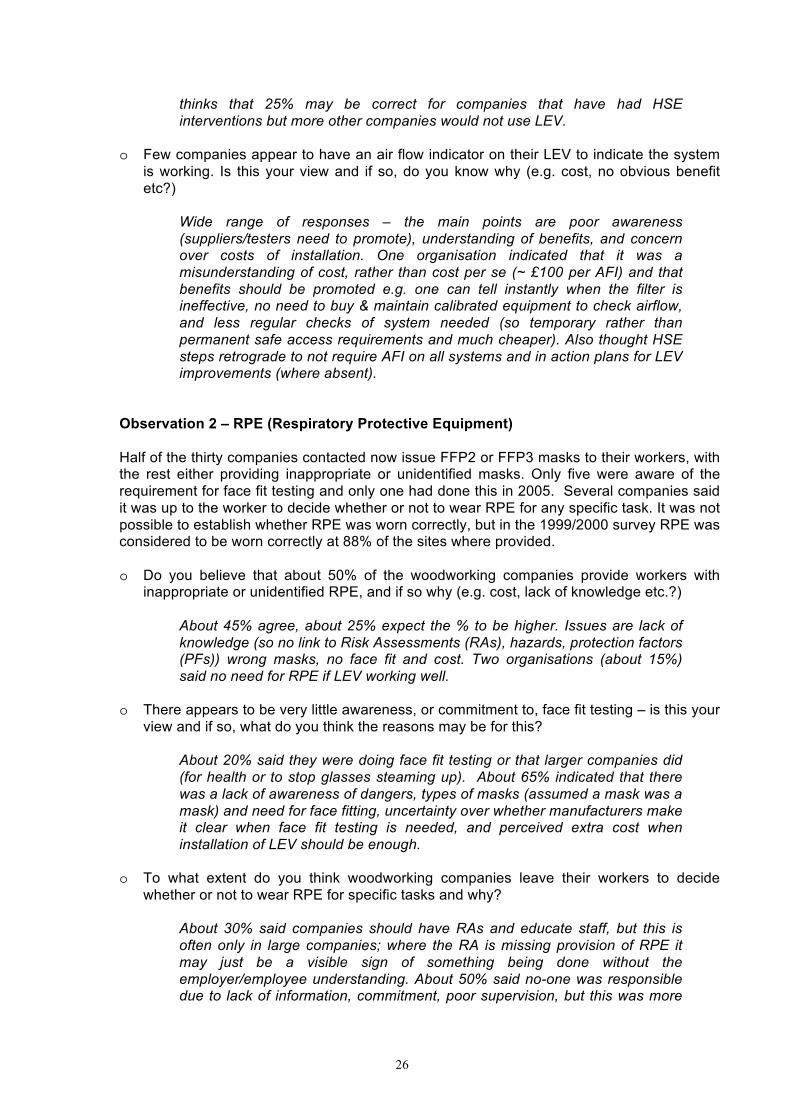
Observation 2 – RPE (Respiratory Protective Equipment) Half of the thirty companies contacted now issue FFP2 or FFP3 masks to their workers, with the rest either providing inappropriate or unidentified masks. Only five were aware of the requirement for face fit testing and only one had done this in 2005. Several companies said it was up to the worker to decide whether or not to wear RPE for any specific task. It was not possible to establish whether RPE was worn correctly, but in the 1999/2000 survey RPE was considered to be worn correctly at 88% of the sites where provided. o Do you believe that about 50% of the woodworking companies provide workers with
inappropriate or unidentified RPE, and if so why (e.g. cost, lack of knowledge etc.?)
About 45% agree, about 25% expect the % to be higher. Issues are lack of knowledge (so no link to Risk Assessments (RAs), hazards, protection factors (PFs)) wrong masks, no face fit and cost. Two organisations (about 15%) said no need for RPE if LEV working well.
o There appears to be very little awareness, or commitment to, face fit testing – is this your
view and if so, what do you think the reasons may be for this?
About 20% said they were doing face fit testing or that larger companies did (for health or to stop glasses steaming up). About 65% indicated that there was a lack of awareness of dangers, types of masks (assumed a mask was a mask) and need for face fitting, uncertainty over whether manufacturers make it clear when face fit testing is needed, and perceived extra cost when installation of LEV should be enough.
o To what extent do you think woodworking companies leave their workers to decide
whether or not to wear RPE for specific tasks and why?
About 30% said companies should have RAs and educate staff, but this is often only in large companies; where the RA is missing provision of RPE it may just be a visible sign of something being done without the employer/employee understanding. About 50% said no-one was responsible due to lack of information, commitment, poor supervision, but this was more

27
likely to be in small companies. One organisation estimated that 25% of employees are left to decide on the use of RPE.
Observation 3 – Health Surveillance Health surveillance information was sought from 21 companies during the telephone survey, and only five had not heard of it. Of the 76% who were aware of health surveillance, eight were just doing a health questionnaire, and five (generally the larger companies) were doing higher level health surveillance including some lung function and /or sino-nasal checks. One company has stopped doing health surveillance as they deemed it too expensive, whilst two others did lung function tests but less frequently. o Do you consider that most companies in the woodworking industry are aware of the need
for health surveillance, but only very few carry out health checks and if so why?
Awareness of health surveillance (HS) is varied, better in larger companies with specialist H&S managers and able to do low level surveillance in-house, and those who have had HSE interventions, but about 60% are unaware. The reasons suggested for not doing HS include employers not knowing where to look for it and expecting costs to be high, actual costs of testing, the cost of corrective actions, risk of claims, and employee resistance. Comments raised were about the need to promote HS, cost effective solutions when there are few employees and whether insurance companies have requirements.
Observation 4 – Cleaning up Dust In the 1999/2000 survey it was noted that 79% of sites had a vacuum cleaner, but brushing was observed at 96% of sites, and use of a compressed air-line to blow clean machinery and clothing at 64%. During the telephone survey most companies indicated that they generally cleaned up dust from the floor by either brushing together the dust and then using the extraction power from the LEV, or using a vacuum. o Do you think many woodworking companies use vacuum systems to clean up wood dust
around their sites?
Four companies believed that there were many companies using vacuum systems, and eight that there weren’t. Others suggested that the situation was improving, possibly up to 50% using vacuum systems or depended on the size of the company. Three suggested that a combination of brush and vacuum was used and three companies still believed that air-line use was common. Some sweep yard/warehouse but vacuum factories, some can’t use bulk vacuum in machine recesses so sweep.
Observation 5 – Manufacturers of wooden products (including furniture) During the telephone survey, information was sought on the use of flat-packs, production of veneers/laminates and use of spray paints/lacquers:
- three of the thirty companies (10%) indicated they were still doing some flat-pack work, with two doing a lot less than 10 years ago but one developing into this area.
- six of the thirty companies (20%) indicated that they were involved in the production of veneers (5 furniture makers) and laminates (1 suite manufacturer makes plywood panels)

28
- thirteen of the thirty manufacturers of wooden components or furniture (43%) companies indicated that they used some spray products ranging from polyurethane resins, lacquers, stains and paints
o Do you believe that these observations are representative of the companies involved in
the manufacture of wooden products, including furniture, and if not how do your views differ from these observations?
About 55% of respondents were able to comment and most broadly agreed with the data. Comments included no laminates or flat-packs (500 merchants), fewer veneers, increased use of board, plywood and CNCs. An increased use of water-based treatments was indicated, but there was possible confusion as to whether responses were on the use of treatments (most woods) or sprayed treatments, and what treatments included. One organisation specifically agreed that the 10% estimate for flat-pack work was correct, lamination should be about 40-50% of companies rather than 20%, and that around 40% of companies used spray products.
Observation 6 – Use of MDF Current information on the uses of MDF appears limited. Conversations with MDF suppliers have suggested that the current annual usage of MDF in the UK is about 1.5 million tonnes (1.2 million cubic metres) compared to 0.75 million tonnes of plywood (1.2 million cubic metres) and 1 million tonnes of chipboard. It has been suggested that about 85% of MDF is used for office, bedroom, bathroom, kitchen and shop fitting, whilst the remaining 15% is used for caravans, and to a lesser extent coffins, pool tables etc. o Do you think these data correctly represent the use of MDF within the UK, or is there any
additional information that you could provide?
About 55% of respondents were able to comment and most agreed, although some indicated virtually all woodworking shops use some MDF, and that the amounts could be higher. Uses mentioned specifically included laminated floors, 2nd fixes, door manufacture and in joineries.
Observation 7 – Wood dust exposure in Construction The number of woodworkers employed within the Construction industry was estimated to be about 40% of those involved in woodworking in manufacturing. There has been a decrease in activities that generate wood dust on construction sites as many components are now supplied pre-formed and/or pre-coated so that sanding/painting is often no longer required and minimal cutting is needed. Preliminary monitoring by HSE indicates exposures to wood dust will not be less than an 8-hour TWA of 3 mg/m3. o Does this information seem representative of woodworking activities within the
construction industry, and if not why?
Most respondents could not comment. Of seven (about 45%) that could, five agreed, one thought it not accurate as joiners work in the open air with no protection so exposures should be lower than 3 mg/m³, whilst another was surprised the results were below 10 mg/m³. It was indicated that exposures from most activities should be controllable by LEV, but chop saws can give

29
very high dust emissions so they should only be used for short durations so the tooling used is important.
Observation 8 – Construction of Film Sets The construction of film (and theatre) sets may be done in a proper woodworking shop and transported to site for assembly, or built on site where facilities, equipment and controls may be much more limited. Plywood is often used for flattage (scenery) and floors, whilst heavier MDF is used for detailed small items. However, the significant differences between different sets means that wood usage is extremely variable and data on wood dust exposures does not seem to be available. o Do you consider it likely that wood dust exposure may be significant in film/theatre set
construction, and if so, when is it likely to be a worse-case?
Most respondents could not comment. Of the seven (about 45 %) that did comment most said that work cutting parts would be done in initial workshops, with a higher risk if cutting was done in small areas, on-site with limited equipment and lack of knowledge of H&S and equipment. There is a drive towards waste reduction so more parts are reusable (can be assembled and disassembled). It was also noted that it was not appropriate to single out woodworking for film sets compared to other industries.
Observation 9 – Other industries with high wood dust exposure levels Limited data are available for wooden boat building, but a single measurement in the woodworking area at a styrene boat builder’s premises gave a personal 8-hour TWA exposure of 23.6 mg/m3. Wood recycling (involving the chipping and grading of waste wood) generates a substantial amount of airborne wood dust having 8 hour TWAs up to 52.4 mg/m3 with the higher values for those cleaning the machinery (often blowing with compressed air or sweeping). o What sectors within the woodworking industry (including boat building and wood
recycling) do you believe generate high wood dust exposure levels (i.e. well above the WEL of 5 mg/m3)?
The range of industries that might give high dust generation are those processing dry wood and wood based sheet materials e.g. secondary wood processing (i.e. re-sawing of kiln dried sawn timber and wood planing/moulding operations), joinery manufacture, shop-fitting, kitchen and furniture manufacture, fencing manufacture, wood packaging, wood recycling etc. Operations include sawmilling, wood-turning, sanding furniture/doors, and high speed routing. There were some concerns about small enterprises, colleges, jobbing workshops etc where controls are inadequate. In addition one organisation indicated that it is more important to consider dust generation and exposure according to process and type of equipment used rather than industry.
Observation 10 – Overall profile of woodworking industry At the time of the 1999/2000 wood dust survey, there were about 16,000 work sites involved as sawmills or in the manufacture of wooden products with about 79% of the sites employing

30
less than 10 workers and 96% less than 50. Of the companies in the original survey, about 35% were no longer contactable / out of business and 45% provided current employee numbers (23 companies). Of these 23 companies four (17%) had less than 10 employees, sixteen (73%) had less than 50 employees and seven (30%) had 51-220 employees. o Do you believe that these data are representative of the decline in numbers of
woodworking companies and changing profile size of woodworking companies?
About 50% of the respondents agreed, but comments made, and those who disagreed felt that the number of companies with under 10 employees was much higher than suggested (75% or 90%) and not on the radar/hard to reach. There was indication also that change is to more bespoke and niche market ventures. One organisation indicated that there was decline in woodworking shops overall due to business recession, cost of materials, overheads and foreign competition.

Published by the Health and Safety Executive 06/14

Pilot project to research the need to update HSE on the occupational health risks in the woodworking industry
Health and Safety Executive
RR1011
www.hse.gov.uk
This report presents the findings of a pilot project to research the need to update HSE’s evidence base for wood dust exposure risks in GB manufacturing and construction industries.
Information was sourced from businesses which had participated in previous exposure surveys, contact with manufacturing (woodworking) businesses and trade associations, a literature review of papers reporting wood dust exposure data, and occupational hygiene surveys for wood dust exposure at three construction sites. The report finds there to be:
n uncertainty whether the control of occupational exposure to wood dust has improved since 2000;
n limited understanding of exposure risk to wood dust in construction;
n a lack of reliable, current intelligence on exposure risk to wood dust;
n limited understanding of the changing patterns of wood usage;
n lack of clarity on the changing profile of the woodworking industry
Further research is now planned by HSE to work in partnership with industry to establish a baseline occupational exposure dataset characterising good controls practice
This report and the work it describes were funded by the Health and Safety Executive (HSE). Its contents, including any opinions and/or conclusions expressed, are those of the authors alone and do not necessarily reflect HSE policy.