pilot pioneer expert user manual v10 - dingli pioneer expert/pilot... · 6 log file management ......
TRANSCRIPT

Pilot Pioneer Expert User Manual
V10.0

Contents
Contents 1 What's New ............................................................................................................................. 1
1.1 New Features .............................................................................................................. 1
1.1.1 GPS Compensation with Inertial Navigation System ................................... 1
1.1.2 Export Map Layers ............................................................................................. 2
1.1.3 Cell Site Coverage Map ..................................................................................... 3
1.1.4 Unified Display Color for BCCH/PSC/PCI Coverage Routes and Serving
Cell 3
1.2 New Reports ............................................................................................................... 4
1.2.1 LTE Data Service Report (CA) .......................................................................... 4
1.2.2 New Data Service Reports ................................................................................ 5
1.2.3 4G Benchmarking Report .................................................................................. 5
1.2.4 VoLTE Report ..................................................................................................... 6
2 Overview ................................................................................................................................. 7
2.1 Introduction to Pilot Pioneer .................................................................................... 7
2.2 Operating System ....................................................................................................... 7
2.3 Required Configuration ............................................................................................ 7
2.4 Recommended Configuration .................................................................................. 7
3 Main Interface ......................................................................................................................... 8
3.1 Navigation Pane ......................................................................................................... 8
3.2 Menu Bar ..................................................................................................................... 9
3.2.1 File ........................................................................................................................ 9
3.2.2 Language ........................................................................................................... 10
3.2.3 Configuration .................................................................................................... 10
3.2.4 Tools ................................................................................................................... 11
3.2.5 Help .................................................................................................................... 12
3.3 Tool Bar ...................................................................................................................... 13
3.4 Title Bar ...................................................................................................................... 14

Contents
3.5 Workspace ................................................................................................................. 14
3.6 Status Bar ................................................................................................................... 15
4 Project Management ............................................................................................................ 16
4.1 New Project ............................................................................................................... 16
4.2 Open Project .............................................................................................................. 18
4.3 Recent Project ............................................................................................................ 18
4.4 Save Project ............................................................................................................... 19
4.5 Save Project As ......................................................................................................... 19
4.6 Close Project .............................................................................................................. 19
5 Scene Manager ...................................................................................................................... 20
6 Log File Management .......................................................................................................... 22
6.1 Import Logfiles ......................................................................................................... 22
6.2 Export Logfiles .......................................................................................................... 22
6.3 Delete Logfiles .......................................................................................................... 27
6.4 Merge/Partition Logfiles ........................................................................................ 28
6.4.1 Merge Logfiles .................................................................................................. 29
6.4.2 Partition Logfiles .............................................................................................. 29
6.4.3 KML Modification ............................................................................................ 31
6.5 Re-decode Logfiles ................................................................................................... 31
6.6 Bookmark .................................................................................................................. 32
6.7 Keyword Query ........................................................................................................ 32
6.8 Generate Filtered Logfiles ....................................................................................... 35
6.9 GPS Trajectory Compensation ............................................................................... 36
7 Replay Logfiles ..................................................................................................................... 38
7.1 Copy Logfiles ............................................................................................................ 39
7.2 Synchronize Logfiles ................................................................................................ 39
7.3 Replay Logfiles without Dongle ............................................................................ 40
8 Site Database Management ................................................................................................. 41
8.1 Import Site Database ................................................................................................ 41

Contents
8.1.1 Automatic Import ............................................................................................. 41
8.1.2 Manual Import .................................................................................................. 41
8.2 Site Database Manager ............................................................................................ 43
8.2.1 Edit Cell ............................................................................................................. 44
8.2.2 Add Sites ........................................................................................................... 45
8.3 Export Site Database ................................................................................................ 45
8.4 Site Database Analysis ............................................................................................. 46
9 Map Window ........................................................................................................................ 49
9.1 Window Description ................................................................................................ 49
9.1.1 Toolbar in the Map Window .......................................................................... 49
9.1.2 Status Bar on the Map Window ..................................................................... 52
9.1.3 Sub Menus within Right-click List ................................................................. 53
9.1.4 Legend Window ............................................................................................... 54
9.2 Data Display in the Map Window ......................................................................... 57
9.2.1 Logfile Display.................................................................................................. 57
9.2.2 Site Display ....................................................................................................... 58
9.2.3 Map File Display .............................................................................................. 59
9.2.4 Add Background Maps ................................................................................... 60
9.2.5 Event Display .................................................................................................... 61
9.2.6 Layer Manager .................................................................................................. 62
9.3 Cell Settings............................................................................................................... 64
9.3.1 Display Settings ................................................................................................ 64
9.3.2 Label Settings .................................................................................................... 66
9.3.3 Cell Line Linking .............................................................................................. 67
9.3.4 Analysis Settings .............................................................................................. 69
9.4 Information Settings ................................................................................................ 71
9.4.1 Parameter Settings ........................................................................................... 72
9.4.2 Cell Settings ....................................................................................................... 73
9.5 Cell Line Linking Display ....................................................................................... 75

Contents
10 Message Window ......................................................................................................... 80
10.1 Opening the Message Window .............................................................................. 80
10.2 Functional Buttons ................................................................................................... 81
10.2.1 Search ................................................................................................................. 82
10.2.2 Filter ................................................................................................................... 82
10.2.3 Bookmark .......................................................................................................... 83
10.3 Right-click Menu ...................................................................................................... 84
10.4 Message Details ........................................................................................................ 86
11 Event List Window ...................................................................................................... 89
11.1 Opening the Event List Window ........................................................................... 89
11.2 Functional Buttons ................................................................................................... 89
11.2.1 Search ................................................................................................................. 90
11.2.2 Filter ................................................................................................................... 91
11.2.3 Abnormal Events .............................................................................................. 91
11.3 Right-click Menu ...................................................................................................... 92
11.4 Event Details ............................................................................................................. 92
12 Line Chart Window ..................................................................................................... 94
12.1 Operations in the Line Chart Window .................................................................. 95
12.1.1 Create a Line Chart Window .......................................................................... 95
12.1.2 Open a Line Chart Window ............................................................................ 95
12.2 Functions ................................................................................................................... 96
12.2.1 Property Settings .............................................................................................. 96
12.2.2 Parameter Settings ........................................................................................... 97
13 Bar Chart Window ..................................................................................................... 100
13.1 Create a Bar Chart Window .................................................................................. 100
13.2 Parameter Settings ................................................................................................. 102
13.3 Parameter Display .................................................................................................. 103
14 Table Window ............................................................................................................ 105
14.1 Create a Table Window ......................................................................................... 105

Contents
14.1.1 Edit a Column ................................................................................................. 107
14.1.2 Edit a Cell ........................................................................................................ 108
14.2 Window Display .................................................................................................... 109
15 Other Windows .......................................................................................................... 110
15.1 MOS .......................................................................................................................... 110
15.2 Video ........................................................................................................................ 111
15.3 Data .......................................................................................................................... 113
15.4 GPS ........................................................................................................................... 114
15.5 Statistics ................................................................................................................... 115
15.6 Adjust Image ........................................................................................................... 116
16 Configuration .............................................................................................................. 121
16.1 Parameter Settings ................................................................................................. 121
16.2 Message Settings .................................................................................................... 122
16.3 Event Settings ......................................................................................................... 123
16.4 Custom Parameter Management ......................................................................... 124
16.5 Custom Event Manager ......................................................................................... 126
17 Statistics Reports ........................................................................................................ 133
17.1 Open the Statistics Report Window..................................................................... 133
17.2 Select a Report Template ....................................................................................... 134
17.3 Select Statistics Data Files...................................................................................... 135
17.3.1 Load Data Files ............................................................................................... 136
17.3.2 Configure Data Files for Statistics ................................................................ 139
17.4 Generate Statistics Reports.................................................................................... 139
17.5 Custom Report ........................................................................................................ 141
18 Analysis ....................................................................................................................... 143
18.1 Data Insight ............................................................................................................. 143
18.2 Measurement over Distance Analysis ................................................................. 147
18.3 Parameter Quadrant Analysis .............................................................................. 152
18.4 Overshooting Analysis .......................................................................................... 154

Contents
18.5 Extended Coverage Analysis ................................................................................ 157
18.6 Coverage Rate Analysis ......................................................................................... 160
18.7 Overlapping Coverage Analysis .......................................................................... 163
18.8 Antenna Feeder Reversed Analysis ..................................................................... 167
18.9 MOD3 Analysis ...................................................................................................... 170
18.10 Pilot Pollution Anlaysis ......................................................................................... 173
18.11 Cell Coverage Analysis ......................................................................................... 177
18.12 Cell Statistics and Analysis ................................................................................... 183
18.13 MO/MT Union Analysis ....................................................................................... 187
18.14 CSFB Exception Analysis ...................................................................................... 190
18.15 Delay Analysis ........................................................................................................ 191
19 Data Filtering .............................................................................................................. 196
19.1 Filter Management ................................................................................................. 196
19.1.1 Add a Filter ..................................................................................................... 196
19.1.2 Edit/Delete a Filter ........................................................................................ 198
19.2 Condition Types ..................................................................................................... 199
19.2.1 Parameter ........................................................................................................ 199
19.2.2 Time .................................................................................................................. 201
19.2.3 Region .............................................................................................................. 202
19.2.4 State .................................................................................................................. 204
19.2.5 Condition Range ............................................................................................. 209
19.2.6 Service .............................................................................................................. 210
19.2.7 Combination ................................................................................................... 211
19.3 Logical Operators ................................................................................................... 213
19.4 Use Filters ................................................................................................................ 215
20 Data Binning ............................................................................................................... 218
20.1 Overview ................................................................................................................. 218
20.2 Define Data Binning Template ............................................................................. 218
20.3 Data Binning ........................................................................................................... 219
Contents
20.3.1 Data Binning in the Map Window ............................................................... 219
20.3.2 Data Binning in the Table Window ............................................................. 221
20.3.3 Data Binning in the Statistics Window ........................................................ 222
21 Product Disclaimer..................................................................................................... 224

What's New
1 © Dingli 17-06-2016 DL11100UM
1 What's New
1.1 New Features
1.1.1 GPS Compensation with Inertial Navigation
System
This is a data analysis feature which is used to conduct GPS compensation or adjustment when the
GPS signal is very poor or blocked.
Figure 1-1 GPS trajectory compensation

What's New
2 © Dingli 17-06-2016 DL11100UM
1.1.2 Export Map Layers
Users may export the selected cell sites, test routes and cell line linkings to the Mapinfo, Google
Earth and Shape file formats, which can be reused in other tools or platforms.
Figure 1-2 Export map layers

What's New
3 © Dingli 17-06-2016 DL11100UM
1.1.3 Cell Site Coverage Map
Users may select a cell or site to display its coverage plots and the lines to serving cell for relevant
analysis. Users may select to display only the GPS route or measurement route with GPS
positioning (with user-defined colors).
Figure 1-3 Cell site coverage map
1.1.4 Unified Display Color for BCCH/PSC/PCI
Coverage Routes and Serving Cell
The BCCH/PSC/PCI coverage routes and corresponding serving cell can be the displayed with the
same color, which facilitates a simple and direct view of the cell coverage for users.

What's New
4 © Dingli 17-06-2016 DL11100UM
Figure 1-4 Unified display color for BCCH/PSC/PCI coverage routes and serving cell
1.2 New Reports
1.2.1 LTE Data Service Report (CA)
LTE Data Service Report (CA) is supported with data service tests (when CA is activated), for
statistics generation on throughput, handover, interference, resource scheduling, etc.
Note: CA indicates Carrier Aggregation.
Figure 1-5 LTE Data Service Report (CA)

What's New
5 © Dingli 17-06-2016 DL11100UM
1.2.2 New Data Service Reports
New data service reports, including DNS Lookup Report, PBM Report, and VideoPlay Report are
added to the Data Service Reports.
Figure 1-6 New data service reports
1.2.3 4G Benchmarking Report
4G Benchmarking Report is used to conduct LTE KPIs comparison with other mobile network
operators. In addition, the test service details of the reference operator are supported in the report.
Figure 1-7 4G Benchmarking Report

What's New
6 © Dingli 17-06-2016 DL11100UM
Figure 1-8 Service details
1.2.4 VoLTE Report
VoLTE Report is supported for VoLTE service tests in this version. The statistics results include
KPIs and parameters during the VoLTE service test process, e.g. Session, SIP, RTP, RRC,
handover.
Figure 1-9 VoLTE Report

Overview
7 © Dingli 17-06-2016 DL11100UM
2 Overview
2.1 Introduction to Pilot Pioneer
Pilot Pioneer Expert is a dedicated data analysis and reporting solution supporting
GSM/CDMA/WCDMA/TD-SCDMA/ LTE network technologies. It is an optional post-processing
module that can be offered together with Pilot Pioneer or as a standalone product. Pilot Pioneer
Expert powerful data processing and analysis capability helps to accelerate network performance
and Quality of Service (QoS) evaluation. The integrated data presentation options, analysis
methods, and statistical reports help to locate potential network problems, for necessary action on
the network tuning and optimization activities. Pilot Pioneer Expert supports large volume data
processing, various analysis functions, user-defined KPIs, and filtering functions to allow flexible
data analysis.
2.2 Operating System
Windows 10 (32/64-bit)/Windows 8 (32/64-bit) /Windows 7 (32/64-bit) is required.
2.3 Required Configuration
The required configuration is as below:
CPU: Pentium 1.8 GHz
Memory: 1.00 GB
Display: VGA
Resolution: 800*600
Hard Disk: 50 GB or more of free space
2.4 Recommended Configuration
The recommended configuration is as below:
CPU: Intel ® Core™ i5
Memory: 2.00 GB
Display: SVGA; Color quality must be 16 bit or higher
Resolution: 1366*768
Hard Disk: 100 GB or more of free space

Main Interface
8 © Dingli 17-06-2016 DL11100UM
3 Main Interface The main interface includes all the functions of Pilot Pioneer Expert. On this main interface, users
can open functional windows accordingly. The main interface includes Navigation Pane, Menu
Bar, Toolbar, Workspace, and status bar, etc. See the following figure:
3.1 Navigation Pane
The navigation pane is located on the left side of the main interface, including Data, Param,
Event, Layer, Report, Analysis, and Filter. Users may manage interface display, data files, site
database, devices, test templates, test plans, maps, events, parameters, report, analysis, etc. within
this pane.
1. The Data tab consists of Data List and Network.
Data List: to display imported data files.
Network: to display the network technology corresponding to the selected data file and
related information.
Menu bar Workspace Toolbar
Navigation bar
Status
Title bar

Main Interface
9 © Dingli 17-06-2016 DL11100UM
2. The Param tab displays the corresponding network technology of the selected data file and
general parameters. Users may search parameters based on keywords.
3. The Event tab displays the events or test service of the selected data file. Users may search
events based on keywords.
4. The Layer tab consists of Geo Maps, Indoor Map, and Sites.
Geo Maps: to add and delete map files (formats: MapInfo, PNG, Terrain, Auto CAD,
USGS, ArcInfo, KML, ZDF)
Indoor Map: to import, add, and update floor information files of indoor tests.
Sites: to display imported site database information.
5. The Report tab consists of Report and Statistics.
Report: to display supported report types
Statistics Result: to display the recently generated statistics report, which can be directly
opened.
6. The Analysis tab displays the supported analysis functions and generated analysis results.
7. The Filter tab consists of Filter and Bin Template.
Filter: to display supported Filter types, where users may configure conditions for data
filtering as required.
Bin Template: to configure and display Bin templates
3.2 Menu Bar
The Menu Bar is located at the top right corner of the main interface where it integrates various
functions. The Menu bar contains File, Language, Configuration, Tool, and Help.
3.2.1 File
The File menu contains options related to Project, data import, and export. See the figure below:
Figure 3-1 File menu

Main Interface
10 © Dingli 17-06-2016 DL11100UM
The following table describes the detailed list:
Table 1 File
Function Names Description
New Project Create a new project
Open Project Open a saved project
Save Project Save the current project
Save Project As Save the current project as
Import Logfile Import logfiles through general/advanced
methods, or import logfiles by directory.
Export Logfile Export the logfiles in the software
3.2.2 Language
The Language menu is used to configure the display Language. Only English and simplified
Chinese is supported.
3.2.3 Configuration
The Configuration menu mainly contains options for windows configuration and management.
Figure 3-2 Configuration menu
The following table describes the detailed list:

Main Interface
11 © Dingli 17-06-2016 DL11100UM
Table 2 Configuration
Function Name Description
Parameter Settings Settings for all the parameters and threshold on Map window
Message Settings Settings for all the messages
Event Settings Settings for all the events
Interface Manager Settings for graph, chart, status window and special window
Save Position As Default Save the size and position of each window in workspace as
default configuration.
Custom Parameter Manager Settings for customized parameters
Custom Event Manager Settings for customized events
MOS Settings Settings for MOS test, which may be effective to the wave
form of the voice file and MOS score.
Option Manager Settings for Test Record and Data Process
3.2.4 Tools
The Tools menu mainly contains relevant operations for tools in Pilot Pioneer Expert.
Figure 3-3 Tools Menu
The following table describes the detailed list:

Main Interface
12 © Dingli 17-06-2016 DL11100UM
Function Name Description
Merge/Partition Logfiles Configuration window for merging/partitioning logfiles
Adjust Image Create coordinate information for loaded pictures and
generated *.tab files
GPS Trajectory Compensation Conduct GPS compensation for the test route when the GPS
signal is very poor or blocked.
Indoor Test Manager Manage indoor test logfiles, including import, export, and
delete logfiles
Report Task Monitor Settings for monitoring the progress and completion of each
statistics report task.
Keywords Query Search messages, message details, events, sites, or parameters
based on keywords or parameter ranges
Download From Fleet Server Download logfiles from Pilot Fleet Unify server
3.2.5 Help
The Help menu mainly contains online bug feedback, version update, and Pilot Pioneer Expert
version information.
Figure 3-4 Help Menu
Function Name Description
Feedback Support online software bug feedback
Check Version Support online software version update

Main Interface
13 © Dingli 17-06-2016 DL11100UM
Function Name Description
About Pioneer Support software information query, including version
number, supported network technologies, soft dongle.
3.3 Tool Bar
The Tool bar consists of shortcut buttons that are arranged by certain rules or sequences for the
common functions in the Menu bar. Users may click the drop-down arrow on the menu bar to set
the buttons displayed on the tool bar.
Figure 3-5 Default Tool Bar
Figure 3-6 All buttons in the tool bar
The following table describes the detailed list:
Table 3 Buttons on the tool bar
Icon Functional
Name
Shortcut Description
New Project Ctrl+N Create a project
Open Project None Open a project
Save Project Ctrl+S Save the current project
Scene Manager None Settings for saving, deleting scenes, and display
Scene None Open saved scenes
Import Logfile
None Import logfiles through conventional or advanced
methods
Export Logfile None Export logfiles in the software

Main Interface
14 © Dingli 17-06-2016 DL11100UM
Icon Functional
Name
Shortcut Description
Set Playback
Data
None Start data replay
Reverse None Replay backwards
Previous point None Step backward
Pause None Stop replaying for a short time
Next Point None Step forward
Forward None Play forward
Copy Logfile
None Copy part of the log file from the specified starting point
to specified ending point
Close All
windows ALT+X Close all windows
Screen Shot ALT+P Conduct screen shot
Freeze All None Freeze all windows
3.4 Title Bar
The Title bar is used to display the selected data under the data list.
Figure 3-7 Title bar
3.5 Workspace
The Workspace is used for various windows displays. When a user creates a new project, one
workspace is displayed by default. When a saved project is opened, all saved workspaces will be
displayed.

Main Interface
15 © Dingli 17-06-2016 DL11100UM
3.6 Status Bar
The status bar is located at the bottom of the main interface, and is used to display information
related to the current operation. Currently, the data decoding progress, statistics report processing
progress, and the current task count can be displayed on the status bar. By default, the status bar is
not displayed. Users may click the status bar to enter the progress window during data decoding,
or enter the Report Task Monitor during statistics report generation.
Figure 3-8 Status bar
Project Management
16 © Dingli 17-06-2016 DL11100UM
4 Project Management Project is the basic unit for data management and maintenance in Pilot Pioneer Expert. The
external devices, test plan, test data, site database, and the workspaces can be saved as projects.
Once a saved project is opened, all relevant information will be loaded automatically.
Users may create projects as required. The projects can be classified by region, operator, etc. For
example, users may create a project based on an independent region, such as BSC, MSC region, or
a city, or create a project based on the operators within a certain region.
The detailed information that will be saved to a project include:
Configurations related to the project
Adding, modifying or deleting external devices
Modifying or deleting test plans
Adding or deleting logfiles
Adding, modifying or deleting site database
Configuration or moving of all windows displayed in the workspace
4.1 New Project
Pilot Pioneer Expert runs based on projects. Therefore, a new project must be created before users
can perform operations within a Project.
Follow the instructions below to create a new project:
1. Choose one of the methods below to display the New Project dialog box:
Pilot Pioneer Expert will display the New Project dialog box by default whenever users
launch the Pilot Pioneer Expert application. On the Menu bar, choose File > New Project
to display the dialog box. The shortcut keys are "Ctrl + N".
On the Tool bar, click the New project button to display the dialog box.
2. Select a project type, select Show Project Wizard, and click OK. The Project Wizard will
facilitate users to complete the new project creation.
Users may set the information about storage and scene during test through the Project
Wizard.
Users may create a new project for LTE test in a very convenient way.
Users may directly open the recently saved project through the Project Wizard.

Project Management
17 © Dingli 17-06-2016 DL11100UM
Figure 4-1 New Project dialog box
Figure 4-2 Project Wizard (Data storage configuration)

Project Management
18 © Dingli 17-06-2016 DL11100UM
Figure 4-3 Project Wizard (Scene configuration)
4.2 Open Project
Users may open a saved or similar project to avoid repetitive configuration.
On the Menu bar, choose File > Open Project to open a project.
4.3 Recent Project
Reopen Project is used to quickly open a project. There will be saved and recent projects in the
list.
On the Menu bar, click the drop-down arrow besides the New/Open Project button on the tool bar
and select a project to open from the list.
Figure 4-4 Open a recent project

Project Management
19 © Dingli 17-06-2016 DL11100UM
4.4 Save Project
Project may be saved in the *.dlp format in the specified path. The project can be imported
directly to avoid repetitive configuration.
To save a project, do as follows:
Method 1: On the Menu bar, choose File > Save Project. The short cut keys are "Ctrl+S".
Method 2: On the Tool bar, click the Save Project button.
If the project is being saved for the first time, a dialog box for setting the project name and
storage path will be displayed.
If the project has been saved before, Pilot Pioneer Expert will directly save the project in
the original path.
4.5 Save Project As
Users may save the current project with a new project name and a new storage path.
On the Menu bar, choose File > Save Project As, set the storage path and project name, and click
Save.
4.6 Close Project
Click the close button on the main interface, close the current project, and exit Pilot Pioneer
Expert.

Scene Manager
20 © Dingli 17-06-2016 DL11100UM
5 Scene Manager Scene Manager is used to manage the window type and positioning in the workspace. For each
scene's file, users may delete or upload the workspace or device as required. Workspace includes
the windows opened in the workspace and the positioning. Device includes the configured device
and its test plans.
Switching scenes is an easy way to change device and windows on the workspace. In such
scenarios, it would not affect current logfiles and site database.
To open Scene Manager, do as follow:
Method 1: On the Tool bar, click the Scene Manager icon.
Method 2: Click the drop-down arrow beside the Scene Manager icon to switch scenes directly.
Figure 5-1 Scene Manager
The functions supported by Scene Manager are as follows:
Save scenes under any status. The current external devices, test plan, workspace can be
saved.
Set display content as required: Device, Workspace, Device, and Workspace.
Click Load to load the scene or click the drop-down arrow beside the Scene Manager icon
to switch scenes directly. Switching operation can only apply to workspace during testing.
Supports repetitive load of the same scene.
Scene Manager
21 © Dingli 17-06-2016 DL11100UM
Save and upload scene for single workspace and multiple workspaces.
Load another workspace without influence on the current workspace.
Delete a scene.

Log File Management
22 © Dingli 17-06-2016 DL11100UM
6 Log File Management Pilot Pioneer Expert provides log file management, which helps users with analysis and
processing of data collected by Pilot Pioneer, Pilot RCU, and so on.
Log file Management supports the following functions:
Import multiple logfiles simultaneously for multiple network standards
Export logfiles
Delete logfiles
Re-decode logfiles
Merge and partition logfiles
6.1 Import Logfiles
Choose one of the following methods to import logfiles:
Method 1: On the Menu bar, choose File > Import Logfile. The short cut keys are "Ctrl+O".
Method 2: On the tool bar, click the Import Logfile icon ( ).
Method 3: In the navigation pane, click Data, and then click the icon.
Method 4: Directly drag the logfile to the Data List pane.
Method 5: Double click a local logfile to automatically start Pilot Pioneer Expert and import the
logfile.
The imported logfiles will be automatically listed under Data List.
6.2 Export Logfiles
Users may select and export logfiles in a specified format and path.
To export logfiles, do as follows:
1. Enter the Export Logfile window by using one of the following methods:
On the Menu bar, choose File > Export Logfile.
On the tool bar, click the Export Logfile icon ( ).
Select a logfile on the Data List pane, and right-click it to select Export Logfile.

Log File Management
23 © Dingli 17-06-2016 DL11100UM
Figure 6-1 Export Logfile window
2. Click Add or Delete to add or delete logfiles as required.
3. Click Template Manager and Settings to perform configuration for log file export.
Template Manager: display the current template for export
Settings: set information for generating and modifying the template
4. Click Export after setting the template. In the dialog box that is displayed, set the path for
saving the logfiles. Users do not need to set the file name as the file name is automatically
generated.

Log File Management
24 © Dingli 17-06-2016 DL11100UM
Figure 6-2 Setting log file storage path
5. Click Select Folder to begin exporting the logfiles.
Figure 6-3 Begin to export logfiles
The figure below shows the Template Settings page:

Log File Management
25 © Dingli 17-06-2016 DL11100UM
Figure 6-4 Template Settings page
The following figure shows the Advanced Setitngs page:
Figure 6-5 Advanced Settings page
Export Logfile supports the following functions:
Creating and saving templates for future use
Exporting logfiles based on user-defined parameters, events, and messages

Log File Management
26 © Dingli 17-06-2016 DL11100UM
Exporting logfiles filtered by parameter, time, region, state, and mixed conditions
Exporting event and message details, and handset messages and original code
Exporting logfiles to the *.CSV, *.TXT, *.MDM, *.CTI, *.DCF, ASPS, and *.DLlog
formats
The following table describes the functional buttons in the Export Logfile page:
Table 4 Functional buttons in the Export Logfile page
Button Description
Export Logfile
Template Manager Set template name. The template will be automatically named as
LastTemplate if users did not name the template.
Settings Set the export template.
Template Settings
Parameters Select parameters to be exported.
Events Select events to be exported.
Messages Select messages to be exported.
Format
Select export log file formats. Options: TXT, CSV, MDM, CTI,
ASPS, DCF, ACCESS (*.asc), DTLog (*.lte), DTLog (*.lot),
DTLog (*.log), DTLog (*.log), DLF, and CU
Filter Manager Select a configured filtering template, and click "…" icon to edit
the template.
Export as separate
files
Separate logfiles based on device if logfiles of multiple devices are
saved as one log file.
Advanced Setting information about Package Range, Sample Options,
Handset messages, events, and scanner.
Advanced Settings
Package Range Set the range of data package.
Start The start time of data package.
End The end time of data package.
Sample Options Select a sample mode for export.
Event Details Export event details when events are selected.

Log File Management
27 © Dingli 17-06-2016 DL11100UM
Button Description
Message Details Export message details when messages are selected.
Original Code Export the original code of Layer 3 messages.
UE Messages Export messages except for Layer 3 messages, that is Layer 1 and 2
messages.
Serving Cell Name Index the identified serving cell names based on the imported site
information.
Logfile Name Export logfile name included in specific data.
Timestamp Export timestamp.
Scanner Export Scanner data. Users may set different parameters to export
for each network technology.
Struct Select data type under Struct to export.
Cell List Select the type of cells to export.
6.3 Delete Logfiles
Users may select logfiles to delete under Data List, and click the Delete icon ( ) to delete the
selected logfiles. See the figure below:
Figure 6-6 Select file window

Log File Management
28 © Dingli 17-06-2016 DL11100UM
6.4 Merge/Partition Logfiles
Pilot Pioneer Expert supports merging and partitioning logfiles.
On the Menu bar, choose Tools > Merge/Partition Logfiles to enter the Merge/ Partition
Logfiles window.
Figure 6-7 Merge/ Partition Logfiles window
Merge/Divide Logfile supports the following functions:
Add and delete logfiles.
Move logfiles up and down. The order of merged logfiles is the same as the current logfile
order.
Support KML modification
Define a directory to save the merged or divided logfiles.
Name Description
Network Select a network to filter data files.
Device ID Select a device ID to filter data files.
Import Logfile Import logfiles.

Log File Management
29 © Dingli 17-06-2016 DL11100UM
Name Description
Select All Select all logfiles.
Delete Delete selected logfiles.
Delete All Delete all logfiles.
Up Move logfiles up.
Down Move logfiles down.
Merge Merge logfiles.
Partition Partition logfiles
KML Modification Enable KML Modification function. For details, see
section 6.4.3.
Target Folder Define a directory to save the merged or divided
logfiles.
6.4.1 Merge Logfiles
Pilot Pioneer Expert may merge two or more logfiles into one logfile.
To merge logfiles, do as follows:
1. Click Import Logfile to add logfiles that need to be merged.
2. Select logfiles to be merged in the Merge/Partition Logfiles window.
3. Select a directory to save the merged logfile.
4. Click Merge.
Merge Logfiles supports the following functions:
Merge two or more *.rcu logfiles.
Merge logfiles collected by the same device, technology, and port.
Merge multiple groups of logfiles collected by same device, technology, and port.
6.4.2 Partition Logfiles
Pilot Pioneer Expert may partition a logfile to several logfiles.
To partition a logfile, do as follows:
1. Click Import Logfile to add logfiles that need to be partitioned.
2. Select logfiles to be partitioned in the Merge/ Partition Logfiles window.
3. Click Partition to enter the Partition Logfile window.

Log File Management
30 © Dingli 17-06-2016 DL11100UM
Figure 6-8 Partition logfiles window
4. Select partition conditions.
5. Click OK. The partitioned files are saved in the user-defined path.
Partition Logfile supports the following functions:
Partition one logfile or multiple *.rcu or *.ddib logfiles.
Mixed partition: Partition logfiles based on device port, time, and region.
Name Description
Divide Into Partition the logfile (s) according to the
user-defined quantity. The minimum number is 2.
Log File Management
31 © Dingli 17-06-2016 DL11100UM
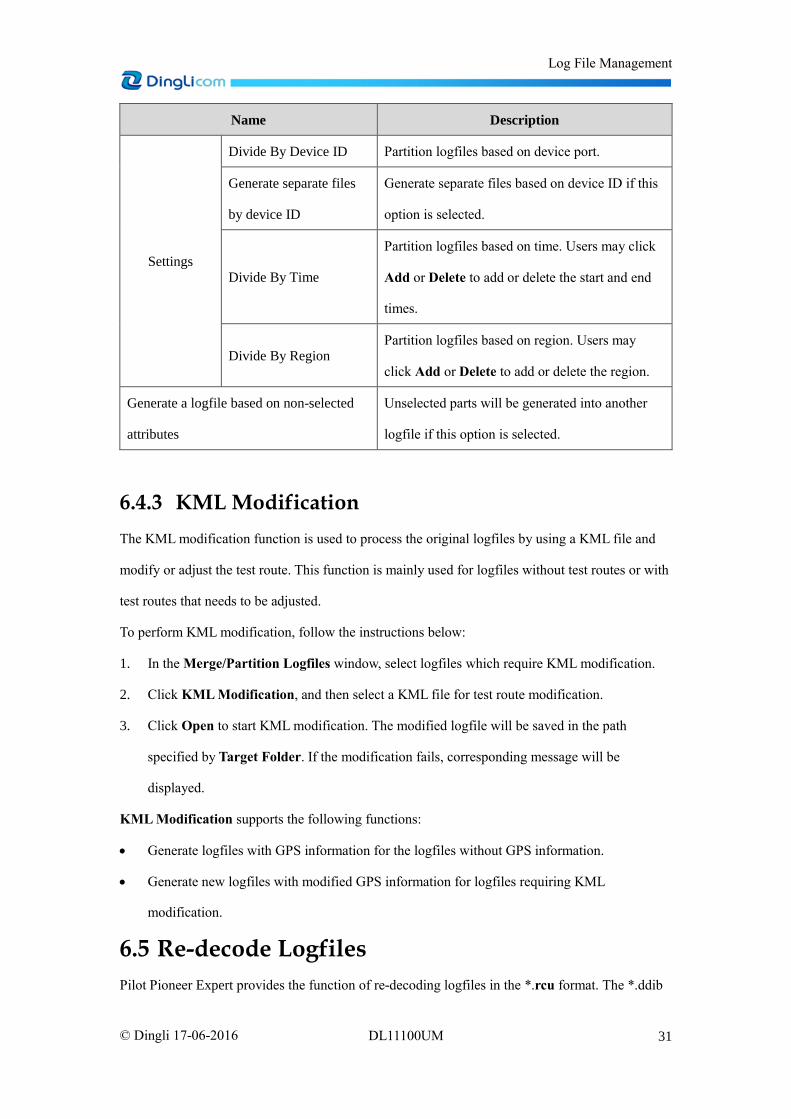
Name Description
Settings
Divide By Device ID Partition logfiles based on device port.
Generate separate files
by device ID
Generate separate files based on device ID if this
option is selected.
Divide By Time
Partition logfiles based on time. Users may click
Add or Delete to add or delete the start and end
times.
Divide By Region Partition logfiles based on region. Users may
click Add or Delete to add or delete the region.
Generate a logfile based on non-selected
attributes
Unselected parts will be generated into another
logfile if this option is selected.
6.4.3 KML Modification
The KML modification function is used to process the original logfiles by using a KML file and
modify or adjust the test route. This function is mainly used for logfiles without test routes or with
test routes that needs to be adjusted.
To perform KML modification, follow the instructions below:
1. In the Merge/Partition Logfiles window, select logfiles which require KML modification.
2. Click KML Modification, and then select a KML file for test route modification.
3. Click Open to start KML modification. The modified logfile will be saved in the path
specified by Target Folder. If the modification fails, corresponding message will be
displayed.
KML Modification supports the following functions:
Generate logfiles with GPS information for the logfiles without GPS information.
Generate new logfiles with modified GPS information for logfiles requiring KML
modification.
6.5 Re-decode Logfiles
Pilot Pioneer Expert provides the function of re-decoding logfiles in the *.rcu format. The *.ddib

Log File Management
32 © Dingli 17-06-2016 DL11100UM
logfiles do not need data re-decoding.
Right-click a logfile under Data List to re-decode. The decoding progress will be displayed in the
status bar. Users may select multiple logfiles to re-decode.
6.6 Bookmark
Bookmark is used to add user comments to logfiles during test or data replay.
Right click a logfile under Data List, and select Bookmark to enter the Bookmark window.
Figure 6-9 Bookmark window
The features related to Bookmark are as follows:
This function can be used during test and data replay.
Users may select sampling points and add bookmarks.
Users may delete bookmarks as required.
6.7 Keyword Query
This function is used to query messages, message details, events, sites, and parameters with
keywords. Users may double-click the queried results to display them in the related windows.
The following is an example for message query:
1. Choose Tools > Keyword Query to enter the Keyword Query window.
2. Click , select a logfile and message type for Message Search Type in the dialog box
that is displayed, and then click OK. See the figure below:

Log File Management
33 © Dingli 17-06-2016 DL11100UM
Figure 6-10 Select file
3. Enter keywords in the search box and select Message. See the figure below:
Figure 6-11 Enter keywords and select search type

Log File Management
34 © Dingli 17-06-2016 DL11100UM
Users may conduct different types of queries simultaneously. For example, users may select
Message and Message Detail simultaneously. See the figure below:
Figure 6-12 Enter keywords and select search type
For a parameter query, users may select Parameter, set parameter search conditions in the Edit
Parameter dialog box that is displayed, and then click OK. See the figure below:

Log File Management
35 © Dingli 17-06-2016 DL11100UM
Figure 6-13 Parameter editing dialog box
6.8 Generate Filtered Logfiles
Follow the instructions below to generate a filtered logfile:
1. After setting a filter (see section Filter), users may click the icon corresponding to the
filter to enter the Generate Filtered Logfiles window.

Log File Management
36 © Dingli 17-06-2016 DL11100UM
Figure 6-14 Generate filtered logfiles
2. Click Project Files or Add to import data files from the Project or from the local disk.
3. Click the icon besides Filter Name to edit the filtering conditions.
4. Click Generate to generate a filtered logfile, which will be loaded to the Data List under
Data.
6.9 GPS Trajectory Compensation
GPS Trajectory compensation technology is used to conduct GPS compensation or adjustment
when the GPS signal is very poor or blocked, which is commonly caused by high-speed
movement or too many obstructions. This is a data analysis feature.
1. On the Menu bar, choose Tool > GPS Trajectory Compensation to enter the
corresponding window.
2. Click the icon besides Data List to add logfiles that requires GPS Trajectory
Compensation.
3. Click the icon besides Compensation Path to add a GPS path compensation file.
4. Click Implement to conduct compensation or adjustment.
The data with GPS trajectory compensation is saved to the same path of the original logfile.

Log File Management
37 © Dingli 17-06-2016 DL11100UM
Figure 6-15 GPS Trajectory Compensation
Figure 6-16 GPS test route after compensation

Replay Logfiles
38 © Dingli 17-06-2016 DL11100UM
7 Replay Logfiles The Replay function may recreate the drive test scene, and supports information synchronization
in all windows. This helps engineers to analyze and detect problems. Pilot Pioneer Expert supports
forward/backward log file replay at any speed and location. For the information about the replay
icon and function on the toolbar, please see section 3.3.
To replay logfiles, do as follows:
1. Select an imported logfile, and open a window (e.g. Message or Table) as required.
Alternatively, users may open a Scene window and Pilot Pioneer Expert will automatically
load the selected logfile to the windows.
2. Click the Set Playback Data button ( ) on the toolbar to enter the replay mode.
Logfile Replay supports the following functions:
Supports log file play, rewind, step forward or backward, and pause functions
Supports user-defined speed by sliding the button
Supports user-defined position synchronization in all associated windows by sliding the
button. When users slide the Position button, the information displayed in all windows is
synchronized based on the position. When users select any content in the windows, the
Position will be synchronized accordingly.
The current log file name and replay progress are displayed on the status bar.
Figure 7-1 Data replay

Replay Logfiles
39 © Dingli 17-06-2016 DL11100UM
7.1 Copy Logfiles
After selecting a log file to replay, users may copy the section by selecting a start point and end
point to generate a new log file.
The methods to copy logfiles are as follows:
Method 1:
1. On the Toolbar, slide the Position button to select the start point and then click the Copy
Data icon ( ).
2. Slide the Position button to select the end point and then click the Copy Data icon ( ).
3. In the window that is displayed, rename the file and set the file save directory for the new log
file.
Method 2:
1. Select the start point in the log file replay window or associated windows and then click the
Copy Data icon ( ) on the toolbar.
2. Select the end point in the log file replay window or associated windows, and then click the
Copy Data icon ( ) on the toolbar.
3. In the window that is displayed, rename the file and set the file save directory for the new log
file.
7.2 Synchronize Logfiles
Users may set the log file synchronization for multi-logfiles. In this case, when one log file is
replayed, the others will be replayed synchronously.
Follow the instructions below to synchronize logfiles:
1. Click the Data Relation icon ( ) on the toolbar to enter the Logfile Synchronization
window.
2. Select logfiles (at least two), and click the button to add the files to the right pane.

Replay Logfiles
40 © Dingli 17-06-2016 DL11100UM
Figure 7-2 Logfile Synchronization window
Logfile Relation supports the following functions:
Supports multi-logfiles synchronization configuration at the same time.
When one log file is replayed, all logfiles will be synchronized automatically in the
windows.
7.3 Replay Logfiles without Dongle
Pilot Pioneer Expert may be launched while the dongle is not inserted, and may play or rewind the
log file at any speed or from any position. It supports the following functions:
Re-decode data
Open the map window
Open the message window
Open the chart window

Site Database Management
41 © Dingli 17-06-2016 DL11100UM
8 Site Database Management Users may import site database files in the TXT or Excel format to the current project, to detect
cell configuration problems along with associated drive test logfiles.
8.1 Import Site Database
Multiple site database files can be imported simultaneously. There are two methods: Auto Import
and Manual Import.
8.1.1 Automatic Import
If the fields of the site database file matches completely with the fields required by the network
technology, it will be loaded to that network’s root node folder automatically.
To automatically import site database files, do as follows:
Method 1: Click Layer, right-click Site to select Import, and select site file to import.
If the site database file to be imported matches the network technology, and the fields
completely match with those required by the network technology, it will be imported
automatically.
If the site database file to be imported matches the network technology, but the fields do
not completely match with those required by the network technology, it will switch to the
manual import settings widow.
If Pilot Pioneer Expert cannot detect the network technology corresponding to the log file,
a message indicating import failure will be displayed. In this case, users need to specify the
network technology manually.
Method 2: Double click any RAT folder under Sites in the Layer Management tab page.
If the site database file to be imported completely matches with the fields required by the
network technology, it will be imported automatically.
If the site database file to be imported does not match completely with the fields required
by the network technology, it will switch to the manual import setting widow.
8.1.2 Manual Import
If the fields of the site database file do not match completely with the fields required by the
network technology, users need to import the log file manually. The imported log file will be
loaded to the network node folder automatically.
To manually import site database files, do as follows:
Method 1: Click Layer, right-click Site to select Import.
If the site database file to be imported does not match completely with the fields required
by any network technology, the Import Site File window is displayed.

Site Database Management
42 © Dingli 17-06-2016 DL11100UM
Method 2: Right-click any RAT node folder under Sites in the Layer Management tab page and
select Import.
If the site database file to be imported does not match completely with the fields required
by any network technology, the Import Site File window is displayed.
Manual Import supports the following functions:
The system default template name is Template1. After the fields are configured, users may
directly select the template from the drop down list box the next time and the configured
fields will be displayed in the template.
The field with the asterisk icon is mandatory. Users may refer to the values of the
parameters listed under Data Preview to configure the fields.
Pilot Pioneer Expert supports the import of user-defined parameters.
Multiple site database files of the same network technology may be imported
simultaneously.
If the manual import fails, the fields that do not meet the conditions will be displayed as a
log. Users may right-click and copy all the log information. See the figure below:
After the template configuration is
completed, users may set a new name
and save it for future use.

Site Database Management
43 © Dingli 17-06-2016 DL11100UM
Figure 8-1 Fields not meeting the conditions
8.2 Site Database Manager
Site Database Manager can display all site database files that have been imported, and can
execute commands including Search, Add, Edit, Delete, Import, Export, etc.
The methods for opening Site Database Manager are as follows:
Method 1: Click Layer, right-click Site and select Site Database Manager.
Method 2: Click Layer, right-click a network node under Site and select Site Database Manager.
Method 3: Click Layer, click a network node, and right-click a site database file to select Site
Database Manager.

Site Database Management
44 © Dingli 17-06-2016 DL11100UM
Figure 8-2 Site Database Manager window
The following table describes the functional buttons in the sites database manager window:
Figure 8-3 Functional buttons in the sites database manager window
Name Description
Search Search all sites of a specified network based on the site name.
Import Supports automatic and manual imports.
Export Export the specified site or site database file.
Edit Edit the site or cell information.
Add Site Add a site to the specified site database.
Delete Delete the specified site database file, site, or cell.
Set Column Show the information of the selected column.
8.2.1 Edit Cell
Users may click Edit to modify cell information and add or delete cells.
The methods of entering the Edit Cell window are as follows:
Method 1: On the Site Database Manager window, select the site that needs to be edited and

Site Database Management
45 © Dingli 17-06-2016 DL11100UM
click Edit.
Method 2: On the Site Database Manager window, double click the site name under Sites.
Method 3: On the Site Database Manager window, double click the specified cell information.
Method 4: On the Site Database Manager window, right-click the specified row and select Edit.
Figure 8-4 Edit Cell window
Edit Cell supports the following functions:
The field with the asterisk icon is mandatory.
Double click the cell under the Value column to modify the value.
Add a new cell by creating a new tab page.
Delete a cell by deleting the corresponding tab page.
8.2.2 Add Sites
The methods of adding sites in the Site Database Manager window are as follows:
Method 1: Select a site database name, and click Add Site.
Method 2: Select a site database under Sites, and right-click it to select Add Site.
The Add Site window and the editing cell window are the same. Please see section 8.2.1.
8.3 Export Site Database
Site database/site can be exported and saved as a new file for users to check the site information in

Site Database Management
46 © Dingli 17-06-2016 DL11100UM
the future.
The methods of exporting site databases are as follows:
Method 1: On the navigation pane, select and right-click a site database or site that needs to be
exported, and then select Export.
Method 2: On the Site Database Manager window, select a site database under Sites and click
Export.
Note: If no site is displayed under Site, users may click Export to export a blank site database
template to edit and then import it to the software.
8.4 Site Database Analysis
Site Database Analysis is used to conduct relevant analysis for cell site database which have been
imported to Pilot Pioneer Expert, including
One-way Neighbor Cell Analysis
Isolated Cell Analysis
Cell Analysis with Same Frequency and Scrambling Code (for network technologies
except for GSM)
Cell Analysis with Same Frequency and Scrambling Code Group (FOR TD-SCDMA and
LTE)
Same Frequency Number and SYNC-DL ID Cell Analysis (for TD-SCDMA)
The methods of entering the Site Database Analysis window are as follows:
Method 1: On the navigation pane, Click Layer, right-click Sites and select Site base Analysis.
Method 2: On the navigation pane, Click Layer, right-click each network technology under Sites
and select Site base Analysis.
Method 3: On the navigation pane, Click Layer, right-click a site database of each network
technology under Sites and select Site base Analysis.

Site Database Management
47 © Dingli 17-06-2016 DL11100UM
Figure 8-5 Site Analysis Settings
Select a site database under Site Data for analysis, define analysis conditions under Analysis
Settings, and then click Analyze. The figure below shows the result after Site database analysis:

Site Database Management
48 © Dingli 17-06-2016 DL11100UM
Figure 8-6 Site database analysis results
The supported functions are as below:
The generated analysis results are displayed based on cell site under the Site Analysis
node on the Analysis tab page.
The results can be synchronized to the Table and Map windows.
Users may right-click in the Table window and select Export all analysis result to export
the analysis results.
Users may right-click in the Table window and select Map display configuration to set
the cell site display color at the Map window.
Users may right-click the analysis result and select Delete to delete it.

Map Window
49 © Dingli 17-06-2016 DL11100UM
9 Map Window The Map window is used to display the drive test route and geographic environment information
in the test region including parameters, site database, events, and all related geographic
information.
9.1 Window Description
This section provides a short description of the Toolbar, Status Bar, and functions by right clicking
any place in the Map window.
Figure 9-1 Map window
9.1.1 Toolbar in the Map Window
The following table describes the buttons on the toolbar:
Table 5 Functional buttons on the toolbar
Icon Name Description
Open Map Layer Add the selected map into the Map Window.
Google Maps Display Google map in the Map window.
Google Satellite Display Google satellite map in the Map window.

Map Window
50 © Dingli 17-06-2016 DL11100UM
Icon Name Description
Bing Maps Display Bing map in the Map window.
Baidu Maps Display Baidu map in the Map window.
None Gray
Background
Render the background map in grey to highlight the test
route.
None Proxy Settings Set proxy server to open Google map, Google Satellite map,
and Bing map.
Google Earth Switch to Google Earth map to check test routes.
Cell Settings Settings for cell display, cell line linking, and neighbor cells.
Layer Control Display/hide map layer, layer priority setting for parameters.
Select/Move Select a test point in the testing route and then the log file
information will be synchronized into other windows.
Rectangular
Tool Display the cell line linking for the selected rectangle area.
Circular Tool Display cell line linking for the selected circle area.
Polygon Tool Display cell line linking for the selected polygon area.
None Define Region Define a region as required.
None Import Region Import a region as required.
None Export Region Export a region as required.
Clear Region Clear defined regions.
Zoom in Zoom in on the displayed item in the Map window.
Zoom out Zoom out of the displayed item in the Map window.
Center by Data Center the data in the Map window.
Center by Map Center the maps in the Map window.
Center by Site Center the sites in the Map window.
Pinpoint Pin pointing on a test route.
Define Path Predefine a test route.
Save Predefined
Path Saved the predefined test route.

Map Window
51 © Dingli 17-06-2016 DL11100UM
Icon Name Description
Customize Path After importing a map, select a road and click Customize
Path to customize the path display.
Pin Point
Predefined Paths Pin pointing on a predefined test routes.
Inverse Removal Remove the pin points on the predefined test route one by
one in a reversed order.
Remove All Remove all pin points on the predefined test route.
Restore Restore all pin points that are removed.
Distance Measure the distance between two points in the Map
window.
Polygon
Distance
Measure the distance among multiple points in the Map
window.
Rectangular
Area Measure the square area.
Polygon Area Measure the polygon area.
Draw Users may draw and save a Tab layer with customized
points, characters, shapes, etc.
Cell Search Search for specified cells in the Map window.
Information Display detailed data and cell information.
Location Enter specified longitude and latitude to position on the map.
Event Settings Manage all event settings.
Information
Settings Set information display in the Map window.
Cell Line
Linking by Cell
Click a cell to display all cell line linking between the cell
and related sampling points. The sampling points, cell line
linking, and the cell are displayed in the same color.
Cell Line
Linking by
Select a region randomly to display the cell line linking
between the sampling points in the selected region and

Map Window
52 © Dingli 17-06-2016 DL11100UM
Icon Name Description
Region related cells. The sampling points, cell line linking, and cells
are displayed in the same color.
Cell Line
Linking by Log
Select a log to display the cell line linking between all
sampling points and related cells. The sampling points, cell
line linking, and cells are displayed in the same color.
Neighbor Check Display the neighbor cell check results.
BCCH Check Display the BCCH check results.
PN Check Display the PN check results.
PSC Display the PSC check results.
CPI Display the CPI check results.
PCI Display the queried PCI information.
Other Display the other check results.
Add Neighbor
Cell
Add neighbor cells for the sites displayed in the Map
window as required.
Delete Neighbor
Cell
Delete neighbor cells for the sites displayed in the Map
window as required.
Save Current
Neighbor Cell
Configuration
Save all neighbor cell configuration for the current site.
Export Neighbor
Cell Edit Log Export all neighbor cell modified records.
Export All
Neighbor Cells Export neighbor cell relationship for all sites.
9.1.2 Status Bar on the Map Window
All the important information related to the current operation status is displayed at the bottom of
the Map window, including the current operation objects, longitude and latitude of the current

Map Window
53 © Dingli 17-06-2016 DL11100UM
samples, and the refresh process when dragging the map layer.
The Map Status Bar supports the following functions:
1. Real-time display of the longitude and latitude for the current point.
Easting-Northing (East and North coordinates display mode)
Decimal Long_Lat (decimal coordinates display mode)
DMS Long_Lat (Degree Minutes and Seconds coordinate mode)
2. Displays the details for the selected point.
Displays information in the format of Parameter-Logfile name when the test logs are
selected.
Displays information in the format of Site Name related to the cell when cells are selected.
Displays None while other regions of the map window are selected.
3. Display the refresh process when dragging the map layer.
9.1.3 Sub Menus within Right-click List
Users may right-click any place in the Map window to check the user-friendly and frequently used
functions within the right-click list.
Table 6 Functional buttons within the right-click list
Icon Name Description
None Display Test Route
Select a display mode for measurement samples in the
Map window: By GPS Samples, By Real Sample Value,
By Duplicated Sample Value.
Show/Hide Scale Display/hide the scale in the Map window.
Show/Hide Directions Display/hide the route direction of logfiles.
Show/Hide Legend Display/hide the thresholds of the parameter.
Distance Measure the distance between two points.
None Forwards Proceed to the next view.
None Backwards Return to the previous window.
None Batch Import Load logfiles in batch.
None Export Selected Sites
Export selected sites in the user-defined format
(Options: Mapinfo, Google Earth, Text File, Shape
File).
None Export Cell Lines Export cell lines in the user-defined format (Options:

Map Window
54 © Dingli 17-06-2016 DL11100UM
Icon Name Description
Mapinfo, Google Earth, Text File, Shape File).
None Export Test Route Export test route in the user-defined format (Options:
MapInfo, Google Earth, Shape file).
None Freeze Freeze the window.
9.1.4 Legend Window
The Legend window displays parameter, data, site, GPS, and event information.
Figure 9-2 Legend window
The parameter threshold displayed on the Map layer pane is the same as that on the right pane of
the Legend.
Users may display and hide information by selecting or deselecting the check box on the right
pane as required. There is no sub menu for Data or GPS. The sub menus for Parameter, Sites,
and Events are as follows:
1. Parameter node:

Map Window
55 © Dingli 17-06-2016 DL11100UM
Table 7 Functional buttons under Parameter
Name Description
Add Param Add parameters to be displayed in the Legend window.
Delete All Delete all parameters under Parameter and route displayed in the
Map window.
Show/Hide
Directions Display/hide the route direction of logfiles.
Show/Hide Scale Display/hide the scale.
Export Export parameters in the user-defined format (Options: Mapinfo,
Google Earth, Shape File).
Sub node under Parameter:
Table 8 Sub node under Parameter
Name Description
Forward Offset Forward offset.
Backward Offset Backward offset.
Delete Delete the test route belonging toa specific parameter from the Map
window
Parameter Settings Open the parameter settings window.
Export Export parameters in the MapInfo, Shape file and Google Earth
formats.
Users may double-click a sub node under Parameter or right-click the sub node to open the
Parameter Settings window.

Map Window
56 © Dingli 17-06-2016 DL11100UM
Figure 9-3 Parameter Settings window
Table 9 Functional buttons on Parameter Settings
Name Description
Symbol Symbol type for measurement samples.
Auto Automatically define parameter thresholds by the software.
Insert Insert a row to define a threshold.
Delete Delete a threshold.
Ascent Sort the thresholds in the ascending order.
Descent Sort the thresholds in the descending order.
2. Sites
Multiple site databases may be displayed in the same Map window simultaneously.
Table 10 Right-click functions of Sites
Name Description
Delete All Cells Delete all site databases under Sites.
Cell Settings Open the cell settings window.
Export Export parameters in the MapInfo, Text File, Shape File and Google
Earth formats.

Map Window
57 © Dingli 17-06-2016 DL11100UM
Table 11 Right-click functions of sub-node under Sites
Name Description
Delete Cell Delete selected site databases.
Cell Settings Enter the cell settings window
Export Export site databases to the MapInfo, Google earth, Text File,
and Shape File formats.
Save Current Neighbor Cell
Configuration Save all neighbor cell configuration for the current site.
Export Neighbor Cell
Edited Log Export all neighbor cell modified records.
Export All Neighbor Cells Export neighbor cell relationship for all sites.
9.2 Data Display in the Map Window
Pilot Pioneer Expert may display log file, site database file, and map files in the map window. For
a map file, the following formats are supported:
MapInfo (*.Tab, *.Mif, *.Gst)
Image (*.bmp, *.jpg, *.gif, *.tif, *.tga)
Terrain (*.TMB, *TMD),
AutoCAD (*.Dxf)
USGS (*.DEM),
ArcInfo (*.Shp)
9.2.1 Logfile Display
Logfiles may be displayed in the Map window during test or replay. Users may directly drag
specified parameters from the navigation bar into the Map window.
To display logfiles in the Map window, do as follows:
Method 1: Drag the logfile under Data List on the Data tab page into the Map Window and the
default parameter of the logfile is displayed; meanwhile, the parameter information is displayed in
the legend window.
Method 2: Drag a parameter of the logfile on the Param tab page into the Map window, and the
parameter is displayed in the Map window; meanwhile, the parameter information is displayed in
the legend window.

Map Window
58 © Dingli 17-06-2016 DL11100UM
Method 3: Double-click the Map icon under Network on the Data tab page and the default
parameter of this logfile is displayed in the Map window; meanwhile, the parameter information is
displayed in the legend window.
Method 4: Right-click a parameter of the logfile on the Param tab page, and select Map to
display the parameter information in the Map window.
Figure 9-4 Displaying log file in the Map window
The features related to logfile display in the map window are:
Multiple logfiles for multiple technologies may be displayed simultaneously.
No technology information is displayed in the legend window if the logfiles displayed in
the window are from the same network technology.
The technology information is displayed in the legend window if the logfiles displayed in
the window are from different network technologies.
Only one parameter is displayed in the legend window if the same parameter for different
logs belongs to the same technology, while others will be shown as layers in the Map
Window.
9.2.2 Site Display
Users may select and drag the site file under Sites on the Layer tab page into the Map window to
display while testing or replaying the logs.

Map Window
59 © Dingli 17-06-2016 DL11100UM
Figure 9-5 Displaying sites
9.2.3 Map File Display
Users may click the Open Map Layer icon on the toolbar on the Map window to add map layers.
Figure 9-6 Displaying map file

Map Window
60 © Dingli 17-06-2016 DL11100UM
9.2.4 Add Background Maps
Users may click the drop-down arrow to select a background map as required.
Figure 9-7 Add a background map
If no map layer file is imported, the map of China will be centered at the window.
Figure 9-8 Bing Map (no map layer file)
If a map layer file is imported, the corresponding map will be centered at the window. The figure
below shows the Bing Map with Guangzhou map layer.

Map Window
61 © Dingli 17-06-2016 DL11100UM
Figure 9-9 Bing Map (with map layer file)
Users may select Grey Background to highlight the map layer.
Figure 9-10 Grey background
9.2.5 Event Display
Events in logfiles can be displayed in the Map window.
To display events in the Map window, follow the instructions below:
1. Set events to be displayed in the Map window.
Users may choose Configuration > Event Settings on the Menu bar to enter the Event

Map Window
62 © Dingli 17-06-2016 DL11100UM
Settings window and conduct settings as required.
2. Display logfiles in the Map window. The events that have been set will be automatically
displayed.
Figure 9-11 Displaying events
9.2.6 Layer Manager
Users may click the Layer Control icon on the Map Window to open the Layer Manager
window and manage all the layers, such as managing the layer priority, displaying/hiding layers,
adding or removing layers, adding or removing layer labels, and setting transparency.

Map Window
63 © Dingli 17-06-2016 DL11100UM
Figure 9-12 Layer Manager window
The label function in Layer Manager is similar to the label function in Mapinfo. Users may set the
label fields, font, and color to be displayed in the Map window.
Click Label to enter the Label Settings window.
Figure 9-13 Label Settings window
The following figure shows the label display after settings:

Map Window
64 © Dingli 17-06-2016 DL11100UM
Figure 9-14 Label display after settings
The features related to Layer Manager are as follows:
Users may customize the layer priority.
Users may display/hide/edit layers and insert labels.
Users may set the layer transparency.
Users may set layer label, including label field selection, display font, color, etc.
9.3 Cell Settings
Cell settings have direct effect on site database displayed in the Map Window, such as cell display,
cell line linking and cell checking.
To enter the Cell Setting window, do as follows:
Method 1: Click the Cell Settings icon from the toolbar of the Map window;
Method 2: Right-click Sites in the Legend window, and select Cell Settings.
Method 3: Right-click the site database under Sites on the Legend window, and select Cell
Settings.
9.3.1 Display Settings
In the Cell Settings window, users may click the Display Settings tab, and select a network
technology to set the color, size, and shape for the sites.

Map Window
65 © Dingli 17-06-2016 DL11100UM
Figure 9-15 Display Settings
The figure below shows the sites display after settings:
Figure 9-16 Site display after settings
Users may perform the following settings in the Display Settings window:

Map Window
66 © Dingli 17-06-2016 DL11100UM
1. Set the cell color displayed in the Map Window by specifying a field in Color.
The major parameters are displayed in the matrix with the default color, while other
parameters are displayed in the list.
The sites are displayed with transparent color.
Users may select PN increment to filter PN in CDMA and EVDO network technologies.
PN with multiple offset is displayed in the list.
Users may select a field and add a group for its color and size or delete a field.
Users may select colors from the drop-down list box for other fields.
2. Set the cell size displayed in the Map Window by specifying a field in Size.
All the sites may be in the same size.
Users may set the cell size according to the specified field.
Users may select sizes from the drop-down list box for other fields.
3. Set the site shape displayed in the Map Window by specifying a field in Style.
Pilot Pioneer Expert supports four shape setting: Line, Simple, Pie, and Complex
Users may define the shape as required.
9.3.2 Label Settings
In the Cell Settings window, users may click the Label Settings tab, and select a network
technology to set the site label, display content, and label offset.
Figure 9-17 Label Settings

Map Window
67 © Dingli 17-06-2016 DL11100UM
The figure below shows the site label display after settings:
Figure 9-18 Site label display after settings
Users may perform the following settings in the Label Settings window:
Set how to display label
Display overlapping labels
Hide overlapping labels
Set what is displayed on label
Set site label offset
Set cell label offset
9.3.3 Cell Line Linking
In the Cell Settings window, users may click the Cell Line Settings tab, and select a network
technology to set the cell line linking and line label.

Map Window
68 © Dingli 17-06-2016 DL11100UM
Figure 9-19 Cell Line Settings
The figure below shows the cell line linking display after settings:

Map Window
69 © Dingli 17-06-2016 DL11100UM
Figure 9-20 Cell line linking display after settings
Users may input the following settings in the Cell Line Settings window:
1. Set the cell line linking display under Cell Lines.
Set the style, width, and color of the lines.
Synchronize the cell line color with the color of specified parameter's test routes.
2. Set alarm line under Alarm Distance. That is, when a line exceeds the specified line distance,
the line will be displayed as an alarm line.
Available when Alarm Line is selected under Cell Lines.
3. Set the content of the label displayed in the cell line linking under Line Labels.
4. Select the conditions for best cell under Best Cell.
Available when Best Cell is selected under Cell Lines.
9.3.4 Analysis Settings
In the Cell Settings window, users may click the Analysis Settings tab, and select a network
technology to set the conditions for cell analysis.
Users may set cell colors for all the sites in the site database by using cell-analysis tools from the
Toolbar.

Map Window
70 © Dingli 17-06-2016 DL11100UM
Figure 9-21 Analysis Settings
The figure below shows the cell display after settings:

Map Window
71 © Dingli 17-06-2016 DL11100UM
Figure 9-22 Cell display after settings
Analysis Settings includes PN Check, Neighbor, Others, and Neighbor Analysis.
1. PN Check: check cells by CI
Set the same color for neighbor cells.
Set another color for the non-configured neighbor cells.
Set other colors for other cells; white is suggested.
2. Neighbor:
Set the same color for the same cell.
Set another color for neighbor cells.
Set other colors for other cells; white is suggested.
3. Others
Users can select any parameter from the site database.
Set the same color for the same cell.
Set other colors for other cells; white is suggested.
4. Neighbor Analysis
Set color for the current, added, deleted cells when users perform neighbor cell analysis.
Display the associated information for the Neighbor Analysis cells in the Map Window
9.4 Information Settings
Users may set the information displayed in the Map window, including parameters, and cell
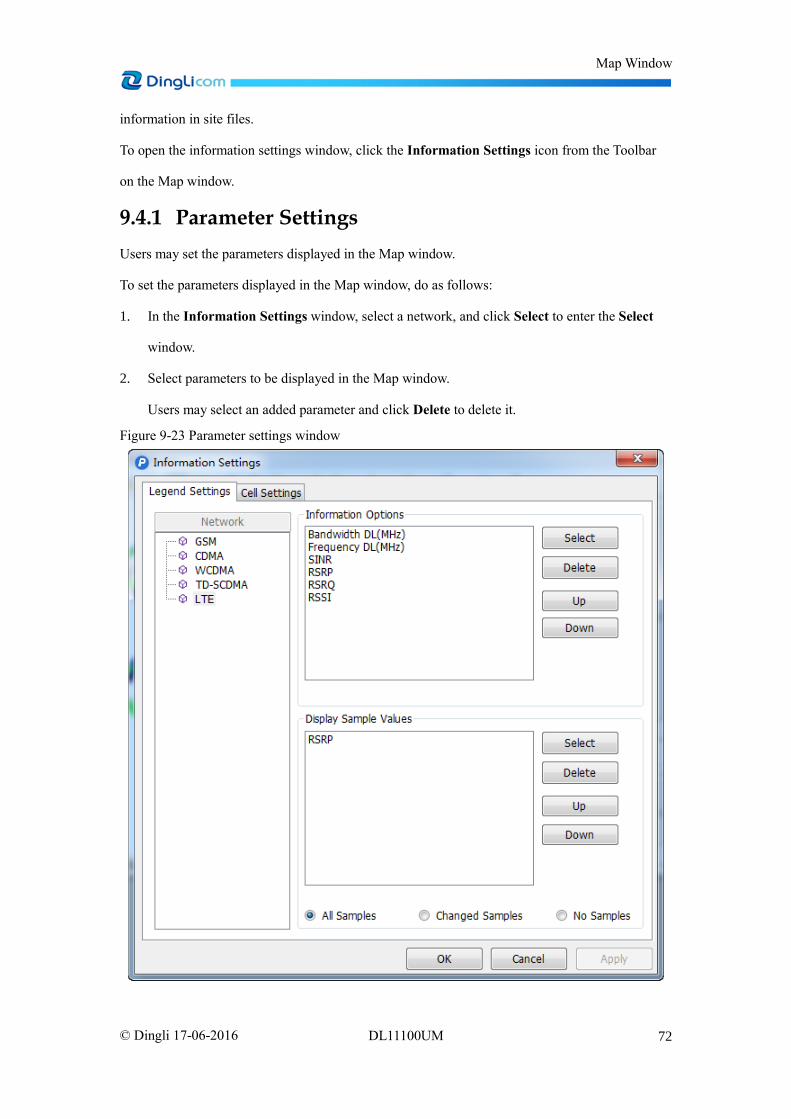
Map Window
72 © Dingli 17-06-2016 DL11100UM
information in site files.
To open the information settings window, click the Information Settings icon from the Toolbar
on the Map window.
9.4.1 Parameter Settings
Users may set the parameters displayed in the Map window.
To set the parameters displayed in the Map window, do as follows:
1. In the Information Settings window, select a network, and click Select to enter the Select
window.
2. Select parameters to be displayed in the Map window.
Users may select an added parameter and click Delete to delete it.
Figure 9-23 Parameter settings window

Map Window
73 © Dingli 17-06-2016 DL11100UM
The parameters may be displayed in the following ways:
Method 1: Display in the Legend window
1. Click the Information icon from the Toolbar on the Map window.
2. Click the measurement samples on the testing route, the parameter values will be
displayed on the Legend window.
Method 2: Display the values next to the sampling points on the testing route.
Figure 9-24 Parameter display
There are two ways to display the information settings:
Display the parameter information in the Information window by setting parameter
information in Information Options.
Display parameter information next to the measurement samples on the testing route by
setting parameter information in Display Sample Values.
There are three ways to display the parameter values in the Map window:
Display the parameter values for all measurement samples.
Display the parameter values only when the value changes.
Do not display measurement samples' information.
9.4.2 Cell Settings
In the Information Settings window, users may set cell information displayed in the Map

Map Window
74 © Dingli 17-06-2016 DL11100UM
window.
Figure 9-25 Cell Settings
Method 1: Click the Information icon from the Toolbar on the Map window.
Method 2: Click the specified cell on the Map window, and the cell information will be displayed
on the Legend window.
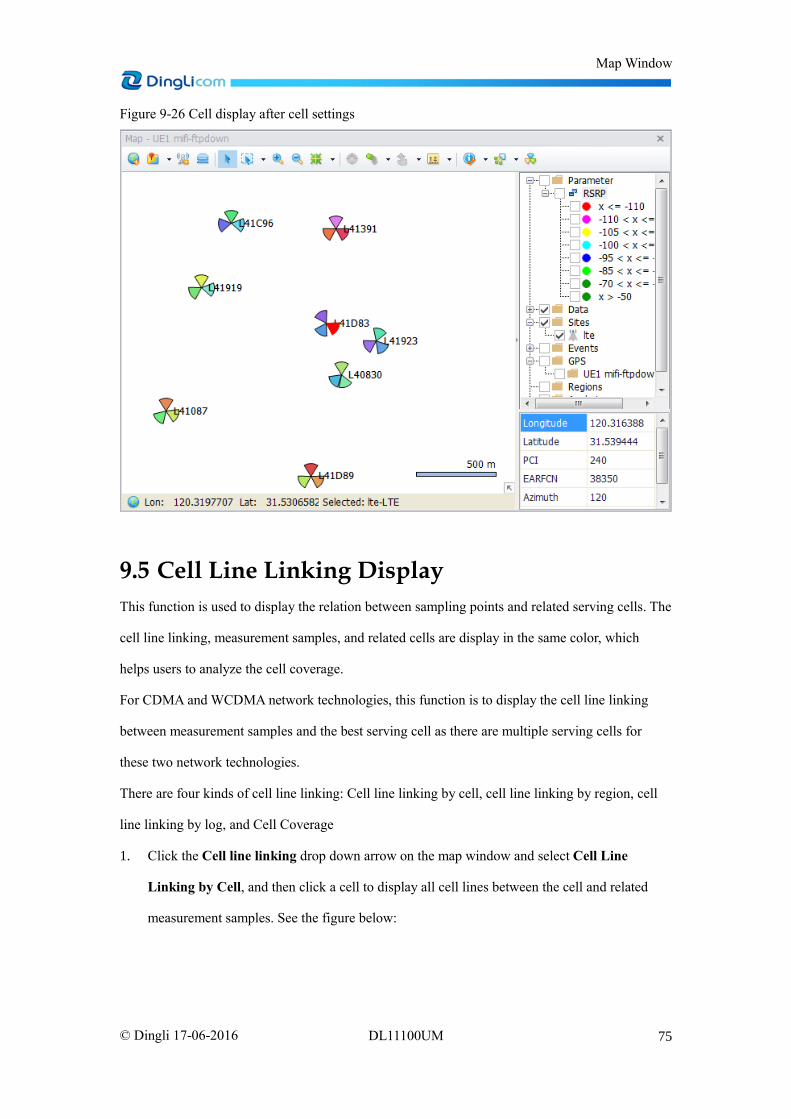
Map Window
75 © Dingli 17-06-2016 DL11100UM
Figure 9-26 Cell display after cell settings
9.5 Cell Line Linking Display
This function is used to display the relation between sampling points and related serving cells. The
cell line linking, measurement samples, and related cells are display in the same color, which
helps users to analyze the cell coverage.
For CDMA and WCDMA network technologies, this function is to display the cell line linking
between measurement samples and the best serving cell as there are multiple serving cells for
these two network technologies.
There are four kinds of cell line linking: Cell line linking by cell, cell line linking by region, cell
line linking by log, and Cell Coverage
1. Click the Cell line linking drop down arrow on the map window and select Cell Line
Linking by Cell, and then click a cell to display all cell lines between the cell and related
measurement samples. See the figure below:

Map Window
76 © Dingli 17-06-2016 DL11100UM
Figure 9-27 Cell line linking display by cell
2. Click the Cell line linking drop down arrow on the map window and select Cell Line
Linking by Region, and then select a region randomly to display the cell lines between the
measurement samples in the selected region and related cells. See the figure below:

Map Window
77 © Dingli 17-06-2016 DL11100UM
Figure 9-28 Cell line linking display by region
3. Click the Cell line linking drop down arrow on the map window and select Cell Line
Linking by Log to display the cell lines between all measurement samples and related cells
(just like selecting the whole region in the mode of by region). See the figure below:

Map Window
78 © Dingli 17-06-2016 DL11100UM
Figure 9-29 Cell line linking display by log
Note: Users may press Ctrl+Shift+Alt+L to clear the cell lines and display only the cells and
measurement routes.
Figure 9-30 Clear cell lines
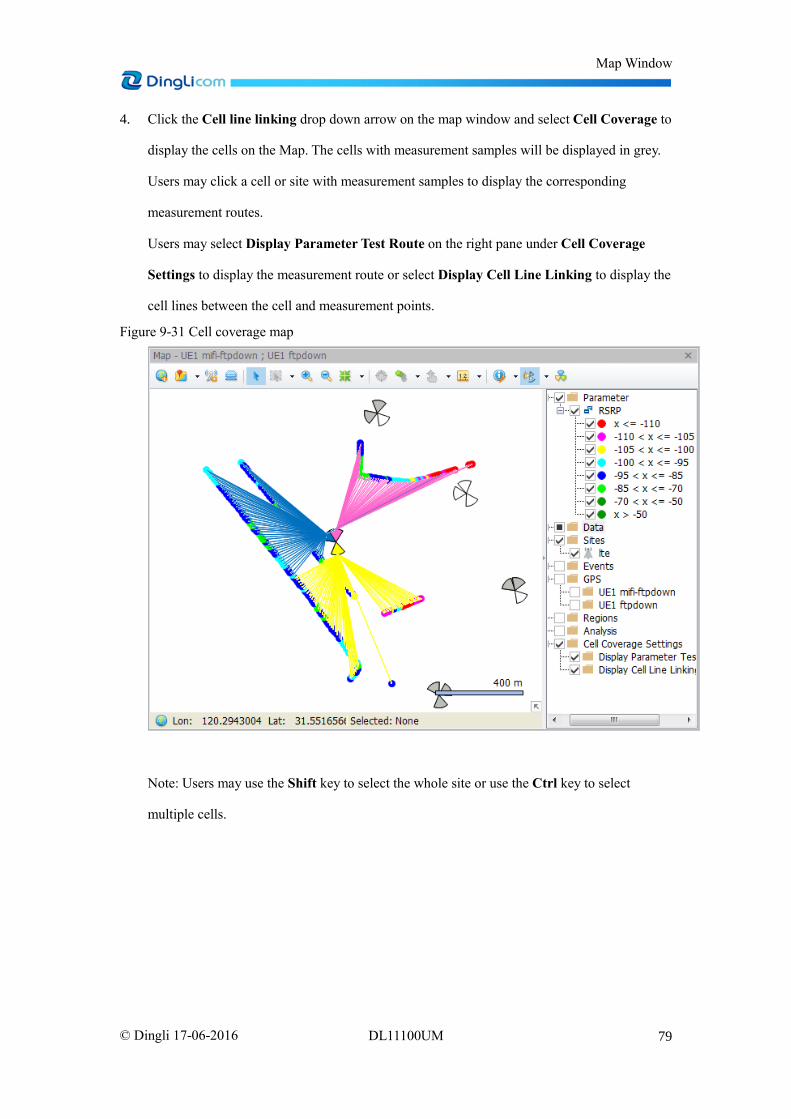
Map Window
79 © Dingli 17-06-2016 DL11100UM
4. Click the Cell line linking drop down arrow on the map window and select Cell Coverage to
display the cells on the Map. The cells with measurement samples will be displayed in grey.
Users may click a cell or site with measurement samples to display the corresponding
measurement routes.
Users may select Display Parameter Test Route on the right pane under Cell Coverage
Settings to display the measurement route or select Display Cell Line Linking to display the
cell lines between the cell and measurement points.
Figure 9-31 Cell coverage map
Note: Users may use the Shift key to select the whole site or use the Ctrl key to select
multiple cells.

Message Window
80 © Dingli 17-06-2016 DL11100UM
10 Message Window The Message window may display all decoding information of specified logfiles, which may be
used to analyze network issues (reflecting by Layer 1, Layer 2, and Layer 3 messages), and
automatically identify network issues as well as locate possible reasons for the issues.
10.1 Opening the Message Window
Each logfile has its corresponding Message Window; there are several ways to open the Message
Window:
Method 1: Click Data, and double-click corresponding to the logfile under
Network.
Method 2: Click Data, and drag into the workspace.
Figure 10-1 Message window

Message Window
81 © Dingli 17-06-2016 DL11100UM
Figure 10-2 Message details
The following functions are supported:
Users may search, filter, and freeze messages, or add bookmarks to a message.
Users may double click a message in the Message window to display the message details
window, showing the original code of the selected message.
Users may search information in the message details window, set hexadecimal display mode,
message display font, color, and background, and save or copy text content.
10.2 Functional Buttons
The following table describes the functional buttons in the Message window:
Table 12 Functional buttons in the Message window
Icon Name Description
Search Search message information and list the results.
None Search message downward one by one.
None Search message upward one by one
Filter Filter messages based on specified conditions.
Freeze Freeze the window.
Open/Close
bookmark view Open/close the bookmark window.
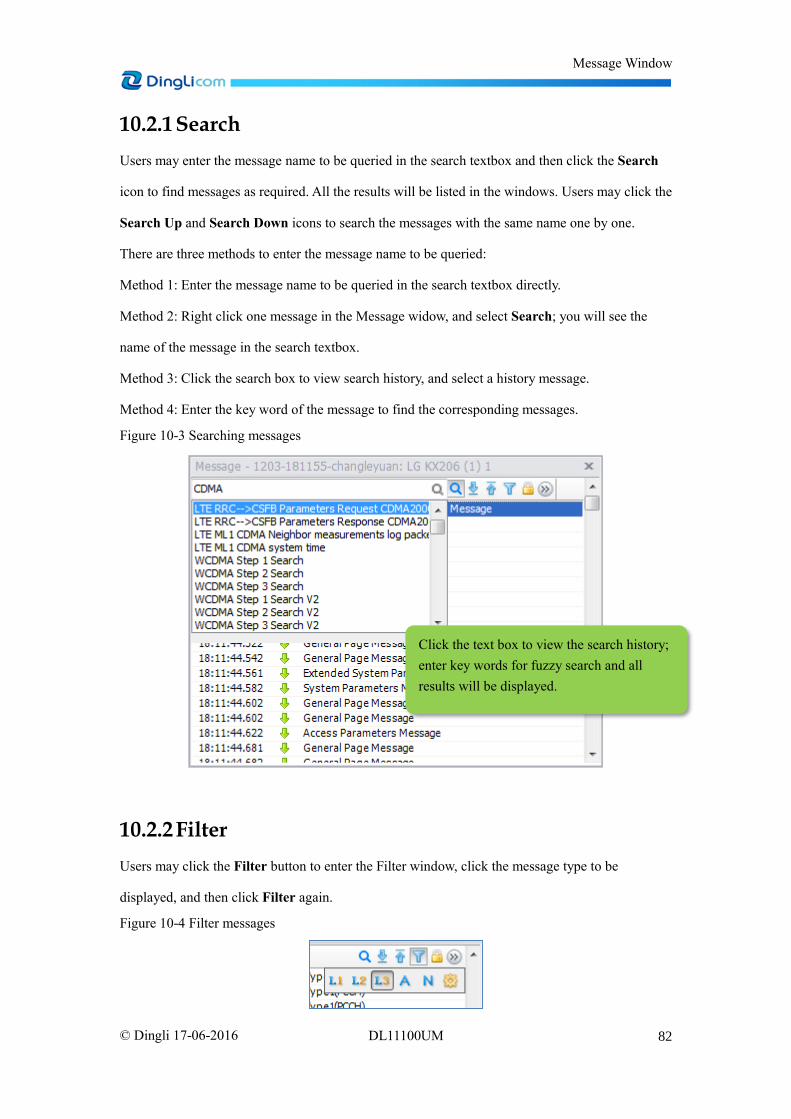
Message Window
82 © Dingli 17-06-2016 DL11100UM
10.2.1 Search
Users may enter the message name to be queried in the search textbox and then click the Search
icon to find messages as required. All the results will be listed in the windows. Users may click the
Search Up and Search Down icons to search the messages with the same name one by one.
There are three methods to enter the message name to be queried:
Method 1: Enter the message name to be queried in the search textbox directly.
Method 2: Right click one message in the Message widow, and select Search; you will see the
name of the message in the search textbox.
Method 3: Click the search box to view search history, and select a history message.
Method 4: Enter the key word of the message to find the corresponding messages.
Figure 10-3 Searching messages
10.2.2 Filter
Users may click the Filter button to enter the Filter window, click the message type to be
displayed, and then click Filter again.
Figure 10-4 Filter messages
Click the text box to view the search history;
enter key words for fuzzy search and all
results will be displayed.

Message Window
83 © Dingli 17-06-2016 DL11100UM
Users may click the icon, enter the Message Settings window, and set the messages to be
displayed in the Message window. See the figure below:
Figure 10-5 Message Settings window
By default, L3 messages are selected.
Users may select L1, L2, L3 as required.
Filtering settings take effect only on the current window.
Table 13 Functional buttons on Message Settings window
Icon Name Description
L1 Message Select Layer 1 messages.
L2 Message Select Layer 2 messages.
L3 Message Select Layer 3 messages.
All Select Layer 1/2/3 messages.
None Select none.
Message Settings Set the message type to display in the Message window.
10.2.3 Bookmark
Users may add bookmarks to the messages in which they are interested, and then double-click the

Message Window
84 © Dingli 17-06-2016 DL11100UM
bookmark to view the message.
Users may perform the following operations:
Click the Open/Close bookmark view button to open the bookmark pane.
Select one message, and then click the Add bookmark button or right click a message to
select Add bookmark, enter a bookmark name to add it to the bookmark window.
Select one bookmark, and click the Delete bookmark button to remove the bookmark
from the bookmark list.
Double click a bookmark to go to the corresponding message.
Figure 10-6 Bookmark pane
Table 14 Functional buttons for Bookmark
Icon Name Description
Add Bookmark Add a bookmark.
Delete bookmark Delete a bookmark.
Edit bookmark Edit a bookmark.
10.3 Right-click Menu
The following table describes the right-click menus provided by the Message window:

Message Window
85 © Dingli 17-06-2016 DL11100UM
Figure 10-7 Right-click functions
Table 15 Right-click menus in the Message window
Name Description
Message Details
Windows Window displaying message details.
Search Search messages.
Add Bookmark Add a bookmark.
Set columns Set columns displayed in the window.
No. Set whether to display the column number.
PC Date Set whether to display the PC date when the message is triggered.
PC Time Set whether to display the PC time when the message is triggered.
UE Date Set whether to display the UE date when the message is triggered.
UE Time Set whether to display the UE time when the message is triggered.
Timestamp Set whether to display the time stamp.

Message Window
86 © Dingli 17-06-2016 DL11100UM
Name Description
Symbol Set whether to display the uplink and downlink symbols.
Name Set whether to display the message name.
Information Set whether to display the message information.
Network Set whether to display the network type.
Protocol Set whether to display the protocol.
Channel Type Set whether to display the channel type.
Set Color Se font and background color.
Setting Back Color Set background color.
Setting Font Color Set Font color.
Save to Message
Settings
The color settings here can be synchronized to the message
settings window. The settings are effective even after the message
settings window reopens.
Status Bar Select this option to display the status bar of the Message
window.
Select Logfile Select or change the logfiles.
10.4 Message Details
The message details window provides detailed message decoding information. Users may perform
multiple operations in this window, such as searching messages, setting background color, etc. The
following table describes the detailed functions provided by the Message details window:

Message Window
87 © Dingli 17-06-2016 DL11100UM
Figure 10-8 Message details
Table 16 Functional options provided by the Message details window
Name Description
Search Search messages.
Hex Display message details in hexadecimal mode.
Back Set background color.
Font Set font color.
Save Save the settings in this window.
Frozen Lock the information in the window.
The following table describes the right-click menus provided by the Message details window:
Table 17 Right-click menus in the Message details window
Name Description
Copy Copy the selected content to the clipboard in the txt format.
Copy Node Path Copy the node path in the Message Details window.
Save As Text Save the message details as a text file.
Recover to Default color Restore the color settings to the default settings (white

Message Window
88 © Dingli 17-06-2016 DL11100UM
Name Description
background, black font.)
Show as Text Display message details as text.
Lock Windows Select this option to lock windows and view multiple messages.

Event List Window
89 © Dingli 17-06-2016 DL11100UM
11 Event List Window The Event List Window is used to display event information.
11.1 Opening the Event List Window
Every logfile has its event list window. Users may choose either of the methods below to open the
Event List window.
Method 1: Click Data, and double-click corresponding to the logfile under
Network.
Method 2: Click Data, and drag into the workspace.
Figure 11-1 Opening the Event List window
Users may double-click an event in the Event List window to display detailed event information.
11.2 Functional Buttons
The following table describes the functional buttons in the Event List window:
Table 18 Functional buttons in the Event List window
Icon Name Description
Search Find event information and list the results
None Find the events downward one by one
None Find the events upward one by one

Event List Window
90 © Dingli 17-06-2016 DL11100UM
Icon Name Description
Filter Filter events based on specified conditions
Freeze Freeze the window
Abnormal Display all abnormal events
11.2.1 Search
Users may enter the event name to be queried in the search textbox and then click the Search icon
to find events as required. All the results will be listed in the windows. Users may click the Search
Up and Search Down icons to search the events with the same name one by one.
Users may enter the event name to be queried in the search textbox and then click the Search icon
to find events as required. All the results will be listed in the windows. Users may click the Search
Up and Search Down icons to search the events with the same name one by one.
There are three methods to enter the event name to be queried:
Method 1: Enter the event name to be queried in the search textbox directly.
Method 2: Right click one event in the Event List widow, and select Search; you will see the
name of the event in the search textbox.
Method 3: Click the search box to view search history and select a history event.
Method 4: Enter the key word of the event to find the corresponding events.

Event List Window
91 © Dingli 17-06-2016 DL11100UM
Figure 11-2 Searching events
11.2.2 Filter
Users may click the Filter button to enter the Filter window, select the events to be displayed, and
then click Filter again.
Figure 11-3 Filter events
Filter setting only takes effect on the current window.
11.2.3 Abnormal Events
Users may click the Abnormal button and all abnormal events will be displayed; click the
Abnormal button to return to the original Event List window.
Click the text box to view the search history;
enter key words for fuzzy search and all
results will be displayed.
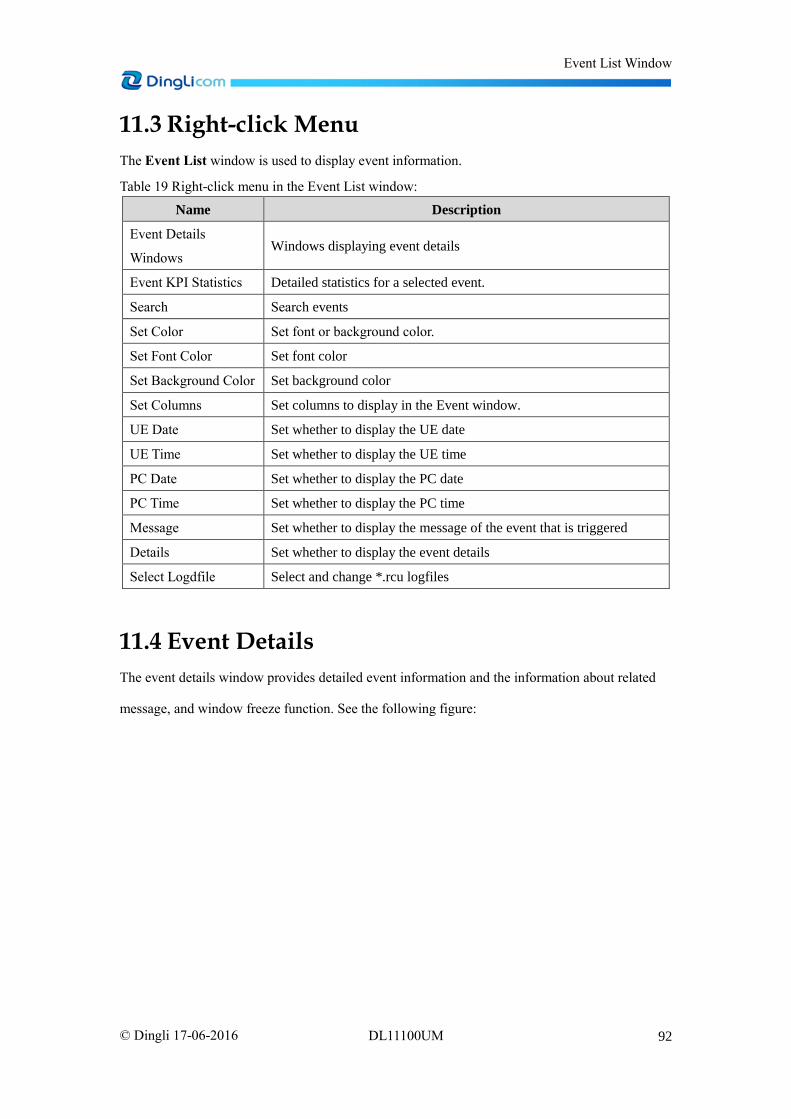
Event List Window
92 © Dingli 17-06-2016 DL11100UM
11.3 Right-click Menu
The Event List window is used to display event information.
Table 19 Right-click menu in the Event List window:
Name Description
Event Details
Windows Windows displaying event details
Event KPI Statistics Detailed statistics for a selected event.
Search Search events
Set Color Set font or background color.
Set Font Color Set font color
Set Background Color Set background color
Set Columns Set columns to display in the Event window.
UE Date Set whether to display the UE date
UE Time Set whether to display the UE time
PC Date Set whether to display the PC date
PC Time Set whether to display the PC time
Message Set whether to display the message of the event that is triggered
Details Set whether to display the event details
Select Logdfile Select and change *.rcu logfiles
11.4 Event Details
The event details window provides detailed event information and the information about related
message, and window freeze function. See the following figure:

Event List Window
93 © Dingli 17-06-2016 DL11100UM
Figure 11-4 Event Details window

Line Chart Window
94 © Dingli 17-06-2016 DL11100UM
12 Line Chart Window Line Chart window displays how parameter value varies along with time in the form of line chart.
The window displays real-time parameter values, events, and test status.
On the Menu bar, users may choose Configuration > Interface Manager to configure the
parameters displayed on the Line Chart Window for each network.
Figure 12-1 Template Manager
Users may perform the following operations in the Line Chart window:
Create a new Line Chart window.
Rename, edit, delete, and move up/down the Line Chart windows that already exist.

Line Chart Window
95 © Dingli 17-06-2016 DL11100UM
12.1 Operations in the Line Chart Window
12.1.1 Create a Line Chart Window
To create a new line chart window, do as follows:
1. In the Interface Manager window, select a network for the new line chart.
2. Select Line Chart from the drop-down menu and then click New.
3. Rename the new Line Chart window, and click OK. The Set Line Chart window is
displayed.
4. The created Line Chart window is added to the corresponding network. Users may choose
Data > Network to check it.
12.1.2 Open a Line Chart Window
Every log file has its Line Chart window. There are four methods to open a Line Chart Window:
Method 1: Click Data, and double-click corresponding to the logfile under
Network.
Method 2: Click Data, and drag into the workspace.
Figure 12-2 Line Chart window
The Line Chart window consists of:
Graph: Parameter information is displayed here. Every blue line represents an event.
Y axis: Y axis represents the parameter value range.
X axis: X axis represents elapsed time.
Parameter &Value: Name of the parameter and its value.
To set parameter in Line Chart, see section 12.2.2.

Line Chart Window
96 © Dingli 17-06-2016 DL11100UM
12.2 Functions
The Line Chart window provides the following functions:
Freeze Window: Click the Freeze icon in Line Chart Window to freeze the current
window.
Switch data: Right-click in the Line Chart window, choose Select Logfile, and select a log
file to display.
Property Setting: Right-click in the Line Chart window, select Property to open the Select
Line chart window. For Property setting, see section 12.2.1.
Add or delete Line Chart: In the Set Line Chart window, users may add a maximum of
four line charts or delete them as required.
12.2.1 Property Settings
There are two methods to set Line Chart properties.
Method 1: Set properties on Interface Manager.
a. On the Menu bar, choose Configuration > Interface Manager.
b. On the Interface Manager window, select a network, click New to create a new Line
Chart.
c. Select the created line chart under corresponding network, and click Edit to perform
parameter settings.
d. For parameter settings, see section 12.2.2.
Method 2: Set properties on the Line Chart window.
a. Right-click in the Line Chart window, select Properties to open the Set Line Chart
window.
b. Click Select to select parameters.
c. Click Edit to open the Edit Parameter window and edit the properties of selected
parameters. See section 12.2.2.

Line Chart Window
97 © Dingli 17-06-2016 DL11100UM
Figure 12-3 Line Chart settings window
The following table describes the functional buttons in the Set Line Chart window:
Table 20 Functional buttons in the Set Line Chart window
Name Description
Select Open the Select window to select parameters
Edit Edit parameter information
Delete Delete selected parameters
Delete All Delete all parameters
Up Move parameters up
Down Move parameters down
Draw Horizontal
Line
Set whether to display the horizontal ruler or not. By default, the
horizontal ruler is displayed.
12.2.2 Parameter Settings
Users may select a parameter and click Edit on the Set Line Chart window to open the Edit
Parameter window and input the parameter settings.

Line Chart Window
98 © Dingli 17-06-2016 DL11100UM
Figure 12-4 Edit Parameter window
The following table describes the parameter settings in the Edit Parameter window:
Table 21 Parameter settings in the Edit Parameter window
Name Description
Select Parameter Select parameters to be edited.
Area line Parameter display mode: area line chart.
Line Parameter display mode: line chart.
Scattered line Parameter display mode: scattered line chart
Color Gradient Color display mode. If this option is selected, the color will be
displayed in a dark to softer tones mode.
Transparency Color display mode. If this option is selected, the color display will
have a softer tone.
Weight Set the line thickness. It is effective only when Line is selected.
Draw Reference Line Draw a reference line in the Line Chart. By default, it is not selected.
Color Change by
Modes
Set whether to change parameter colors based on different modes:
accessed, idle, and service
Parameter Range Set the parameter range. Users may set a new range among the
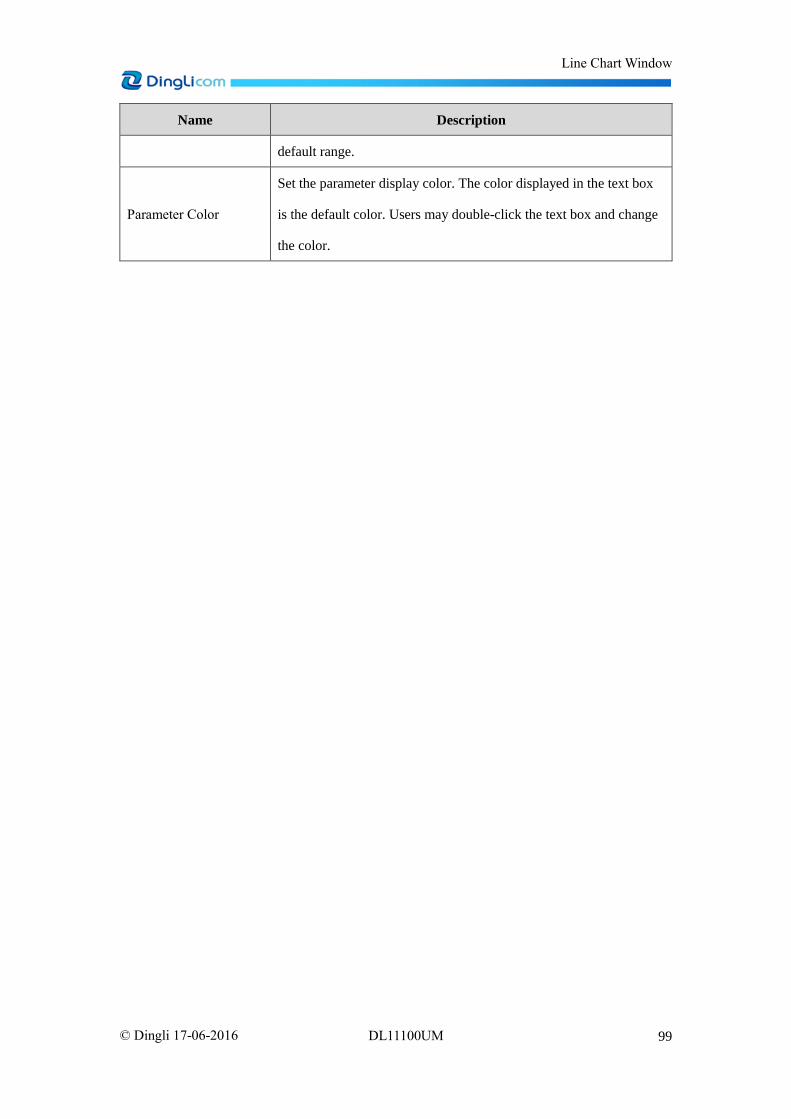
Line Chart Window
99 © Dingli 17-06-2016 DL11100UM
Name Description
default range.
Parameter Color
Set the parameter display color. The color displayed in the text box
is the default color. Users may double-click the text box and change
the color.

Bar Chart Window
100 © Dingli 17-06-2016 DL11100UM
13 Bar Chart Window The Bar Chart window displays parameters in real time. User may select parameters for
comparison as required.
On the Menu bar, choose Configuration > Interface Manager, and select Bar Chart to set the
Bar Chart window.
Figure 13-1 Interface Manger window
Users may perform the following operations:
Create a new Bar Chart window.
Rename, edit, delete, and move up/down the Bar Chart windows that already exist.
13.1 Create a Bar Chart Window
To create a new bar chart window, do as follows:
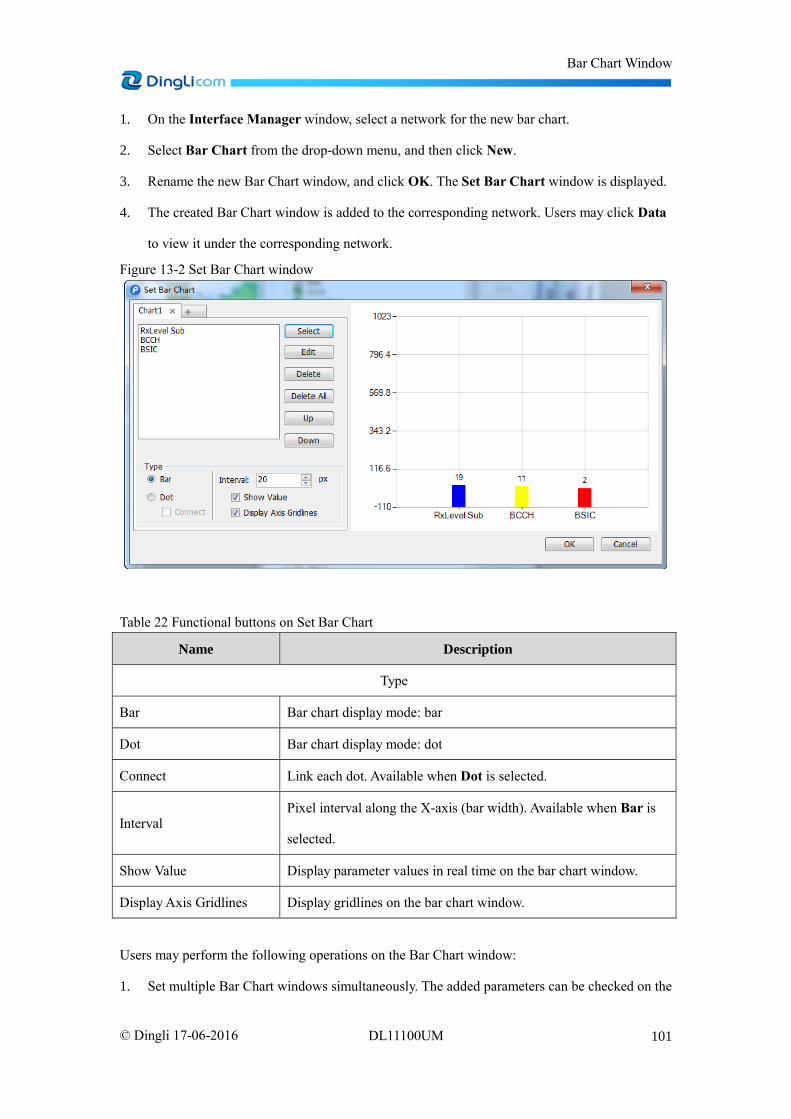
Bar Chart Window
101 © Dingli 17-06-2016 DL11100UM
1. On the Interface Manager window, select a network for the new bar chart.
2. Select Bar Chart from the drop-down menu, and then click New.
3. Rename the new Bar Chart window, and click OK. The Set Bar Chart window is displayed.
4. The created Bar Chart window is added to the corresponding network. Users may click Data
to view it under the corresponding network.
Figure 13-2 Set Bar Chart window
Table 22 Functional buttons on Set Bar Chart
Name Description
Type
Bar Bar chart display mode: bar
Dot Bar chart display mode: dot
Connect Link each dot. Available when Dot is selected.
Interval Pixel interval along the X-axis (bar width). Available when Bar is
selected.
Show Value Display parameter values in real time on the bar chart window.
Display Axis Gridlines Display gridlines on the bar chart window.
Users may perform the following operations on the Bar Chart window:
1. Set multiple Bar Chart windows simultaneously. The added parameters can be checked on the
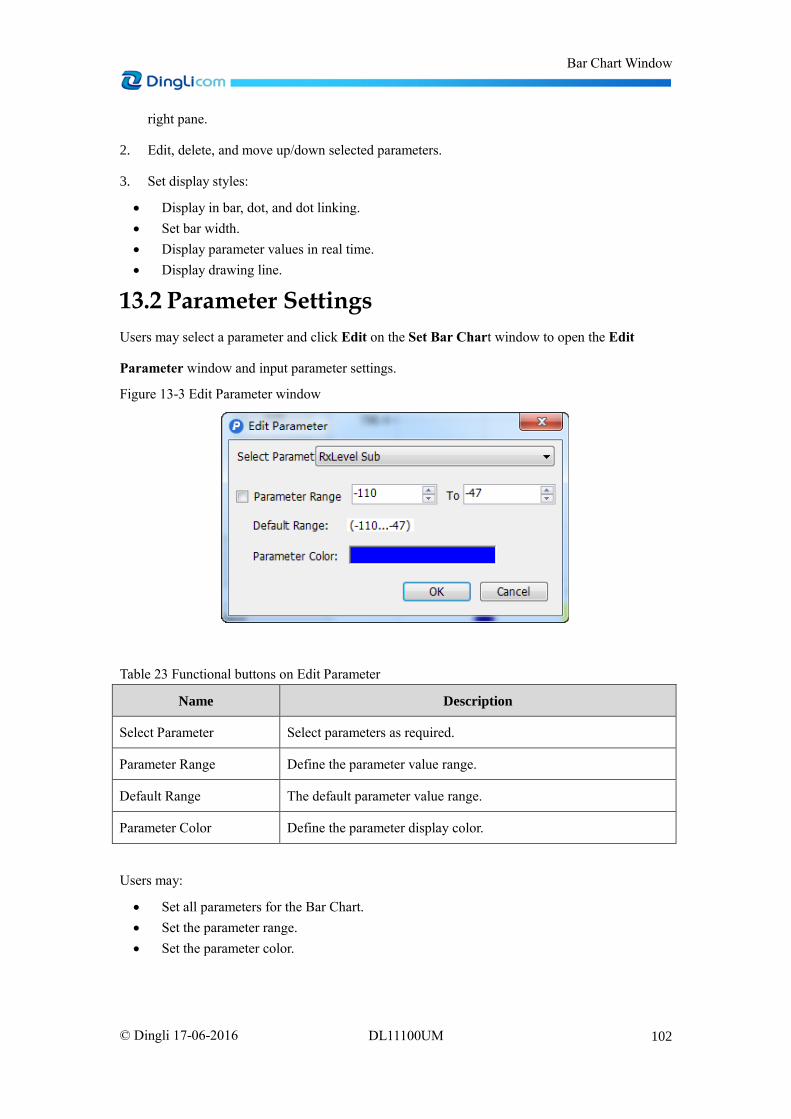
Bar Chart Window
102 © Dingli 17-06-2016 DL11100UM
right pane.
2. Edit, delete, and move up/down selected parameters.
3. Set display styles:
Display in bar, dot, and dot linking.
Set bar width.
Display parameter values in real time.
Display drawing line.
13.2 Parameter Settings
Users may select a parameter and click Edit on the Set Bar Chart window to open the Edit
Parameter window and input parameter settings.
Figure 13-3 Edit Parameter window
Table 23 Functional buttons on Edit Parameter
Name Description
Select Parameter Select parameters as required.
Parameter Range Define the parameter value range.
Default Range The default parameter value range.
Parameter Color Define the parameter display color.
Users may:
Set all parameters for the Bar Chart.
Set the parameter range.
Set the parameter color.

Bar Chart Window
103 © Dingli 17-06-2016 DL11100UM
13.3 Parameter Display
Parameters may be displayed in three styles: bar, dot, and dot linking.
This section takes the WCDMA network as an example to show the three styles. See the following
figures:
Figure 13-4 Display in bar

Bar Chart Window
104 © Dingli 17-06-2016 DL11100UM
Figure 13-5 Display in dot
Figure 13-6 Display in dot linking

Table Window
105 © Dingli 17-06-2016 DL11100UM
14 Table Window The Table window displays parameter values in real time. Users may select parameters to view
real-time variation in user-defined colors.
On the Menu bar, choose Configuration > Interface Manager and select Status to set the Table
window
Figure 14-1 Interface Manager window
Users may perform the following operations:
Create a new table window.
Rename, edit, delete, and move up/down the table windows that already exist.
14.1 Create a Table Window
To create a new table window, do as follows:

Table Window
106 © Dingli 17-06-2016 DL11100UM
1. On the Interface Manager window, select a network for the new table.
2. Select Status from the drop-down menu, and then click New.
3. Rename the new table window, and click OK. The Status Template window is displayed.
4. The created table window is added to the corresponding network. Users may click Data on
the navigation pane to view it under the corresponding network.
Figure 14-2 Status Template window
The following table describes the functional buttons in the Status Template window:
Table 24 Functional buttons in the Status Template window
Name Description
Quick Click this button, select a parameter, and click OK to insert a cell
named as the parameter name and a column of parameter index.
Add Add a column to the right.
Add Row Add a row below.
Delete Delete the selected column.

Table Window
107 © Dingli 17-06-2016 DL11100UM
Name Description
Delete Row Delete the selected row.
Edit Cell Edit the selected cell.
Insert Insert a column to the left
Insert Row Insert a row below.
Clear Cell Clear the content in the selected cell.
Copy Copy the content in the selected cell.
Paste Paste the content in the selected cell.
Up Move the cell up. The related cell with the same name will also be
moved up.
Down Move the cell down. The related cell with the same name will also be
moved down.
Properties Show the properties of the selected cell.
OK Save and exit.
Cancel Cancel and exit.
14.1.1 Edit a Column
Users may edit a column header, scroll bar, and grid lines of the table window.
To edit a column, right-click a column and select Edit Column to open the Properties dialog box,
or click Properties directly to open the Properties dialog box.
Figure 14-3 Properties dialog box
Users may input the following settings:

Table Window
108 © Dingli 17-06-2016 DL11100UM
Rename a column.
Display the column header.
Display grid line.
Display scroll bar.
14.1.2 Edit a Cell
Users may set parameter to be displayed, parameter value, range, and color in the Edit Cell
window.
There are three methods to open the Edit Cell window.
Method 1: Double-click a cell to open the Edit Cell window.
Method 2: Right-click a cell and select Edit Cell.
Method 3: Select a cell, and then click the Edit Cell button.
Figure 14-4 Edit Cell window
The Edit Cell window is different based on the content type. The figures above are Cell Edit
windows based on Text and Parameter respectively.
Users may set parameters based on the following description:
Table 25 Functional buttons on Edit Cell
Name Description
Text Enter a parameter name. If Text is selected, only Background Color can
be set.
Parameter Select a parameter to be displayed.
Dynamic Color
Indicator
The cell fill color and length will vary based on the specified parameter
value.
Default Color Set the cell color based on the parameter color.

Table Window
109 © Dingli 17-06-2016 DL11100UM
Name Description
Custom Color User-defined color.
Range Set parameter range, which may have effects on the cell fill color length.
14.2 Window Display
The following figures show some examples of Status windows:
Figure 14-5 Basic Information (LTE)
Figure 14-6 Serving cell information (LTE)

Other Windows
110 © Dingli 17-06-2016 DL11100UM
15 Other Windows
15.1 MOS
After the MOS test data is imported, users may view the MOS wave & value on the MOS window
and evaluate the speech quality.
There are two methods to open the MOS test window:
Method 1: Click Data, and double-click the MOS icon ( ) corresponding to the logfile under
Network.
Method 2: Click Data, and drag the MOS icon ( ) corresponding to the logfile into the
workspace.
Figure 15-1 MOS test window
The following table describes the functional buttons in the MOS window:

Other Windows
111 © Dingli 17-06-2016 DL11100UM
Name Description
Reference Wave The standard wave for reference
Degraded Wave The current voice wave
Parameters Parameters related to MOS.
Value Measurement parameter value at different time.
15.2 Video
After logfiles related to Video test are imported, users may view corresponding information on the
Video window in real time.
There are two methods to open the video test window.
Method 1: Click Data, and double-click the Video icon ( ) corresponding to the logfile under
Network.
Method 2: Click Data, and drag the Video icon ( ) corresponding to the logfile into the
workspace.
Figure 15-2 Video Play
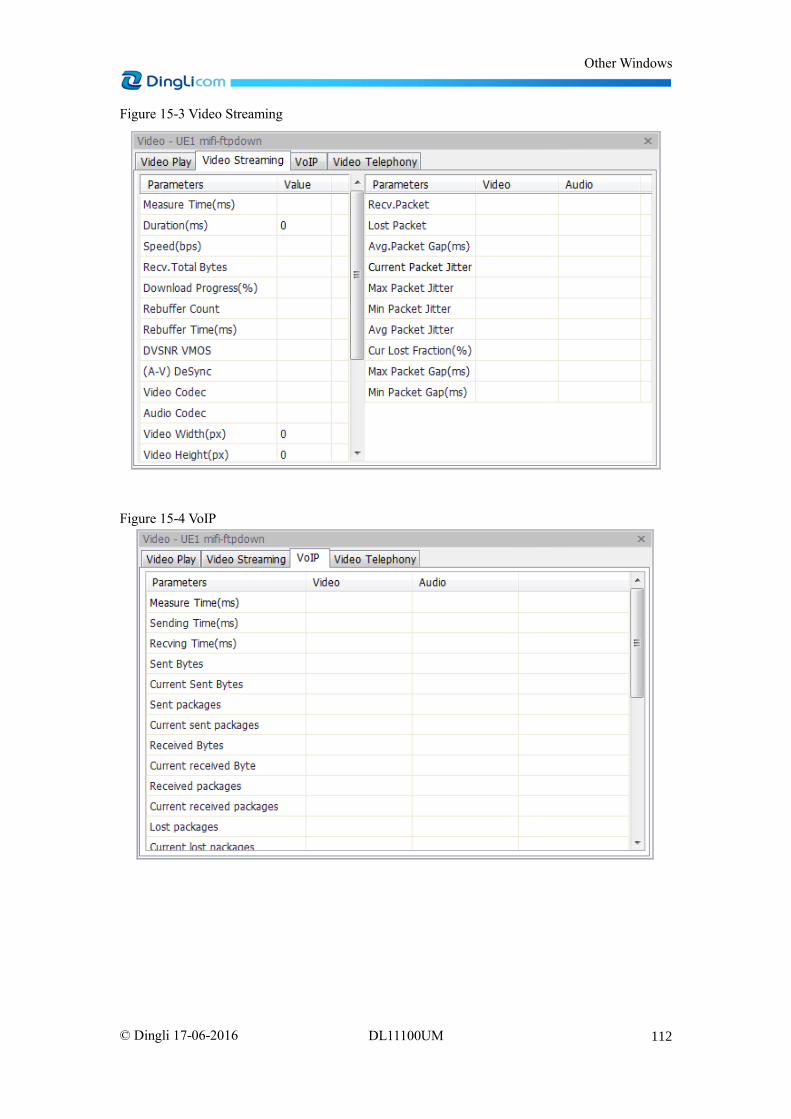
Other Windows
112 © Dingli 17-06-2016 DL11100UM
Figure 15-3 Video Streaming
Figure 15-4 VoIP

Other Windows
113 © Dingli 17-06-2016 DL11100UM
Figure 15-5 Video Telephony
There are three categories of parameters:
Parameters that measures a network
Parameters that measures the audio/video of the streaming video
Parameters of audio/video synchronization provided by Pilot Pioneer Expert during replay
back
15.3 Data
After logfiles related to data test are imported, users may view the corresponding information in
the Data window, which includes the test progress, file size, the completed ratio, instantaneous
throughput against time and average throughput, etc.
There are two methods to open the data window.
Method 1: Click Data, and double-click the Data icon ( ) corresponding to the logfile under
Network.
Method 2: Click Data, and drag the Data icon ( ) corresponding to the logfile into the
workspace.

Other Windows
114 © Dingli 17-06-2016 DL11100UM
Figure 15-6 Data window
The following table describes the functional buttons in the Data window:
Table 26 Functional buttons in the Data window
Name Description
Service Service type
Completion/Total Bytes Completed ratio
Inst. Throughput Instant throughput
Avg. Throughput Average throughput
Progress Test progress in percentage
15.4 GPS
The GPS window displays sampling point's longitude, latitude, and other information in real time.
There are two methods to open the GPS window.
Method 1: Click Data, and double-click the GPS icon ( ) corresponding to the logfile under
Network.
Method 2: Click Data, and drag the GPS icon ( ) corresponding to the logfile into the

Other Windows
115 © Dingli 17-06-2016 DL11100UM
workspace.
Figure 15-7 GPS window
15.5 Statistics
The Statistics window is used to compute KPIs.
There are two methods to open the statistics window.
Method 1: Click Data, and double-click the statistics icon ( ) corresponding to the logfile under
Network.
Method 2: Click Data, and drag the statistics icon ( ) corresponding to the logfile into the
workspace.
Users may right click Test Data on the statistics window, and choose Select Parameter to select
parameters for statistics, or users may drag data files from the Data List to the blank pane under
Test Data on the Statistics window.
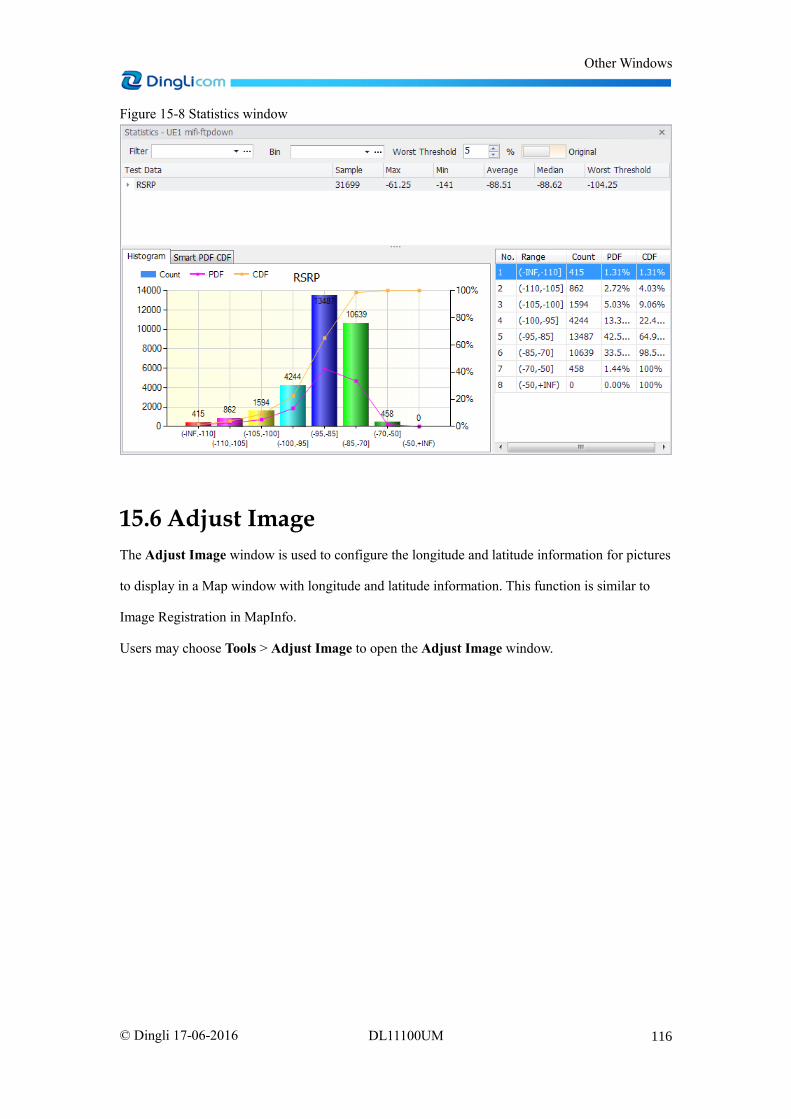
Other Windows
116 © Dingli 17-06-2016 DL11100UM
Figure 15-8 Statistics window
15.6 Adjust Image
The Adjust Image window is used to configure the longitude and latitude information for pictures
to display in a Map window with longitude and latitude information. This function is similar to
Image Registration in MapInfo.
Users may choose Tools > Adjust Image to open the Adjust Image window.

Other Windows
117 © Dingli 17-06-2016 DL11100UM
Figure 15-9 Adjust Image window
Users may perform the following operation in the Adjust Image window:
1. Click the Open File icon to open the picture that needs to be adjusted.
2. Click the Move icon to change the picture's display position.
3. Click the Zoom In icon to zoom in to the picture.
4. Click the Zoom Out icon to zoom out of the picture.
5. Click the Fit View icon to change the picture size automatically and fit the window
6. Click the Add icon , and then click the picture to add longitude and latitude information.

Other Windows
118 © Dingli 17-06-2016 DL11100UM
Figure 15-10 Edit Point window
In the Edit Point window, users may set the parameters based on the following description:
Label is set by default.
Image X and Image Y are set by default, indicating the pixel position.
Coordinate X and Coordinate Y indicate the longitude and latitude respectively, and
must be set in the decimal format, for example, 12.345678.
The added point will be displayed in the text box at the bottom of the Adjust Image window.
Click Delete to delete an added point as required.
Click Insert to add a point. In this case, users need to set the pixel position information
manually. As a result, it is not recommended that users use this method to add a point.
Click Find to find the position corresponding to the point on the list.

Other Windows
119 © Dingli 17-06-2016 DL11100UM
Figure 15-11 Added points in the Adjust Image window
After adding at least three points, click OK to generate a file with the suffix *.tab which will be
saved in the same path as the picture and with the same name as the picture.
If users open the *.tab file, the picture may be opened. The picture and the *.tab file must be in
the same directory and users cannot change the file name.
The figure below shows the *.tab file displayed in the Map window, which may be displayed with
the site simultaneously:

Other Windows
120 © Dingli 17-06-2016 DL11100UM
Figure 15-12*.tab file displayed in the Map window

Configuration
121 © Dingli 17-06-2016 DL11100UM
16 Configuration Users may click Configuration and select Parameter Settings, Signaling Settings, or Event
Settings to perform necessary settings as required; the configuration will affect the entire software.
The Config folder under the Pilot Pioneer installation folder can be copied to other Pioneer's
folder to avoid repetitive configuration.
16.1 Parameter Settings
On the Parameter Settings window, users may set both parameters in the software and legends on
the map window.
On the Menu bar, choose Configuration > Parameter Settings to open the Parameter
Settings window.
Figure 16-1 Parameter settings window
Users may right-click a folder in the navigation pane and perform the following operations:
Move up/down folders
Parameter Settings supports the following operations:
Search/sort parameters
Set parameters to display on the navigation pane. Users may select the check box
corresponding to the parameter under Navigator, and then the parameter will be displayed
on the navigation pane.
Double-click a parameter and rename the parameter
Set the color for specific parameters
Set the parameter range

Configuration
122 © Dingli 17-06-2016 DL11100UM
Right click a parameter under a sub-folder and select Set Category to move the parameter
to another folder.
The following table describes the functional buttons in the Legend window:
Table 27 Functional buttons in the Legend window
Name Description
Copy Copy the threshold range of the current parameter.
Paste Select a parameter and apply the range to the parameter.
Add Add a tab page and display the threshold value.
Delete Delete the tab page of the selected threshold range.
Threshold Name The group name of the threshold.
Unit Set the unit for the parameter value.
Order Set the threshold range order: ascending or descending.
Rule Threshold range Open-close mode: right half-open interval or left half-open
interval.
Sequence & Set Set the sequence for threshold ranges.
Value Type Set threshold modes, including consecutive, discrete, and auto-discrete.
Range Segment the ranges to be consecutive and set colors respectively.
Discrete Apply color to a specific value.
Discrete Auto Pilot Pioneer Expert automatically applies color to parameter ranges.
Recover Restore the default settings.
Shape Set the pattern and size for measurement samples.
Pixel Pixel size of measurement samples
16.2 Message Settings
On the Message Settings window, users may set all signaling messages in the software.
On the Menu bar, choose Configuration > Message Settings to open the Message Settings
window.

Configuration
123 © Dingli 17-06-2016 DL11100UM
Figure 16-2 Message settings window
Users may right-click a folder in the navigation pane and perform the following operations:
Add/Remove sub folders
Move up/down folders
Change the attribute of the folder
Display sub folders in the upper folder
Message Setting supports the following operations:
Search/sort messages
Double-click a message and rename the message
Set colors (text color and background color) for specific messages
Select a message and a window to display the message in the selected window, for
example, select a message and Flow Chart to display the message in the Flow Chart
window
Set messages layer, such as layer 1, layer 2, layer 3
Set message font (bold or italic)
Right click a message under a sub-folder and select Set Category to move the message to
another folder.
16.3 Event Settings
On the Event Settings window, users may set all events in the software.
On the Menu bar, choose Configuration > Event Settings to open the Event Settings window.
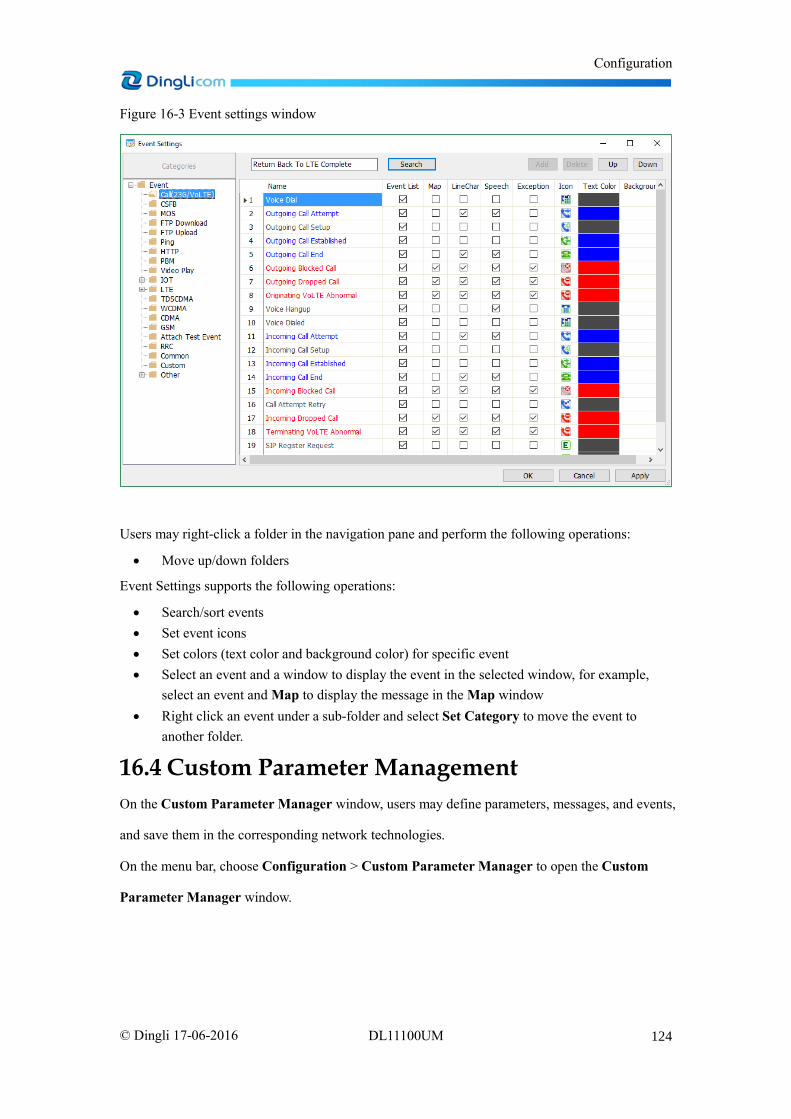
Configuration
124 © Dingli 17-06-2016 DL11100UM
Figure 16-3 Event settings window
Users may right-click a folder in the navigation pane and perform the following operations:
Move up/down folders
Event Settings supports the following operations:
Search/sort events
Set event icons
Set colors (text color and background color) for specific event
Select an event and a window to display the event in the selected window, for example,
select an event and Map to display the message in the Map window
Right click an event under a sub-folder and select Set Category to move the event to
another folder.
16.4 Custom Parameter Management
On the Custom Parameter Manager window, users may define parameters, messages, and events,
and save them in the corresponding network technologies.
On the menu bar, choose Configuration > Custom Parameter Manager to open the Custom
Parameter Manager window.

Configuration
125 © Dingli 17-06-2016 DL11100UM
Figure 16-4 Custom Parameter Manager window
In the corresponding network, double-click the name of the undefined parameter, open the
Expression Editor window, and define the expression of the parameter, event, or message, to
generate a custom parameter.

Configuration
126 © Dingli 17-06-2016 DL11100UM
Figure 16-5 Expression Editor window
1. A maximum of 20 parameters can be defined by users for each network.
2. Users may select functions and operation symbols to customize the parameter expression.
3. Users may find desired parameters, events, and messages in the list, double-click them to
display in the expression edit box.
4. Users may add custom parameters to Pilot Pioneer Expert parameter list, or rename the
custom parameter under corresponding network node.
16.5 Custom Event Manager
On the Custom Event Manager window, users may define events in logical expressions and save
them in the corresponding network technologies.
On the menu bar, choose Configuration > Custom Event Manager to open the Custom Event
Manager window.

Configuration
127 © Dingli 17-06-2016 DL11100UM
Figure 16-6 Custom Event Manager window
Users may perform the following operations in the Custom Event Manager window:
Create, rename, edit, or delete custom events.
Move event up or down.
The Custom Event Edit window is divided into five types since Pilot Pioneer Expert provides
five ways to customize events.
1. Customize an event based on message and parameter logical expression.

Configuration
128 © Dingli 17-06-2016 DL11100UM
Figure 16-7 Customizing events (1)
The following table describes the functional buttons in the Custom Event Edit window (based on
message and parameter logical expression):
Table 28 Functional buttons in the Custom Event Edit window
Name Description
Custom Event
Displays all the messages of the event. The first line is the event name.
Click it to rename the event; double-click it to unfold or fold the
message list.
Selected Messages Messages that are selected.
New Item New item to be added in Custom Event
New New sub item to be added in Custom Event
Delete Item Delete an item in User Event
Select Select the message required by the event
Delete Delete selected messages

Configuration
129 © Dingli 17-06-2016 DL11100UM
Name Description
Expression Parameter expression used to trigger an event
Report Export a custom event
2. Customize an event based on the message/event time interval.
Select two events or messages, and set the interval. If the event/message appears within the time
interval, the custom event will be triggered. If the option of Trigger if Message/Event B does not
appear is selected, the opposite result occurs.
Figure 16-8 Customizing events (2)
3. Customize an event based on logical expression, minimum duration, and number of
occurrences. If the logical expression occurs, minimum duration and the number of
occurrences aligned with what have been set, customized events will be triggered.
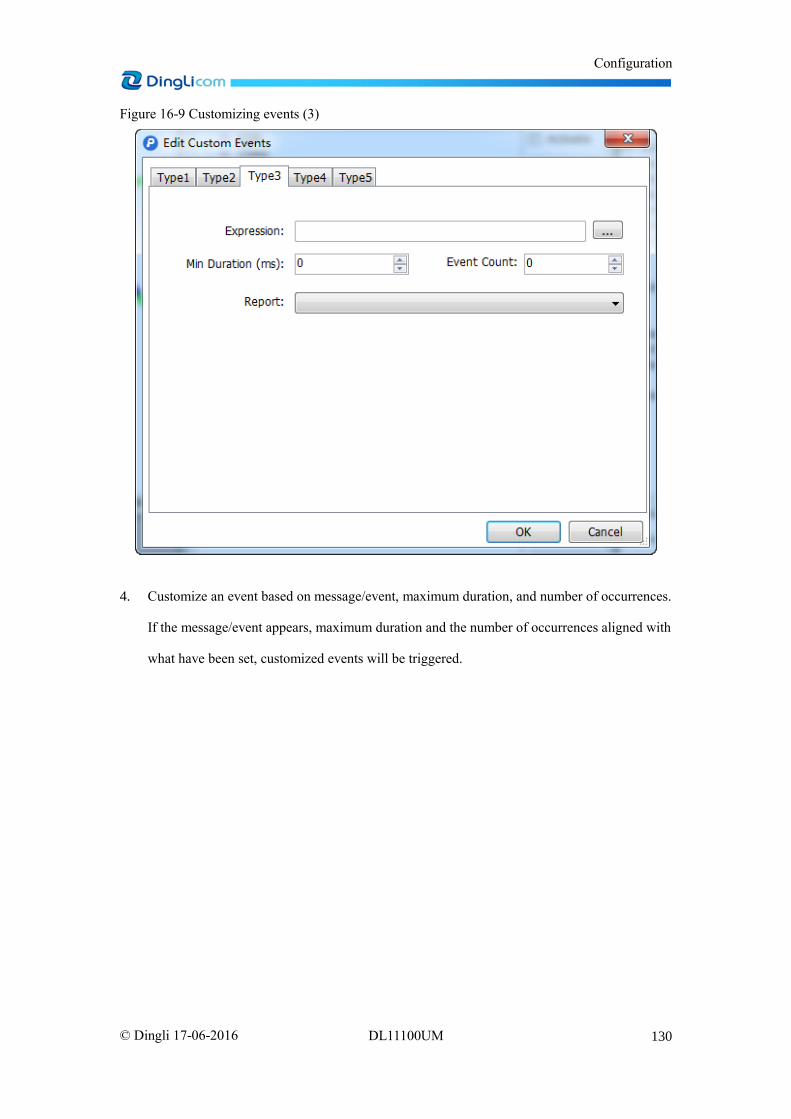
Configuration
130 © Dingli 17-06-2016 DL11100UM
Figure 16-9 Customizing events (3)
4. Customize an event based on message/event, maximum duration, and number of occurrences.
If the message/event appears, maximum duration and the number of occurrences aligned with
what have been set, customized events will be triggered.

Configuration
131 © Dingli 17-06-2016 DL11100UM
Figure 16-10 Customized events (4)
Note: Logo Details indicates the label of event details.
5. Customize an event based on parameter value change, change scope, and network state after
parameter value change. If the parameter value change and network state aligned with what
have been set, customized events will be triggered.

Configuration
132 © Dingli 17-06-2016 DL11100UM
Figure 16-11 Customized events (5)

Statistics Reports
133 © Dingli 17-06-2016 DL11100UM
17 Statistics Reports Pilot Pioneer Expert provides a powerful statistics report module that supports various statistical
methods and reports to meet different user’s requirements. Users may directly use the predefined
template to generate statistics reports, including
Data Service Reports
Voice Service Reports
Scanner Reports
IOT Reports
Custom Reports
Specialized Reports
KPI Statistics Reports
Moreover, users may customize their statistics report template and generate the required reports.
See the figure below:
Figure 17-1 Statistics reports
17.1 Open the Statistics Report Window
Users may click Report on the navigation pane to enter the statistics report window.
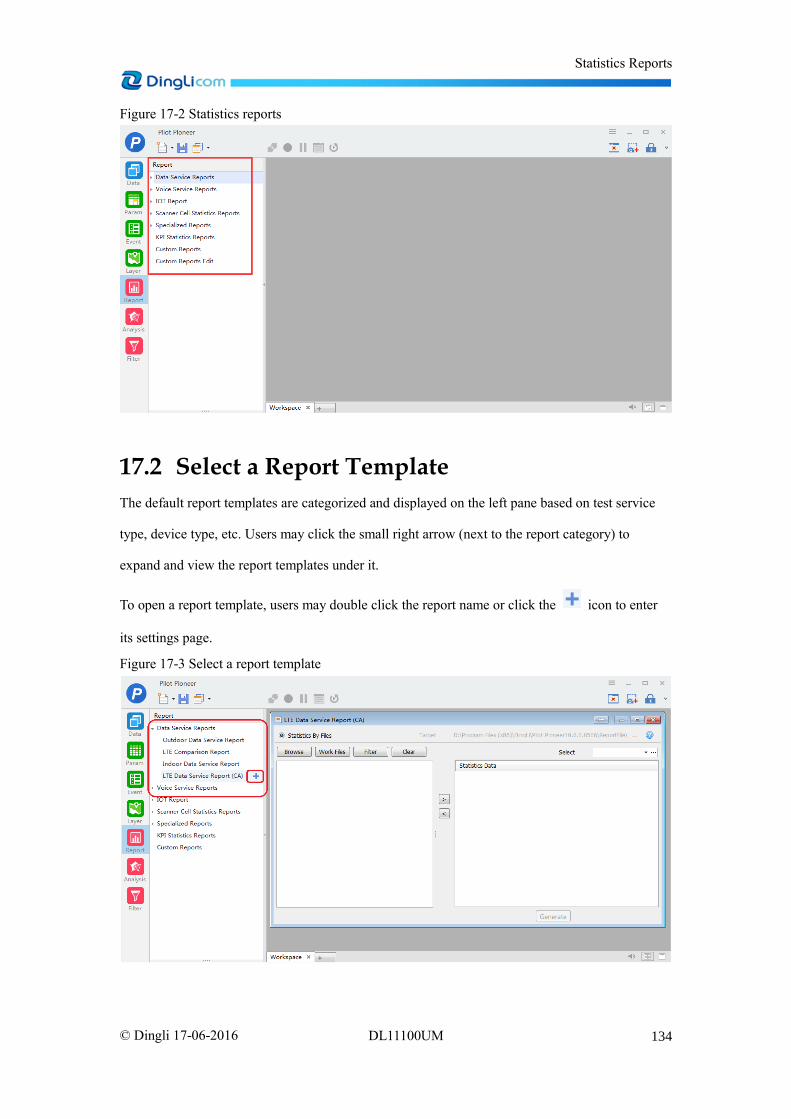
Statistics Reports
134 © Dingli 17-06-2016 DL11100UM
Figure 17-2 Statistics reports
17.2 Select a Report Template
The default report templates are categorized and displayed on the left pane based on test service
type, device type, etc. Users may click the small right arrow (next to the report category) to
expand and view the report templates under it.
To open a report template, users may double click the report name or click the icon to enter
its settings page.
Figure 17-3 Select a report template

Statistics Reports
135 © Dingli 17-06-2016 DL11100UM
Users may click the Open Template icon ( ) on the settings page to view the detailed statistics
KPIs or related algorithm. See the figure below:
Figure 17-4 Open template
17.3 Select Statistics Data Files
Generally, the data files used for the statistical KPIs in the same report are the same, but for some
specific reports, the data files used for statistics may be different, e.g. Benchmarking Report.
Pilot Pioneer Expert provides different scenes configuration for the statistics report that requires
different data files. For example, the figure below shows five scenes (Operator A/B/C/D/E, which
may be customized during template creation) for the 4G Benchmarking Report.
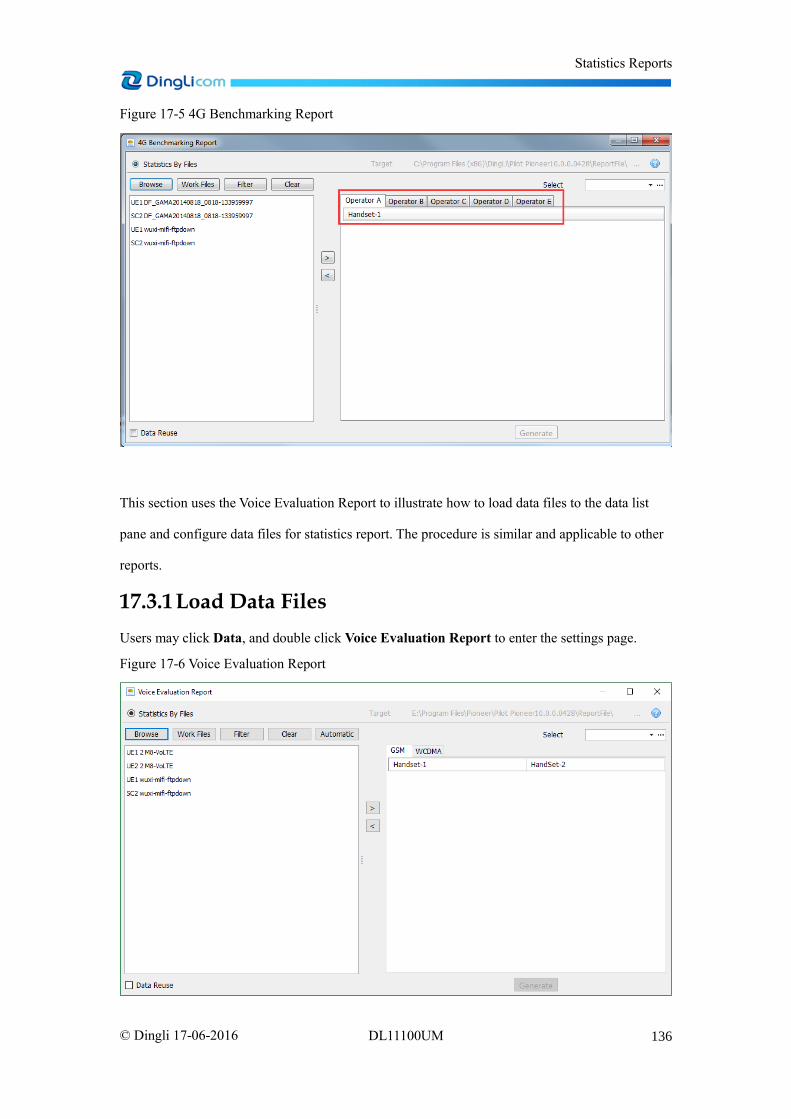
Statistics Reports
136 © Dingli 17-06-2016 DL11100UM
Figure 17-5 4G Benchmarking Report
This section uses the Voice Evaluation Report to illustrate how to load data files to the data list
pane and configure data files for statistics report. The procedure is similar and applicable to other
reports.
17.3.1 Load Data Files
Users may click Data, and double click Voice Evaluation Report to enter the settings page.
Figure 17-6 Voice Evaluation Report

Statistics Reports
137 © Dingli 17-06-2016 DL11100UM
Load data files to the left pane based on the functional button's description below:
• Browse: Users may click Browse to load local data files from the PC and list them on the left
pane.
• Work Files: Users may click Work Files to load data files that have been imported to a
project (data files listed under Data List on the Data tab page).
• Filter: Users may click Filter to filter data files for statistics based on data port, keywords,
device name, or network. When multiple data files have been loaded to the left pane, users
may use this function to quickly find the required data files for statistics.
Figure 17-7 Filter data files
• Clear: Users may click Clear to delete all data files that have been loaded to the left pane.
• Automatic: For some statistics report that requires data pairing (e.g. MO/MT statistics), users
may click Automatic to conduct automatic data paring based on user-defined paring
conditions. This may simplify the manual paring procedure. This function is available only for
the reports that require different data files for different scenes. See the figure below:

Statistics Reports
138 © Dingli 17-06-2016 DL11100UM
Figure 17-8 Automatic data paring
• Data Reuse: If users need to configure the same data file for different scenes, users may
select Data Reuse, and click the right arrow to configure the data file to different scenes as
required.
• Select: Select a filter to generate filtered data files for statistics. Users need to set filters in
advance. For detailed information on filter settings, see section 19.
Users may use the short cut keys "Ctrl+A", "Shift", and "Ctrl" to select multiple data files, or right
click the on the left pane to conduct related operations, e.g. Select All, Deselect All, Inverse Select,
and Delete. See the figure below:

Statistics Reports
139 © Dingli 17-06-2016 DL11100UM
Figure 17-9 Right-click functions
Note: If Handset 1 and Handset 2 are displayed simultaneously on the right pane under a scene,
users need to conduct data pairing.
17.3.2 Configure Data Files for Statistics
After loading data files to the left pane on the report settings page, users may select one or
multiple data files, and click the right arrow button ( ) to add the selected data files to the
statistics pane (right pane) for statistics. To remove a data file from the right pane, click .
17.4 Generate Statistics Reports
1. Generate statistics reports:
After configuring data files for statistics, users may click Generate to generate a
corresponding report. Users may view the report processing progress and processed report
count at the bottom right corner. Users may click the progress bar to view detailed
information.
Note: Pilot Pioneer Expert supports multiple reports' generation simultaneously.

Statistics Reports
140 © Dingli 17-06-2016 DL11100UM
Figure 17-10 Generate statistics reports
2. View statistics results
The statistics report will be automatically opened after successful generation.
In addition, users may view the statistics history at the bottom left corner on the navigation
pane. Users may double click a report name to open the report and view detailed information,
or click the button to enter the directory where the statistics reports are saved.

Statistics Reports
141 © Dingli 17-06-2016 DL11100UM
Figure 17-11 Statistics history
3. Directory for statistics reports
Statistics reports are saved in the in the \ReportFile directory of the software installation path,
which are classified based on the generation date.
Figure 17-12 Directory for statistics reports
17.5 Custom Report
Custom Report is used to generate a customized report based on the customized report template.
The statistics report templates defined by users with Custom Report Edit permissions or those
temporary templates that have not been classified any type will be saved in
\Report\CustomTemplateReport\Excel (in the software installation path), and will be listed
under Custom Reports. Users may enter the Custom Report settings page and select a report
template to generate a corresponding statistics report as required.

Statistics Reports
142 © Dingli 17-06-2016 DL11100UM
Note: Users may import a custom report template or click Custom Report Edit to create a report
template.
Figure 17-13 Custom Report

Analysis
143 © Dingli 17-06-2016 DL11100UM
18 Analysis
18.1 Data Insight
Based on collected test data and cell files, Data Insight is used to locate problems in the tested
networks by analyzing measurement samples, events, parameters, etc.
Users may set different analysis conditions for different scenarios and filter analysis results to
locate problems on cell coverage, interference, events, handover, parameters, etc.
Follow the instructions below:
1. Click Analysis, and double-click Data Insight to enter the settings page. See the figure
below:
Figure 18-1 Data Insight analysis settings page
2. Add logfiles.
Users may click Work Files to import logfiles that have been imported into the software,
click Browse to import local logfiles, or click Delete to delete selected logfiles that have been
added into the left pane.
3. Set Network. Currently, Data Insight supports only LTE Radio Access Network. If the
logfiles imported are not from LTE, the logfiles will be unavailable for selection (greyed out).
4. Select site files.
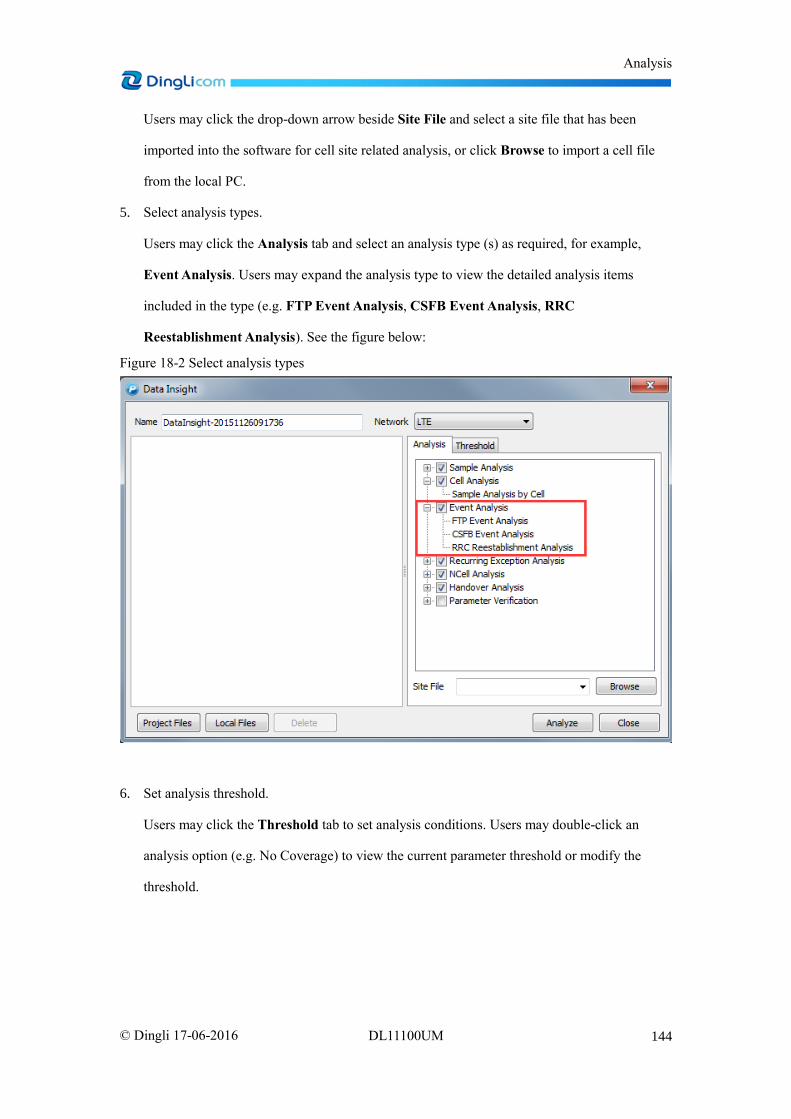
Analysis
144 © Dingli 17-06-2016 DL11100UM
Users may click the drop-down arrow beside Site File and select a site file that has been
imported into the software for cell site related analysis, or click Browse to import a cell file
from the local PC.
5. Select analysis types.
Users may click the Analysis tab and select an analysis type (s) as required, for example,
Event Analysis. Users may expand the analysis type to view the detailed analysis items
included in the type (e.g. FTP Event Analysis, CSFB Event Analysis, RRC
Reestablishment Analysis). See the figure below:
Figure 18-2 Select analysis types
6. Set analysis threshold.
Users may click the Threshold tab to set analysis conditions. Users may double-click an
analysis option (e.g. No Coverage) to view the current parameter threshold or modify the
threshold.

Analysis
145 © Dingli 17-06-2016 DL11100UM
Figure 18-3 Threshold settings
7. Generate and view analysis results.
Click Analyze to generate the analysis result, which is displayed under Data Insight on the
Analysis tab page, and the Table window will be opened by default. The analysis results
include basic information, summary, and the information related to the analysis types selected
in step 5.
Figure 18-4 Analysis results displayed in the navigation pane

Analysis
146 © Dingli 17-06-2016 DL11100UM
Users may right click an analysis result and select Map or Analysis View to view the analysis
result in the Map or Table window, select Export to export the analysis result, or select Filter
to query the analysis settings.
Figure 18-5 Right-click functions
Map: Right click a result and select Map to view the analysis result on the Map window.
Figure 18-6 Map view
Analysis View: Right click a result and select Analysis View to view the analysis result

Analysis
147 © Dingli 17-06-2016 DL11100UM
on the Table window.
Figure 18-7 Table view
Export: Right click a result and select Export to export the result as required.
Filter: Right click a result and select Filter to view the corresponding analysis settings, or
generate a new analysis result based on modified conditions. Users may change the
display size and color for the analysis result on the Map window.
Figure 18-8 Filter
18.2 Measurement over Distance Analysis
Measurement over Distance Analysis is used to check the parameter value that varies along with
the distance between the test point and the site.

Analysis
148 © Dingli 17-06-2016 DL11100UM
To perform Measurement over Distance analysis, do as follows:
1. Click Analysis, and double-click Measurement Over Distance Analysis to open the
Measurement Over Distance Analysis window.
Figure 18-9 Measurement over Distance Analysis window
2. Add logfiles.
Users may click the drop-down arrow corresponding to Data source and select logfiles that
have been imported into the software, or click the button to add local files. If the
logfiles have been successfully added, corresponding logfile name and port information will
be displayed on the title bar. See the figure below:

Analysis
149 © Dingli 17-06-2016 DL11100UM
Figure 18-10 Add logfiles
3. Add parameters.
Users may click the button corresponding to Parameter to add parameters.
Please be aware that the analysis results are based on the maximum, minimum, and average
binning values of the selected parameters. Therefore, for some parameters such as Cell ID,
there will be no values displayed in the results.

Analysis
150 © Dingli 17-06-2016 DL11100UM
Figure 18-11 Select parameters
4. Select a site file.
Users may select a site file from the drop-down list or click the button corresponding
to Site File to add a local site file.
After successfully import a site file, users may click Layer, right click Site or the
corresponding network technology and select Site Data Manager to view the imported site.
See the figure below:

Analysis
151 © Dingli 17-06-2016 DL11100UM
Figure 18-12 Select a site file
5. Set BIN conditions.
6. Click Analysis to generate analysis results. Afterwards, the result will be displayed both in a
line chart and a table. Users may double click a cell or drag a cell to the diagram pane to view
the line chart.
Figure 18-13 Parameter-Distance Analysis result

Analysis
152 © Dingli 17-06-2016 DL11100UM
18.3 Parameter Quadrant Analysis
Parameter Quadrant Analysis is used to observe parameter distribution in each quadrant and
perform network evaluation based on two selected parameters, which are represented on the
X-axis and Y-axis.
Follow the instructions below:
1. Click Analysis, and double-click Parameter Quadrant Analysis to enter the analysis
settings and results display window. See the figure below:
Figure 18-14 Parameter Quadrant Analysis
2. Add logfiles. Users may click the button to add logfiles imported into Pilot Pioneer
Expert or logfiles from the local disks. The added logfiles will be listed in the box under
Logfile.
Figure 18-15 Add logfiles
3. Click the button under Parameter to add parameters. Users need to add two parameters

Analysis
153 © Dingli 17-06-2016 DL11100UM
every time. One is the primary parameter (measurement point with real value) and the other
is the secondary parameter. Users may click the button to change the primary and
secondary parameters. See the figure below:
Figure 18-16 Add parameters
4. Set the origin for the coordinate system. Pilot Pioneer Expert supports three kinds of origin
definition methods: user-defined origin, origin defined by average value, origin defined by
median value. See the figure below:
Figure 18-17 Set the origin for the coordinate system
5. Filter and Bin: This function is used to filter and bin original logfiles. For more information,
see section 19.
Figure 18-18 Filter and Bin
6. Click Generate Result to generate the analysis result which will be displayed on the right
side of the window.
Users may observe parameter distribution, sampling points’ statistics and ratio in each
quadrant based on two selected parameters represented by the X-axis and Y-axis, view the
average value line chart, switch the X and Y axes, rotate the axes horizontally or vertically.
See the figure below:

Analysis
154 © Dingli 17-06-2016 DL11100UM
Figure 18-19 Generate analysis result
Note: Users will need to generate the results again if a new log file is added, parameters are
changed, or the origin is changed.
18.4 Overshooting Analysis
Overshooting Analysis is used to analyze and locate the cell coverage that has exceeded the
predefined region, which may lead to problems such as handover failure, pilot pollution, no
dominant cell, etc.
Users may filter and analyze the measurement samples that are outside the pre-defined conditions,
to identify network problem areas and provide information for optimization activities.
Follow the instructions below:
1. Click Analysis, and double-click Overshooting Analysis to enter the settings page. See the
figure below:

Analysis
155 © Dingli 17-06-2016 DL11100UM
Figure 18-20 Overshooting Analysis settings page
2. Add logfiles.
Users may click Work Files to import logfiles that have been imported into the software,
click Browse to import local logfiles, or click Delete to delete selected logfiles that have been
added into the left pane.
3. Set Network. The software will automatically set the network based on the added logfiles.
Users may select another network type for analysis as required.
4. Select site files.
Users may click the drop-down arrow beside Site File and select a site file that has been
imported into the software for the analysis, or click the button to import a local site file.
5. Set analysis conditions based on the parameter description below:
T1: Set the cell count threshold for overshooting. Only if the cells covered exceed this
specified value and other specified conditions are met, can overshooting be defined.
Distance: Set the distance threshold for overshooting. Only if the distance exceeds this
specified value and other specified conditions are met, can overshooting be defined.
RSRP: Set the RSRP threshold. Only if the RSRP value exceed this specified value and
other specified conditions are met, can overshooting be defined.
6. Generate and view analysis results.

Analysis
156 © Dingli 17-06-2016 DL11100UM
Users may click Analyze to generate corresponding results, which will be loaded under
the Overshooting Analysis node in the navigation.
The analysis result will be automatically displayed in a Table.
Users may right click an analysis result and select Map or Analysis View to view the
analysis result in the Map or Table window, select Export to export the analysis results,
or select Delete to delete the analysis result.
In the Table window, users may click the Table tab to view detailed information,
including RSRP, SINR, distance, sample count, the cell count with overshooting coverage,
etc., or click the Graph tab to view the top 10 cells by overshooting sample ratio.
Figure 18-21 Analysis Results-Table
Figure 18-22 Analysis Results-Graph

Analysis
157 © Dingli 17-06-2016 DL11100UM
Figure 18-23 Analysis Results-Map
18.5 Extended Coverage Analysis
Extended Coverage analysis is used to analyze and locate cells that exceed the pre-defined
distance, optimize network planning and overlapping coverage issues.
Follow the instructions below:
1. Click Analysis, and double-click Extended Coverage Analysis to enter the settings page. See
the figure below:

Analysis
158 © Dingli 17-06-2016 DL11100UM
Figure 18-24 Extended Coverage Analysis settings page
2. Add logfiles.
Users may click Work Files to import logfiles that have been imported into the software,
click Browse to import local logfiles, or click Delete to delete selected logfiles that have been
added into the left pane.
3. Set Network. The software will automatically set the network based on the added logfiles.
Users may select another network type for analysis as required.
4. Select site files.
Users may click the drop-down arrow beside Site File and select a site file that has been
imported into the software for cell site related analysis, or click to import a cell site file
from the local PC.
5. Set analysis conditions based on the parameter description below:
Bin Settings: Set Bin Type and Size for sample filtering based on binning.
Distance: Set the distance threshold for extended coverage. Only if the distance exceeds
this specified value and other specified conditions are met, can extended coverage be
defined.
RSRP: Set the RSRP threshold for extended coverage. Only if the RSRP value exceeds
this specified value and other specified conditions are met, can extended coverage be
defined.

Analysis
159 © Dingli 17-06-2016 DL11100UM
Ratio: Set the extended coverage sample ratio threshold.
6. Generate and view analysis results.
Users may click Analyze to generate corresponding results, which will be loaded under
the Extended Coverage Analysis node in the navigation pane.
Users may right click an analysis result and select Map or Analysis View to view the
analysis result in the Map or Table window, select Export to export the analysis results to
the MS Excel format, or select Delete to delete the analysis result.
The figure below shows the analysis results in the Table window. Users may click the
Detail tab to view detailed information about samples, or click the Total tab to view the
detailed information about the cells and top 10 cells by extended coverage samples.
Figure 18-25 Extended Coverage Analysis results-Table
In the Map window, the samples and cells are displayed in specified colour. For example,
the red samples in the figure below indicate the samples with extended coverage while
the samples in blue indicate those without extended coverage. The cells in red indicate
the cells with extended coverage while the cells without colour indicate those without
extended coverage. Users may click a cell in red to display its cell line linking to the
related samples.
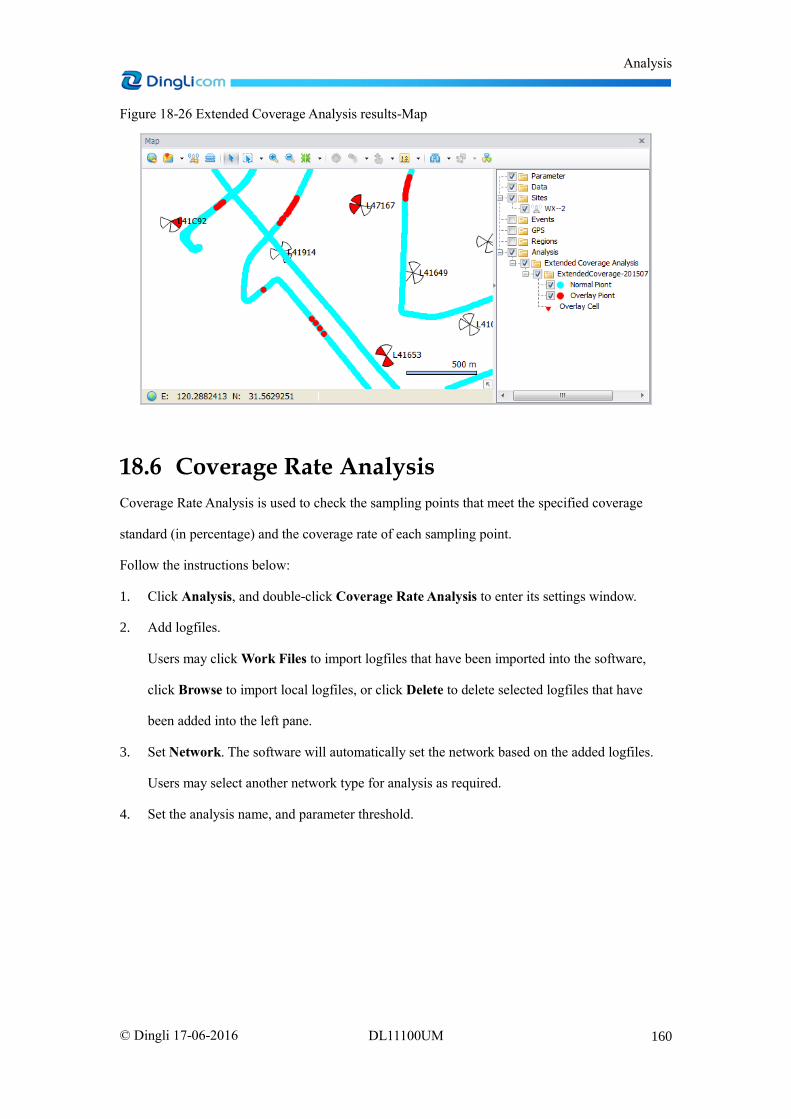
Analysis
160 © Dingli 17-06-2016 DL11100UM
Figure 18-26 Extended Coverage Analysis results-Map
18.6 Coverage Rate Analysis
Coverage Rate Analysis is used to check the sampling points that meet the specified coverage
standard (in percentage) and the coverage rate of each sampling point.
Follow the instructions below:
1. Click Analysis, and double-click Coverage Rate Analysis to enter its settings window.
2. Add logfiles.
Users may click Work Files to import logfiles that have been imported into the software,
click Browse to import local logfiles, or click Delete to delete selected logfiles that have
been added into the left pane.
3. Set Network. The software will automatically set the network based on the added logfiles.
Users may select another network type for analysis as required.
4. Set the analysis name, and parameter threshold.

Analysis
161 © Dingli 17-06-2016 DL11100UM
Figure 18-27 Coverage Rate Analysis settings window
5. Select a Filter or Bin from the drop-down box or click to edit the Filter and Bin
conditions. For more information, see section 19.
Figure 18-28 Filter or Bin function
6. Click Analyze to generate the coverage rate analysis result, which will be loaded under the
Coverage Rate Analysis node in the navigation pane.
The coverage analysis result will be automatically displayed in a table.

Analysis
162 © Dingli 17-06-2016 DL11100UM
Figure 18-29 Coverage rate analysis result (Table)
Users may right click the analysis result in the navigation pane and select Map or
Analysis View to view the analysis result in the Map or Table window, or select Delete to
delete the analysis result.
Figure 18-30 Right-click functions
The results that are displayed in Table include the coverage results of each measurement
sample and the summary information.

Analysis
163 © Dingli 17-06-2016 DL11100UM
Figure 18-31 Table window
Figure 18-32 Coverage rate analysis result (Map)
18.7 Overlapping Coverage Analysis
Overlapping Coverage Analysis is used to perform analysis on cells with overlapping coverage,

Analysis
164 © Dingli 17-06-2016 DL11100UM
which may cause problems on the current servicing cell, such as low coverage signal and low
network resource usage.
Follow the instructions below:
1. Click Analysis, and double-click Overlapping Coverage Analysis to enter its settings
window.
Figure 18-33 Overlapping Coverage Analysis settings window
2. Add logfiles.
Users may click Work Files to import logfiles that have been imported into the software,
click Browse to import local logfiles, or click Delete to delete selected logfiles that have
been added into the left pane.
3. Set Network. The software will automatically set the network based on the added logfiles.
Users may select another network type (only LTE and TD-SCDMA available) for analysis as
required.
4. Set analysis name and parameter threshold for the analysis.
5. Click Analyze to generate the analysis result, which will be loaded under the Overlapping
Coverage Analysis node on the navigation pane.
a. The analysis result will be automatically displayed in a table.

Analysis
165 © Dingli 17-06-2016 DL11100UM
Figure 18-34 Overlapping Coverage Analysis result (Table)
b. Users may right click the analysis result on the navigation pane and select Map or
Analysis View to view the analysis result on the Map or Table window, or select Delete
to delete the analysis result.
Figure 18-35 Right-click functions
c. On the Table window,
The Table tab includes the measurement samples that meet the defined conditions (at
the upper part) and detailed information (at the lower part).
The Chart tab includes the top 10 cells by overlapping coverage sample ratio and
the comparison between normal sample points and those with overlapping coverage.
The statistics tab includes the cell statistics results.

Analysis
166 © Dingli 17-06-2016 DL11100UM
Figure 18-36 Table window
Figure 18-37 Chart window

Analysis
167 © Dingli 17-06-2016 DL11100UM
Figure 18-38 Statistics window
d. On the Map window, the count of cells with overlapping coverage is displayed on the
legend pane.
Figure 18-39 Overlapping Coverage Analysis result (Map)
18.8 Antenna Feeder Reversed Analysis
Based on cell site database and sampling points, Antenna Feeder Reversed Analysis is used to

Analysis
168 © Dingli 17-06-2016 DL11100UM
check if the antenna has been connected inversely, including unidirectional, bidirectional, and
multidirectional inverse.
Follow the instructions below:
1. Click Analysis, and double-click Antenna Feeder Reversed Analysis to enter the settings
page. See the figure below:
Figure 18-40 Antenna Feeder Reversed Analysis settings page
2. Add logfiles.
Users may click Work Files to import logfiles that have been imported into the software,
click Browse to import local logfiles, or click Delete to delete selected logfiles that have been
added into the left pane.
3. Set Network. The software will automatically set the network based on the added logfiles.
Users may select another network type for analysis as required.
4. Set analysis conditions based on the parameter description below:
RxPower: Set the parameter threshold. Select RSRP for LTE, RSCP for CDMA and
WCDMA, and EcIo for EVDO.
Quality: Set the signal quality. Select RSRQ for LTE, EcIo for CDMA and WCDMA,
and C2I for EVDO.

Analysis
169 © Dingli 17-06-2016 DL11100UM
Strength: Set the signal strength. Select RSSI for LTE, CDMA, EVDO, and WCDMA
technologies.
Distance: Set the cell coverage distance in meter.
5. Select site files.
Users may click the drop-down arrow beside Site File and select a site file that has been
imported into the software for the analysis.
6. Generate and view analysis results.
Users may click Analysis to generate corresponding results, which will be loaded under
the Antenna Feed Reversed Analysis node on the navigation pane.
The analysis results will be automatically displayed in a Table.
Users may right click an analysis result and select Map or Analysis View to view the
analysis result in the Map or Table window, or select Delete to delete the analysis result.
Figure 18-41 Antenna Feeder Reversed analysis results
Users may click a result in the table to synchronize the information to the Map windows.

Analysis
170 © Dingli 17-06-2016 DL11100UM
Figure 18-42 Analysis result display-Map
18.9 MOD3 Analysis
Mod3 Analysis is used to analyze Mod3 collision in LTE by exporting information on the
measurement samples position, EARFCN, PCI, RSRP, RSRQ, SINR, PDCP DL Throughput, and
PDCP UL Throughput. This analysis function includes Mod3, Mod6, and Mod30 analysis results.
Follow the instructions below:
1. Click Analysis, and double-click Mod3 Analysis to enter its settings window.

Analysis
171 © Dingli 17-06-2016 DL11100UM
Figure 18-43 Mod3 Analysis settings window
2. Add logfiles.
Users may click Work Files to import logfiles that have been imported into the software,
click Browse to import local logfiles, or click Delete to delete selected logfiles that have
been added into the left pane.
3. Set analysis conditions based on the parameter description below:
RSRP: Set the threshold value for RSRP.
SINR: Set the threshold value for SINR.
RSRP Diff: Set the RSRP difference value between the neighbor cell and the serving
cell.
Distance: Set the distance in meter.
4. Generate and view analysis results.
Users may click Analyze to generate corresponding results, which will be loaded under
the Mod3 Analysis node on the navigation pane.
The analysis result will be automatically displayed in a Table.

Analysis
172 © Dingli 17-06-2016 DL11100UM
Figure 18-44 Mod3 Analysis result (Table)
Users may right click an analysis result conduct relevant operations.
Click an analysis result and select Table to display the Table window, which includes
the parameter summary of each sampling point and Mod analysis details. Users may
filter data by the Mod type.
Figure 18-45 Table window
Right click the analysis result and select Map to display the result in the Map window.
See the figure below

Analysis
173 © Dingli 17-06-2016 DL11100UM
Figure 18-46 Map window
18.10 Pilot Pollution Anlaysis
Based on UE or Scanner test data, Pilot Pollution Analysis is used to analyze the signal strength of
serving and neighbor cells for 3G/4G network technologies. The function analyzes strong cells or
servers that are serving within a given threshold defined by the user for identifying potential
polluters. The conditions used to define Pilot Pollution are:
• Condition 1: The signal strength of the cells exceeds a user-defined threshold.
• Condition 2: The signal strength difference among the cells that meets Condition 1 is
within a user-defined range.
• Condition 3: The count of the cells that meets Condition 2 exceeds a user-defined value.
Pilot Pioneer Expert supports Pilot Pollution analysis for all network technologies except for
GSM.
Follow the instructions below to perform Pilot Pollution analysis:
1. Click Analysis, and double-click Pilot Pollution Analysis to enter its settings window.

Analysis
174 © Dingli 17-06-2016 DL11100UM
Figure 18-47 Pilot Pollution Analysis settings window
2. Add data files.
Users may click Work Files to import data files that have been imported into the software,
click Browse to import local data files, or click Delete to delete selected data files that have
been added into the left pane.
3. Set Network. The software will automatically set the network based on the added data files.
Users may select another network type for analysis as required.
4. Select UE, Scanner, or UE+Scanner as the analysis mode based on the actual situation. If
UE is selected, Scanner data files in the data list will be unavailable and displayed in grey.
5. Set analysis conditions based on the parameter description below:
a. Analysis name: Set an analysis name.
b. Bin Settings: Set Bin type to Time, Distance, or Grid as required, and enter a Bin size.
c. Parameter Threshold:
RSRP: Set the threshold value of RSRQ.
SINR: Set the threshold value of RSRP.
Cell count: Set the cell count threshold that meets the previously defined conditions.
Difference: Set the difference in value between the neighbor cell and the serving cell
based on the selected parameter (e.g. RSRQ.)
Note: The parameters displayed under Parameter Threshold differ based on the selected
network.

Analysis
175 © Dingli 17-06-2016 DL11100UM
d. Rules within Bin Unit:
Use Parameter Average value: use parameter average value to evaluate if pilot
pollution exists in the Bin unit.
Use Sample Ratio: use the ratio of samples with pilot pollution to evaluate if pilot
pollution exists in the Bin unit.
6. Click Analyze to generate the analysis results, which will be loaded under the Pilot
Pollution Analysis function node.
Figure 18-48 Analysis result
The analysis result will be automatically displayed in a table.
Users may right click an analysis result and select Map or Analysis View to view the
analysis result in the Map or Table window, select Export to export the analysis results,
or select Delete to delete the analysis result. For different nodes, the right-click functions
may be different.
Figure 18-49 Right click functions
Users may right-click the Frequency node and select Map to display the information
about polluted cells. Right-click a parameter under Frequency and select Map to display
the values of the specific parameter. See Figure 18-49.

Analysis
176 © Dingli 17-06-2016 DL11100UM
Figure 18-50 Polluted cells
Figure 18-51 Parameter value
Users may right-click the Frequency node and select Table to display the detailed
information about polluted cells. Right-click a parameter under Frequency and select
Table to display the maximum average value of the specific parameter corresponding to
the polluted cells.
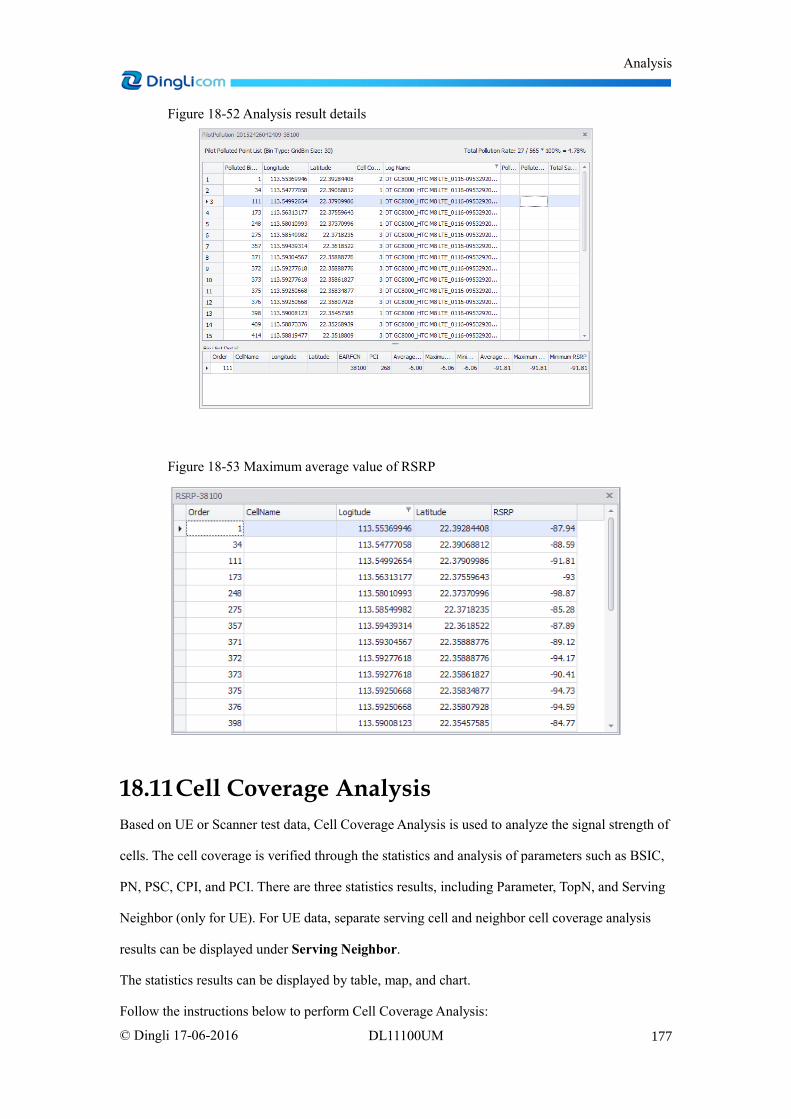
Analysis
177 © Dingli 17-06-2016 DL11100UM
Figure 18-52 Analysis result details
Figure 18-53 Maximum average value of RSRP
18.11 Cell Coverage Analysis
Based on UE or Scanner test data, Cell Coverage Analysis is used to analyze the signal strength of
cells. The cell coverage is verified through the statistics and analysis of parameters such as BSIC,
PN, PSC, CPI, and PCI. There are three statistics results, including Parameter, TopN, and Serving
Neighbor (only for UE). For UE data, separate serving cell and neighbor cell coverage analysis
results can be displayed under Serving Neighbor.
The statistics results can be displayed by table, map, and chart.
Follow the instructions below to perform Cell Coverage Analysis:
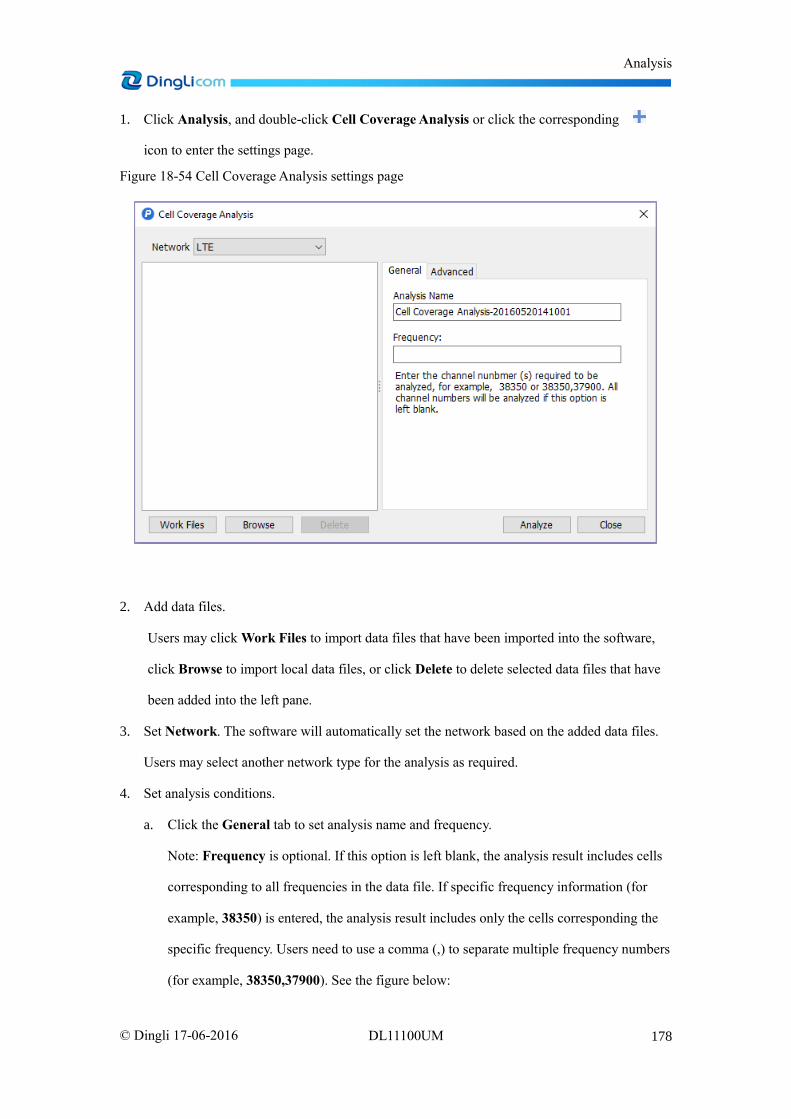
Analysis
178 © Dingli 17-06-2016 DL11100UM
1. Click Analysis, and double-click Cell Coverage Analysis or click the corresponding
icon to enter the settings page.
Figure 18-54 Cell Coverage Analysis settings page
2. Add data files.
Users may click Work Files to import data files that have been imported into the software,
click Browse to import local data files, or click Delete to delete selected data files that have
been added into the left pane.
3. Set Network. The software will automatically set the network based on the added data files.
Users may select another network type for the analysis as required.
4. Set analysis conditions.
a. Click the General tab to set analysis name and frequency.
Note: Frequency is optional. If this option is left blank, the analysis result includes cells
corresponding to all frequencies in the data file. If specific frequency information (for
example, 38350) is entered, the analysis result includes only the cells corresponding the
specific frequency. Users need to use a comma (,) to separate multiple frequency numbers
(for example, 38350,37900). See the figure below:

Analysis
179 © Dingli 17-06-2016 DL11100UM
Figure 18-55 Analysis conditions settings
b. Click Advanced to set Filter and Bin.
For detailed information about the settings of filtering and bin, see section 19 and 20.
Users may click the drop-down arrow beside Site File and select a site file that has been
imported into the software for cell site related analysis.
Figure 18-56 Advanced tab page
5. Click Analyze to generate the analysis result, which will be loaded under the Cell Coverage

Analysis
180 © Dingli 17-06-2016 DL11100UM
Analysis function node.
a. The analysis result will be automatically displayed.
b. For UE data analysis result, there are three types of analysis details. Here we use LTE to
illustrate the results.
Parameter for PCI: List the analysis details by parameters of all cells, which is
identified by frequency + scrambling code.
Figure 18-57 Parameter for PCI
TopN for PCI: List the topN (e.g. top 1st , top 2nd , and top 3rd ) signal strength by
parameter.
Figure 18-58 TopN for PCI

Analysis
181 © Dingli 17-06-2016 DL11100UM
Serving Neighbor for PCI: List the analysis details for serving cells and neighbor
cells.
Figure 18-59 Serving Neighbor for PCI
c. Users may right-click a result node and conduct relevant operations as required.
Figure 18-60 Right-click functions
Right-click an end node and select Map to display the analysis result by map.

Analysis
182 © Dingli 17-06-2016 DL11100UM
Figure 18-61 Analysis result by map
Right-click an end node and select Table to display the analysis result by table.
There are two kinds of parameters included in the table: primary parameter and
secondary parameters. The parameter, which name is the same as the corresponding
node is the primary parameter and other parameters are the secondary parameters.
The value of the primary parameter is an actual collected value while the values of
secondary parameters may be the actual collected value or a duplicated value from
the previous sample.
Figure 18-62 Analysis result by table

Analysis
183 © Dingli 17-06-2016 DL11100UM
Right-click an end node and select Statistics to display the analysis result by chart.
Figure 18-63 Analysis result by chart
18.12 Cell Statistics and Analysis
Based on test logfiles and site files, Cell Statistics and Analysis is used to perform statistics and
analysis of parameters, KPIs, events, cell coverage, etc., for the serving cells.
Follow the instructions below to perform Cell Statistics and Analysis:
1. Click Analysis, and double-click Cell Statistics and Analysis to enter its settings window.

Analysis
184 © Dingli 17-06-2016 DL11100UM
Figure 18-64 Cell Statistics and Analysis settings window
1. Add logfiles.
Users may click Work Files to import logfiles that have been imported into the software,
click Browse to import local logfiles, or click Delete to delete selected logfiles that have
been added into the left pane.
2. Select network technology for analysis. Users may select multiple network technologies.
3. Set analysis conditions.
Analysis Name: Set the analysis name.
Site File: Users may click the drop-down arrow beside Site File and select a site file that
has been imported into the software for the analysis
Coverage radius threshold: Set the threshold of coverage radius.
Coverage Distance Range: Set coverage distance. Use the comma symbol to separate
multiple distances.
Coverage Ratio Parameter: Select parameters for coverage ratio calculation.
4. Click the Parameter tab to select parameters for statistics.

Analysis
185 © Dingli 17-06-2016 DL11100UM
Figure 18-65 Select parameters
5. Click the Event tab to select events for statistics. Users may select an event type and add the
events to the right pane.

Analysis
186 © Dingli 17-06-2016 DL11100UM
Figure 18-66 Select events
6. Click Analyze to generate the analysis result, which will be loaded under the Cell Statistics
and Analysis node in the navigation pane.
The analysis result will be automatically displayed in a table.
Users may right click an analysis result and select Analysis View to view the analysis
result in the Table window, or select Delete to delete the analysis result.
The Table window includes information about cells with frequency, cell coverage
distance, service duration, service distance, event statistics, parameter statistics, etc. see
the figure below:

Analysis
187 © Dingli 17-06-2016 DL11100UM
Figure 18-67 Cell Statistics and Analysis result
18.13 MO/MT Union Analysis
MO/MT Union analysis is added in this version to analyze the complete call details between MOC
and MTC.
This function is used to analyze:
RF parameters
Call messages
Call events
Call delay
as well as to locate potential network problems (e.g. blocked call, dropped call, etc.).
Follow the instructions below:
1. Click Analysis, and double-click MO/MT Union Analysis to enter the settings page. See the
figure below:

Analysis
188 © Dingli 17-06-2016 DL11100UM
Figure 18-68 MO/MT Union analysis settings page
2. Add logfiles.
Users may click Work Files to import logfiles that have been imported into the software,
click Browse to import local logfiles, or click Delete to delete selected logfiles that have
been added into the left pane.
Users need to click the button to move selected files (in pairs) to the right pane for MO
and MT devices respectively.
3. Click Analyze to generate corresponding analysis results, which will be loaded under the
MO/MT Union Analysis node in the navigation pane.
The analysis result will be automatically displayed in Table.
Users may right click an analysis result and select Map or Analysis View to view the
analysis result in the Map or Table window, select Export to export the analysis result,
or select Delete to delete the analysis result.
On the Table window:
The upper part displays the call details, including call type, call result, exception
causes, established delay, CSFB delay, etc.
The middle part displays the detailed call process and messages of the selected call
test.
The lower part displays the delay statistics by chart.

Analysis
189 © Dingli 17-06-2016 DL11100UM
Figure 18-69 View MO/MT Union Analysis results-Table
Users may right-click a result and select Map to display the analysis result by map.
Figure 18-70 View MO/MT Union Analysis results-Map

Analysis
190 © Dingli 17-06-2016 DL11100UM
18.14 CSFB Exception Analysis
CSFB Exception analysis is used to provide detailed information about the exception occurrence
time, location, possible reasons, and troubleshooting solution, and in addition, provide summary
information.
Follow the instructions below:
1. Click Analysis, and double-click CSFB Exception Analysis to enter its settings window.
Figure 18-71 CSFB Exception Analysis window
2. Add logfiles.
Users may click Work Files to import logfiles that have been imported into the software,
click Browse to import local logfiles, or click Delete to delete selected logfiles that have
been added into the left pane.
3. Click Analyze to generate CSFB exception analysis result, which will be loaded under the
CSFB Analysis node on the navigation pane.
The analysis result will be automatically displayed in Table.
Users may right click an analysis result and select Analysis View to view the analysis
result in the Table window, or select Delete to delete the analysis result.
The Summary tab page displays summarized analysis result, and supports result display
in bar/pie chart or percentage mode.

Analysis
191 © Dingli 17-06-2016 DL11100UM
The Detail tab page displays the detailed information about each abnormal sampling
point, including longitude and latitude, time, cell information before and after the
network falls back to 2G/3G network technologies.
Figure 18-72 CSFB exception analysis result
Figure 18-73 Analysis result details
18.15 Delay Analysis
Delay Analysis is added in this version to analyze the service test based on user-defined events or
messages' sequence. For example, a Call Delay means the actual duration between the call request
and call connection has exceeded the specified time. This may affect users' experience, so it is an

Analysis
192 © Dingli 17-06-2016 DL11100UM
important reference for network quality verification. Users may define the conditions for the
analysis, such as message or event order, counts, threshold, and filter conditions.
Follow the instructions below:
1. Click Analysis, and double-click Delay Analysis to enter the settings page. See the figure
below:
Figure 18-74 Delay Analysis settings page
2. Add logfiles.
Users may click Work Files to import logfiles that have been imported into the software,
click Browse to import local logfiles, or click Delete to delete selected logfiles that have been
added into the left pane.
3. Set analysis conditions.
Users may click to add analysis conditions. See the figure below:

Analysis
193 © Dingli 17-06-2016 DL11100UM
Figure 18-75 Set analysis conditions
Delay Name: Enter a name for the delay analysis.
Message: Click it to select a message or multiple messages to define the delay conditions.
Event: Click it to select an event or multiple events to define the delay conditions.
: Click the buttons to change the order of the selected message or event, or
delete a message or event.
: Select more than one message or event from the left pane and then click this
button to add conditions to the right pane.
When users add multiple message/event conditions, Pilot Pioneer Expert will list
them and define the start message/event and end message/even by default (e.g. 1-2,
2-3).
Users may customize the start message/event and end message/event, and click this
button to add the condition to the right pane.
Users may click the delay name and modify it.
: Click the button to delete an added condition from the right pane.
Valid Condition: Set the delay validity for Delay Range. Unit: ms.
Frequency: Set the Count to define the number of occurrences of the specified
Event/Message, within the given time range set in Duration.
OK: Click it to save the defined conditions.
4. Click to delete a selected delay condition group.
5. Click to view and edit a selected delay condition group.
6. Select a Delay name and then click Analyze to generate the analysis results, which will be

Analysis
194 © Dingli 17-06-2016 DL11100UM
loaded under the Delay Analysis node in the navigation pane.
The analysis result will be automatically displayed in Table.
One delay analysis may include multiple delay conditions and corresponding delay
analysis results will be displayed on the navigation pane as a sub node. The right-click
functions may differ based on nodes.
Figure 18-76 Analysis results
Users may right click an analysis result and select Map or Analysis View to view the
analysis result in the Map or Table window, or select delete to delete the analysis result.
Figure 18-77 Right-click functions
The Table window consists of statistics for each threshold, statistics displayed with graph,
the time information about key events, and detailed delay results.
Users may click the drop-down arrow to switch the analysis results between different
conditions.
Users may click the icon to modify the current threshold value and display
mode. See the figure below:

Analysis
195 © Dingli 17-06-2016 DL11100UM
Figure 18-78 Table Window
The figure below shows the analysis results displayed in the Map window:
Figure 18-79 Delay analysis result- Map

Data Filtering
196 © Dingli 17-06-2016 DL11100UM
19 Data Filtering This function is used to filter data with multiple predefined conditions based on parameter, time,
region, state, and conditions range. This greatly facilitates data analysis.
Figure 19-1 Filter
19.1 Filter Management
19.1.1 Add a Filter
Users may click Filter to enter Filter window. See the figure below:

Data Filtering
197 © Dingli 17-06-2016 DL11100UM
Figure 19-2 Filter
To define a filter, follow the instructions below:
1. Doulbe-click Parameter or hover the cursor over Parameter and click the icon in the
position marked as 1 in the figure below.
2. Define filter conditions as required in the page that appears, e.g. define the filter name in the
position marked as 2 and define the expression as the filter condition in the position marked as
3.
3. Click Save to save the settings. The defined conditions will be dispalyed in the position
marked as 5 in the figure below.

Data Filtering
198 © Dingli 17-06-2016 DL11100UM
Figure 19-3 Define filter conditions
Users may repeat the steps above to define filters by other conditions, e.g. time, state, etc.
19.1.2 Edit/Delete a Filter
Users may edit or delete a created filter.
Figure 19-4 Filter management
1. Edit: Double-click or click the icon to edit the filter conditions. If users change the

Data Filtering
199 © Dingli 17-06-2016 DL11100UM
filter name, a new filter will be generated and displayed under Parameter.
2. Delete: Click the icon to delete the selected filter.
19.2 Condition Types
Users may define a filter based on seven condition types, including
• By Parameter
• By Time
• By Region
• By State
• By Condition Range
• Business
• Combination
19.2.1 Parameter
This type is to filter data based on parameter value range. For example, users may filter data based
on the condition "RSRP>-100" or "RSRP>-100 AND RSRQ>-12".
Users may double click Parameter or click the icon to enter the settings page. See the
figure below:

Data Filtering
200 © Dingli 17-06-2016 DL11100UM
Figure 19-5 Filter by parameter
1. Name: The name set here will be displayed in the filter list on the Filter window. The
software will provide a default name, and users may change it as required.
2. Available Parameters: All supported parameters are listed under Available Parameter based
on network technology. Users may enter keywords to search parameters, and double-click a
parameter to add it into the pane under Expression to define conditions.
3. Operation symbols:
• Simple operational symbols: +, -, *, /, =, >, <, >=, <=
• !=: not equal to
• AND: means "together". Example: If A is TRUE and B is TRUE at the same time, then
"(A)AND(B)" is TRUE. In any other case, "(A)AND(B)" is FALSE.
• OR: means "any". Example: If any of A or B is TRUE, then "(A)OR(B)" is TRUE. If
both A and B are FALSE, the "(A)OR(B)" is FALSE.
• XOR: If both A and B are FALSE or TRUE at the same time, then "(A)XOR(B)" is
FALSE. Otherwise, "(A)XOR(B)" is TRUE.
• NOT: means opposite or contrary. Example: If A is TRUE, then "NOT(A)" is FALSE e;
If A is FALSE, then "NOT(A)" equals is TRUE.

Data Filtering
201 © Dingli 17-06-2016 DL11100UM
• Invalid Value: means no value. For example, no value is obtained for some parameters at
the start of the data file. Please note that invalid value is different from parameter value
"0". Invalid value is displayed as "-9999" in the software.
4. Logical expression: The logical expression consists of parameters, operational symbols (such
as "+", "-", and "="), comparison operators (such as ">", "<", and ">="), logical operators
(such as "AND", "OR", and "NOT"), etc. Examples:
• ([RSRP]>-100)AND([RSRQ]>-12): to filter data where the RSRP value is greater than
-100 and the RSRQ value is greater than -12.
• (([RSRP]>-110)AND([RSRP]<-80))AND(([RSRQ]>-14)AND([RSRQ]<-8)): to filter
data where the RSRP value is greater than -100 but less than -80 and the RSRQ value is
greater than -14 but less than -8.
19.2.2 Time
This type is to filter data based on time range (UE time or PC time). Users may set the start
date/time and end date/time for data filtering.
Users may double click Time or click the icon to enter the settings page. See the figure
below:
Figure 19-6 Filter by time
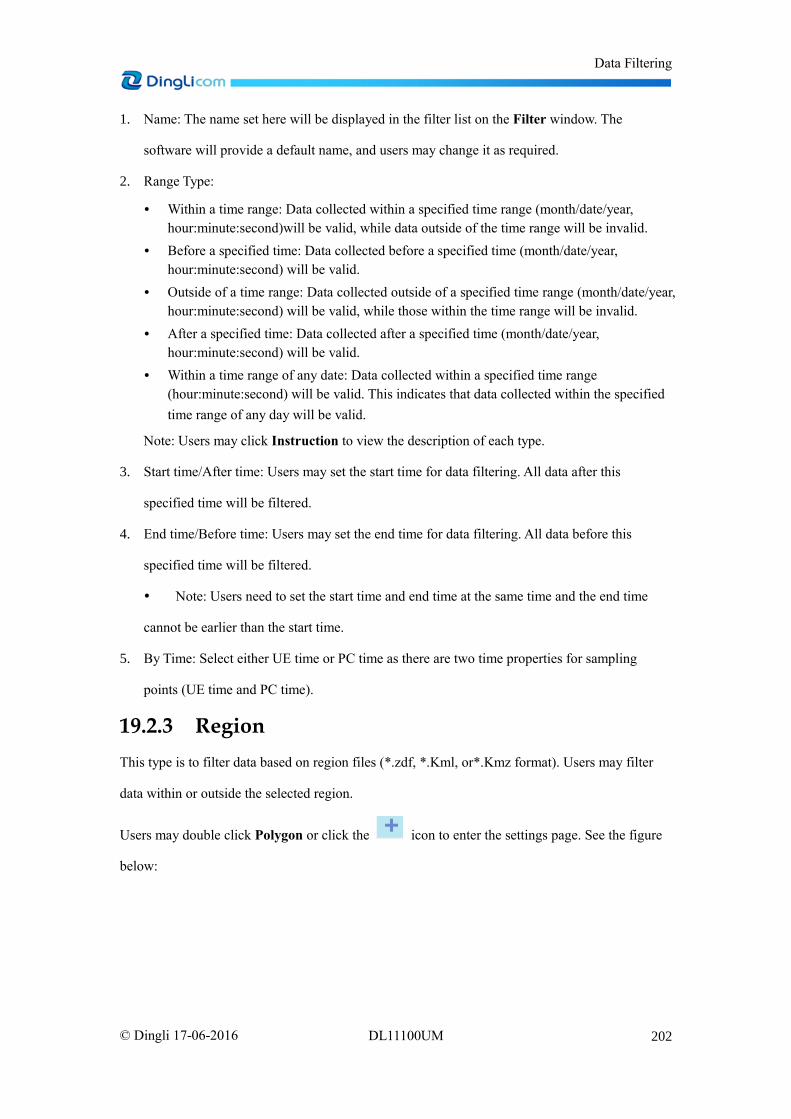
Data Filtering
202 © Dingli 17-06-2016 DL11100UM
1. Name: The name set here will be displayed in the filter list on the Filter window. The
software will provide a default name, and users may change it as required.
2. Range Type:
• Within a time range: Data collected within a specified time range (month/date/year,
hour:minute:second)will be valid, while data outside of the time range will be invalid.
• Before a specified time: Data collected before a specified time (month/date/year,
hour:minute:second) will be valid.
• Outside of a time range: Data collected outside of a specified time range (month/date/year,
hour:minute:second) will be valid, while those within the time range will be invalid.
• After a specified time: Data collected after a specified time (month/date/year,
hour:minute:second) will be valid.
• Within a time range of any date: Data collected within a specified time range
(hour:minute:second) will be valid. This indicates that data collected within the specified
time range of any day will be valid.
Note: Users may click Instruction to view the description of each type.
3. Start time/After time: Users may set the start time for data filtering. All data after this
specified time will be filtered.
4. End time/Before time: Users may set the end time for data filtering. All data before this
specified time will be filtered.
Note: Users need to set the start time and end time at the same time and the end time
cannot be earlier than the start time.
5. By Time: Select either UE time or PC time as there are two time properties for sampling
points (UE time and PC time).
19.2.3 Region
This type is to filter data based on region files (*.zdf, *.Kml, or*.Kmz format). Users may filter
data within or outside the selected region.
Users may double click Polygon or click the icon to enter the settings page. See the figure
below:

Data Filtering
203 © Dingli 17-06-2016 DL11100UM
Figure 19-7 Filter by region
1. Name: The name set here will be displayed in the filter list on the Filter window. The
software will provide a default name, and users may change it as required.
2. Region Files: Users may click Import to import one or more region files (*.kml, *.kmz, and
*.zdf files). Pilot Pioneer Expert will find the union set of the files and filter data based on the
union set.
3. Filter data outside the union set: Users may select this option to filter data outside the union
set. Pilot Pioneer Expert filter data within the union set by default.
Note: Union set indicates the set of all distinct elements in the collection. For example, the
union set of two region files A and B is the collection of regions which are in A or in B or in
both A and B.

Data Filtering
204 © Dingli 17-06-2016 DL11100UM
19.2.4 State
Users may define conditions (with events, parameters, or messages) and specify the state of a
main condition as Open or Close. If a main condition specified as Open is triggered, then the
software begins to filter data based on the condition and stop filtering data when a main condition
specified as Close is triggered.
Figure 19-8 Open and Close state
Note: The default state of a condition is Close.
There are two kinds of conditions: Main condition and sub condition. One main condition may
consist of multiple sub conditions. Users may add multiple main conditions and specify their
statuses as Open or Close. A "state" will be triggered (e.g. open/close) if all the specified main
conditions are met.
Users may double click State or click the icon to enter the settings page. See the figure
below:

Data Filtering
205 © Dingli 17-06-2016 DL11100UM
Figure 19-9 Filter by state
1. Name: The name set here will be displayed in the filter list on the Filter window. The
software will provide a default name, and users may change it as required.
2. Main condition: Users may add multiple main conditions and specify their statuses as Open
or Close.
• Add: to add a main condition.
• Delete: to delete a main condition. All the sub conditions included in this main condition
will be deleted.
• Self-Terminate: If this option is selected, the main condition state will be automatically
changed to Close when a main condition is not met any more. In this case, users do not

Data Filtering
206 © Dingli 17-06-2016 DL11100UM
need to specify a Close state with conditions.
3. Sub condition: Only when all sub conditions are met can the specified state of the
corresponding main conditions be valid.
Users may click the Add button and add three kinds of sub conditions:
Figure 19-10 Sub conditions types
• Parameter: to add conditions based on logical expressions with parameters. Users may
refer to section 5.2.1 to add a condition based on parameters.
Figure 19-11 By parameter
• Parameter change: to add conditions based on parameter value change or parameter value
change from one specified value to another specified value.

Data Filtering
207 © Dingli 17-06-2016 DL11100UM
Figure 19-12 Parameter change condition
• Event and message: to add conditions with a single message or event.

Data Filtering
208 © Dingli 17-06-2016 DL11100UM
Figure 19-13 By message/event
4. Validity Options: If the duration of an Open state’s main condition is less than the value
specified by this option, the Open state will be considered invalid. For example, if users set
the main condition as RxLevel Sub > -85, and Type under Validity Options to Time, Size to
10, then only when the parameter value is more than -85 for at least 10 seconds, can the
specified state be valid.
Figure 19-14 Validity options
Note: If NONE is selected, there will be no limitation on the duration of a state.
When setting conditions by state, users need to pay attention to the following items:
• If multiple main conditions are defined as Open, only the one that is closest to the main
condition defined as Close takes effect.

Data Filtering
209 © Dingli 17-06-2016 DL11100UM
• Users need to define a main condition as Close or select Self-Terminate. Otherwise, the
filter will not filter the data.
• If users add a condition based on the parameter value, the state can be triggered only
when the value changes from the situation where the value does not to meet the specified
condition to the situation where the value meet the specified condition.
19.2.5 Condition Range
This is to filter data based on specified condition range (before, after, or after and before a
specified condition, which is similar as the sub conditions in the State type).
There are three factors in the Condition Range filter:
Condition: a specific parameter, event, message, or an expression defined by parameter,
event, and/or message
Direction: before the conditions triggered, after the condition triggered, or before and
after the condition triggered
Validity type: time (unit: s), distance (unit: m), or measurement samples (unit: count)
Users may double click Condition Range or click the icon to enter the settings page. See
the figure below:
Figure 19-15 Filter by Condition Range
1. Name: The name set here will be displayed in the filter list on the Filter window. The
software will provide a default name, and users may change it as required.
2. Trigger Condition: Users may select a type (e.g. Event Message) and then click Edit to add a
condition. Users can add only one condition type here. This operation is similar with that for

Data Filtering
210 © Dingli 17-06-2016 DL11100UM
adding a sub condition in section 19.2.4. Users may refer to the section for more information.
3. Range Options: Users may specify the condition’s range after the trigger condition is defined.
• Direction: specifies direction. Options, Before, After, After & Before.
• Type: specifies unit. Options: by Sampling Point, Time, or Distance.
• Size: specifies time/distance/sampling point size based on the specified Type.
Example:
To filter all sampling points 2 seconds before Tracking Area Update Failure, users need to set
Type under Trigger Condition to Event Message, click Edit to select Tracking Area
Update Failure, set Direction to Before, Type under Range Options to Time, and Size to 2.
See the figure below:
Figure 19-16 Set conditions
Note: If a defined trigger condition (e.g. RSRP < -100) is met within a duration, the software will
filter data before or after the duration based on the specified direction (e.g. Before or After), but
not before or after a specific sampling point that meets the condition.
19.2.6 Service
This type is to filter data based on test services (e.g. FTP Download) or test services with
additional conditions (FTP Download & FTP DL Throughput > 10 Mbps).
Users may double click Business or click the icon to enter the settings page. See the figure
below:
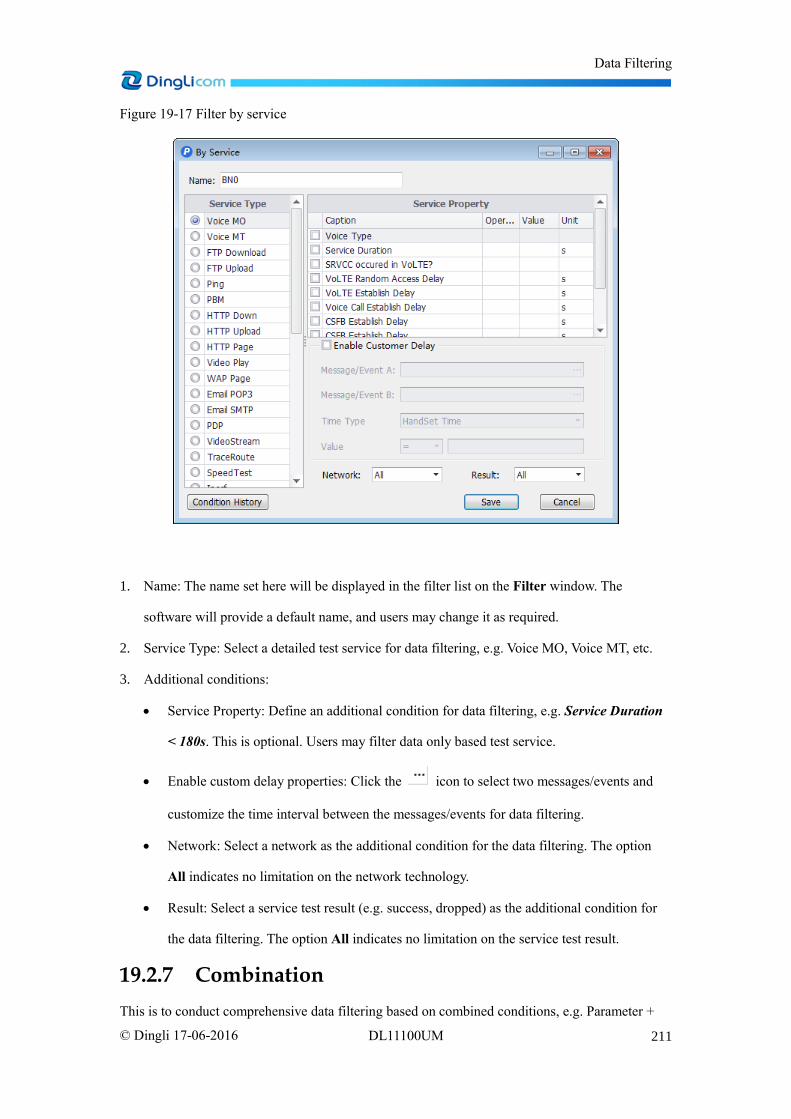
Data Filtering
211 © Dingli 17-06-2016 DL11100UM
Figure 19-17 Filter by service
1. Name: The name set here will be displayed in the filter list on the Filter window. The
software will provide a default name, and users may change it as required.
2. Service Type: Select a detailed test service for data filtering, e.g. Voice MO, Voice MT, etc.
3. Additional conditions:
Service Property: Define an additional condition for data filtering, e.g. Service Duration
< 180s. This is optional. Users may filter data only based test service.
Enable custom delay properties: Click the icon to select two messages/events and
customize the time interval between the messages/events for data filtering.
Network: Select a network as the additional condition for the data filtering. The option
All indicates no limitation on the network technology.
Result: Select a service test result (e.g. success, dropped) as the additional condition for
the data filtering. The option All indicates no limitation on the service test result.
19.2.7 Combination
This is to conduct comprehensive data filtering based on combined conditions, e.g. Parameter +

Data Filtering
212 © Dingli 17-06-2016 DL11100UM
Time + Service.
Users may double click Combination or click the icon to enter the settings page. See the
figure below:
Figure 19-18 Filter by combined conditions
1. Name: The name set here will be displayed in the filter list on the Filter window. The
software will provide a default name, and users may change it as required.
2. Logical operators: Logical operators to define the relationship between different filter
conditions, including "(", ")", "AND", "OR", ">>", "<<", and "NOT". Users may click
Instructions to view the detailed description of these operators. For details, see section 19.3.
3. Define combined conditions: Users may directly drag filters (e.g. PM1 under Parameter, and
TM0 under Time) to the blank pane here, and click AND to define the relationship between
the filter PM1 and filter TM0. The modifications on the original conditions (PM1 and TMO)
have no impact on the conditions added here, and vice versa.
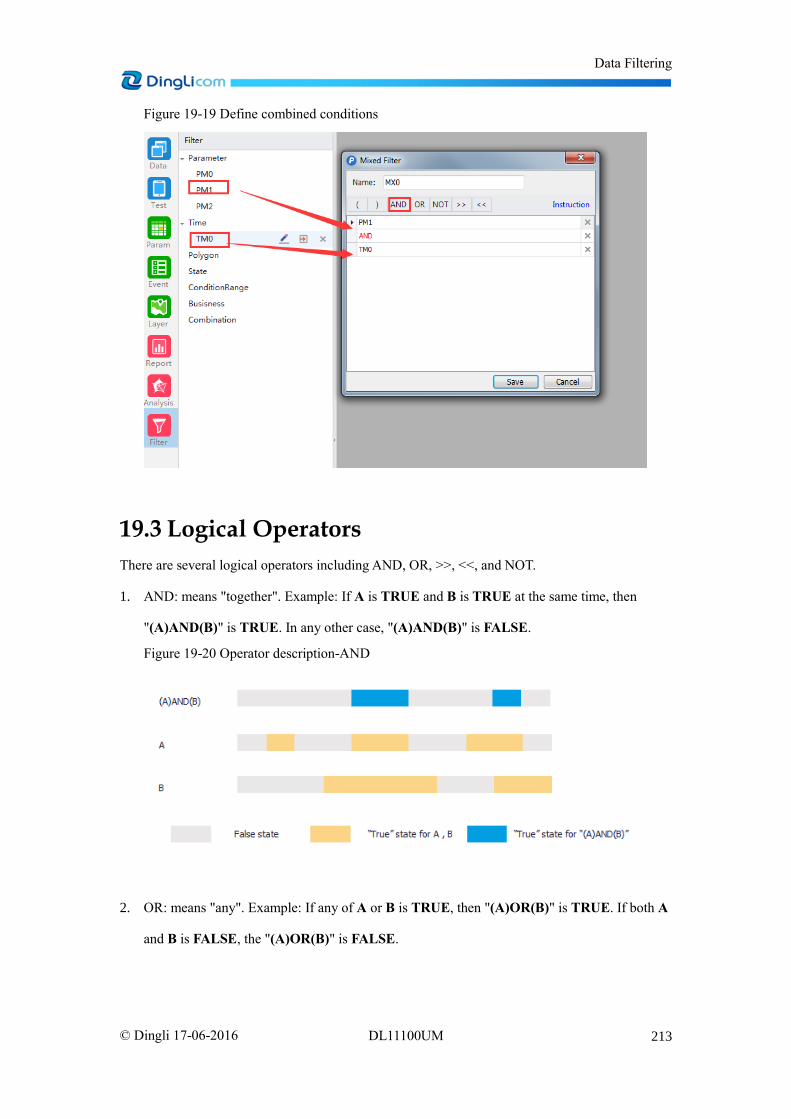
Data Filtering
213 © Dingli 17-06-2016 DL11100UM
Figure 19-19 Define combined conditions
19.3 Logical Operators
There are several logical operators including AND, OR, >>, <<, and NOT.
1. AND: means "together". Example: If A is TRUE and B is TRUE at the same time, then
"(A)AND(B)" is TRUE. In any other case, "(A)AND(B)" is FALSE.
Figure 19-20 Operator description-AND
2. OR: means "any". Example: If any of A or B is TRUE, then "(A)OR(B)" is TRUE. If both A
and B is FALSE, the "(A)OR(B)" is FALSE.
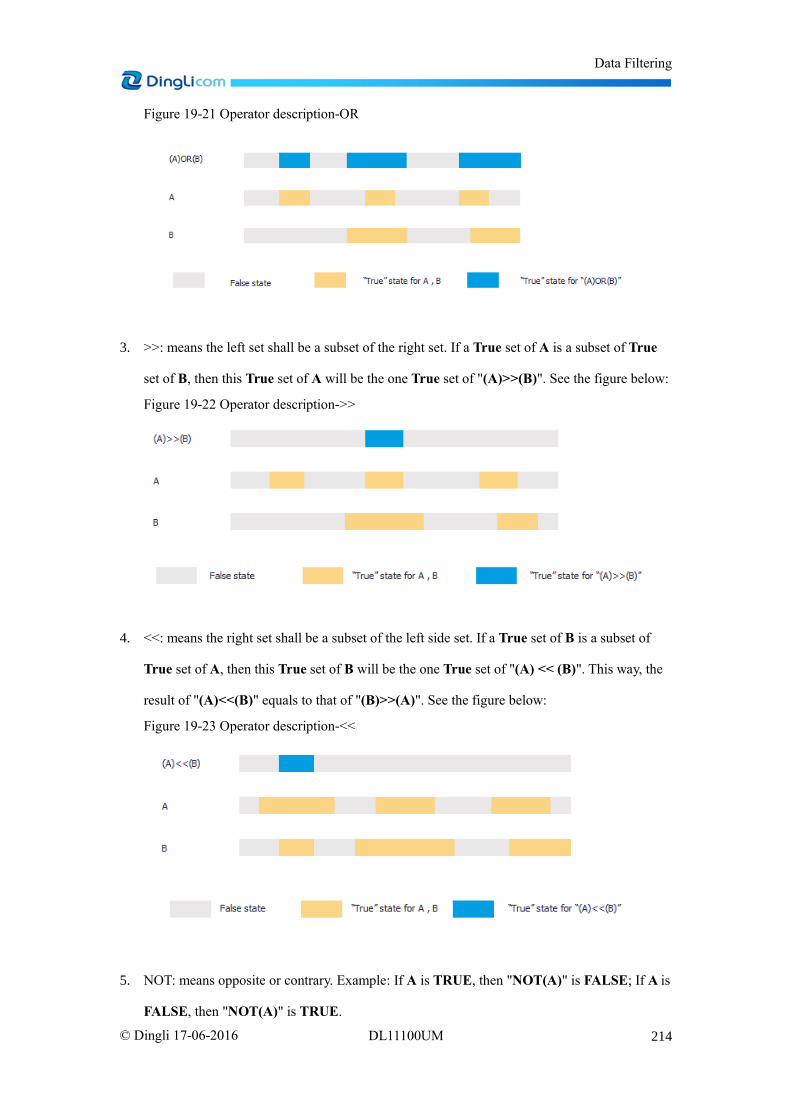
Data Filtering
214 © Dingli 17-06-2016 DL11100UM
Figure 19-21 Operator description-OR
3. >>: means the left set shall be a subset of the right set. If a True set of A is a subset of True
set of B, then this True set of A will be the one True set of "(A)>>(B)". See the figure below:
Figure 19-22 Operator description->>
4. <<: means the right set shall be a subset of the left side set. If a True set of B is a subset of
True set of A, then this True set of B will be the one True set of "(A) << (B)". This way, the
result of "(A)<<(B)" equals to that of "(B)>>(A)". See the figure below:
Figure 19-23 Operator description-<<
5. NOT: means opposite or contrary. Example: If A is TRUE, then "NOT(A)" is FALSE; If A is
FALSE, then "NOT(A)" is TRUE.

Data Filtering
215 © Dingli 17-06-2016 DL11100UM
Figure 19-24 Operator description-NOT
From the description above, we can see that the logical operators ">>" and "<<" are used to obtain
the intersection of two sets.
For example, if users need to filter the sampling points two seconds before LTE Handover Request,
where all RSRP values must be larger than -100 at the same time, users may define the condition
"2 seconds before the event LTE Handover Request" using Condition Range. This is followed by
defining the condition "RSRP>-100" using Parameter, and use the logical operator ">>" between
two conditions.
19.4 Use Filters
1. Users may use filters directly to filter data. For example, if a user selects a filter before he
exports data files, the software will filter the sample points based on the filter and then export
the data files based on other settings.
Figure 19-25 Select a Filter

Data Filtering
216 © Dingli 17-06-2016 DL11100UM
2. Users may click the icon in the Filter window to directly generate filtered data and load
the data to Pilot Pioneer Expert. The generated data include the information about the filter
name and generated time.
Figure 19-26 Generate filtered data files
Figure 19-27 Load the filtered data to the data list
3. Users may directly drag a Filter, e.g. PM0 (RSRP > -80) to the Map window, and display the
data that meets or does not meet the Filter conditions on the Map window.

Data Filtering
217 © Dingli 17-06-2016 DL11100UM
Figure 19-28 Map display before using the Filter
Figure 19-29 Map display after using the PM3 Filter

Data Binning
218 © Dingli 17-06-2016 DL11100UM
20 Data Binning
20.1 Overview
This function is used to group a number of data values into a smaller number of "bins", and obtain
average (recommended), maximum, or minimum value as required. Users may bin data based on
time, distance, grid, etc., and define the unit of Bin (e.g. 50 meters, 1 second) as required.
Users may directly bin data in different windows such as Map, Table, Statistics windows for data
display, or generate binned data first, and then view corresponding data in different windows.
20.2 Define Data Binning Template
Users need to define a template before data binning, which includes Bin unit, Bin size, and Bin
value mode. Users may reuse the same template in future.
Follow the instructions below to define a data binning template:
1. Click Filter to find Bin Template at the left bottom.
Figure 20-1 Bin Template
2. Click the icon to open the template settings page.

Data Binning
219 © Dingli 17-06-2016 DL11100UM
Figure 20-2 Bin template settings page
3. Define a template name, set Bin type, size, and value as required, and click Save.
4. Users may hover the cursor over a Bin template, and click the or icons to edit or
delete the template. See the figure below:
Figure 20-3 Edit or delete a template
20.3 Data Binning
20.3.1 Data Binning in the Map Window
Follow the instructions below to conduct data binning in the Map window:
1. Load data files for binning to the Map window.
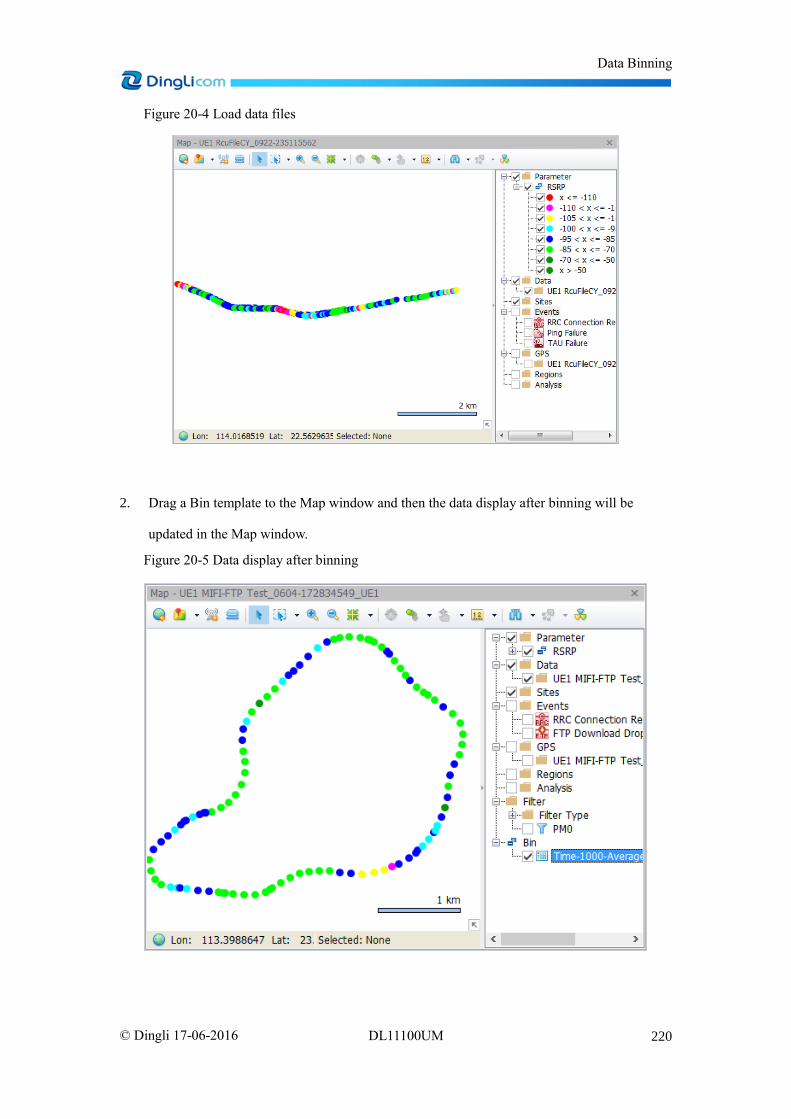
Data Binning
220 © Dingli 17-06-2016 DL11100UM
Figure 20-4 Load data files
2. Drag a Bin template to the Map window and then the data display after binning will be
updated in the Map window.
Figure 20-5 Data display after binning

Data Binning
221 © Dingli 17-06-2016 DL11100UM
20.3.2 Data Binning in the Table Window
Here the Table window refers to the Table window opened with a right-click function. Follow the
instructions below to conduct data binning in the Table window:
1. In the Table window, click the icon in the rectangle as shown in the figure below to display
the Filter and Bin bar.
Figure 20-6 Table window
2. Click the drop-down arrow besides Bin to select a Bin template.
Figure 20-7 Select a Bin template

Data Binning
222 © Dingli 17-06-2016 DL11100UM
3. Click the button besides Original to display the data after binning. During this time Original
changes to Apply. Users may click the button again to view the original data display.
Figure 20-8 Display original data or data after binning
20.3.3 Data Binning in the Statistics Window
Here the Statistics window refers to the Statistics window opened with a right-click function.
Follow the instructions below to conduct data binning in the Statistics window:
Figure 20-9 Right-click functions

Data Binning
223 © Dingli 17-06-2016 DL11100UM
1. Click the drop-down arrow besides Bin to select a Bin template.
Figure 20-10 Select a Bin template
2. Click the button besides Original to display the data after binning. During this time Original
changes to Apply. Users may click the button again to view the original data display.
Figure 20-11 Display original data or data after binning

Product Disclaimer
224 © Dingli 17-06-2016 DL11100UM
21 Product Disclaimer DISCLAIMER:
Other than the terms and conditions defined within "DingLi Software License Agreement"
documents for hardware and software acquired from DingLi Communications (H.K.) Company
Limited, customers agree to the related software or/and hardware (hereafter referred to as
"product") thereof, is only to be used within its intended scope. This includes voice and data
service testing, wireless network measurement verification, data collection and storage,
measurement data replay and presentation.
Other usages of the product in conjunction with any third party software application, hardware
or/and settings (not officially approved) beyond the aforementioned scope is not recommended as
it may impact the product's performance and accuracy of data. DingLi Communications (H.K.)
Company Limited shall not be liable to the outcome of the products’ performances and accuracy
of data if the product is not being used as intended. Such instances may also void the product's
warranty if the "DingLi Software License Agreement" is breached.
Unauthorized usage of Pilot Pioneer Expert includes but is not limited to:
1. Any unauthorized software upgrade is not permitted.
2. Any unauthorized modifications of installation files (such as deletion and replacement) are
not permitted.
3. Any operations on unauthorized devices that are connected to Pilot Pioneer Expert are not
permitted.
4. Any operation not in accordance with DingLi's product documentation may produce
abnormal test data.
5. Installation and running of any third-party applications on the computer is not permitted as it
could affect the product performance.
6. Any combined uses of software and hardware that are not specified by DingLi are not
permitted.
7. English is the preferred language. We will not be responsible for any issues caused by
language difference.
8. We will not responsible for software, hardware, and network problems or damages caused by
force majeure such as fire, flood, and power failure.
All of the contents of this manual are subject to copyright and may not be reproduced in any form.

Product Disclaimer
225 © Dingli 17-06-2016 DL11100UM
For further information, please contact [email protected].

DINGLI CORP., LTD
Address: No. 8, the Fifth Technology Road, Gangwan Avenue, Zhuhai, 519085, P.R. China
Tel: 0756-3626100 Fax: 0756-3391900