pillar iii disclosures - alawwal invest · 2017-04-19 · pillar iii disclosures - 2016 page 8 of...
TRANSCRIPT

Alawwal Invest
PILLAR III Disclosures - 6102 Page 1 of 21
PILLAR III DISCLOSURES
6102

Alawwal Invest
PILLAR III Disclosures - 2016 Page 2 of 21
TABLE OF CONTENT
1 SCOPE OF APPLICATION .................................................................................................................. 4
1.1 PILLAR I – MINIMUM CAPITAL REQUIREMENTS ................................................................................. 4 1.2 PILLAR II – INTERNAL CAPITAL ADEQUACY ASSESSMENT PROCESS ................................................. 4 1.3 PILLAR III – MARKET DISCIPLINE ..................................................................................................... 5 1.4 MATERIAL OR LEGAL IMPEDIMENTS BETWEEN THE AUTHORIZED PERSON AND ITS SUBSIDIARIES ....... 5
2 CAPITAL STRUCTURE OF ALAWWAL INVEST ............................................................................... 6
2.1 TIER 1 CAPITAL ............................................................................................................................. 6 2.2 TIER 2 CAPITAL ............................................................................................................................. 6
3 CAPITAL ADEQUACY ......................................................................................................................... 7
3.1 SCENARIO ANALYSIS AND STRESS TESTING ................................................................................... 7 3.2 CAPITAL ADEQUACY RATIO AND MINIMUM CAPITAL REQUIREMENTS ................................................ 8
4 RISK MANAGEMENT ........................................................................................................................... 9
4.1 SCOPE OF RISK MANAGEMENT ...................................................................................................... 9 4.1.1 Risk Management Strategy and processes ........................................................................................ 9 4.1.2 Structure and organization of Risk Management and Compliance functions ..................................... 9 4.1.3 Policies and guidelines for monitoring and mitigating risks .............................................................. 11
4.2 CREDIT RISK ............................................................................................................................... 11 4.2.1 External ratings and credit quality steps ........................................................................................... 11 4.2.2 Impairments and Specific Provisions ............................................................................................... 12 4.2.3 Geographic Distribution of exposures .............................................................................................. 12 4.2.4 Residual Contractual maturity .......................................................................................................... 12
4.3 CREDIT RISK MITIGATION ............................................................................................................ 13 4.4 COUNTERPARTY CREDIT RISK AND OFF BALANCE SHEET EXPOSURES .......................................... 13 4.5 MARKET RISK ............................................................................................................................. 13 4.6 OPERATIONAL RISK ..................................................................................................................... 14 4.7 LIQUIDITY RISK ........................................................................................................................... 14
4.7.1 Liquidity Risk Management .............................................................................................................. 15 4.7.2 Liquidity Reserves ............................................................................................................................ 15 4.7.3 Risk Measures and Ratios ............................................................................................................... 15
5 APPENDICES ..................................................................................................................................... 16
5.1 APPENDIX 1 - DISCLOSURE ON CAPITAL BASE .............................................................................. 16 5.2 APPENDIX 2 - DISCLOSURE ON CAPITAL ADEQUACY ...................................................................... 17 5.3 APPENDIX 3 - DISCLOSURE ON CREDIT RISK WEIGHTED ASSETS ................................................... 18 5.4 APPENDIX 4 - DISCLOSURE ON CREDIT RISK’S RATED EXPOSURES ............................................... 19 5.5 APPENDIX 5 - DISCLOSURE ON CREDIT RISK MITIGATION (CRM) ................................................... 21

Alawwal Invest
PILLAR III Disclosures - 2016 Page 3 of 21
List of Tables
Table 1 - Tier 1 Capital ................................................................................................................................... 6
Table 2 – Tier 2 Capital & Total Capital Ratio ................................................................................................ 6
Table 3 - Comparison of Capital adequacy and capital numbers – 2016 vs. 2015 ........................................ 8
Table 4 - Credit Quality Steps and CRA’s Rating Mapping .......................................................................... 12
Table 5 - Residual Contractual Maturity Profile ............................................................................................ 13
Table 6 - Market Risk Capital ....................................................................................................................... 13
Table 7 - Operational Risk Capital ................................................................................................................ 14
Table 8 - Liquidity Risk Bucketing ................................................................................................................ 15
Table 9 – Liquidity Ratios ............................................................................................................................. 15
Figure 1 - Risk Governance Structure .......................................................................................................... 10
Alawwal Invest
PILLAR III Disclosures - 2016 Page 4 of 21
1 Scope of Application
Alawwal Invest Company is a limited liability company registered in Riyadh, Kingdom of Saudi Arabia
under commercial registration number 1010242378 dated Dhul Hijjah 30, 1428H (corresponding to January
9, 2008) with a paid up capital of SAR 400 million.
With effect from 27 Safar 1438H (Corresponding to November 27, 2016), the name of the Company was
changed from Saudi Hollandi Capital to Alawwal Invest Company.
Alawwal Invest is authorized under Capital Market Authority (CMA) license number 07077-37 to act as
principal or agent in providing underwriting, managing and advisory services and custody of financial
securities.
On 23 June 2016, the Company's owners and Board of Directors approved to convert the legal status of
the Company from “Limited Liability Company” to “Closed Joint Stock Company” as per new Company's
Law issued by Ministry of Commerce and Investment in 2016. CMA imposed the deadline for this
conversion as 31 December 2016. However, the legal formalities related to change in legal status were
completed on 29 March 2017.
The Pillar III disclosures contained herein relate to Alawwal Invest for the period ended December 31,
2016. These are compiled in accordance with CMA’s prudential rules.
1.1 Pillar I – Minimum capital requirements
Pillar I describes the minimum capital requirements for credit, market and operational risk. Various
approaches, differing by level of sophistication, are available to Authorized Persons (APs) to determine
Pillar I requirements.
Alawwal Invest applies the standardized approach to calculate Pillar I capital requirements for credit risk.
The Company’s Pillar I capital for market risk is calculated using a “building-block” approach. The capital
charge for each category of market risk is determined separately and then aggregated.
The Company determines its Pillar I capital requirement for operational risk using the expenditure based
approach. In line with supervisory guidelines, the Pillar I capital requirement for operational risk is
maintained at 25% of the Alawwal Invest’s overhead expenses as laid down under expenditure based
approach.
1.2 Pillar II – Internal Capital Adequacy Assessment Process
Pillar II refers to the process by which APs undertake a comprehensive assessment of their risks and
determine the appropriate amount of capital to be held against these risks where other suitable mitigants
are not available. It also refers to the additional capital, over and above Pillar I, determined to be required
by this assessment. The risk and capital assessment is commonly referred to as the Internal Capital
Adequacy Assessment Process (“ICAAP”). The range of risks that are covered by the ICAAP is much
broader than Pillar I, which covers only credit, market and operational risk. Other risks such as liquidity,
concentration, strategic and reputational risk are covered under Pillar II.
Alawwal Invest has developed an ICAAP framework which closely integrates the risk and capital
assessment processes, and ensures that adequate levels of capital are maintained.

Alawwal Invest
PILLAR III Disclosures - 2016 Page 5 of 21
1.3 Pillar III – Market discipline
Pillar III refers to the part of the regulatory regime which aims to provide a consistent and comprehensive
disclosure framework that enhances comparability between APs and further promotes improvements in risk
practices. The qualitative and quantitative information provided here as a part of the Pillar III requirements,
has been reviewed and validated by senior management and is in accordance with the rules in force at the
time of publication.
In accordance with CMA regulation, Alawwal Invest publishes its Pillar III disclosures on an annual basis at
its website http://www.Alawwalinvest.com.sa
1.4 Material or Legal Impediments between the Authorized Person and its Subsidiaries
Alawwal Invest does not have any subsidiaries.

Alawwal Invest
PILLAR III Disclosures - 2016 Page 6 of 21
2 Capital Structure of Alawwal Invest
For regulatory purposes, capital is categorized into two main classes. These are Tier 1 and Tier 2, which
are described below.
2.1 Tier 1 Capital
The Tier 1 capital of Alawwal Invest consists of paid-up capital, reserves (other than revaluation reserves),
audited retained earnings and verified interim profit.
Alawwal Invest is a wholly owned subsidiary of Alawwal bank and its paid-up capital consists of 400,000
shares of SAR one thousand each.
(As of 31st Dec, 2016)
Tier-1 capital SAR ‘000
Paid-up capital 400,000
Share premium -
Tier-1 capital contribution -
Reserves (other than revaluation reserves) 20,978
Audited retained earnings 99,247
Verified interim profit / (loss) 15,725
Deductions from Tier-1 capital -7,441
Total Tier-1 capital 528,509
Table 1 - Tier 1 Capital
2.2 Tier 2 Capital
Alawwal Invest’s Tier 2 capital consists of revaluation reserves resulting from the change in fair value of
AFS equity investments.
(As of 31st Dec, 2016)
Tier-2 capital SAR ‘000
Subordinated loans -
Cumulative preference shares -
Revaluation reserves 2,110
Other deductions from Tier-2 (-) -
Deduction to meet Tier-2 capital limit (-) -
Total Tier-2 capital 2,110
Table 2 – Tier 2 Capital & Total Capital Ratio
Please refer to Appendix 1 for the detailed disclosure on capital base of Alawwal Invest.

Alawwal Invest
PILLAR III Disclosures - 2016 Page 7 of 21
3 Capital Adequacy
In line with regulatory norms, Alawwal Invest regards capital as the resource necessary to cover
unexpected losses. Alawwal Invest must, therefore, at all times, maintain an adequate level of capital to
cover unexpected losses arising from the risks inherent in its business operations and to support current &
future activities.
Alawwal Invest maintains a capital structure that it believes will ensure the viability of the Company under
extreme stress conditions, and provide sufficient capacity for growth. At the same time, Alawwal Invest’s
capital structure is and will continue to be compliant with regulatory requirements.
Alawwal Invest has developed an Internal Capital Adequacy Assessment Process by which it examines its
risk profile from both a regulatory and internal risk capital point of view. The ICAAP describes Alawwal
Invest’s business strategy, its forecast risk weighted assets for the next three years, its risk appetite and
the Company’s assessment of specific risk exposures, their mitigation and the capital allocated to these
risks. The ICAAP is a crucial part of Alawwal Invest’s strategic decision making process and risk
management framework.
Within the framework of the ICAAP, the Company’s annual capital plan is reviewed by the Senior
Management. The ICAAP is also reviewed and thereafter approved by the Board of Directors on an annual
basis.
3.1 Scenario Analysis and Stress Testing
Scenario analysis and stress testing are performed to assess Alawwal Invest’s exposure to extreme, but
plausible, events. The key objective of this process is to identify appropriate management actions,
including putting risk mitigation measures in place or assigning capital to the risk where the analysis shows
this to be appropriate.
Senior management is regularly informed of the stress test outcomes to ensure that they can determine
that the Company has sufficient capital in place and that any unacceptable risks are mitigated on an on-
going basis. The stress test scenarios are regularly reviewed and updated to account for changing market
dynamics.

Alawwal Invest
PILLAR III Disclosures - 2016 Page 8 of 21
3.2 Capital Adequacy Ratio and Minimum Capital Requirements
Alawwal Invest is well capitalized with a Tier I capital ratio of 10.59x (2015: 10.32x) and a total capital ratio
of 10.63x (2015: 10.32x), well above CMA’s minimum regulatory requirement of 1.00x.
The following table reflects the comparative analysis of capital numbers in 2016 & 2015.
(All amounts in SAR ‘000 & As of 31st Dec, 2016)
Particulars 2016 2015 % Change
Tier I Capital 528,509 520,125 1.61%
Tier II Capital 2,110 - 100.00%
Total 530,619 520,125 2.02%
Minimum capital required
Credit Risk 38,941 38,842 0.26%
Market Risk - - -
Operational Risk 10,974 11,569 -5.14%
Total 49,915 50,411 -0.98%
Tier-1 Capital Ratio 10.59x 10.32x 2.62%
Total Capital Ratio (including Tier II) 10.63x 10.32x 3.00%
Surplus (Deficit) in Capital Base 480,704 469,714 2.34%
Table 3 - Comparison of Capital adequacy and capital numbers – 2016 vs. 2015
Please refer to Appendix 2 for the detailed disclosure on capital adequacy of Alawwal Invest.

Alawwal Invest
PILLAR III Disclosures - 2016 Page 9 of 21
4 Risk Management
Risk management at Alawwal Invest is based upon a risk culture that promotes accountability and
responsibility. The Board has a pre-eminent role in shaping risk culture and the risk management
framework has been formulated in line with Alawwal bank’s overarching risk-management principles. Risk
managers, risk owners and risk policy writers consider these principles for fulfilling their responsibilities and
managing risks.
4.1 Scope of Risk Management
4.1.1 Risk Management Strategy and processes
The risk management processes at Alawwal Invest involves the identification of risks, establishing controls,
monitoring risk frameworks and establishing limits on the risks Alawwal Invest is willing to take in the
pursuit of its business objectives.
Risk management processes and techniques are periodically reviewed and updated to ensure consistency
with Alawwal Invest’s risk-taking activities. Such reviews have regard to the size and complexity of the
Company’s operations, the business environment, the regulatory environment and the strategy of Alawwal
Invest. Risk management policy, principles and guidelines have been formulated at Alawwal Invest and
communicated to all Alawwal Invest staff.
Risk management is considered a continuous process which runs from Alawwal Invest’s strategy and risk
governance down to the level of on-going monitoring and reporting of specific risks. Risk management
methodically addresses all the risks surrounding Alawwal Invest’s products, services, activities and
relationships. Alawwal Invest’s approach to risk management places emphasis on inculcating a risk
awareness culture, and considers this as a highly effective way to minimize unexpected loss and
contributes to the successful implementation of strategy.
4.1.2 Structure and organization of Risk Management and Compliance functions
Alawwal Invest has an established risk governance structure, with the Board of Directors, Senior
Management Committees, including the Risk Management Committee. Alawwal Invest’s Board is
responsible for overall direction, supervision and control of risks at Alawwal Invest. The Board represents
the shareholder (Alawwal bank) and serves the interests of Alawwal Invest by overseeing, evaluating and
approving Alawwal Invest’s strategies, its risk appetite, performance objectives, its policies, conduct,
reputation and culture.
Alawwal Invest addresses the entirety of its current risk exposure in line with internal requirements
(mandated by the shareholders and Alawwal Invest’s Board) and regulatory requirements. However, at the
current stage, Alawwal Invest does not have its own separate, centralized, dedicated risk management
team. Alawwal Invest engages the services of the Risk Management entity at Alawwal bank and has a
service level agreement in this regard. The Board is comfortable with this arrangement considering the
current risk profile, size and complexity of Alawwal Invest’s business activities and the relatively low risk
appetite in Alawwal Invest’s operations.
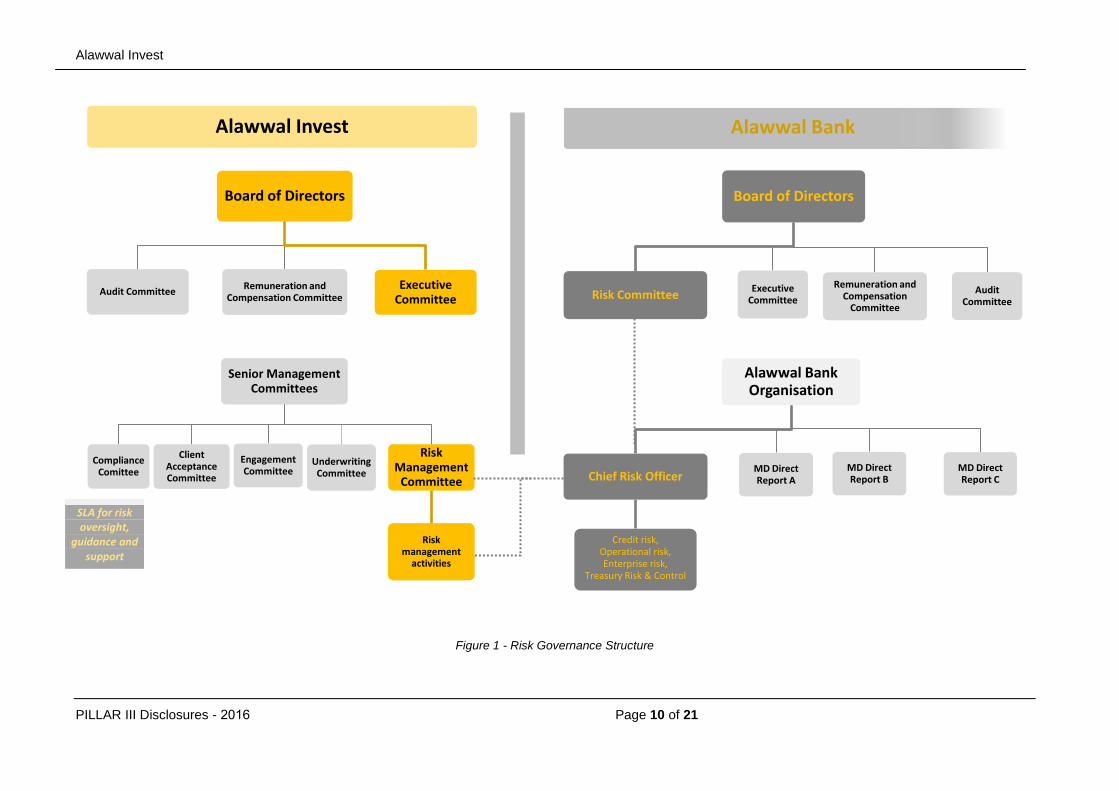
The below figure shows the governance structure at Alawwal Invest, and highlights the support provided by
Alawwal bank to the risk management function at Alawwal Invest.
Alawwal Invest
PILLAR III Disclosures - 6102 Page 10 of 21
Figure 1 - Risk Governance Structure
Alawwal Bank
Board of Directors
Executive Committee
Remuneration and Compensation
Committee
Audit Committee
Risk Committee
Alawwal Invest
Board of Directors
Audit Committee Remuneration and
Compensation Committee Executive
Committee
Senior Management Committees
Compliance Comittee
Client Acceptance Committee
Engagement Committee
Underwriting Committee
Risk Management
Committee
Risk management
activities
Alawwal Bank Organisation
MD Direct Report A
MD Direct Report B
MD Direct Report C Chief Risk Officer
Credit risk, Operational risk, Enterprise risk,
Treasury Risk & Control
SLA for risk oversight,
guidance and support
Alawwal Invest
PILLAR III Disclosures - 2015 Page 11 of 21
Compliance
The Company’s Compliance function is responsible for assisting Alawwal Invest, its management and
Board, in identifying, measuring and mitigating any compliance exposures. The Compliance function’s
remit includes: monitoring regulatory changes, conducting compliance risk assessments, drafting,
maintaining and implementing policies and procedures, increasing staff awareness, monitoring, checking
and reviewing compliance with CMA rules and regulations, and reporting on the status of compliance and
compliance controls to the Board of Alawwal Invest.
4.1.3 Policies and guidelines for monitoring and mitigating risks
Alawwal Invest’s Risk policies and procedures ensure that business activities are conducted within the
approved limits or guidelines and are aligned with Alawwal Invest’s strategies and risk appetite.
Risk limits at Alawwal Invest control risk-taking activities within the tolerance limits established by the
Board and the Risk Management Committee. Any breaches of these limits or guidelines are reported to the
relevant Senior Management committee and / or the Board. Limits establish accountability for key tasks in
the risk-taking process and establish the level or conditions under which transactions may be approved or
executed. Risk limits commence at the enterprise level via the Risk Appetite Statement and are then set at
the execution or operational level through specific risk policies (counterparty, dealing limits) and / or
through approvals on specific transactions (e.g. underwriting commitments, decisions on proprietary
investments).
Some risk limits are directly mandated by CMA’s Regulations, such as the Investment Funds Regulations
for instance, which directly sets investor limits, investment limits, exposure limits to single issuers, large
exposure limits, etc. Alawwal Invest has zero tolerance for any breaches or violations of limits set/
prescribed by the Regulator.
Other types of limits are those set within individual DPM Agreements/ Mandate Letters, where potential
breaches constitute operational, legal and reputational exposures rather than direct credit or market risk for
the Company. Alawwal Invest has zero tolerance for any violations or deviations of limits and restrictions
set out in legal documents.
4.2 Credit Risk
Credit risk is the risk of loss resulting from the failure of a borrower or counterparty to honour its financial or
contractual obligations. For Alawwal Invest, credit risk primarily arises from its exposures to local banks
where it places deposits and from proprietary investments classified as ‘Available for Sale’. The
Company’s approach to credit risk management is guided by establishing appropriate counterparty limits,
conducting risk reviews and tracking of adverse movement in the rating, financial performance and political
environment of counterparties and intimation to the appropriate authority for revision in their limits.
Alawwal Invest has complied with CMA regulations and used the Standardized Approach for calculation of
the capital required for Credit risk. Alawwal Invest’s credit risk exposures and their distribution by risk
weights are detailed in Appendix 3
4.2.1 External ratings and credit quality steps
Alawwal Invest uses credit ratings to determine the credit quality step the exposure corresponds to. The
Company uses ratings from credit rating agencies prescribed by CMA in the prudential rules and maps it to
Alawwal Invest
Pillar III Disclosures - 2016 Page 12 of 21
the appropriate credit quality step. Alawwal Invest then uses the credit quality step to determine
appropriate risk weight for credit risk exposures for capital charge calculations.
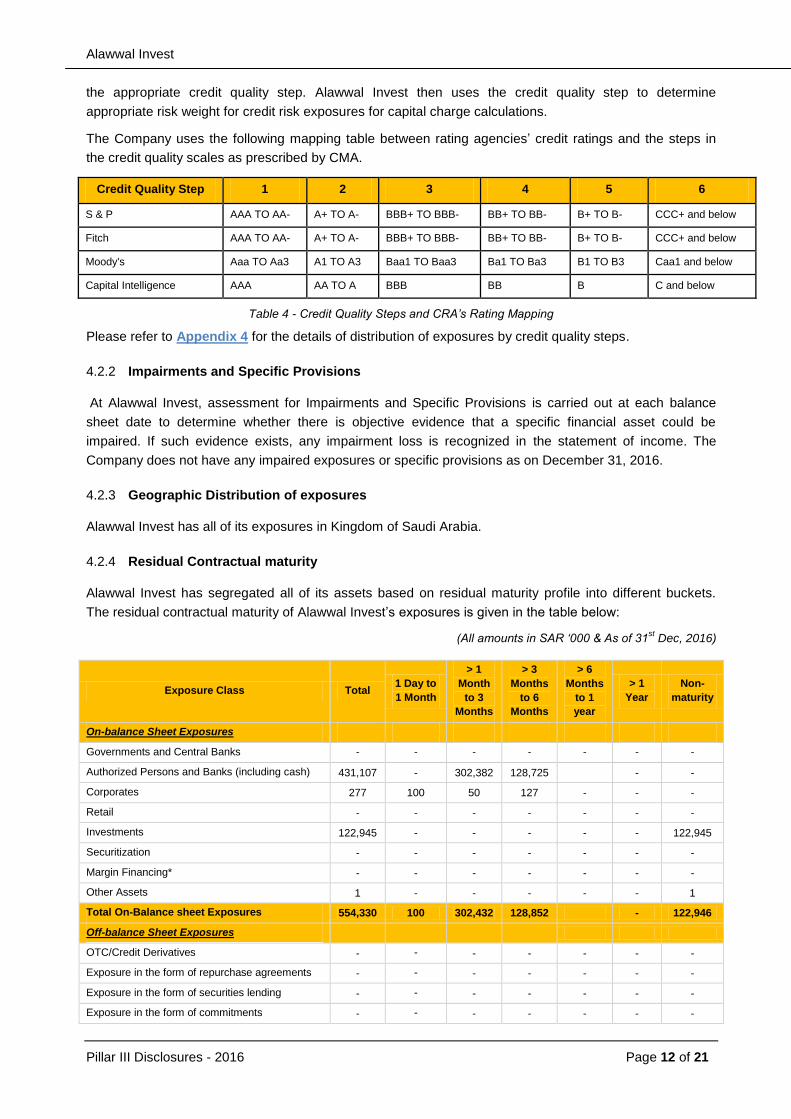
The Company uses the following mapping table between rating agencies’ credit ratings and the steps in
the credit quality scales as prescribed by CMA.
Credit Quality Step 1 2 3 4 5 6
S & P AAA TO AA- A+ TO A- BBB+ TO BBB- BB+ TO BB- B+ TO B- CCC+ and below
Fitch AAA TO AA- A+ TO A- BBB+ TO BBB- BB+ TO BB- B+ TO B- CCC+ and below
Moody's Aaa TO Aa3 A1 TO A3 Baa1 TO Baa3 Ba1 TO Ba3 B1 TO B3 Caa1 and below
Capital Intelligence AAA AA TO A BBB BB B C and below
Table 4 - Credit Quality Steps and CRA’s Rating Mapping
Please refer to Appendix 4 for the details of distribution of exposures by credit quality steps.
4.2.2 Impairments and Specific Provisions
At Alawwal Invest, assessment for Impairments and Specific Provisions is carried out at each balance
sheet date to determine whether there is objective evidence that a specific financial asset could be
impaired. If such evidence exists, any impairment loss is recognized in the statement of income. The
Company does not have any impaired exposures or specific provisions as on December 31, 2016.
4.2.3 Geographic Distribution of exposures
Alawwal Invest has all of its exposures in Kingdom of Saudi Arabia.
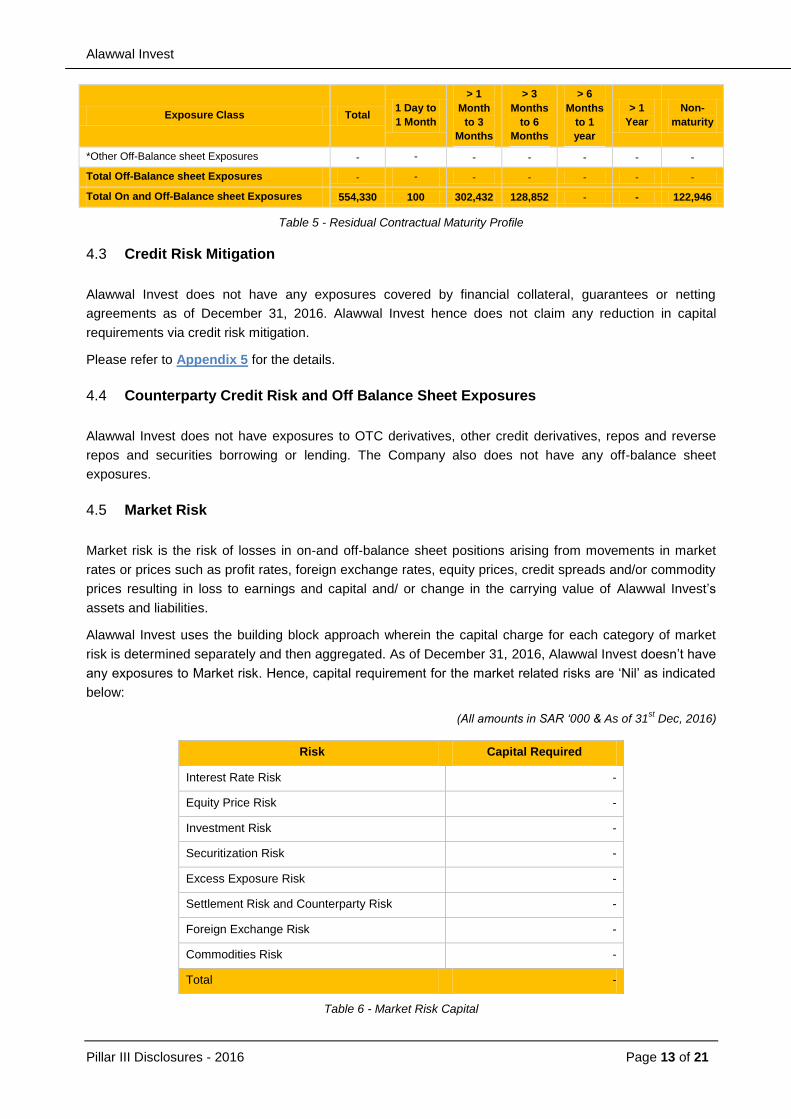
4.2.4 Residual Contractual maturity
Alawwal Invest has segregated all of its assets based on residual maturity profile into different buckets.
The residual contractual maturity of Alawwal Invest’s exposures is given in the table below:
(All amounts in SAR ‘000 & As of 31st Dec, 2016)
Exposure Class Total 1 Day to
1 Month
> 1
Month
to 3
Months
> 3
Months
to 6
Months
> 6
Months
to 1
year
> 1
Year
Non-
maturity
On-balance Sheet Exposures
Governments and Central Banks - - - - - - -
Authorized Persons and Banks (including cash) 431,107 - 302,382 128,725 - -
Corporates 277 100 50 127 - - -
Retail - - - - - - -
Investments 122,945 - - - - - 122,945
Securitization - - - - - - -
Margin Financing* - - - - - - -
Other Assets 1 - - - - - 1
Total On-Balance sheet Exposures 554,330 100 302,432 128,852 - 122,946
Off-balance Sheet Exposures
OTC/Credit Derivatives - - - - - - -
Exposure in the form of repurchase agreements - - - - - - -
Exposure in the form of securities lending - - - - - - -
Exposure in the form of commitments - - - - - - -
Alawwal Invest
Pillar III Disclosures - 2016 Page 13 of 21
Exposure Class Total 1 Day to
1 Month
> 1
Month
to 3
Months
> 3
Months
to 6
Months
> 6
Months
to 1
year
> 1
Year
Non-
maturity
*Other Off-Balance sheet Exposures - - - - - - -
Total Off-Balance sheet Exposures - - - - - - -
Total On and Off-Balance sheet Exposures 554,330 100 302,432 128,852 - - 122,946
Table 5 - Residual Contractual Maturity Profile
4.3 Credit Risk Mitigation
Alawwal Invest does not have any exposures covered by financial collateral, guarantees or netting
agreements as of December 31, 2016. Alawwal Invest hence does not claim any reduction in capital
requirements via credit risk mitigation.
Please refer to Appendix 5 for the details.
4.4 Counterparty Credit Risk and Off Balance Sheet Exposures
Alawwal Invest does not have exposures to OTC derivatives, other credit derivatives, repos and reverse
repos and securities borrowing or lending. The Company also does not have any off-balance sheet
exposures.
4.5 Market Risk
Market risk is the risk of losses in on-and off-balance sheet positions arising from movements in market
rates or prices such as profit rates, foreign exchange rates, equity prices, credit spreads and/or commodity
prices resulting in loss to earnings and capital and/ or change in the carrying value of Alawwal Invest’s
assets and liabilities.
Alawwal Invest uses the building block approach wherein the capital charge for each category of market
risk is determined separately and then aggregated. As of December 31, 2016, Alawwal Invest doesn’t have
any exposures to Market risk. Hence, capital requirement for the market related risks are ‘Nil’ as indicated
below:
(All amounts in SAR ‘000 & As of 31st Dec, 2016)
Risk Capital Required
Interest Rate Risk -
Equity Price Risk -
Investment Risk -
Securitization Risk -
Excess Exposure Risk -
Settlement Risk and Counterparty Risk -
Foreign Exchange Risk -
Commodities Risk -
Total -
Table 6 - Market Risk Capital

Alawwal Invest
Pillar III Disclosures - 2016 Page 14 of 21
4.6 Operational Risk
Operational risk is the risk of loss resulting from inadequate or failed internal processes, people and
systems or from external events, this will include legal risks covering, but not limited to, exposure to fines,
penalties, or punitive damages resulting from supervisory actions, as well as private settlements.
The Operational Risk capital charge is calculated as higher of the amounts under the following two
approaches.
Basic Indicator Approach: Under the Basic Indicator Approach, 15% capital charge is calculated on
average operating income of the last three audited financials.
Expenditure Based Approach: Under the Expenditure Based Approach, 25% capital charge is calculated
on all overhead expenses except extraordinary expenses as per the most recent audited annual financial
statements.
(All amounts in SAR ‘000 & As of 31st Dec, 2016)
Basic Indicator
Approach (BIA) Year Gross Income
Average Gross
Income
Risk Capital
Charge (%)
Capital
Required
2016 – Capital
2014 77,364
61,178 15% 9,177 2015 57,718
2016 48,451
Expenditure Based Approach (EBA) Year – 1 Overhead
Expenses
Risk Capital
Charge (%)
Capital
Required
2016 – Capital 2016 43,896 25% 10,974
Capital requirement for Operational Risk for 2016
(Higher of Basic Indicator Approach and Expenditure Based Approach) 10,974
Table 7 - Operational Risk Capital
Alawwal Invest, as part of SLA arrangements, receives a range of services from the Operational Risk
Management Unit of Alawwal Invest, which extend to advisory, review and oversight of operational risk
management activities.
Alawwal Invest has a repository in BWise system to capture all operational losses incurred by the
Company, for the purpose of analysing and reporting operational errors and enhancing controls where
necessary.
4.7 Liquidity Risk
Liquidity risk pertains to a company’s inability to meet all expected and unexpected cash flows and
outstanding commitments. Liquidity risk usually arises from the balance sheet structure, resulting in a
mismatch where longer term assets are funded through short term liabilities. To mitigate this, the balance
sheet should remain sufficiently liquid such that an acceptable proportion of assets are allocated to highly
liquid instruments and the size of the permitted mismatch in relation to these liquid assets needs to be
controlled. In the case of surplus situation, liquidity takes the form of opportunity cost in the form of loss of
income due to investment of idle funds in low yield assets rather than higher yielding assets.

Alawwal Invest
Pillar III Disclosures - 2016 Page 15 of 21
4.7.1 Liquidity Risk Management
Alawwal invest considers Alawwal Bank’s framework for maintaining sound processes for identifying,
measuring and reporting of liquidity risk. Alawwal Invest, in coordination with Alawwal bank has established
and implemented a contingency plan, which is based on understanding of the Company’s anticipated
sources of funds, uses of funds and on the expected timing of those sources and uses. The plan is subject
to periodic review, assessment and approval.
4.7.2 Liquidity Reserves
Alawwal Invest holds deposits with local banks which can be accessed instantly according to its needs.
Alawwal Invest actively manages its daily funding obligations through a number of measures including
availability of surplus cash and daily monitoring of funding requirements.
4.7.3 Risk Measures and Ratios
Alawwal Invest prepares a statement of expected cash flows arising at the time of settlement of its assets
and liabilities and allocates them in different time intervals in which they are expected to occur. The time
intervals have been defined as per the prudential rules of Capital Market Authority (CMA) as stated below:
Particulars 1 Day > 1 day to
1 week
>1 week to
1 month
>1 month
to 3
months
>3 months
to 6
months
> 6 months
to 1 year > 1 year
Non
Maturity
Table 8 - Liquidity Risk Bucketing
The assets and liabilities with no maturity have been placed under a separate bucket, ‘Non- Maturity’. The
net cash flows across all time intervals are accumulated to observe the quantum of cumulative net cash
flow in each bucket.
Apart from Cash flow, following ratios are being periodically monitored to maintain appropriate liquidity
levels:
S.No Indicators Values Inference
1 Liquid assets / Total Assets 54.6% This reflects the cushion/comfort level in meeting its
short-term liabilities and fixed cost payment
2
Illiquid +Long term investments/Total Assets
45%
This ensures long-term sustainable returns on asset and provides stabilization of income in future years
3 Cumulative Mismatch as a % of total
liabilities (excluding equity)
1761.1%
The high positive ratio bears testimony to the fact the
Company is highly liquid and has no significant short
term liabilities since the assets are primarily funded by
equity.
Table 9 – Liquidity Ratios

Alawwal Invest
Pillar III Disclosures - 2016 Page 16 of 21
5 Appendices
5.1 Appendix 1 - Disclosure on Capital Base
(As of Dec 31, 2016)
Capital Base SAR '000
Tier-1 capital
Paid-up capital 400,000
Audited retained earnings 99,247
Verified interim profit / (loss) 15,725
Share premium -
Reserves (other than revaluation reserves) 20,978
Tier-1 capital contribution -
Deductions from Tier-1 capital -7,441
Total Tier-1 capital 528,509
Tier-2 capital
Subordinated loans -
Cumulative preference shares -
Revaluation reserves 2,110
Other deductions from Tier-2 (-) -
Deduction to meet Tier-2 capital limit (-) -
Total Tier-2 capital 2,110
Total Capital Base 530,619

Alawwal Invest
Pillar III Disclosures - 2016 Page 17 of 21
5.2 Appendix 2 - Disclosure on Capital Adequacy
(As of Dec 31, 2016)
Amounts in SAR ‘000
Exposure Class Exposures before CRM Net Exposures
after CRM
Risk Weighted
Assets
Capital
Requirement
Credit Risk
On-balance Sheet Exposures
Governments and Central Banks - - - -
Authorized Persons and Banks
(including cash) 431,107 431,107 91,758 12,846
Corporates 277 277 1,978 277
Retail - - - -
Investments 122,945 122,945 184,417 25,818
Securitization - - - -
Margin Financing - - - -
Other Assets 1 1
Total On-Balance sheet Exposures 554,330 554,330 278,153 38,941ؤ
Off-balance Sheet Exposures - - - -
OTC/Credit Derivatives - - - -
Repurchase agreements - - - -
Securities borrowing/lending - - - -
Commitments - - - -
Other off-balance sheet exposures - - - -
Total Off-Balance sheet Exposures - - - -
Total On and Off-Balance sheet
Exposures 554,330 554,330 278,153 38,941
Prohibited Exposure Risk
Requirement - - - -
Total Credit Risk Exposures
38,941
Market Risk Long Position Short Position
Interest rate risks - - -
Equity price risks - - -
Risks related to investment funds - - -
Securitization/ re-securitization
positions - - -
Excess exposure risks - - -
Settlement risks and counterparty risks - - -
Foreign exchange rate risks - - -
Commodities risks. - - -
Total Market Risk Exposures - - -
Operational Risk 10,974
Minimum Capital Requirement 49,916
Surplus/ (Deficit) in Capital 480,703
Total Capital Ratio (times) 01.21x
Alawwal Invest
PILLAR III Disclosures - 2016 Page 18 of 21
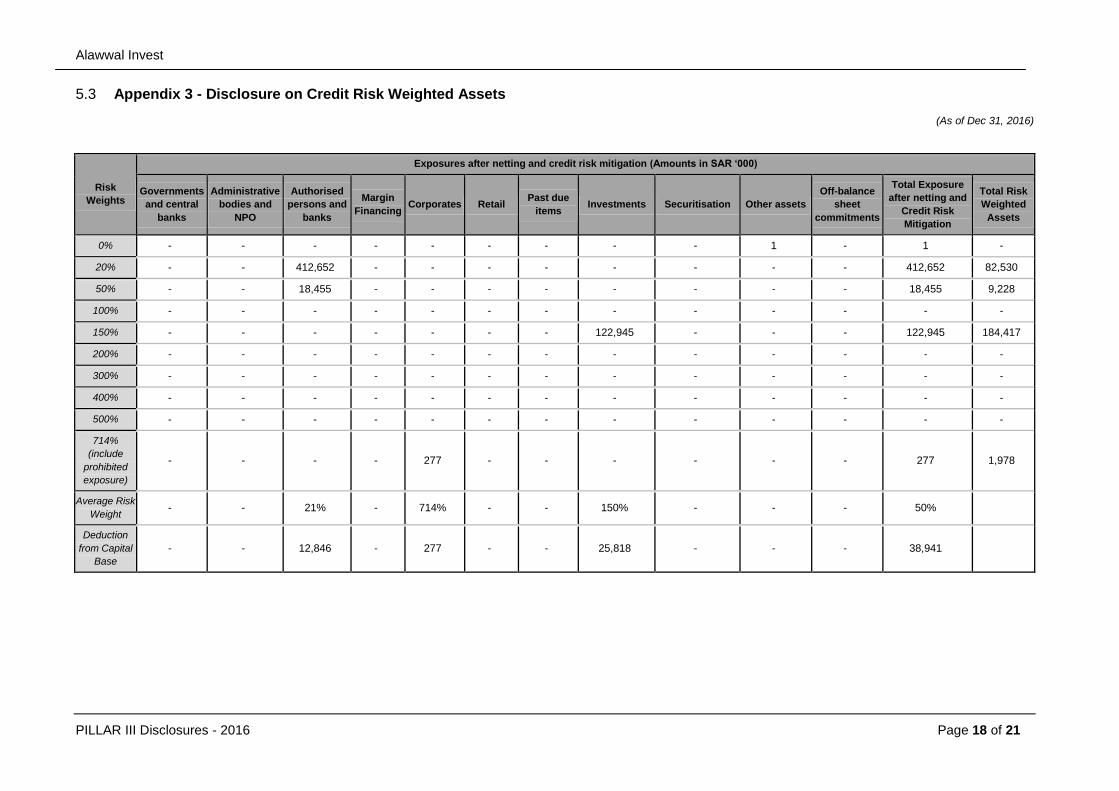
5.3 Appendix 3 - Disclosure on Credit Risk Weighted Assets
(As of Dec 31, 2016)
Risk
Weights
Exposures after netting and credit risk mitigation (Amounts in SAR ‘000)
Governments
and central
banks
Administrative
bodies and
NPO
Authorised
persons and
banks
Margin
Financing Corporates Retail
Past due
items Investments Securitisation Other assets
Off-balance
sheet
commitments
Total Exposure
after netting and
Credit Risk
Mitigation
Total Risk
Weighted
Assets
0% - - - - - - - - - 1 - 1 -
20% - - 412,652 - - - - - - - - 412,652 82,530
50% - - 18,455 - - - - - - - - 18,455 9,228
100% - - - - - - - - - - - - -
150% - - - - - - - 122,945 - - - 122,945 184,417
200% - - - - - - - - - - - - -
300% - - - - - - - - - - - - -
400% - - - - - - - - - - - - -
500% - - - - - - - - - - - - -
714%
(include
prohibited
exposure)
- - - - 277 - - - - - - 277 1,978
Average Risk
Weight - - 21% - 714% - - 150% - - - 50%
Deduction
from Capital
Base
- - 12,846 - 277 - - 25,818 - - - 38,941
Alawwal Invest
Pillar III Disclosures - 2016 Page 19 of 21
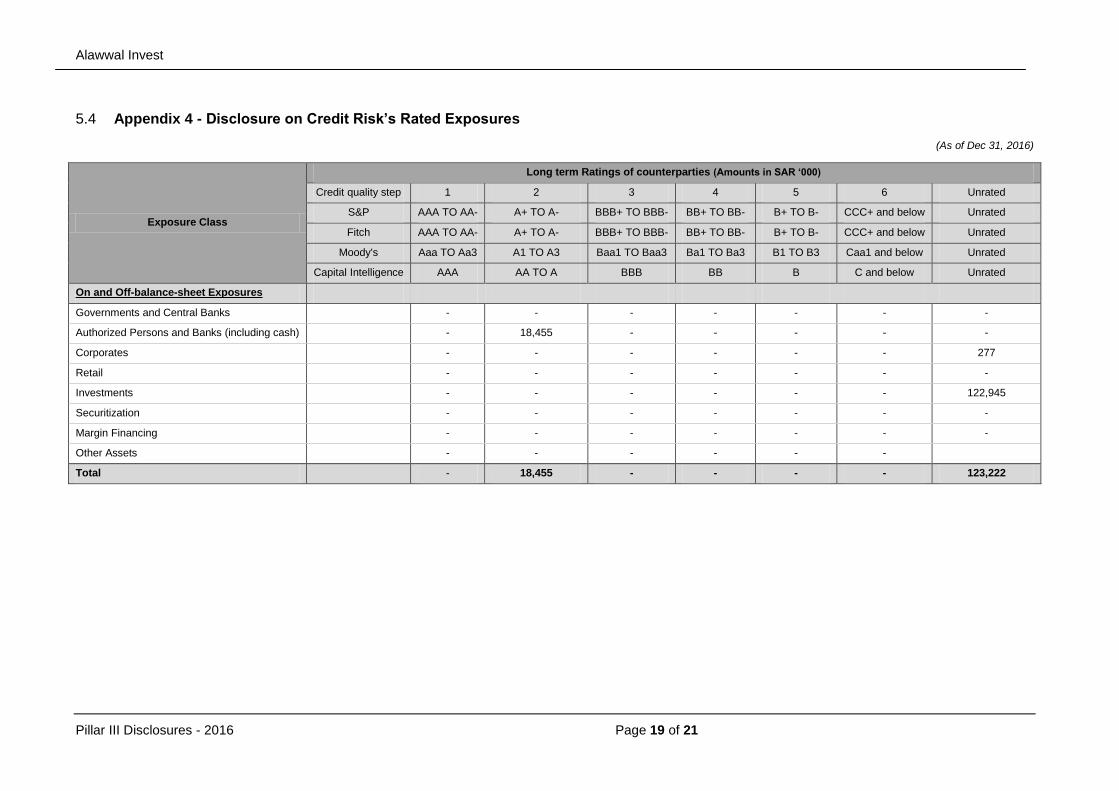
5.4 Appendix 4 - Disclosure on Credit Risk’s Rated Exposures
(As of Dec 31, 2016)
Exposure Class
Long term Ratings of counterparties (Amounts in SAR ‘000)
Credit quality step 1 2 3 4 5 6 Unrated
S&P AAA TO AA- A+ TO A- BBB+ TO BBB- BB+ TO BB- B+ TO B- CCC+ and below Unrated
Fitch AAA TO AA- A+ TO A- BBB+ TO BBB- BB+ TO BB- B+ TO B- CCC+ and below Unrated
Moody's Aaa TO Aa3 A1 TO A3 Baa1 TO Baa3 Ba1 TO Ba3 B1 TO B3 Caa1 and below Unrated
Capital Intelligence AAA AA TO A BBB BB B C and below Unrated
On and Off-balance-sheet Exposures
Governments and Central Banks
- - - - - - -
Authorized Persons and Banks (including cash)
- 18,455 - - - - -
Corporates
- - - - - - 277
Retail
- - - - - - -
Investments
- - - - - - 122,945
Securitization
- - - - - - -
Margin Financing
- - - - - - -
Other Assets
- - - - - -
Total
- 18,455 - - - - 123,222
Alawwal Invest
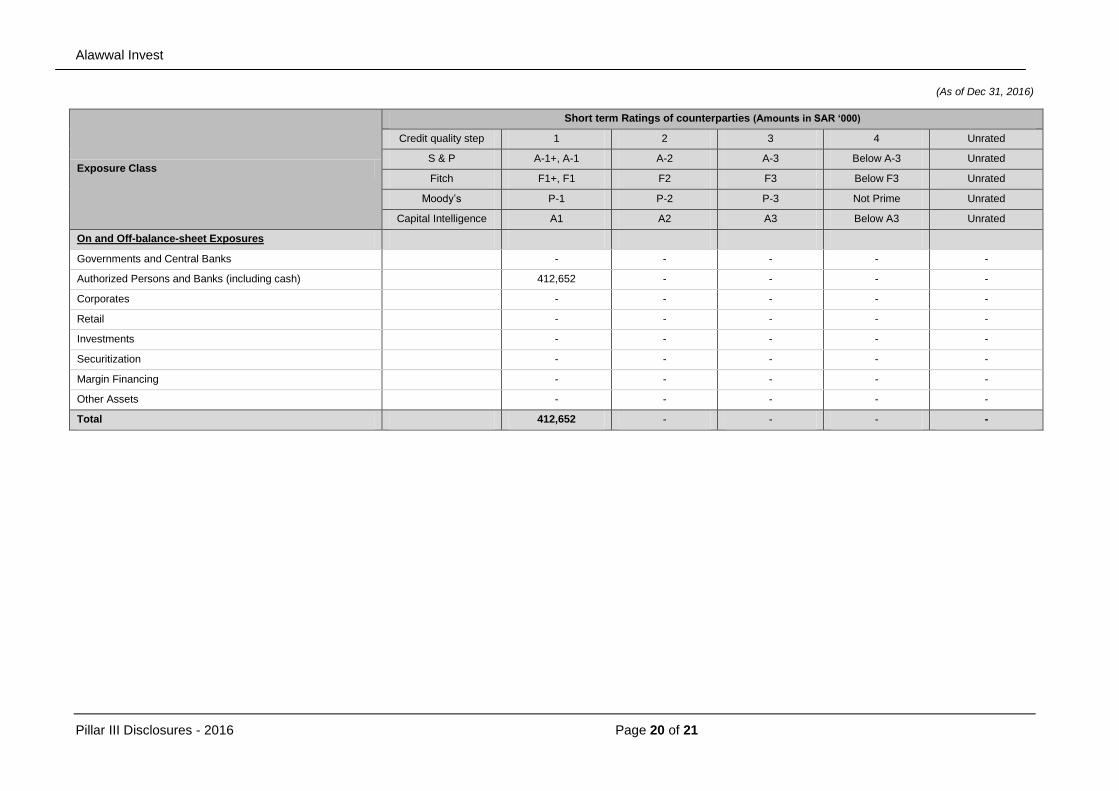
Pillar III Disclosures - 2016 Page 20 of 21
(As of Dec 31, 2016)
Exposure Class
Short term Ratings of counterparties (Amounts in SAR ‘000)
Credit quality step 1 2 3 4 Unrated
S & P A-1+, A-1 A-2 A-3 Below A-3 Unrated
Fitch F1+, F1 F2 F3 Below F3 Unrated
Moody’s P-1 P-2 P-3 Not Prime Unrated
Capital Intelligence A1 A2 A3 Below A3 Unrated
On and Off-balance-sheet Exposures
Governments and Central Banks - - - - -
Authorized Persons and Banks (including cash) 412,652 - - - -
Corporates - - - - -
Retail - - - - -
Investments - - - - -
Securitization - - - - -
Margin Financing - - - - -
Other Assets - - - - -
Total 412,652 - - - -

Alawwal Invest
Pillar III Disclosures - 2016 Page 21 of 21
5.5 Appendix 5 - Disclosure on Credit Risk Mitigation (CRM)
(Amounts are in SAR ‘000 & As of Dec 31, 2016)
Exposure Class Exposures before CRM
Exposures
covered by
Guarantees/
Credit derivatives
Exposures
covered by
Financial
Collateral
Exposures covered
by Netting Agreement
Exposures covered
by other eligible
collaterals
Exposures after CRM
Credit Risk
On-balance Sheet Exposures
Governments and Central Banks - - - - - -
Authorized Persons and Banks (including cash) 431,107 - - - - 431,107
Corporates 277 - - - - 277
Retail - - - - - -
Investments 122,945 - - - - 122,945
Securitization - - - - - -
Margin Financing* - -
- - -
Other Assets 1 - - - - 1
Total On-Balance sheet Exposures 554,330
- 554,330
Off-balance Sheet Exposures
OTC/Credit Derivatives - - - - - -
Exposure in the form of repurchase agreements - - - - - -
Exposure in the form of securities lending - - - - - -
Exposure in the form of commitments - - - - - -
*Other Off-Balance sheet Exposures - - - - - -
Total Off-Balance sheet Exposures - - - - - -
Total On and Off-Balance sheet Exposures 554,330 - - - - 554,330