pillar 3 disclosures - macquarie group
TRANSCRIPT
Pillar 3 disclosuresMacquarie Bank
March 2020
MACQUARIE BANK LIMITED ACN 008 583 542

Macquarie Bank Limited Pillar 3 Disclosures March 2020 macquarie.com
This page has been left intentionally blank.
Macquarie Bank Limited ABN 46 008 583 542
No.1 Martin Place Telephone (61 2) 8232 3333 Money Market 8232 3600 Facsimile 8232 4227 Sydney NSW 2000 Facsimile (61 2) 8232 7780 Foreign Exchange 8232 3666 Facsimile 8232 3019 GPO Box 4294 Telex 122246 Metals and Mining 8232 3444 Facsimile 8232 3590 Sydney NSW 1164 Internet http://www.macquarie.com.au Futures 9231 1028 Telex 72263
DX 10287 SSE Debt Markets 8232 3815 Facsimile 8232 4414 SWIFT MACQAU2S
ASX Release
MACQUARIE BANK RELEASES MARCH PILLAR 3 DISCLOSURE DOCUMENT
26 May 2020 - The Macquarie Bank Limited March 2020 Pillar 3 disclosure document was
released today on the Macquarie website www.macquarie.com. These disclosures have been
prepared in accordance with the Australian Prudential Regulation Authority (APRA) requirements
of Prudential Standard APS 330: Public Disclosure.
Contacts:
Sam Dobson, Macquarie Group Investor Relations +612 8232 9986
Lisa Jamieson, Macquarie Group Media Relations +612 8232 6016

Macquarie Bank Limited Pillar 3 Disclosures March 2020 macquarie.com
This page has been left intentionally blank.
Contents
1
Introduction 2 1.0 Overview 3 2.0 Risk Management Governance and Framework 5 3.0 Capital Structure 7 4.0 Capital Adequacy 9 5.0 Credit Risk Measurement 13 6.0 Calculation of Credit Risk Exposures 26 7.0 Provisioning 32 8.0 Credit Risk Mitigation 37 9.0 Securitisation 40 10.0 Credit Valuation Adjustment 51 11.0 Exposure to Central Counterparties 52 12.0 Market Risk 53 13.0 Equity Risk 58 14.0 Operational Risk 60 15.0 Leverage Ratio Disclosures 61 16.0 Liquidity Coverage Ratio Disclosures 63 17.0 Net Stable Funding Ratio Disclosures 65 Disclaimer 68 Appendix 1 Regulatory Capital Reconciliation 69 Appendix 2 List of Entities Deconsolidated from the Level 1 and Level 2 Regulatory Group for APRA Reporting Purposes 76 Appendix 3 Annual Remuneration Disclosures 78 Appendix 4 List of APRA Quantitative Tables 92 Appendix 5 Glossary of Terms 93
Macquarie Bank Limited Pillar 3 Disclosures March 2020 macquarie.com
Introduction
2
Introduction
Macquarie Bank Limited (MBL) is an Authorised Deposit-taking Institution (ADI) regulated by the Australian Prudential
Regulation Authority (APRA). MBL is accredited under the Foundation Internal Ratings Based Approach (FIRB) for credit risk,
the Advanced Measurement Approach (AMA) for operational risk, the Internal Model Approach (IMA) for market risk and
interest rate risk in the banking book. These advanced approaches place a higher reliance on a bank’s internal capital
measures and therefore require a more sophisticated level of risk management and risk measurement practices.
On 1 January 2013, reforms to the Basel II capital adequacy framework came into effect (the Basel III framework).
APRA has implemented the Basel III framework, and in some areas has gone further by introducing stricter requirements
(APRA superequivalence). This report details MBL’s disclosures as required by APRA Prudential Standard APS 330: Public
Disclosure as at 31 March 2020 together with the 31 March 2019 comparatives where appropriate.
On 1 July 2019, APRA implemented the standardised approach for measuring counterparty credit risk exposures (SA-CCR).
The March 2020 disclosures include the implementation of the SA-CCR. The comparative period for March 2019 has not
been restated.
This report also describes Macquarie’s risk management policies and risk management framework and the measures
adopted to monitor and report within this framework. Detailed in this report are the major components of capital structure,
the key risk exposures and the associated capital requirements. The key risk exposures are credit risk (including
securitisation exposures, credit valuation adjustment, and exposures to central counterparties), market risk, operational risk
and interest rate risk in the banking book. Each of these risks are individually discussed in later sections of this report where
the individual risk components, measurement techniques and management practices are detailed.
Macquarie Level 2 regulatory group capital, liquidity and leverage ratios and relevant comparatives are set out in the
table below.
Capital, Liquidity and Leverage Ratios
As at
31 March
2020
As at
31 March
2019
Common Equity Tier 1 capital ratio(1) 12.2% 11.4%
Total Tier 1 capital ratio(1) 13.6% 13.5%
Total capital ratio(1) 15.2% 15.6%
Leverage ratio 5.7% 5.3%
Liquidity coverage ratio (2) 173.5% 104.6%
Net stable funding ratio(1) 118.1% 112.9%
(1) The Macquarie Level 2 regulatory group capital and liquidity ratios are above the regulatory minimum required by APRA, and the Board
imposed internal minimum requirement. (2) The Liquidity Coverage Ratio for the 3 months to 31 March 2020 is calculated from 63 daily LCR observations (31 March 2019 is
calculated from 61 daily LCR observations). For 31 March 2020, the Macquarie Level 2 regulatory group LCR is above the regulatory
minimum required by APRA, and the Board imposed internal minimum requirement. The LCR for March 2019 is calculated according
to APRA’s clarification, announced on 24 July 2019, related to intra-group funding provided to MBL. MGL raises long-term funding and
places surplus funds with MBL, in the form of intra-group loans. At the time of APRA’s clarification it was noted that these loans had
represented around 10-15% of MBL’s total funding over the past year. They had been included in the calculation of MBL’s Liquidity
Coverage Ratio according to their contractual tenor and were documented under a master loan agreement, in place since 2007, which
included a Material Adverse Change (MAC) clause.
APRA clarified that the existence of a MAC clause in the master agreement between MGL and MBL meant that repayment of intra-
group funding could be accelerated and thereby fall short of the LCR horizon of 30 days. Macquarie removed the MAC clause on 28
June 2019 to restore the contractual tenor of the loans and ensure there would be no impact on MBL’s LCR calculation going forward.
“LCR pro forma” is calculated reflecting the arrangements following the removal of the MAC clause in the master loan agreement
between MGL and MBL. LCR pro forma for March 2019 was 154%.
1.0 Overview
3
1.0 Overview
1.1 Scope of Application
MBL, as an approved ADI, is required to comply with the disclosure requirements of APS 330 on a Level 2 basis, as
described below.
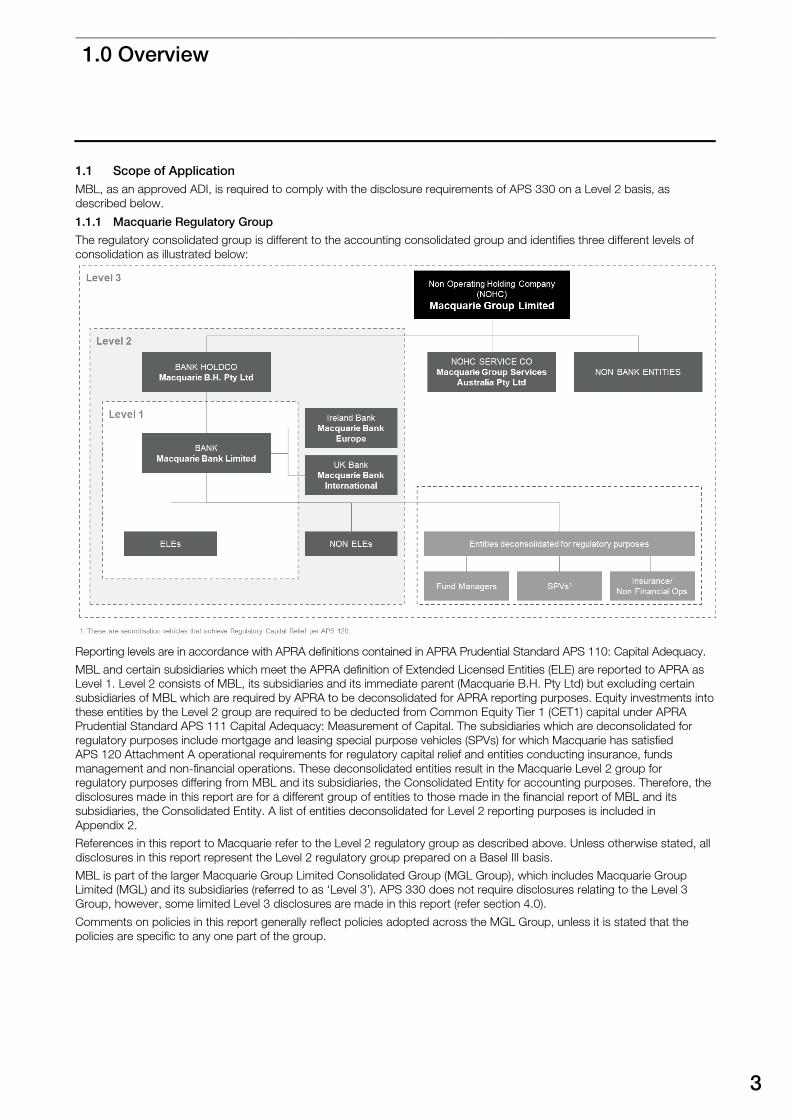
1.1.1 Macquarie Regulatory Group
The regulatory consolidated group is different to the accounting consolidated group and identifies three different levels of
consolidation as illustrated below:
Reporting levels are in accordance with APRA definitions contained in APRA Prudential Standard APS 110: Capital Adequacy.
MBL and certain subsidiaries which meet the APRA definition of Extended Licensed Entities (ELE) are reported to APRA as
Level 1. Level 2 consists of MBL, its subsidiaries and its immediate parent (Macquarie B.H. Pty Ltd) but excluding certain
subsidiaries of MBL which are required by APRA to be deconsolidated for APRA reporting purposes. Equity investments into
these entities by the Level 2 group are required to be deducted from Common Equity Tier 1 (CET1) capital under APRA
Prudential Standard APS 111 Capital Adequacy: Measurement of Capital. The subsidiaries which are deconsolidated for
regulatory purposes include mortgage and leasing special purpose vehicles (SPVs) for which Macquarie has satisfied
APS 120 Attachment A operational requirements for regulatory capital relief and entities conducting insurance, funds
management and non-financial operations. These deconsolidated entities result in the Macquarie Level 2 group for
regulatory purposes differing from MBL and its subsidiaries, the Consolidated Entity for accounting purposes. Therefore, the
disclosures made in this report are for a different group of entities to those made in the financial report of MBL and its
subsidiaries, the Consolidated Entity. A list of entities deconsolidated for Level 2 reporting purposes is included in
Appendix 2.
References in this report to Macquarie refer to the Level 2 regulatory group as described above. Unless otherwise stated, all
disclosures in this report represent the Level 2 regulatory group prepared on a Basel III basis.
MBL is part of the larger Macquarie Group Limited Consolidated Group (MGL Group), which includes Macquarie Group
Limited (MGL) and its subsidiaries (referred to as ‘Level 3’). APS 330 does not require disclosures relating to the Level 3
Group, however, some limited Level 3 disclosures are made in this report (refer section 4.0).
Comments on policies in this report generally reflect policies adopted across the MGL Group, unless it is stated that the
policies are specific to any one part of the group.
Macquarie Bank Limited Pillar 3 Disclosures March 2020 macquarie.com
1.0 Overview
continued
4
1.2 Frequency
The qualitative disclosures in this report are required to be
updated on an annual basis and more frequently if
significant changes to policies are made. This report has
been updated as at 31 March 2020 and policies disclosed
within are effective at this time. The capital adequacy and
summarised credit risk exposure quantitative disclosures are
published on a quarterly basis. All other quantitative
disclosures are published semi-annually in conjunction with
Macquarie’s half year (30 September) and annual (31 March)
reporting cycles.
1.3 Report Conventions
The disclosures in this report are not required to be audited
by an external auditor. However, the disclosures have been
prepared on a basis consistent with information submitted
to APRA. Under the revised APS 310 Audit and Related
Matters, the information submitted to APRA is required to
be either audited or reviewed by an external auditor at
Macquarie’s year end, being 31 March.
Averages have been prepared in this report for certain
disclosures as required by APS 330.
All numbers in this report are in Australian Dollars and have
been rounded to the nearest million, unless
otherwise stated.
Where necessary, comparative information has been
restated to conform with changes in presentation in the
current year, unless otherwise stated.
The Appendices include a Glossary of Terms used
throughout this document.
1.4 Overview of the Basel III Regulatory
Capital Framework
Basel III is designed to raise the resilience of the banking
sector by strengthening the regulatory capital framework,
building on the three pillars of the Basel II framework. The
framework seeks to increase the sensitivity to risk in the
capital calculations and to ensure that this is aligned with an
ADI’s internal processes for assessing risk. Consequently,
there are a number of different approaches to risk
calculation that allows use of internal models to calculate
regulatory capital. A bank may be accredited to use the
advanced approaches when it can demonstrate the integrity
and sophistication of its risk management framework. It
must also ensure that its internal estimates of risk are fully
integrated into corporate governance functions as well as
internal calculations of capital. Further to this, the most
advanced approaches are available if a bank has sufficient
depth and history of default data to enable it to generate its
own Probability of Default (PD) estimates based on its own
loss experience.
The requirements of Basel III are contained within three
broad sections or ‘Pillars’.
1.4.1 Pillar 1
The first section of the Basel III framework covers the rules
by which Risk Weighted Assets (RWA) and capital adequacy
must be calculated.
Macquarie has been approved by APRA to apply the FIRB
approach for credit risk capital calculation. This approach
utilises the PD and internal rating assigned to the obligor.
The exposure is weighted using this internal PD and a Loss
Given Default (LGD) value set by APRA. Credit Conversion
Factors are applied to off balance sheet exposures based
on the nature of the exposure. Operational risk is calculated
using the AMA.
Market risk and interest rate risk in the banking book is
calculated using the internal model approach.
1.4.2 Pillar 2
Pillar 2 (the Supervisory Review Process) of the Basel III
framework requires ADIs to make their own assessments of
capital adequacy in light of their risk profile and to have a
strategy in place for maintaining their capital levels.
Macquarie’s Internal Capital Adequacy Assessment Process
(ICAAP) addresses its requirements under Pillar 2.
The ICAAP is part of Macquarie’s overall risk management
framework; its key features include:
– Comprehensive risk assessment process;
– Internal assessment of capital adequacy using
Macquarie’s economic capital model (refer section 4.1);
– Risk appetite setting (refer section 4.2);
– Capital management plans designed to ensure the
appropriate level and mix of capital given Macquarie’s
risk profile; and
– Regular reporting of capital adequacy and monitoring of
risk profile against risk appetite.
Macquarie’s ICAAP is subject to Board and senior
management oversight and internal control review.
1.4.3 Pillar 3
These disclosures have been formulated in response to the
requirements of Pillar 3 of the Basel III Framework. APRA
has laid down the minimum standards for market disclosure
in its APS 330.
This report includes a breakdown of both on and off-balance
sheet exposures, RWA and Liquidity measures. The report
consists of sections covering:
– Risk Management Governance and Framework
– Capital Management
– Credit Risk Measurement
– Provisioning
– Credit Risk Mitigation
– Securitisation
– Credit Valuation Adjustment
– Exposures to Central Counterparties
– Market Risk
– Equity Risk
– Operational Risk
– Leverage Ratio
– Liquidity Coverage Ratio
– Net Stable Funding Ratio
2.0 Risk Management Governance and Framework
5
2.0 Risk Management Governance and Framework
2.1 Risk Governance at Macquarie
Role of the Board
The role of the Board is to promote the long-term interests
of Macquarie, taking into account Macquarie’s specific and
broader responsibilities to its shareholders, funders, clients,
staff and the communities in which it operates. The Board is
committed to oversight of Macquarie’s performance, risk
management and culture and to promoting the creation of
enduring value. Macquarie’s robust risk management
framework supports the Board in its role. The Board is
ultimately responsible for the framework, including oversight
of its operation by Management.
Role of Management
The Group Heads of the Operating and Central Service
Groups are responsible for implementation of the risk
management framework in their Groups. They are required
semi-annually to attest that key risks have been identified
and are adequately controlled in their Groups. These
management representations support the sign-off of the half
year and the full year financial statements.
Three lines of defence
The assumption of risk is made within a calculated and
controlled framework that assigns clear risk roles and
responsibilities represented by ‘three lines of defence’:
– primary responsibility for risk management lies with the
business. The risk owner is the first line of defence.
An important part of the role of all staff throughout
Macquarie is to ensure they manage risks appropriately
– the Risk Management Group (RMG) forms the second
line of defence and provides independent and objective
review and challenge, oversight, monitoring and
reporting in relation to Macquarie’s material risks
– Internal Audit, as the third line, provides independent
and objective risk-based assurance on the compliance
with, and effectiveness of, the Group’s financial and risk
management framework.
2.2 Macquarie’s Risk Management Framework
Macquarie’s risk management framework is the totality of
systems, structures, policies, processes and people within
the Group that identify, measure, monitor, report and control
or mitigate internal and external sources of material risk.
Material risks are those that could have a material impact,
financial or non-financial on Macquarie. Macquarie’s material
risks include aggregate, asset, conduct, credit,
environmental and social (including climate change), equity,
financial crime, legal, liquidity, market, operational (including
cyber and information security), regulatory and compliance,
reputational, strategic, tax, and work health and safety risks.
The risk management framework applies to all Operating
and Central Service Groups.
Core risk management principles
Macquarie’s approach to risk management is based on stable
and robust core risk management principles. These are:
– ownership of risk at the business level: Group Heads
are responsible for ownership of all material risks that
arise in, or because of, the business’ operations,
including identification, measurement, control and
mitigation of these risks. Before taking decisions, clear
analysis of the risks is sought to ensure those taken are
consistent with the risk appetite and strategy
of Macquarie
– understanding worst case outcomes: Macquarie’s
risk management approach is based on examining the
consequences of worst case outcomes and
determining whether these are acceptable and within
Macquarie’s risk appetite. This approach is adopted for
all material risk types and is often achieved by stress
testing. Macquarie operates a number of sophisticated
quantitative risk management processes, but the
foundation of the approach is the informed
consideration of both quantitative and qualitative inputs
by highly experienced professionals
– requirement for an independent sign-off by RMG:
Macquarie places significant importance on having a
strong, independent Risk Management Group charged
with signing off all material risk acceptance decisions. It
is essential that RMG has the capability to do this
effectively. RMG has invested in recruiting skilled
professionals, including those with trading or
investment banking experience. For all material
proposals, RMG’s opinion must be sought at an early
stage in the decision-making process. The approval
document submitted to Senior Management must
include independent input from RMG on risk and return.
Macquarie Bank Limited Pillar 3 Disclosures March 2020 macquarie.com
2.0 Risk Management Governance and Framework
continued
6
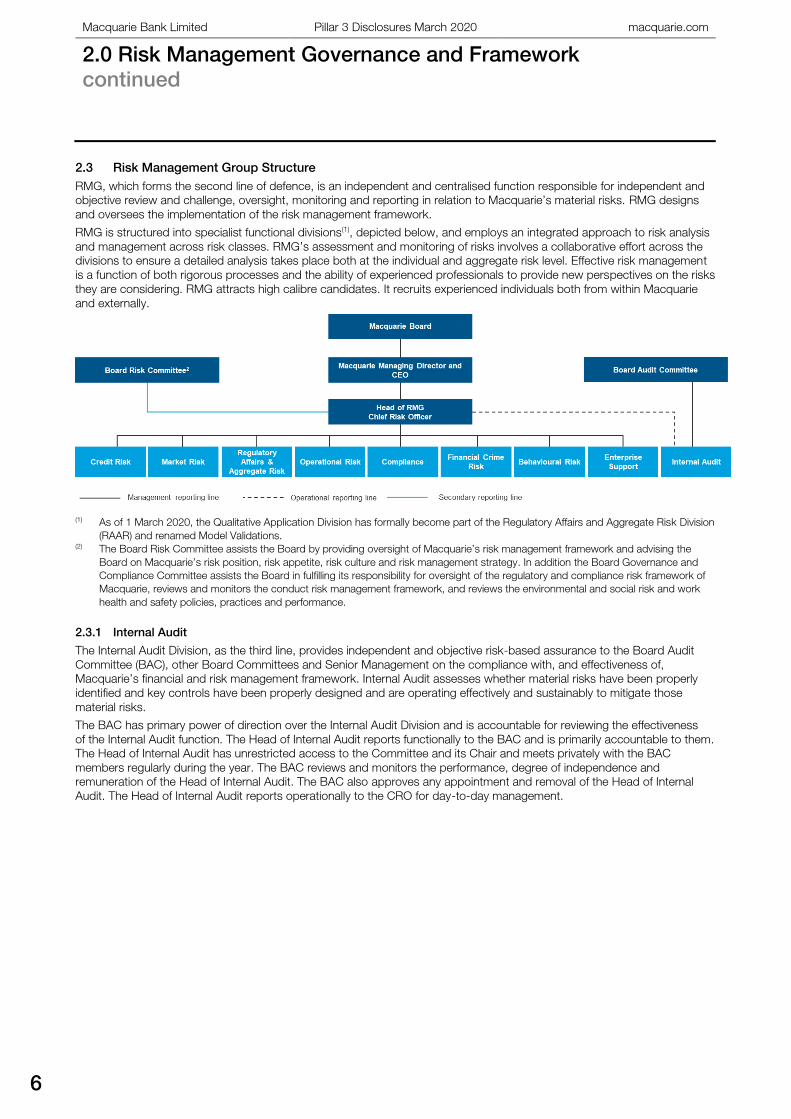
2.3 Risk Management Group Structure
RMG, which forms the second line of defence, is an independent and centralised function responsible for independent and
objective review and challenge, oversight, monitoring and reporting in relation to Macquarie’s material risks. RMG designs
and oversees the implementation of the risk management framework.
RMG is structured into specialist functional divisions(1), depicted below, and employs an integrated approach to risk analysis
and management across risk classes. RMG’s assessment and monitoring of risks involves a collaborative effort across the
divisions to ensure a detailed analysis takes place both at the individual and aggregate risk level. Effective risk management
is a function of both rigorous processes and the ability of experienced professionals to provide new perspectives on the risks
they are considering. RMG attracts high calibre candidates. It recruits experienced individuals both from within Macquarie
and externally.
(1) As of 1 March 2020, the Qualitative Application Division has formally become part of the Regulatory Affairs and Aggregate Risk Division
(RAAR) and renamed Model Validations.(2) The Board Risk Committee assists the Board by providing oversight of Macquarie’s risk management framework and advising the
Board on Macquarie’s risk position, risk appetite, risk culture and risk management strategy. In addition the Board Governance and
Compliance Committee assists the Board in fulfilling its responsibility for oversight of the regulatory and compliance risk framework of
Macquarie, reviews and monitors the conduct risk management framework, and reviews the environmental and social risk and work
health and safety policies, practices and performance.
2.3.1 Internal Audit
The Internal Audit Division, as the third line, provides independent and objective risk-based assurance to the Board Audit
Committee (BAC), other Board Committees and Senior Management on the compliance with, and effectiveness of,
Macquarie’s financial and risk management framework. Internal Audit assesses whether material risks have been properly
identified and key controls have been properly designed and are operating effectively and sustainably to mitigate those
material risks.
The BAC has primary power of direction over the Internal Audit Division and is accountable for reviewing the effectiveness
of the Internal Audit function. The Head of Internal Audit reports functionally to the BAC and is primarily accountable to them.
The Head of Internal Audit has unrestricted access to the Committee and its Chair and meets privately with the BAC
members regularly during the year. The BAC reviews and monitors the performance, degree of independence and
remuneration of the Head of Internal Audit. The BAC also approves any appointment and removal of the Head of Internal
Audit. The Head of Internal Audit reports operationally to the CRO for day-to-day management.
3.0 Capital Structure
7
3.0 Capital Structure
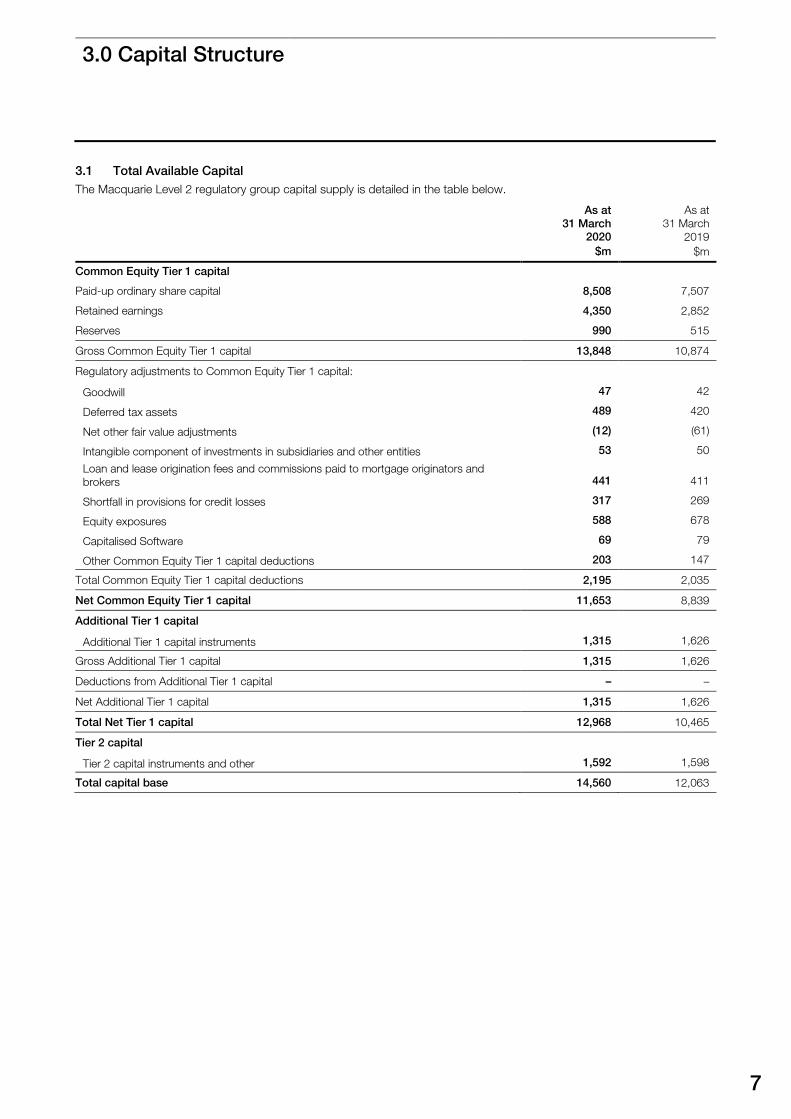
3.1 Total Available Capital
The Macquarie Level 2 regulatory group capital supply is detailed in the table below.
As at
31 March
2020
$m
As at
31 March
2019
$m
Common Equity Tier 1 capital
Paid-up ordinary share capital 8,508 7,507
Retained earnings 4,350 2,852
Reserves 990 515
Gross Common Equity Tier 1 capital 13,848 10,874
Regulatory adjustments to Common Equity Tier 1 capital:
Goodwill 47 42
Deferred tax assets 489 420
Net other fair value adjustments (12) (61)
Intangible component of investments in subsidiaries and other entities 53 50
Loan and lease origination fees and commissions paid to mortgage originators and
brokers 441 411
Shortfall in provisions for credit losses 317 269
Equity exposures 588 678
Capitalised Software 69 79
Other Common Equity Tier 1 capital deductions 203 147
Total Common Equity Tier 1 capital deductions 2,195 2,035
Net Common Equity Tier 1 capital 11,653 8,839
Additional Tier 1 capital
Additional Tier 1 capital instruments 1,315 1,626
Gross Additional Tier 1 capital 1,315 1,626
Deductions from Additional Tier 1 capital – –
Net Additional Tier 1 capital 1,315 1,626
Total Net Tier 1 capital 12,968 10,465
Tier 2 capital
Tier 2 capital instruments and other 1,592 1,598
Total capital base 14,560 12,063
Macquarie Bank Limited Pillar 3 Disclosures March 2020 macquarie.com
3.0 Capital Structure
continued
8
3.2 Common Equity Tier 1 Capital
Macquarie’s Common Equity Tier 1 capital under Basel III
consists of ordinary share capital, retained earnings and
certain reserves. $A1,000 million of additional ordinary
shares were issued by Macquarie Bank Limited to its parent
entity of Macquarie B.H.Pty Ltd in March 2020. These
additional ordinary shares are eligible to be included as
Common Equity Tier 1 capital at Regulatory Level 2 Group
from the issuance month onwards.
3.3 Additional Tier 1 Capital
Macquarie’s Tier 1 capital consists of Common Equity Tier 1
capital and Additional Tier 1 capital (hybrids).
Macquarie’s Additional Tier 1 capital consists of Macquarie
Income Securities (MIS) and Macquarie Additional Capital
Securities (MACS).
MIS are a perpetual instrument with no ordinary equity
conversion rights. MIS were listed for trading on the
Australian Stock Exchange (now known as the Australian
Securities Exchange) in 1999. MIS distributions are paid
quarterly at a floating rate of BBSW plus 1.7% per annum
and payment is subject to certain conditions including
profitability of the Bank. MIS are included in Additional Tier 1
capital under Basel III transitional rules. MIS were repaid on
15 April 2020, followed by a redemption on 16 April 2020.
MACS were issued by MBL, acting through its London
Branch in March 2017. MACS are subordinated, unsecured
notes that pay discretionary, non-cumulative, semi-annual
fixed rate cash distributions. Subject to certain conditions
the MACS may be redeemed on 8 March 2027, or every
5th anniversary thereafter. MACS can be exchanged for a
variable number of fully paid MGL ordinary shares on an
acquisition event (where a person acquires control of MBL
or MGL), where MBL’s common equity Tier 1 capital ratio
falls below 5.125%, or where APRA determines MBL would
be non-viable without an exchange or a public sector
injection of capital (or equivalent support).
BCN were issued by MBL in October 2014 and are quoted
on the Australian Securities Exchange. The BCN pay
discretionary, semi-annual floating rate cash distributions
equal to six month BBSW plus 3.30% per annum margin,
adjusted for franking credits. These instruments are non-
cumulative and unsecured and may be redeemed at face
value on 24 March 2020, 24 September 2020 and 24
March 2021 (subject to certain conditions being satisfied)
or earlier in specified circumstances. The BCN can be
converted into a variable number of MGL ordinary shares
(subject to certain conditions being satisfied) on these
redemption dates; mandatorily exchanged on 24 March
2023; exchanged earlier upon an acquisition event (with
the acquirer gaining control of MGL or MBL); or where
APRA determines MBL would be non-viable without an
exchange or a public sector injection of capital (or equivalent
support). On 24 March 2020, MBL redeemed the BCN.
No BCN were exchanged during the period before
their redemption.
3.4 Tier 2 Capital
Macquarie’s Tier 2 capital consists of a portion of certain
credit loss reserves plus subordinated debt instruments.
A portion of subordinated debt is included under Basel III
transitional rules which require the value recognised to
amortise by 10% each year until no part of the instruments
are included after 10 years.
MBL has issued cumulative convertible subordinated debt
amounting to $US750 million in June 2015 which is Basel III
compliant and not subject to the transitional rules referred to
above. This is reported at the value of liability at the period
end date.
3.5 Restrictions on Capital
Various restrictions or costs exist on the transfer of capital
within the Macquarie accounting consolidated group.
For example:
– Licensed entities such as Australian Financial Services
Licensed (AFSL) entities are required to maintain
minimum capital requirements to comply with their
licence. Macquarie seeks to maintain a sufficient level of
capital within these entities to ensure compliance with
these regulations;
– Where retained earnings are transferred from related
entities, tax costs may be payable on repatriation which
may reduce the actual amount of available capital;
– As an ADI, Macquarie is subject to the prudential limits
imposed by APRA Prudential Standard APS 222:
Associations with Related Entities;
– RMG also manage and monitor internal limits on
exposures to related entities which, combined with
APRA’s prudential limits, seeks to minimise
contagion risk.
4.0 Capital Adequacy
9
4.0 Capital Adequacy
4.1 Capital Management
Macquarie’s capital management strategy is to maximise shareholder value through optimising the level and use of capital
resources, whilst also providing the flexibility to take advantage of opportunities as they may arise.
The capital management objectives are to:
– continue to support Macquarie’s credit rating;
– ensure sufficient capital resources to support Macquarie’s business and operational requirements;
– maintain sufficient capital to exceed externally imposed capital requirements; and
– safeguard Macquarie’s ability to continue as a going concern.
Macquarie’s capital management strategy uses both internal and external measures of capital. Internally, Macquarie has
developed an economic capital model that is used to quantify MGL Group’s aggregate level of risk. The economic capital
framework complements the management of specific risk types such as equity, credit, market and operational risk by
providing an aggregate view of MGL Group’s risk profile.
The economic capital model is used to support business decision-making and has two main applications:
– capital adequacy assessment; and
– risk-adjusted performance measurement.
Capital adequacy is assessed for both MGL Group and the Level 2 regulatory group. In each case, capital adequacy is
assessed on a regulatory basis and on an economic basis, with capital requirements assessed as follows:
Economic capital adequacy means an internal assessment of capital adequacy, designed to ensure Macquarie has sufficient
capital to absorb potential losses and provide creditors with the required degree of protection.
Potential losses are quantified using the Economic Capital Adequacy Model (ECAM). These potential losses are compared to
the capital resources available to absorb loss, consisting of book equity and eligible hybrid equity. Earnings are also available
to absorb losses, however, only a fraction of potential earnings is recognised as a buffer against losses.
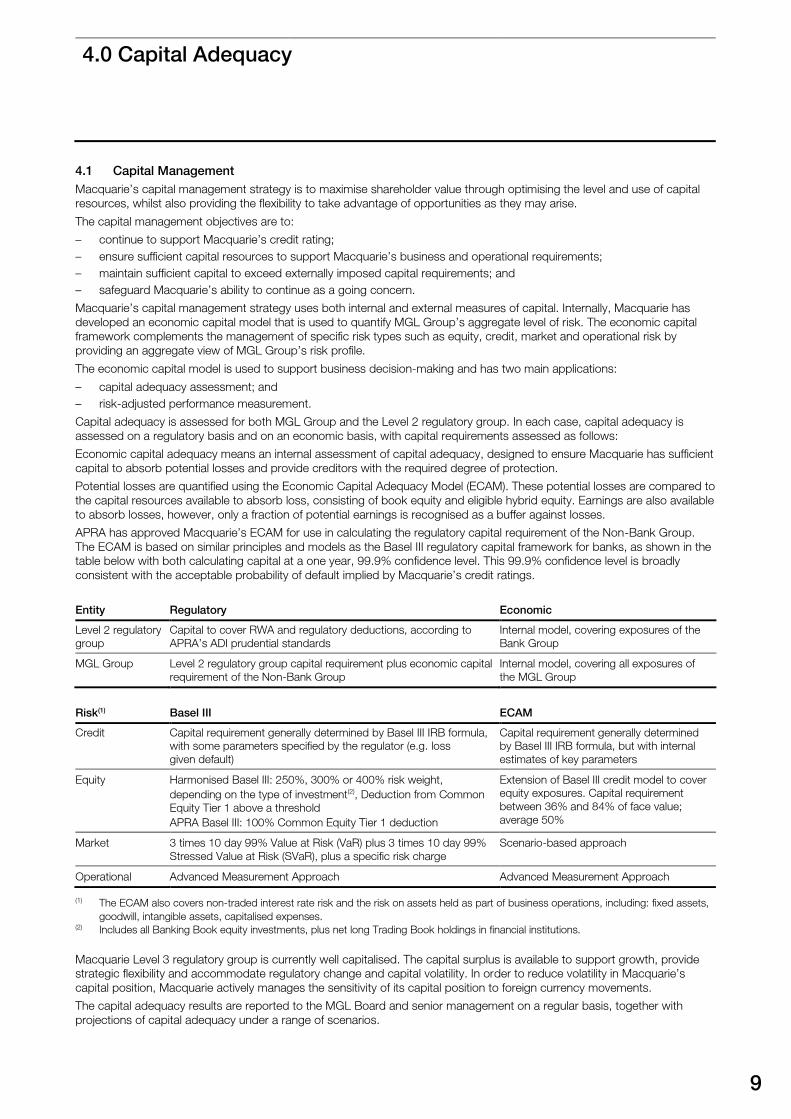
APRA has approved Macquarie’s ECAM for use in calculating the regulatory capital requirement of the Non-Bank Group.
The ECAM is based on similar principles and models as the Basel III regulatory capital framework for banks, as shown in the
table below with both calculating capital at a one year, 99.9% confidence level. This 99.9% confidence level is broadly
consistent with the acceptable probability of default implied by Macquarie’s credit ratings.
Entity Regulatory Economic
Level 2 regulatory
group
Capital to cover RWA and regulatory deductions, according to
APRA’s ADI prudential standards
Internal model, covering exposures of the
Bank Group
MGL Group Level 2 regulatory group capital requirement plus economic capital
requirement of the Non-Bank Group
Internal model, covering all exposures of
the MGL Group
Risk(1) Basel III ECAM
Credit Capital requirement generally determined by Basel III IRB formula,
with some parameters specified by the regulator (e.g. loss
given default)
Capital requirement generally determined
by Basel III IRB formula, but with internal
estimates of key parameters
Equity Harmonised Basel III: 250%, 300% or 400% risk weight,
depending on the type of investment(2), Deduction from Common
Equity Tier 1 above a threshold
APRA Basel III: 100% Common Equity Tier 1 deduction
Extension of Basel III credit model to cover
equity exposures. Capital requirement
between 36% and 84% of face value;
average 50%
Market 3 times 10 day 99% Value at Risk (VaR) plus 3 times 10 day 99%
Stressed Value at Risk (SVaR), plus a specific risk charge
Scenario-based approach
Operational Advanced Measurement Approach Advanced Measurement Approach
(1) The ECAM also covers non-traded interest rate risk and the risk on assets held as part of business operations, including: fixed assets,
goodwill, intangible assets, capitalised expenses. (2) Includes all Banking Book equity investments, plus net long Trading Book holdings in financial institutions.
Macquarie Level 3 regulatory group is currently well capitalised. The capital surplus is available to support growth, provide
strategic flexibility and accommodate regulatory change and capital volatility. In order to reduce volatility in Macquarie’s
capital position, Macquarie actively manages the sensitivity of its capital position to foreign currency movements.
The capital adequacy results are reported to the MGL Board and senior management on a regular basis, together with
projections of capital adequacy under a range of scenarios.
Macquarie Bank Limited Pillar 3 Disclosures March 2020 macquarie.com
4.0 Capital Adequacy
continued
10
4.2 Risk Appetite Setting
Macquarie’s risk appetite is the degree of risk that the
Group is prepared to accept in pursuit of its strategic
objectives and business plan. This is detailed in Macquarie’s
Board approved Risk Appetite Statement (RAS). The RAS
describes Macquarie’s risk appetite, being the nature and
amount of risk that Macquarie is willing to accept in pursuit
of an appropriate and resilient long-term return on its
capital. The RAS states transactions must generate returns
proportionate to the risks. Accordingly, a risk and return
analysis is required for all significant new deals, products
and businesses.
The RAS is accessible to all staff and is referred to in the
Code of Conduct. The principles of the RAS are
implemented primarily through the following mechanisms:
Policies
Policies are a key tool to ensure that risks taken are
consistent with the Board approved RAS. They set out the
principles that govern the acceptance and management
of risks. They are designed to influence and determine all
major decisions and actions, and all activities must take
place within the boundaries set by them.
Limits
In many cases, limits translate risk appetite principles into
hard constraints on individual businesses. These consist of
granular limits for specific risk types as well as the Global
Risk Limit that constrains Macquarie’s aggregate level of
risk. Macquarie sets the Global Risk Limit with reference not
only to capital but also to earnings so that in a prolonged,
severe downturn, earnings and surplus capital are sufficient
to cover losses and maintain market confidence
in Macquarie.
Under Macquarie’s ‘no limits, no dealing’ approach,
compliance with specific limits is monitored by the Business
and RMG. These granular limits are set to allow businesses
to achieve their near-term plans while promoting a
reassessment of the opportunity and associated risks as the
limit is approached.
New product and business approval process
All new businesses and significant changes to existing
products, processes or systems are subject to a rigorous,
interactive approval process that adheres to the principles
stated in the RAS. This results in constructive dialogue on
risk matters between RMG and the relevant business.
This formal process is designed so that the proposed
transaction or operation can be managed properly, without
creating unwanted risks for Macquarie. All relevant risks are
reviewed to ensure they are identified and addressed prior
to implementation. These risks are also monitored on an
ongoing basis. The approvals of RMG, Financial
Management Group, Legal and Governance and other
relevant stakeholders within Macquarie are obtained. RMG
also checks that all necessary internal approvals are
obtained prior to commencement. The Operational Risk
division within RMG oversees the new product and business
approval process.
The Risk Appetite Test – An aggregate stress test
The key tool that the Board uses to quantify aggregate risk
appetite is the Risk Appetite Test. This is a Macquarie-wide
stress test that considers losses and earnings under a
severe economic downturn scenario with the aim of
Macquarie emerging from that scenario with sufficient
capital to continue operating.
The Risk Appetite Test asserts that potential losses must be
less than the Global Risk Limit, which comprises underlying
earnings that Macquarie can achieve in a downturn
(downturn forward earnings capacity) plus surplus regulatory
capital. Consideration is also given to the year-by-year
outcome of the modelled downturn scenario to ensure that
market confidence is maintained.
Operating Groups and Divisions estimate downturn forward
earnings capacity under a downturn scenario provided to
them by RMG. RMG reviews the estimates for consistency
with scenario assumptions and across groups.
Aggregate risk breaks down into two categories:
– Business risk, meaning decline in earnings through
deterioration in volumes and margins due to market
conditions; and
– Potential losses, including potential credit losses,
write-downs of equity investments, operational risk
losses and losses on trading positions.
Business risk is captured by the difference in base case and
downturn forward earnings estimates. Potential losses are
quantified using stress testing models, which translate
scenario parameters (GDP, unemployment, interest rates
etc) into loss and transition rates. A principal use of the Risk
Appetite Test is in setting the Equity Risk Limit (ERL). This
limit constrains Macquarie’s aggregate level of risk arising
from principal equity positions, managed fund holdings,
property equity investments and other equity investments.
Any changes to the ERL are sized to ensure that even under
full use of this limit and allowing for growth in other risk
types, the requirements of the Risk Appetite Test will
be met.
11
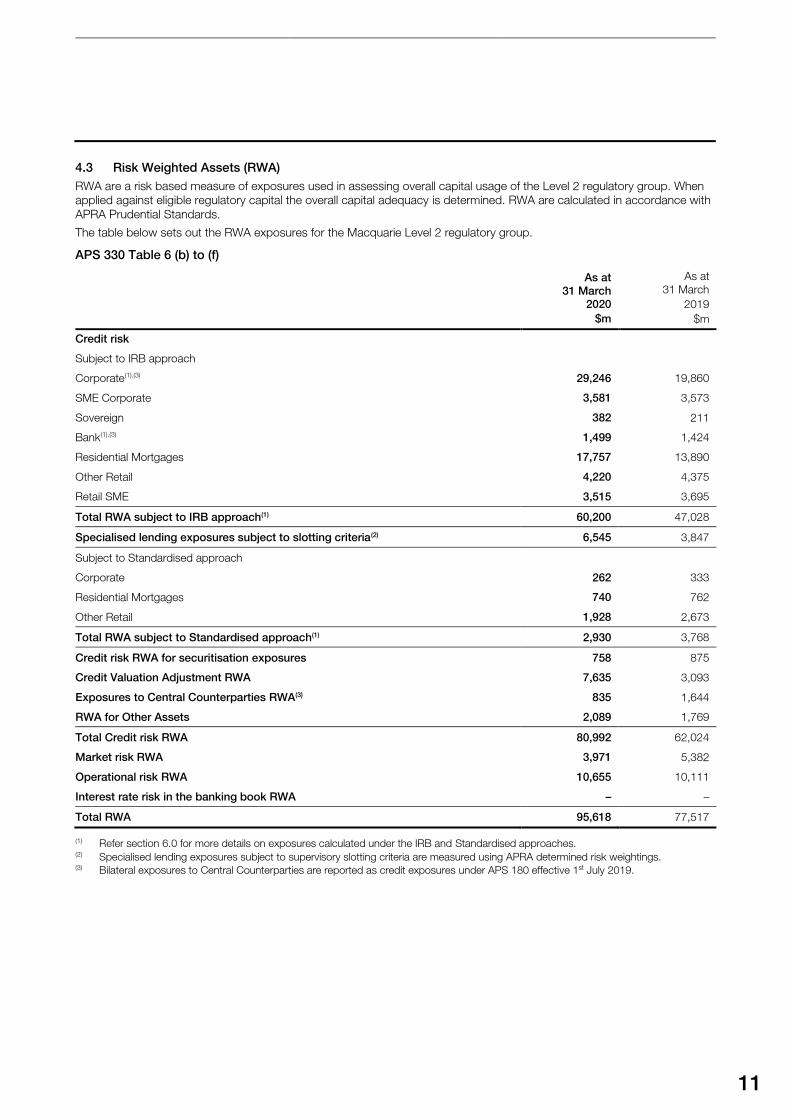
4.3 Risk Weighted Assets (RWA)
RWA are a risk based measure of exposures used in assessing overall capital usage of the Level 2 regulatory group. When
applied against eligible regulatory capital the overall capital adequacy is determined. RWA are calculated in accordance with
APRA Prudential Standards.
The table below sets out the RWA exposures for the Macquarie Level 2 regulatory group.
APS 330 Table 6 (b) to (f)
As at
31 March
2020
$m
As at
31 March
2019
$m
Credit risk
Subject to IRB approach
Corporate(1),(3) 29,246 19,860
SME Corporate 3,581 3,573
Sovereign 382 211
Bank(1),(3) 1,499 1,424
Residential Mortgages 17,757 13,890
Other Retail 4,220 4,375
Retail SME 3,515 3,695
Total RWA subject to IRB approach(1) 60,200 47,028
Specialised lending exposures subject to slotting criteria(2) 6,545 3,847
Subject to Standardised approach
Corporate 262 333
Residential Mortgages 740 762
Other Retail 1,928 2,673
Total RWA subject to Standardised approach(1) 2,930 3,768
Credit risk RWA for securitisation exposures 758 875
Credit Valuation Adjustment RWA 7,635 3,093
Exposures to Central Counterparties RWA(3) 835 1,644
RWA for Other Assets 2,089 1,769
Total Credit risk RWA 80,992 62,024
Market risk RWA 3,971 5,382
Operational risk RWA 10,655 10,111
Interest rate risk in the banking book RWA – –
Total RWA 95,618 77,517
(1) Refer section 6.0 for more details on exposures calculated under the IRB and Standardised approaches. (2) Specialised lending exposures subject to supervisory slotting criteria are measured using APRA determined risk weightings. (3) Bilateral exposures to Central Counterparties are reported as credit exposures under APS 180 effective 1st July 2019.
Macquarie Bank Limited Pillar 3 Disclosures March 2020 macquarie.com
4.0 Capital Adequacy
continued
12
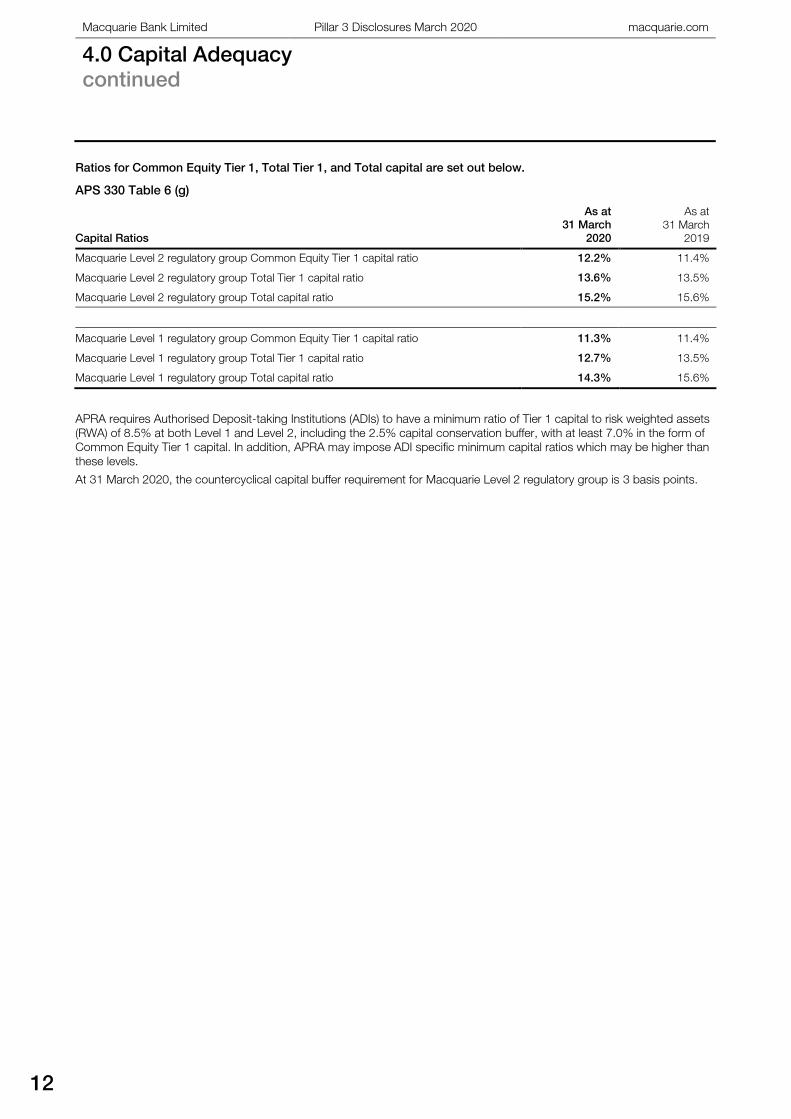
Ratios for Common Equity Tier 1, Total Tier 1, and Total capital are set out below.
APS 330 Table 6 (g)
Capital Ratios
As at
31 March
2020
As at
31 March
2019
Macquarie Level 2 regulatory group Common Equity Tier 1 capital ratio 12.2% 11.4%
Macquarie Level 2 regulatory group Total Tier 1 capital ratio 13.6% 13.5%
Macquarie Level 2 regulatory group Total capital ratio 15.2% 15.6%
Macquarie Level 1 regulatory group Common Equity Tier 1 capital ratio 11.3% 11.4%
Macquarie Level 1 regulatory group Total Tier 1 capital ratio 12.7% 13.5%
Macquarie Level 1 regulatory group Total capital ratio 14.3% 15.6%
APRA requires Authorised Deposit-taking Institutions (ADIs) to have a minimum ratio of Tier 1 capital to risk weighted assets
(RWA) of 8.5% at both Level 1 and Level 2, including the 2.5% capital conservation buffer, with at least 7.0% in the form of
Common Equity Tier 1 capital. In addition, APRA may impose ADI specific minimum capital ratios which may be higher than
these levels.
At 31 March 2020, the countercyclical capital buffer requirement for Macquarie Level 2 regulatory group is 3 basis points.
5.0 Credit Risk Measurement
13
5.0 Credit Risk Measurement
5.1 Credit Risk Overview
Credit risk is defined as the risk that a counterparty will fail
to complete its contractual obligations when they fall due
(default risk) or changes in the creditworthiness of the
obligor (migration risk). The consequent loss is either the
amount of the loan or financial obligation not paid back, the
change in the value of a non-traded debt instrument, or the
loss incurred in replicating a trading contract with a
new counterparty.
RMG Credit maintains a comprehensive and robust
framework for the identification, analysis and monitoring of
credit risks arising in each business. Key aspects of this
framework are detailed below.
5.2 Credit Risk Management
Macquarie’s philosophy on credit risk management reflects
the principle of separating prudential control from
operational management. The responsibility for approval of
initial credit limits is delegated to specific individuals.
Credit risk approvals reflect two principles:
– a requirement for dual sign-off; and
– a requirement that, above specified limits, all credit
exposures must be approved outside the business line
proposing to undertake them.
5.2.1 Analysis and Approval of Exposures
The MGL and MBL Boards are responsible for establishing
the framework for approving credit exposures. The Boards
delegate discretions to approve credit exposure to
designated individuals within the Group whose capacity to
prudently exercise authority has been assessed.
Operating groups are assigned modest levels of credit
discretions. Credit exposures above these levels are
assessed independently by RMG and approved by
experienced RMG staff, the CEO and the Boards
as required.
Macquarie enforces a strict ‘no limit, no dealing’ rule. All
proposed transactions are analysed and approved by
designated individuals before they can proceed.
All wholesale credit exposures are reviewed at least once a
year, or more frequently if required. Retail credit exposures
are monitored on a portfolio basis.
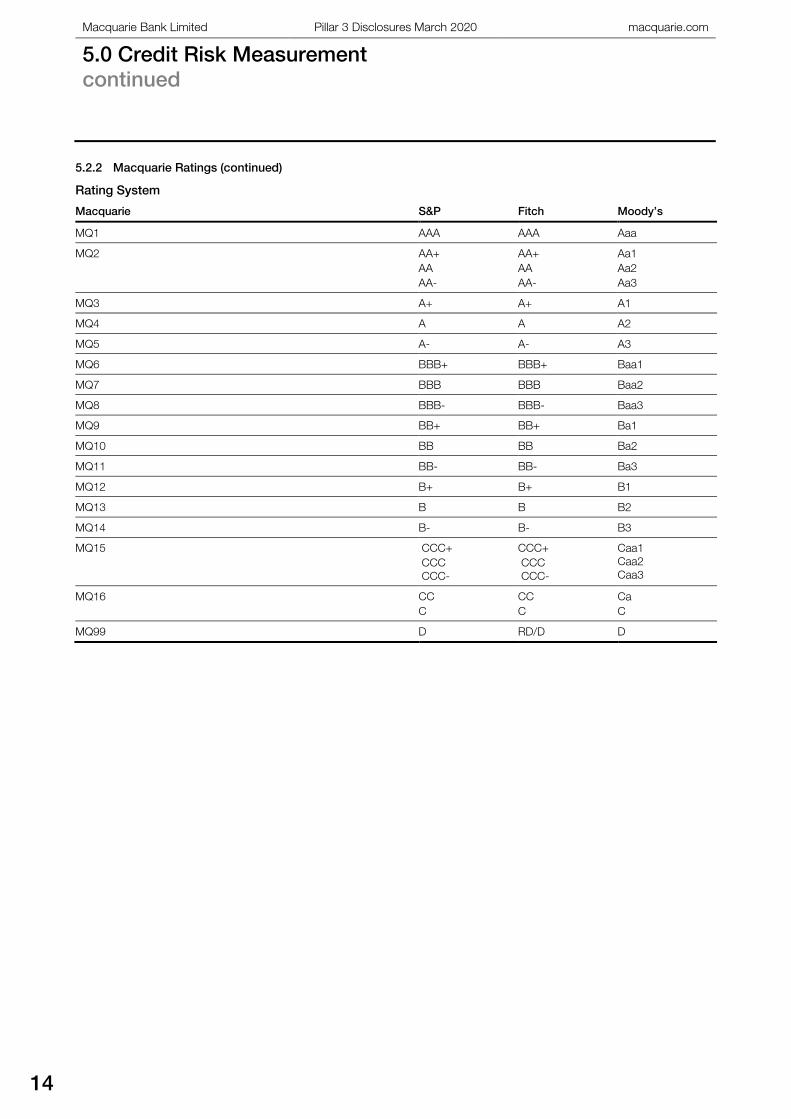
5.2.2 Macquarie Ratings
All corporate, sovereign and bank counterparties (wholesale)
customer limits and exposures are allocated a Macquarie
Group rating (MQ rating) which broadly correspond with
Standard and Poor’s (S&P), Fitch and Moody’s Investor
Services credit ratings. Each MQ rating has been assigned a
PD derived from Standard and Poor’s long term average
one year default rates for similarly rated obligors. A LGD
percentage is additionally assigned to each limit and
exposure, reflecting the economic loss estimated to result if
default occurs, taking into account the security supporting
the credit exposure.
Ratings provided by External Credit Assessment Institutions
(ECAI) are considered throughout the rating process but are
supplementary to the internal rating process.
The table on next page outlines the internal MQ Ratings
relative to ECAI ratings.
MQ ratings are used to:
– assess the default risk of credit exposures for
management reporting, credit approval of limits, risk
attribution and regulatory purposes;
– assist in credit decisions by providing guidelines and
tools that promote a more consistent analytical
approach;
– assist in the process of sharing credit knowledge
(including knowledge of specialised and unique
companies, industries and products); and
– provide a basis for disclosing and reporting to investors
and the market.
Each MQ rating band is associated with an estimate of the
PD by the counterparty on its financial obligations and
provides a consistent measure across the Level 2 regulatory
group. Applicable at either the borrower or transaction level,
a rating must be justified and set as part of the credit
approval and review process.
The ratings process combines a quantitative analysis by way
of scoring industry specific risk factors and a qualitative
assessment based on expert judgement.
Macquarie Bank Limited Pillar 3 Disclosures March 2020 macquarie.com
5.0 Credit Risk Measurement
continued
14
5.2.2 Macquarie Ratings (continued)
Rating System
Macquarie S&P Fitch Moody’s
MQ1 AAA AAA Aaa
MQ2 AA+
AA
AA-
AA+
AA
AA-
Aa1
Aa2
Aa3
MQ3 A+ A+ A1
MQ4 A A A2
MQ5 A- A- A3
MQ6 BBB+ BBB+ Baa1
MQ7 BBB BBB Baa2
MQ8 BBB- BBB- Baa3
MQ9 BB+ BB+ Ba1
MQ10 BB BB Ba2
MQ11 BB- BB- Ba3
MQ12 B+ B+ B1
MQ13 B B B2
MQ14 B- B- B3
MQ15 CCC+
CCC
CCC-
CCC+
CCC
CCC-
Caa1
Caa2
Caa3
MQ16 CC
C
CC
C
Ca
C
MQ99 D RD/D D
15
For wholesale counterparties, Macquarie utilises a number
of industry templates and a sovereign template to assess
the appropriate MQ ratings. These industry templates are
designed to ensure that Macquarie ratings take into account
the different risk factors that affect different industries.
Analysts are required to input a range of quantitative and
qualitative factors and then consider the MQ rating output.
At the same time as considering the appropriate MQ rating,
analysts are also required to consider the appropriate LGD.
For economic capital purposes, LGDs are stressed
estimates, taking into account the security, jurisdiction,
seniority and quality of the balance sheet. For regulatory
capital, MBL uses the APRA supervisory estimates
for LGDs.
For retail counterparties, PDs and LGDs are assigned to
retail pools. Retail exposures are allocated to pools, such
that each pool has homogenous risk. PDs and LGDs are
calculated using the following methods:
– PDs: calculate the long-run average default rate from
the internal and external default data available for each
pool. When internal data is not available in sufficient
quantity, external data is used but only in the case
where it is relevant to the pool.
– LGDs: consider a downturn scenario and the loss that
would be incurred for this scenario on defaulted loans
in each pool.
Macquarie applies a standard definition of default, which is
that an item is considered defaulted when it is either (i) 90
days past due; or (ii) unlikely to pay. ‘Unlikely to pay’ is
defined in Macquarie policies based on APRA standards.
All templates and models are validated annually by RMG
Credit with oversight from the Credit Models Review
Committee. The following annual validation activities are
undertaken:
– validation of wholesale ratings templates;
– validation of wholesale PD estimates;
– validation of wholesale LGD estimates;
– wholesale ratings migration analysis;
– validation of retail PDs;
– validation of retail LGDs; and
– approval of any changes to credit risk models.
Macquarie has developed system functionality to support
the allocation of internal ratings. This application ensures
that all supporting factors and weightings are stored
together with the system-generated rating. Approvers have
access to all of these details through the credit approval
process. Details are also maintained of any rating override
which must be accompanied by specific commentary from
the credit analyst and which is subject to regular review.
Macquarie considers that ratings are an integral part of
determining the creditworthiness of the obligor. However,
Macquarie does not believe that model and template output
should replace thorough and thoughtful analysis. In addition
to the system details, credit analysts must also provide
specific justification of the internal rating as part of their
overall credit analysis of each counterparty. Credit
approvers consider and approve the internal rating for the
counterparty in relation to the size and tenor of their
proposed credit limits.
All proposals for significant deals, products and businesses
must contain an analysis of risk-adjusted returns, based on
the ECAM which for credit exposures is a function of the
assessed credit rating (together with other factors such as
maturity and estimates of LGD). In assessing these
proposals, the Executive Committee and Board consider
these returns together with other relevant factors. They
therefore form an important element in ensuring the visibility
and impact of the MQ rating to the overall risk
acceptance decision.
Risk-adjusted performance metrics for each business unit
are prepared on a regular basis and distributed to senior
management and the Board as well as to business units.
These performance metrics are based on Regulatory Capital
and Economic Capital usage and are a significant factor
when allocations of performance-based remuneration are
determined for each business.
5.2.3 Measuring and Monitoring Exposures
Credit exposures are calculated differently according to the
nature of the obligation. Loan assets are reported at
amortised cost and fair value whereas derivative contracts
are measured according to both internal and regulatory
measures of Counterparty Credit Exposure. Exposures are
assessed in the context of the replacement cost of the
contract should the counterparty default prior to the maturity
of the trade.
Derivative revaluation based measures are calculated using
valuation models which are consistent with those used for
determining mark to market values for financial reporting
purposes and are reported daily to RMG Credit.
Macquarie Bank Limited Pillar 3 Disclosures March 2020 macquarie.com
5.0 Credit Risk Measurement
continued
16
For regulatory purposes, exposure at default is calculated
according to the Standardised Approach to Counterparty
Credit Risk (SA-CCR) outlined in APRA ADI Prudential
Standards 180 (APS 180) and comprises of replacement
cost (RC) and potential future exposure (PFE). The RC is a
function of derivative revaluation, collateralisation and the
terms of any variation margin agreement in place with a
counterparty. The PFE is a function of the outstanding
notional of derivative contracts with a counterparty, the
nature of these contracts, the level of collateralisation and
whether these contracts are subject to variation margining.
The sum of the RC and the PFE is subject to a regulatory
prescribed scaling factor, the alpha multiplier, which
equals 1.4.
The internal measure of counterparty credit exposure is
calculated as a function of market movements. A range of
exposure profiles are calculated representing portfolio
exposures at different confidence levels or under predefined
scenarios through the life of the portfolio. At a minimum,
counterparty credit limits are set for all businesses against a
consistent low probability (high confidence) profile. The
effect of this limit framework is to ensure that there is a low
probability of exposures exceeding the original approved
limit. The models and parameters used to determine future
asset prices and consequent portfolio exposures are
reviewed and approved by RMG quarterly, significant
changes in volatility or market conditions result in more
frequent reviews.
High confidence level exposure measures are supplemented
by regular and ad hoc exposure sensitivity analysis to
evaluate the effect of extreme stress on the portfolio.
Exposure relating to derivatives are calculated on a net basis
where appropriate legal netting arrangements are in effect.
The details of what products can be netted for each
counterparty are recorded in legal documentation systems.
These systems are tightly integrated into the exposure
calculation functionality and serve to ensure that netting is
only performed when the legal basis for this has been
formally assessed and confirmed.
Where trading gives rise to settlement risk, this risk is
normally assessed at full face value of the settlement
amount. However, Macquarie utilises a number of market
standard clearing mechanisms to ensure that the bulk of
settlements are effected on a secured basis or through
exchanges where a Delivery vs payment (DVP) settlement
process is ensured.
Contingent exposures arising from the issuance of
guarantees, letters of credit and performance bonds are
also reported daily.
On and off-balance sheet exposures are considered
together for approval, monitoring and reporting purposes.
Credit exposures of all types are calculated and
reported daily.
Each business is responsible for calculating their credit
exposures to ensure that they stay within credit limits. In
addition, these exposures are supplied to RMG Credit on a
daily basis for centralised limit monitoring. Any excesses
identified are investigated and escalated as appropriate to
both business line and RMG management. All reportable
excesses are summarised and reported to the Board
monthly. All wholesale limits and ratings are reviewed at
least once a year, or more frequently if necessary, to ensure
any deterioration is identified and reflected in an adjustment
to limits and/or their MQ rating. Furthermore, other
indicators of deterioration in credit quality are regularly
monitored, such as share price and credit default swap
spread movements, covenant breaches and external credit
ratings downgrades. Where appropriate, these are reported
to senior management and where recoverability is in doubt,
appropriate provisions are held.
A review of the Credit and Equity Portfolio analysing
exposure concentrations by counterparty, country, risk type,
industry and credit quality is carried out quarterly and
reported to the Board semi-annually. Policies are in place to
limit large exposures to single counterparties and sectoral
concentrations.
5.2.4 Credit Assurance
Credit Assurance (CA) is a centralised function within RMG
which independently verifies the effectiveness of
Macquarie’s credit risk management. The role of the CA is
to provide an independent assurance of analysis and
process to support credit quality and the effectiveness of
credit controls.
Key responsibilities are:
– assuring the quality of wholesale credit approvals
through sample testing;
– reporting on the effectiveness (design and performance)
of RMG Credit's critical controls including sample
testing to ensure compliance with key Credit policies
and the effectiveness of critical controls; and
– overseeing Business (Retail) CA functions in Banking
and Financial Services (BFS).
RMG CA reports to the RMG Head of Operational Risk to
ensure independence. In addition to regular reporting to
senior management and the Chief Risk Officer, CA is
required to report at least annually to the Board. In the
interim, matters that require Board attention are reported via
the Chief Risk Officer.
17
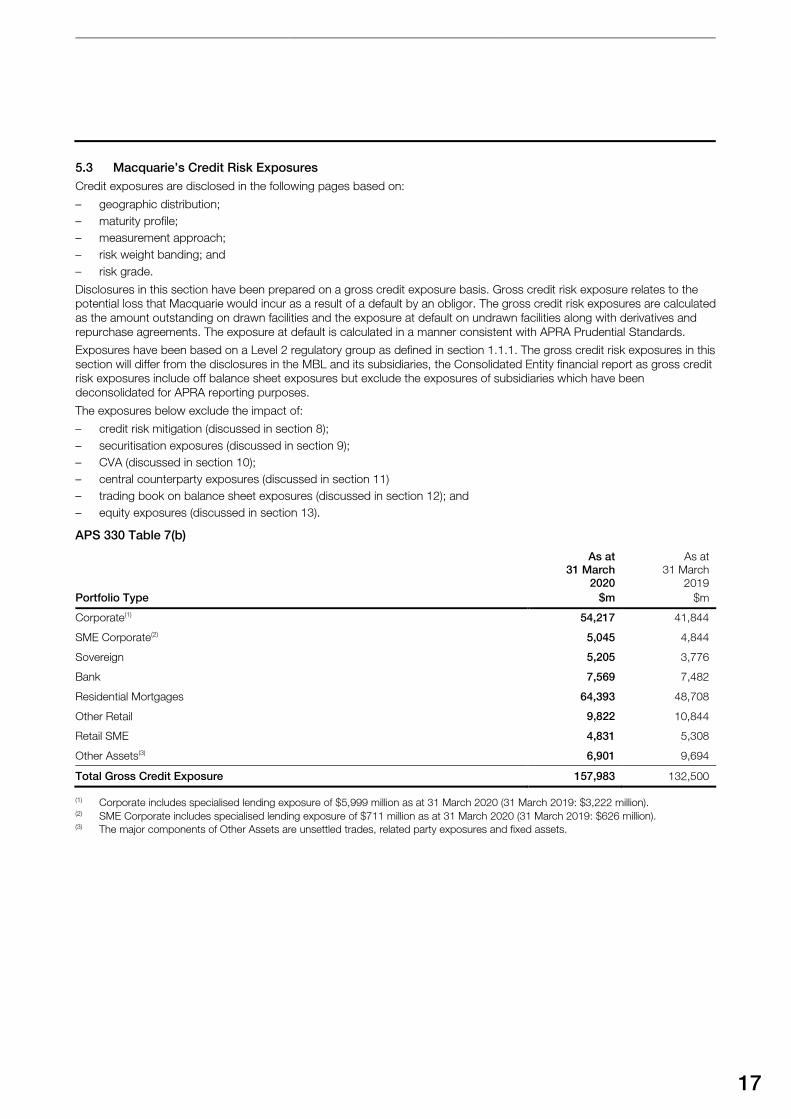
5.3 Macquarie’s Credit Risk Exposures
Credit exposures are disclosed in the following pages based on:
– geographic distribution;
– maturity profile;
– measurement approach;
– risk weight banding; and
– risk grade.
Disclosures in this section have been prepared on a gross credit exposure basis. Gross credit risk exposure relates to the
potential loss that Macquarie would incur as a result of a default by an obligor. The gross credit risk exposures are calculated
as the amount outstanding on drawn facilities and the exposure at default on undrawn facilities along with derivatives and
repurchase agreements. The exposure at default is calculated in a manner consistent with APRA Prudential Standards.
Exposures have been based on a Level 2 regulatory group as defined in section 1.1.1. The gross credit risk exposures in this
section will differ from the disclosures in the MBL and its subsidiaries, the Consolidated Entity financial report as gross credit
risk exposures include off balance sheet exposures but exclude the exposures of subsidiaries which have been
deconsolidated for APRA reporting purposes.
The exposures below exclude the impact of:
– credit risk mitigation (discussed in section 8);
– securitisation exposures (discussed in section 9);
– CVA (discussed in section 10);
– central counterparty exposures (discussed in section 11)
– trading book on balance sheet exposures (discussed in section 12); and
– equity exposures (discussed in section 13).
APS 330 Table 7(b)
Portfolio Type
As at
31 March
2020
$m
As at
31 March
2019
$m
Corporate(1) 54,217 41,844
SME Corporate(2) 5,045 4,844
Sovereign 5,205 3,776
Bank 7,569 7,482
Residential Mortgages 64,393 48,708
Other Retail 9,822 10,844
Retail SME 4,831 5,308
Other Assets(3) 6,901 9,694
Total Gross Credit Exposure 157,983 132,500
(1) Corporate includes specialised lending exposure of $5,999 million as at 31 March 2020 (31 March 2019: $3,222 million). (2) SME Corporate includes specialised lending exposure of $711 million as at 31 March 2020 (31 March 2019: $626 million). (3) The major components of Other Assets are unsettled trades, related party exposures and fixed assets.
Macquarie Bank Limited Pillar 3 Disclosures March 2020 macquarie.com
5.0 Credit Risk Measurement
continued
18
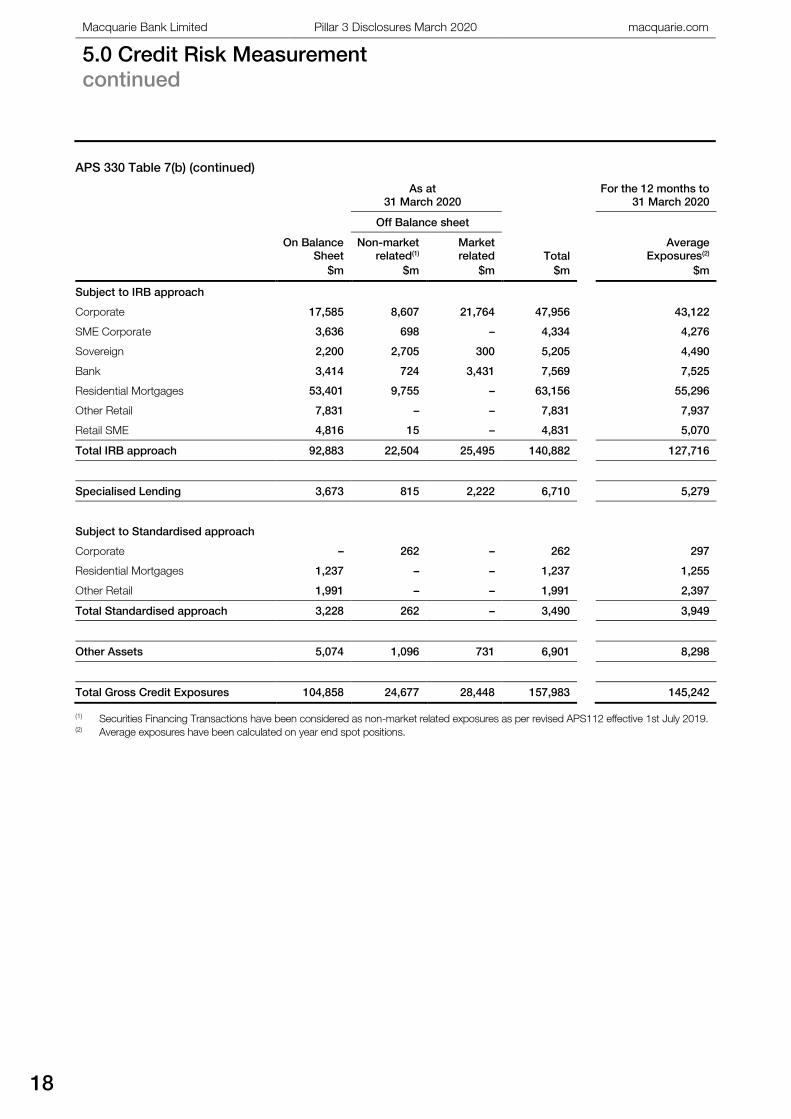
APS 330 Table 7(b) (continued)
As at
31 March 2020
For the 12 months to
31 March 2020
Off Balance sheet
On Balance
Sheet
$m
Non-market
related(1)
$m
Market
related
$m
Total
$m
Average
Exposures(2)
$m
Subject to IRB approach
Corporate 17,585 8,607 21,764 47,956 43,122
SME Corporate 3,636 698 – 4,334 4,276
Sovereign 2,200 2,705 300 5,205 4,490
Bank 3,414 724 3,431 7,569 7,525
Residential Mortgages 53,401 9,755 – 63,156 55,296
Other Retail 7,831 – – 7,831 7,937
Retail SME 4,816 15 – 4,831 5,070
Total IRB approach 92,883 22,504 25,495 140,882 127,716
Specialised Lending 3,673 815 2,222 6,710 5,279
Subject to Standardised approach
Corporate – 262 – 262 297
Residential Mortgages 1,237 – – 1,237 1,255
Other Retail 1,991 – – 1,991 2,397
Total Standardised approach 3,228 262 – 3,490 3,949
Other Assets 5,074 1,096 731 6,901 8,298
Total Gross Credit Exposures 104,858 24,677 28,448 157,983 145,242
(1) Securities Financing Transactions have been considered as non-market related exposures as per revised APS112 effective 1st July 2019. (2) Average exposures have been calculated on year end spot positions.
19
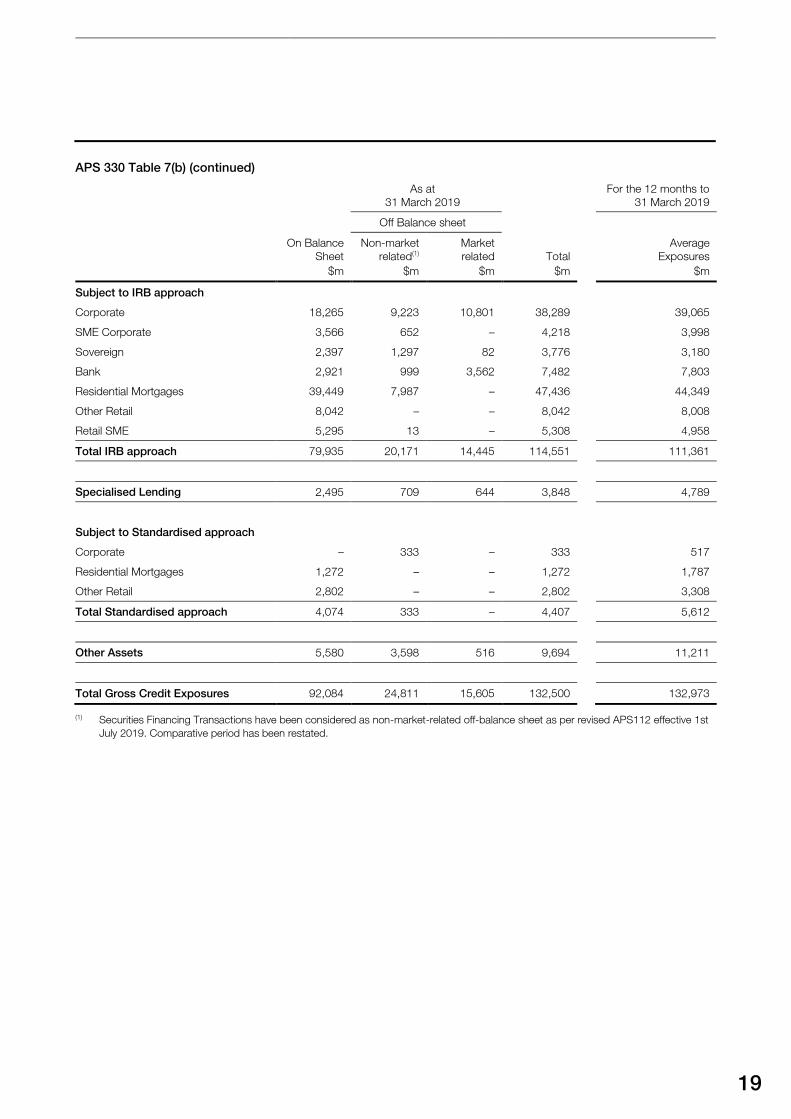
APS 330 Table 7(b) (continued)
As at
31 March 2019
For the 12 months to
31 March 2019
Off Balance sheet
On Balance
Sheet
$m
Non-market
related(1)
$m
Market
related
$m
Total
$m
Average
Exposures
$m
Subject to IRB approach
Corporate 18,265 9,223 10,801 38,289 39,065
SME Corporate 3,566 652 – 4,218 3,998
Sovereign 2,397 1,297 82 3,776 3,180
Bank 2,921 999 3,562 7,482 7,803
Residential Mortgages 39,449 7,987 – 47,436 44,349
Other Retail 8,042 – – 8,042 8,008
Retail SME 5,295 13 – 5,308 4,958
Total IRB approach 79,935 20,171 14,445 114,551 111,361
Specialised Lending 2,495 709 644 3,848 4,789
Subject to Standardised approach
Corporate – 333 – 333 517
Residential Mortgages 1,272 – – 1,272 1,787
Other Retail 2,802 – – 2,802 3,308
Total Standardised approach 4,074 333 – 4,407 5,612
Other Assets 5,580 3,598 516 9,694 11,211
Total Gross Credit Exposures 92,084 24,811 15,605 132,500 132,973
(1) Securities Financing Transactions have been considered as non-market-related off-balance sheet as per revised APS112 effective 1st
July 2019. Comparative period has been restated.
Macquarie Bank Limited Pillar 3 Disclosures March 2020 macquarie.com
5.0 Credit Risk Measurement
continued
20
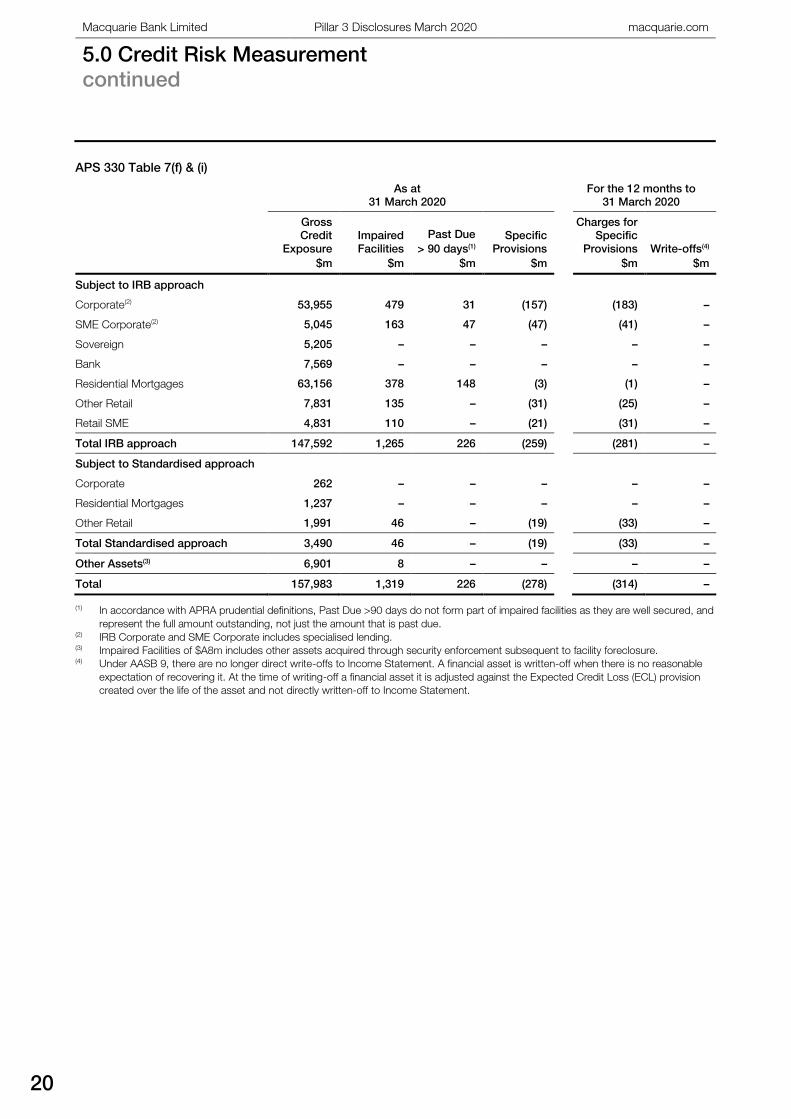
APS 330 Table 7(f) & (i)
As at
31 March 2020
For the 12 months to
31 March 2020
Gross
Credit
Exposure
$m
Impaired
Facilities
$m
Past Due
> 90 days(1)
$m
Specific
Provisions
$m
Charges for
Specific
Provisions
$m
Write-offs(4)
$m
Subject to IRB approach
Corporate(2) 53,955 479 31 (157) (183) –
SME Corporate(2) 5,045 163 47 (47) (41) –
Sovereign 5,205 – – – – –
Bank 7,569 – – – – –
Residential Mortgages 63,156 378 148 (3) (1) –
Other Retail 7,831 135 – (31) (25) –
Retail SME 4,831 110 – (21) (31) –
Total IRB approach 147,592 1,265 226 (259) (281) –
Subject to Standardised approach
Corporate 262 – – – – –
Residential Mortgages 1,237 – – – – –
Other Retail 1,991 46 – (19) (33) –
Total Standardised approach 3,490 46 – (19) (33) –
Other Assets(3) 6,901 8 – – – –
Total 157,983 1,319 226 (278) (314) –
(1) In accordance with APRA prudential definitions, Past Due >90 days do not form part of impaired facilities as they are well secured, and
represent the full amount outstanding, not just the amount that is past due.(2) IRB Corporate and SME Corporate includes specialised lending.(3) Impaired Facilities of $A8m includes other assets acquired through security enforcement subsequent to facility foreclosure.(4) Under AASB 9, there are no longer direct write-offs to Income Statement. A financial asset is written-off when there is no reasonable
expectation of recovering it. At the time of writing-off a financial asset it is adjusted against the Expected Credit Loss (ECL) provision
created over the life of the asset and not directly written-off to Income Statement.
21
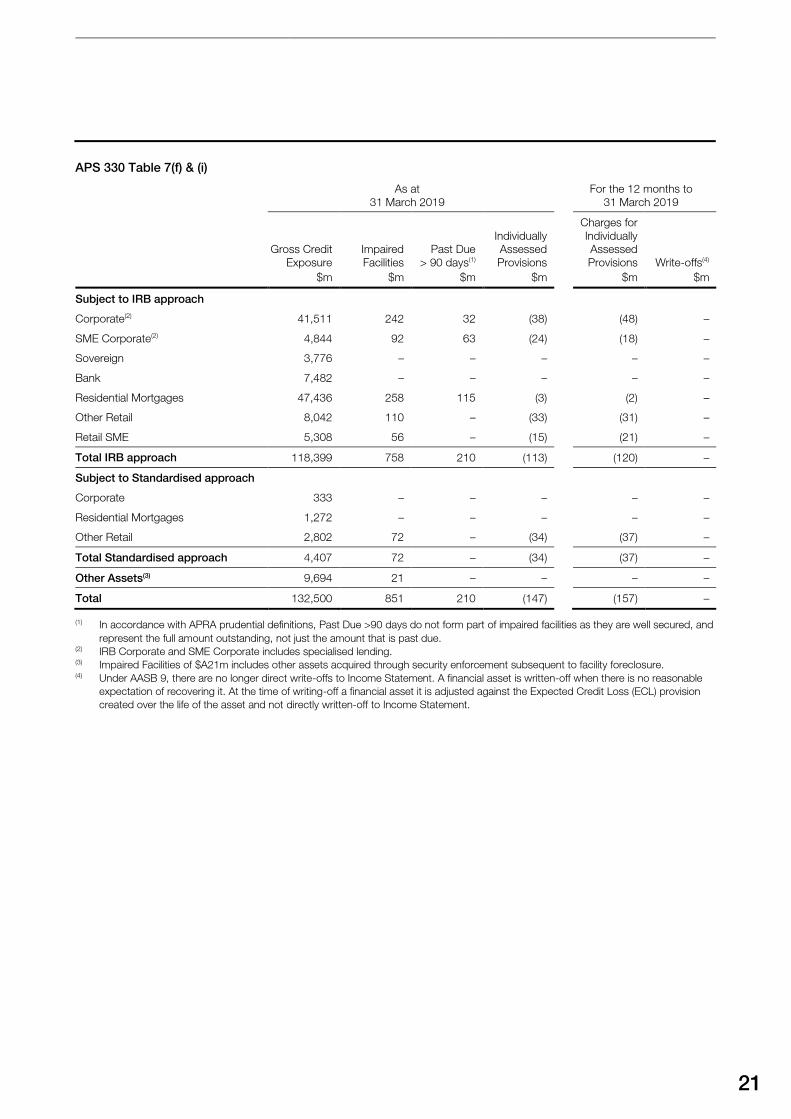
APS 330 Table 7(f) & (i)
As at
31 March 2019
For the 12 months to
31 March 2019
Gross Credit
Exposure
$m
Impaired
Facilities
$m
Past Due
> 90 days(1)
$m
Individually
Assessed
Provisions
$m
Charges for
Individually
Assessed
Provisions
$m
Write-offs(4)
$m
Subject to IRB approach
Corporate(2) 41,511 242 32 (38) (48) –
SME Corporate(2) 4,844 92 63 (24) (18) –
Sovereign 3,776 – – – – –
Bank 7,482 – – – – –
Residential Mortgages 47,436 258 115 (3) (2) –
Other Retail 8,042 110 – (33) (31) –
Retail SME 5,308 56 – (15) (21) –
Total IRB approach 118,399 758 210 (113) (120) –
Subject to Standardised approach
Corporate 333 – – – – –
Residential Mortgages 1,272 – – – – –
Other Retail 2,802 72 – (34) (37) –
Total Standardised approach 4,407 72 – (34) (37) –
Other Assets(3) 9,694 21 – – – –
Total 132,500 851 210 (147) (157) –
(1) In accordance with APRA prudential definitions, Past Due >90 days do not form part of impaired facilities as they are well secured, and
represent the full amount outstanding, not just the amount that is past due. (2) IRB Corporate and SME Corporate includes specialised lending. (3) Impaired Facilities of $A21m includes other assets acquired through security enforcement subsequent to facility foreclosure. (4) Under AASB 9, there are no longer direct write-offs to Income Statement. A financial asset is written-off when there is no reasonable
expectation of recovering it. At the time of writing-off a financial asset it is adjusted against the Expected Credit Loss (ECL) provision
created over the life of the asset and not directly written-off to Income Statement.
Macquarie Bank Limited Pillar 3 Disclosures March 2020 macquarie.com
5.0 Credit Risk Measurement
continued
22
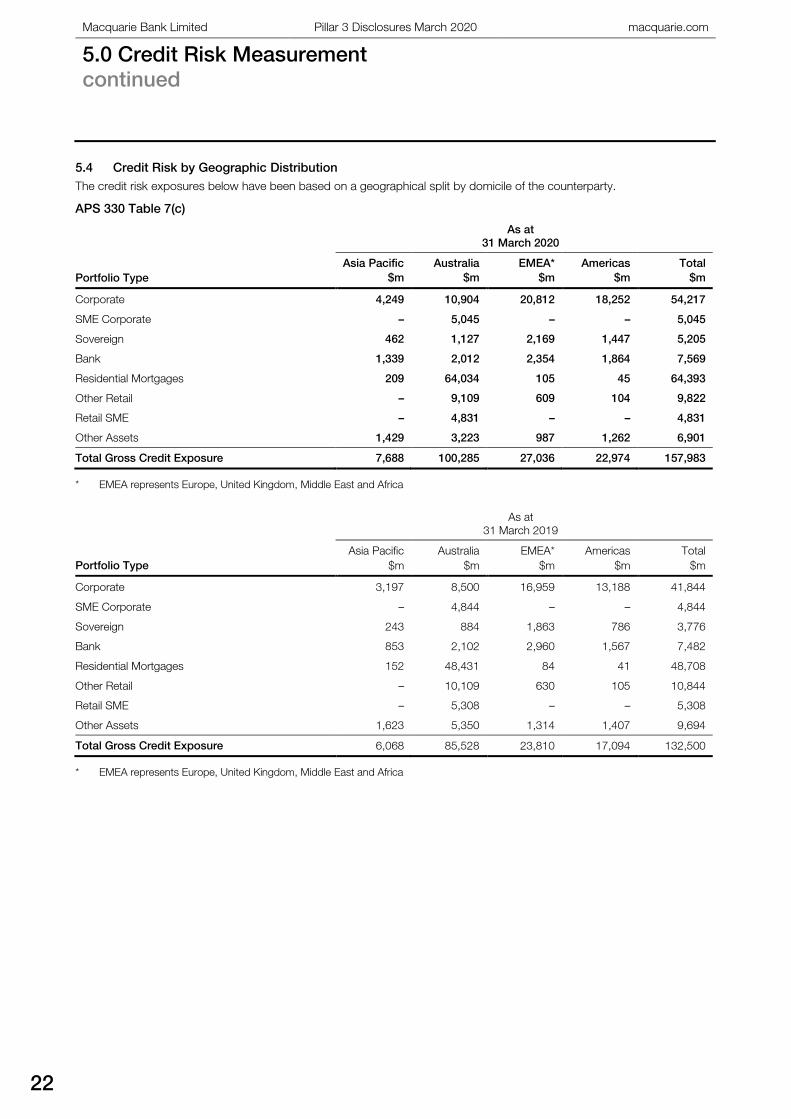
5.4 Credit Risk by Geographic Distribution
The credit risk exposures below have been based on a geographical split by domicile of the counterparty.
APS 330 Table 7(c)
As at
31 March 2020
Portfolio Type
Asia Pacific
$m
Australia
$m
EMEA*
$m
Americas
$m
Total
$m
Corporate 4,249 10,904 20,812 18,252 54,217
SME Corporate – 5,045 – – 5,045
Sovereign 462 1,127 2,169 1,447 5,205
Bank 1,339 2,012 2,354 1,864 7,569
Residential Mortgages 209 64,034 105 45 64,393
Other Retail – 9,109 609 104 9,822
Retail SME – 4,831 – – 4,831
Other Assets 1,429 3,223 987 1,262 6,901
Total Gross Credit Exposure 7,688 100,285 27,036 22,974 157,983
* EMEA represents Europe, United Kingdom, Middle East and Africa
As at
31 March 2019
Portfolio Type
Asia Pacific
$m
Australia
$m
EMEA*
$m
Americas
$m
Total
$m
Corporate 3,197 8,500 16,959 13,188 41,844
SME Corporate – 4,844 – – 4,844
Sovereign 243 884 1,863 786 3,776
Bank 853 2,102 2,960 1,567 7,482
Residential Mortgages 152 48,431 84 41 48,708
Other Retail – 10,109 630 105 10,844
Retail SME – 5,308 – – 5,308
Other Assets 1,623 5,350 1,314 1,407 9,694
Total Gross Credit Exposure 6,068 85,528 23,810 17,094 132,500
* EMEA represents Europe, United Kingdom, Middle East and Africa
23
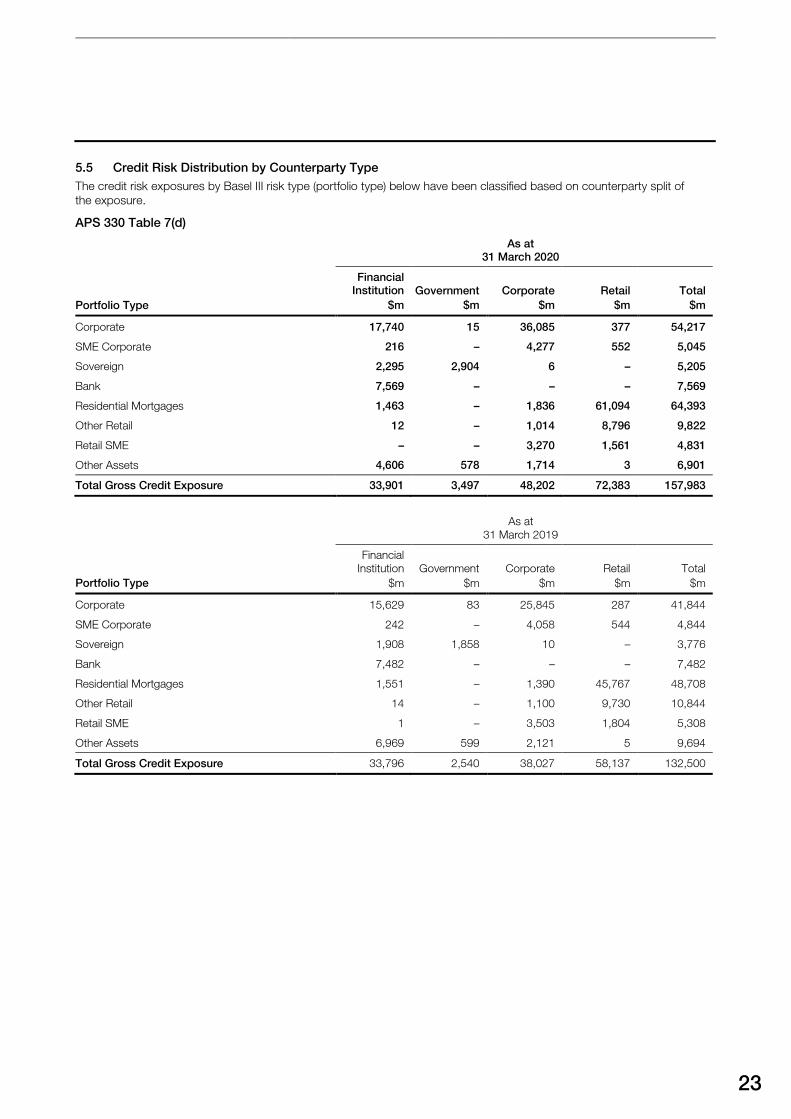
5.5 Credit Risk Distribution by Counterparty Type
The credit risk exposures by Basel III risk type (portfolio type) below have been classified based on counterparty split of
the exposure.
APS 330 Table 7(d)
As at
31 March 2020
Portfolio Type
Financial
Institution
$m
Government
$m
Corporate
$m
Retail
$m
Total
$m
Corporate 17,740 15 36,085 377 54,217
SME Corporate 216 – 4,277 552 5,045
Sovereign 2,295 2,904 6 – 5,205
Bank 7,569 – – – 7,569
Residential Mortgages 1,463 – 1,836 61,094 64,393
Other Retail 12 – 1,014 8,796 9,822
Retail SME – – 3,270 1,561 4,831
Other Assets 4,606 578 1,714 3 6,901
Total Gross Credit Exposure 33,901 3,497 48,202 72,383 157,983
As at
31 March 2019
Portfolio Type
Financial
Institution
$m
Government
$m
Corporate
$m
Retail
$m
Total
$m
Corporate 15,629 83 25,845 287 41,844
SME Corporate 242 – 4,058 544 4,844
Sovereign 1,908 1,858 10 – 3,776
Bank 7,482 – – – 7,482
Residential Mortgages 1,551 – 1,390 45,767 48,708
Other Retail 14 – 1,100 9,730 10,844
Retail SME 1 – 3,503 1,804 5,308
Other Assets 6,969 599 2,121 5 9,694
Total Gross Credit Exposure 33,796 2,540 38,027 58,137 132,500
Macquarie Bank Limited Pillar 3 Disclosures March 2020 macquarie.com
5.0 Credit Risk Measurement
continued
24
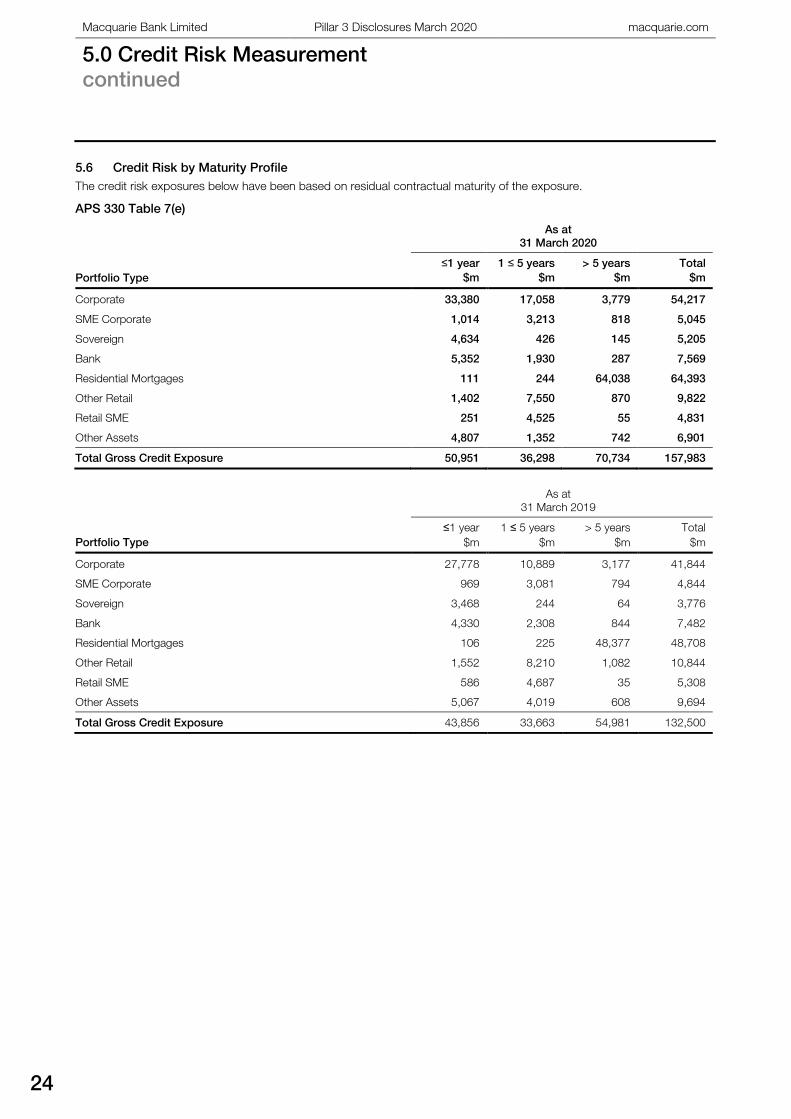
5.6 Credit Risk by Maturity Profile
The credit risk exposures below have been based on residual contractual maturity of the exposure.
APS 330 Table 7(e)
As at
31 March 2020
Portfolio Type
≤1 year
$m
1 ≤ 5 years
$m
> 5 years
$m
Total
$m
Corporate 33,380 17,058 3,779 54,217
SME Corporate 1,014 3,213 818 5,045
Sovereign 4,634 426 145 5,205
Bank 5,352 1,930 287 7,569
Residential Mortgages 111 244 64,038 64,393
Other Retail 1,402 7,550 870 9,822
Retail SME 251 4,525 55 4,831
Other Assets 4,807 1,352 742 6,901
Total Gross Credit Exposure 50,951 36,298 70,734 157,983
As at
31 March 2019
Portfolio Type
≤1 year
$m
1 ≤ 5 years
$m
> 5 years
$m
Total
$m
Corporate 27,778 10,889 3,177 41,844
SME Corporate 969 3,081 794 4,844
Sovereign 3,468 244 64 3,776
Bank 4,330 2,308 844 7,482
Residential Mortgages 106 225 48,377 48,708
Other Retail 1,552 8,210 1,082 10,844
Retail SME 586 4,687 35 5,308
Other Assets 5,067 4,019 608 9,694
Total Gross Credit Exposure 43,856 33,663 54,981 132,500
25
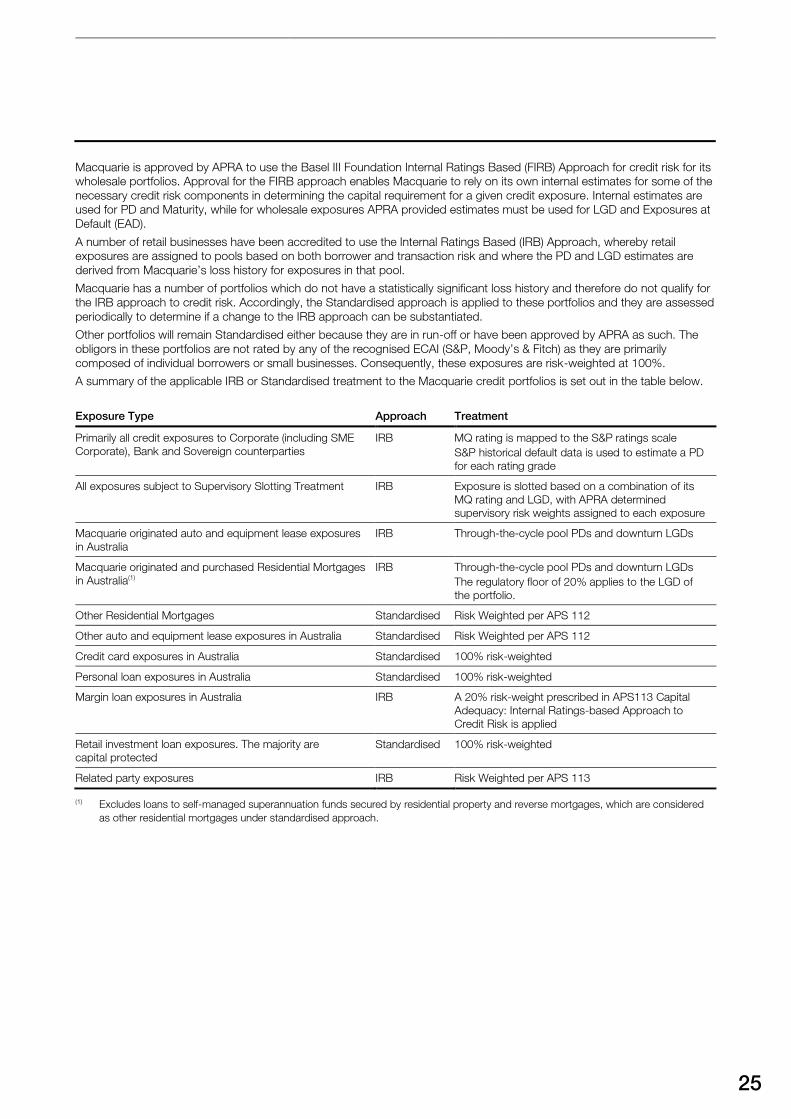
Macquarie is approved by APRA to use the Basel III Foundation Internal Ratings Based (FIRB) Approach for credit risk for its
wholesale portfolios. Approval for the FIRB approach enables Macquarie to rely on its own internal estimates for some of the
necessary credit risk components in determining the capital requirement for a given credit exposure. Internal estimates are
used for PD and Maturity, while for wholesale exposures APRA provided estimates must be used for LGD and Exposures at
Default (EAD).
A number of retail businesses have been accredited to use the Internal Ratings Based (IRB) Approach, whereby retail
exposures are assigned to pools based on both borrower and transaction risk and where the PD and LGD estimates are
derived from Macquarie’s loss history for exposures in that pool.
Macquarie has a number of portfolios which do not have a statistically significant loss history and therefore do not qualify for
the IRB approach to credit risk. Accordingly, the Standardised approach is applied to these portfolios and they are assessed
periodically to determine if a change to the IRB approach can be substantiated.
Other portfolios will remain Standardised either because they are in run-off or have been approved by APRA as such. The
obligors in these portfolios are not rated by any of the recognised ECAI (S&P, Moody’s & Fitch) as they are primarily
composed of individual borrowers or small businesses. Consequently, these exposures are risk-weighted at 100%.
A summary of the applicable IRB or Standardised treatment to the Macquarie credit portfolios is set out in the table below.
Exposure Type Approach Treatment
Primarily all credit exposures to Corporate (including SME
Corporate), Bank and Sovereign counterparties
IRB MQ rating is mapped to the S&P ratings scale
S&P historical default data is used to estimate a PD
for each rating grade
All exposures subject to Supervisory Slotting Treatment IRB Exposure is slotted based on a combination of its
MQ rating and LGD, with APRA determined
supervisory risk weights assigned to each exposure
Macquarie originated auto and equipment lease exposures
in Australia
IRB Through-the-cycle pool PDs and downturn LGDs
Macquarie originated and purchased Residential Mortgages
in Australia(1)
IRB Through-the-cycle pool PDs and downturn LGDs
The regulatory floor of 20% applies to the LGD of
the portfolio.
Other Residential Mortgages Standardised Risk Weighted per APS 112
Other auto and equipment lease exposures in Australia Standardised Risk Weighted per APS 112
Credit card exposures in Australia Standardised 100% risk-weighted
Personal loan exposures in Australia Standardised 100% risk-weighted
Margin loan exposures in Australia IRB A 20% risk-weight prescribed in APS113 Capital
Adequacy: Internal Ratings-based Approach to
Credit Risk is applied
Retail investment loan exposures. The majority are
capital protected
Standardised 100% risk-weighted
Related party exposures IRB Risk Weighted per APS 113
(1) Excludes loans to self-managed superannuation funds secured by residential property and reverse mortgages, which are considered
as other residential mortgages under standardised approach.
Macquarie Bank Limited Pillar 3 Disclosures March 2020 macquarie.com
6.0 Calculation of Credit Risk Exposures
26
6.0 Calculation of Credit Risk Exposures
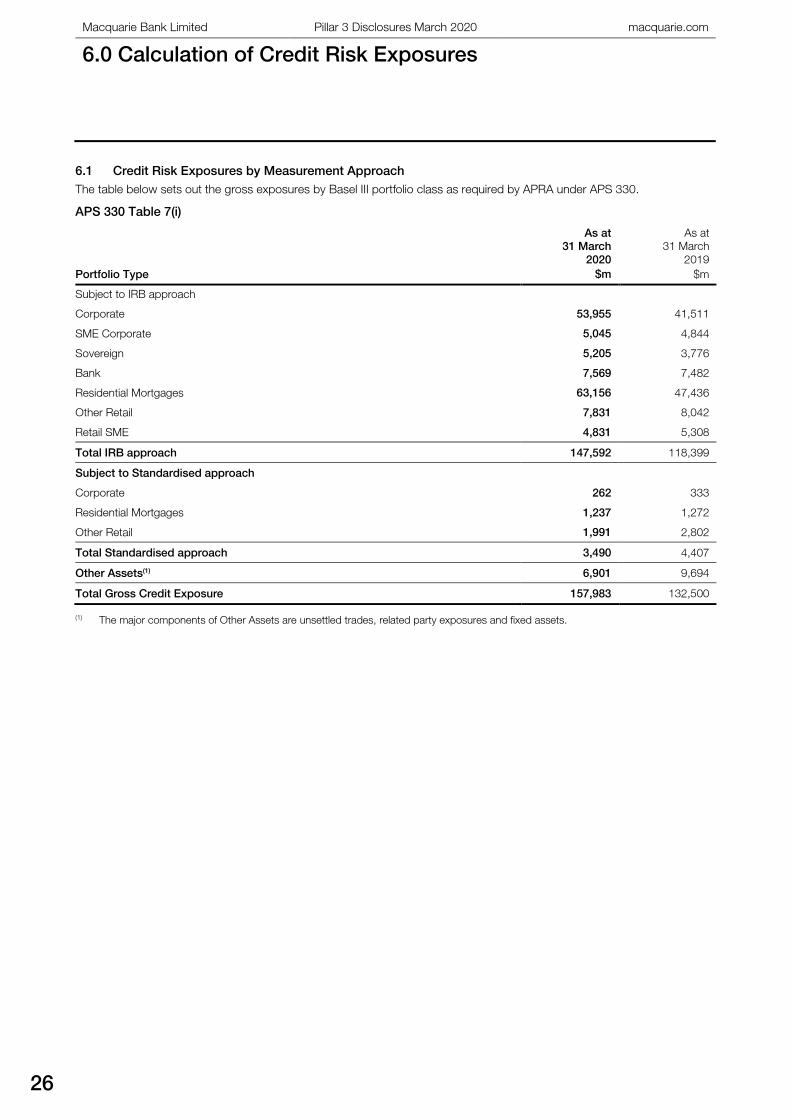
6.1 Credit Risk Exposures by Measurement Approach
The table below sets out the gross exposures by Basel III portfolio class as required by APRA under APS 330.
APS 330 Table 7(i)
Portfolio Type
As at
31 March
2020
$m
As at
31 March
2019
$m
Subject to IRB approach
Corporate 53,955 41,511
SME Corporate 5,045 4,844
Sovereign 5,205 3,776
Bank 7,569 7,482
Residential Mortgages 63,156 47,436
Other Retail 7,831 8,042
Retail SME 4,831 5,308
Total IRB approach 147,592 118,399
Subject to Standardised approach
Corporate 262 333
Residential Mortgages 1,237 1,272
Other Retail 1,991 2,802
Total Standardised approach 3,490 4,407
Other Assets(1) 6,901 9,694
Total Gross Credit Exposure 157,983 132,500
(1) The major components of Other Assets are unsettled trades, related party exposures and fixed assets.
27
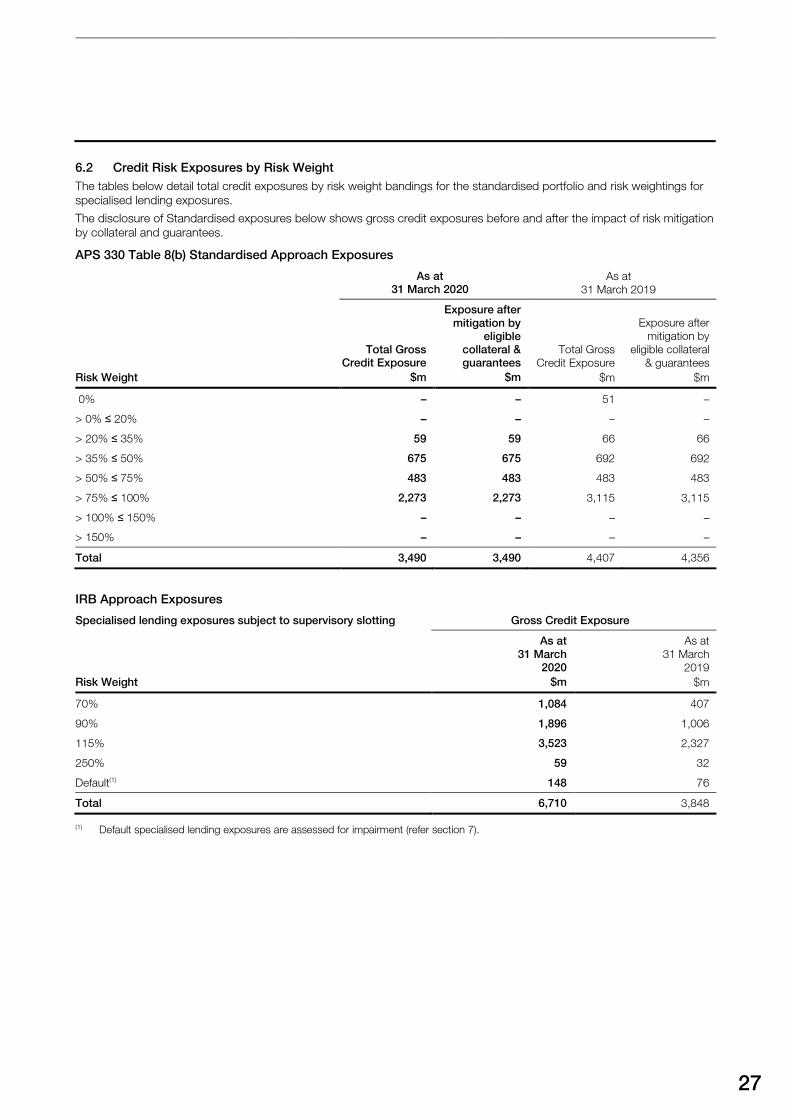
6.2 Credit Risk Exposures by Risk Weight
The tables below detail total credit exposures by risk weight bandings for the standardised portfolio and risk weightings for
specialised lending exposures.
The disclosure of Standardised exposures below shows gross credit exposures before and after the impact of risk mitigation
by collateral and guarantees.
APS 330 Table 8(b) Standardised Approach Exposures
As at
31 March 2020
As at
31 March 2019
Risk Weight
Total Gross
Credit Exposure
$m
Exposure after
mitigation by
eligible
collateral &
guarantees
$m
Total Gross
Credit Exposure
$m
Exposure after
mitigation by
eligible collateral
& guarantees
$m
0% – – 51 –
> 0% ≤ 20% – – – –
> 20% ≤ 35% 59 59 66 66
> 35% ≤ 50% 675 675 692 692
> 50% ≤ 75% 483 483 483 483
> 75% ≤ 100% 2,273 2,273 3,115 3,115
> 100% ≤ 150% – – – –
> 150% – – – –
Total 3,490 3,490 4,407 4,356
IRB Approach Exposures
Specialised lending exposures subject to supervisory slotting Gross Credit Exposure
Risk Weight
As at
31 March
2020
$m
As at
31 March
2019
$m
70% 1,084 407
90% 1,896 1,006
115% 3,523 2,327
250% 59 32
Default(1) 148 76
Total 6,710 3,848
(1) Default specialised lending exposures are assessed for impairment (refer section 7).
Macquarie Bank Limited Pillar 3 Disclosures March 2020 macquarie.com
6.0 Calculation of Credit Risk Exposures
continued
28
6.3 Credit Risk Exposures by Risk Grade
This section sets out the gross credit exposures split by PD for Non-Retail portfolios and Expected Loss (EL) for
Retail portfolios.
The tables below provide a breakdown of gross credit exposures into each PD band for the Non-Retail portfolios under the
Basel III FIRB classes of Corporate, SME Corporate, Sovereign and Bank as shown in section 6.1.
APS 330 Table 9(d)
As at
31 March 2020
PD Grade
Non-Retail
0 <=
0.03%
$m
0.03% <=
0.15%
$m
0.15% <=
1%
$m
1% <=
5%
$m
5% <=
15%
$m
15% <=
100%
$m
Default
$m
Total
Gross
Credit
Exposure
$m
Corporate 1,932 12,476 23,366 9,270 4,640 1,255 1,016 53,955
SME Corporate – – 1,332 3,038 401 62 212 5,045
Sovereign 4,304 846 27 24 4 – – 5,205
Bank 865 6,098 521 79 5 1 – 7,569
Total Gross Credit Exposure 7,101 19,420 25,246 12,411 5,050 1,318 1,228 71,774
As at
31 March 2019
PD Grade
Non-Retail
0 <=
0.03%
$m
0.03% <=
0.15%
$m
0.15% <=
1%
$m
1% <= 5%
$m
5% <=
15%
$m
15% <=
100%
$m
Default
$m
Total
Gross
Credit
Exposure
$m
Corporate 925 14,433 16,310 5,729 3,169 194 751 41,511
SME Corporate – – 1,384 2,830 387 62 181 4,844
Sovereign 2,987 782 5 2 – – – 3,776
Bank 2,295 4,993 103 70 21 – – 7,482
Total Gross Credit Exposure 6,207 20,208 17,802 8,631 3,577 256 932 57,613
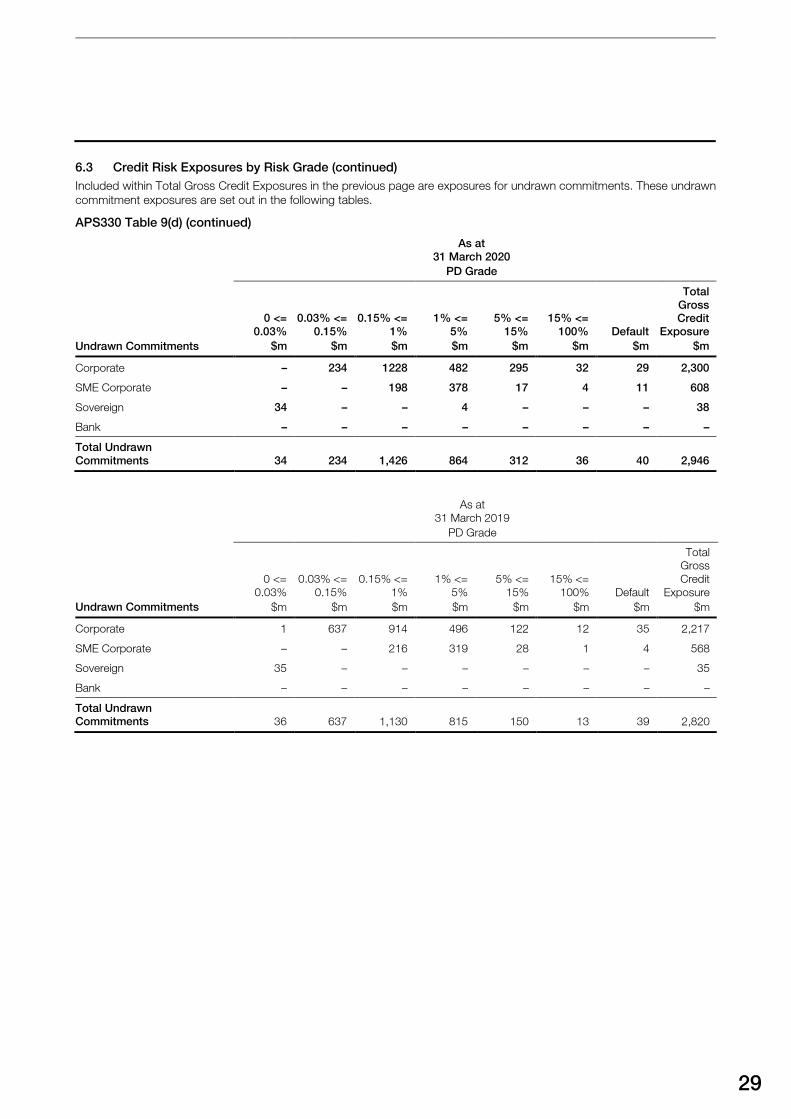
29
6.3 Credit Risk Exposures by Risk Grade (continued)
Included within Total Gross Credit Exposures in the previous page are exposures for undrawn commitments. These undrawn
commitment exposures are set out in the following tables.
APS330 Table 9(d) (continued)
As at
31 March 2020
PD Grade
Undrawn Commitments
0 <=
0.03%
$m
0.03% <=
0.15%
$m
0.15% <=
1%
$m
1% <=
5%
$m
5% <=
15%
$m
15% <=
100%
$m
Default
$m
Total
Gross
Credit
Exposure
$m
Corporate – 234 1228 482 295 32 29 2,300
SME Corporate – – 198 378 17 4 11 608
Sovereign 34 – – 4 – – – 38
Bank – – – – – – – –
Total Undrawn
Commitments 34 234 1,426 864 312 36 40 2,946
As at
31 March 2019
PD Grade
Undrawn Commitments
0 <=
0.03%
$m
0.03% <=
0.15%
$m
0.15% <=
1%
$m
1% <=
5%
$m
5% <=
15%
$m
15% <=
100%
$m
Default
$m
Total
Gross
Credit
Exposure
$m
Corporate 1 637 914 496 122 12 35 2,217
SME Corporate – – 216 319 28 1 4 568
Sovereign 35 – – – – – – 35
Bank – – – – – – – –
Total Undrawn
Commitments 36 637 1,130 815 150 13 39 2,820
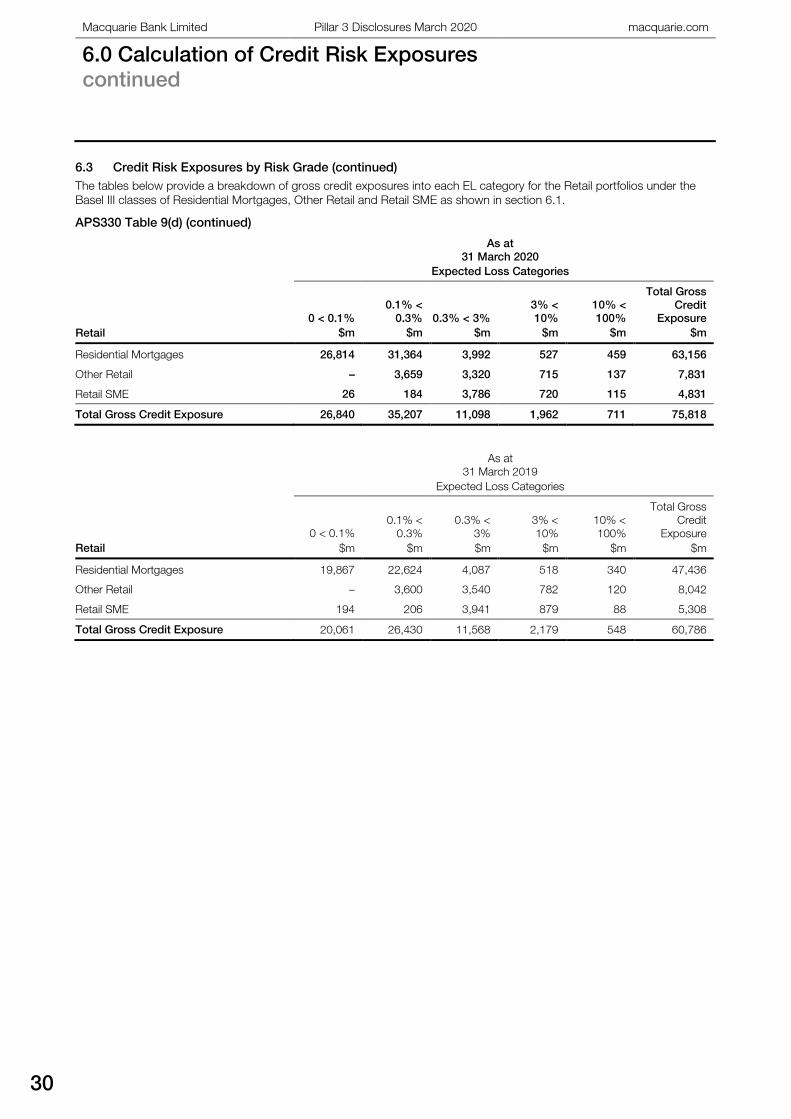
Macquarie Bank Limited Pillar 3 Disclosures March 2020 macquarie.com
6.0 Calculation of Credit Risk Exposures
continued
30
6.3 Credit Risk Exposures by Risk Grade (continued)
The tables below provide a breakdown of gross credit exposures into each EL category for the Retail portfolios under the
Basel III classes of Residential Mortgages, Other Retail and Retail SME as shown in section 6.1.
APS330 Table 9(d) (continued)
As at
31 March 2020
Expected Loss Categories
Retail
0 < 0.1%
$m
0.1% <
0.3%
$m
0.3% < 3%
$m
3% <
10%
$m
10% <
100%
$m
Total Gross
Credit
Exposure
$m
Residential Mortgages 26,814 31,364 3,992 527 459 63,156
Other Retail – 3,659 3,320 715 137 7,831
Retail SME 26 184 3,786 720 115 4,831
Total Gross Credit Exposure 26,840 35,207 11,098 1,962 711 75,818
As at
31 March 2019
Expected Loss Categories
Retail
0 < 0.1%
$m
0.1% <
0.3%
$m
0.3% <
3%
$m
3% <
10%
$m
10% <
100%
$m
Total Gross
Credit
Exposure
$m
Residential Mortgages 19,867 22,624 4,087 518 340 47,436
Other Retail – 3,600 3,540 782 120 8,042
Retail SME 194 206 3,941 879 88 5,308
Total Gross Credit Exposure 20,061 26,430 11,568 2,179 548 60,786
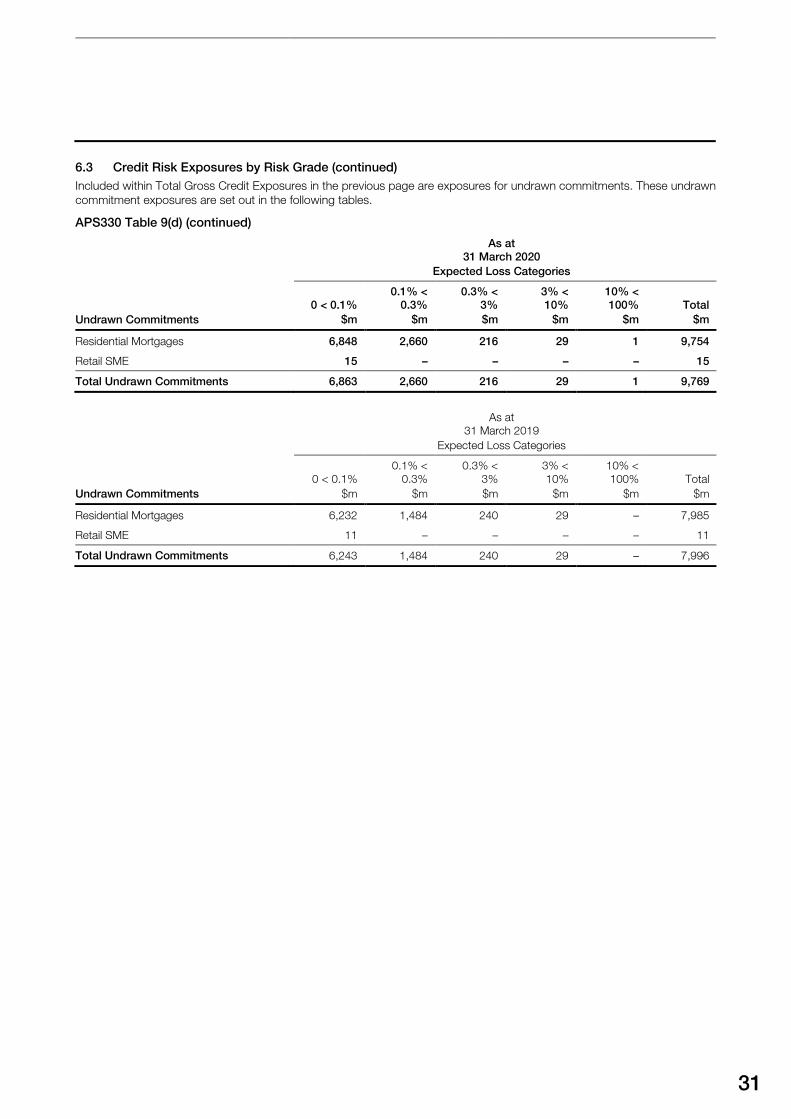
31
6.3 Credit Risk Exposures by Risk Grade (continued)
Included within Total Gross Credit Exposures in the previous page are exposures for undrawn commitments. These undrawn
commitment exposures are set out in the following tables.
APS330 Table 9(d) (continued)
As at
31 March 2020
Expected Loss Categories
Undrawn Commitments
0 < 0.1%
$m
0.1% <
0.3%
$m
0.3% <
3%
$m
3% <
10%
$m
10% <
100%
$m
Total
$m
Residential Mortgages 6,848 2,660 216 29 1 9,754
Retail SME 15 – – – – 15
Total Undrawn Commitments 6,863 2,660 216 29 1 9,769
As at
31 March 2019
Expected Loss Categories
Undrawn Commitments
0 < 0.1%
$m
0.1% <
0.3%
$m
0.3% <
3%
$m
3% <
10%
$m
10% <
100%
$m
Total
$m
Residential Mortgages 6,232 1,484 240 29 – 7,985
Retail SME 11 – – – – 11
Total Undrawn Commitments 6,243 1,484 240 29 – 7,996
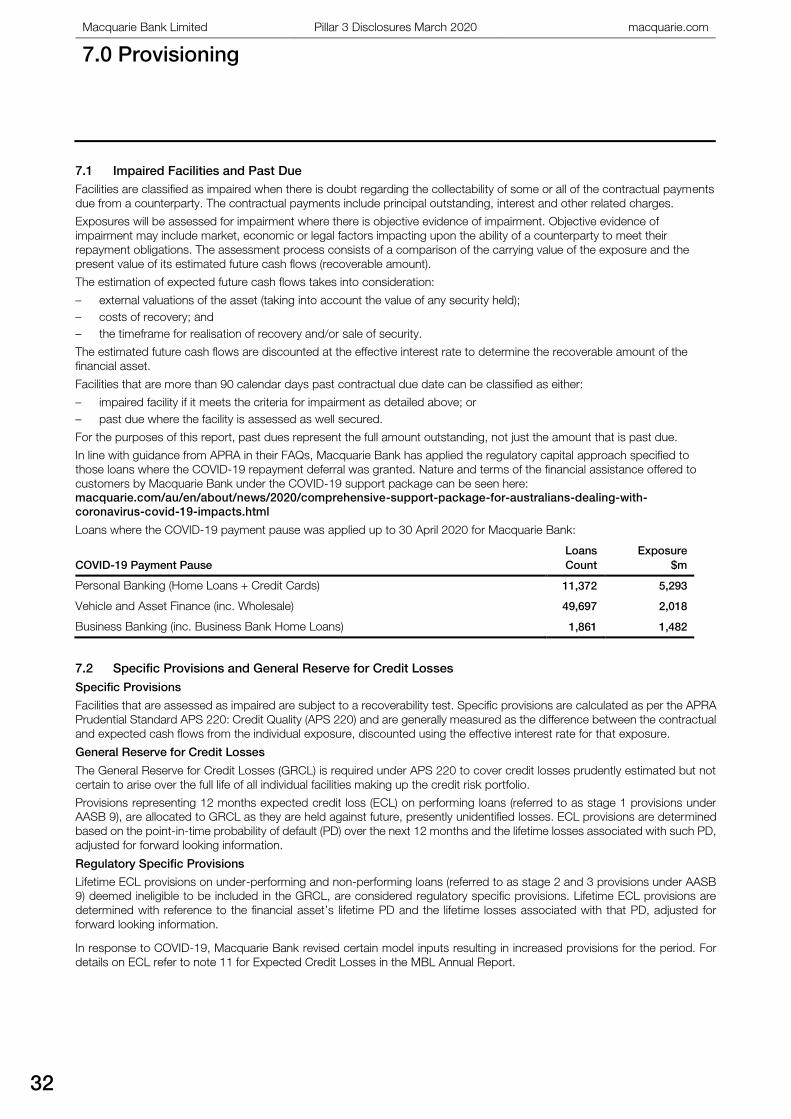
Macquarie Bank Limited Pillar 3 Disclosures March 2020 macquarie.com
7.0 Provisioning
32
7.0 Provisioning
7.1 Impaired Facilities and Past Due
Facilities are classified as impaired when there is doubt regarding the collectability of some or all of the contractual payments
due from a counterparty. The contractual payments include principal outstanding, interest and other related charges.
Exposures will be assessed for impairment where there is objective evidence of impairment. Objective evidence of
impairment may include market, economic or legal factors impacting upon the ability of a counterparty to meet their
repayment obligations. The assessment process consists of a comparison of the carrying value of the exposure and the
present value of its estimated future cash flows (recoverable amount).
The estimation of expected future cash flows takes into consideration:
– external valuations of the asset (taking into account the value of any security held);
– costs of recovery; and
– the timeframe for realisation of recovery and/or sale of security.
The estimated future cash flows are discounted at the effective interest rate to determine the recoverable amount of the
financial asset.
Facilities that are more than 90 calendar days past contractual due date can be classified as either:
– impaired facility if it meets the criteria for impairment as detailed above; or
– past due where the facility is assessed as well secured.
For the purposes of this report, past dues represent the full amount outstanding, not just the amount that is past due.
In line with guidance from APRA in their FAQs, Macquarie Bank has applied the regulatory capital approach specified to
those loans where the COVID-19 repayment deferral was granted. Nature and terms of the financial assistance offered to
customers by Macquarie Bank under the COVID-19 support package can be seen here:
macquarie.com/au/en/about/news/2020/comprehensive-support-package-for-australians-dealing-with-coronavirus-covid-19-impacts.html
Loans where the COVID-19 payment pause was applied up to 30 April 2020 for Macquarie Bank:
COVID-19 Payment Pause
Loans
Count
Exposure
$m
Personal Banking (Home Loans + Credit Cards) 11,372 5,293
Vehicle and Asset Finance (inc. Wholesale) 49,697 2,018
Business Banking (inc. Business Bank Home Loans) 1,861 1,482
7.2 Specific Provisions and General Reserve for Credit Losses
Specific Provisions
Facilities that are assessed as impaired are subject to a recoverability test. Specific provisions are calculated as per the APRA
Prudential Standard APS 220: Credit Quality (APS 220) and are generally measured as the difference between the contractual
and expected cash flows from the individual exposure, discounted using the effective interest rate for that exposure.
General Reserve for Credit Losses
The General Reserve for Credit Losses (GRCL) is required under APS 220 to cover credit losses prudently estimated but not
certain to arise over the full life of all individual facilities making up the credit risk portfolio.
Provisions representing 12 months expected credit loss (ECL) on performing loans (referred to as stage 1 provisions under
AASB 9), are allocated to GRCL as they are held against future, presently unidentified losses. ECL provisions are determined
based on the point-in-time probability of default (PD) over the next 12 months and the lifetime losses associated with such PD,
adjusted for forward looking information.
Regulatory Specific Provisions
Lifetime ECL provisions on under-performing and non-performing loans (referred to as stage 2 and 3 provisions under AASB
9) deemed ineligible to be included in the GRCL, are considered regulatory specific provisions. Lifetime ECL provisions are
determined with reference to the financial asset’s lifetime PD and the lifetime losses associated with that PD, adjusted for
forward looking information.
In response to COVID-19, Macquarie Bank revised certain model inputs resulting in increased provisions for the period. For
details on ECL refer to note 11 for Expected Credit Losses in the MBL Annual Report.
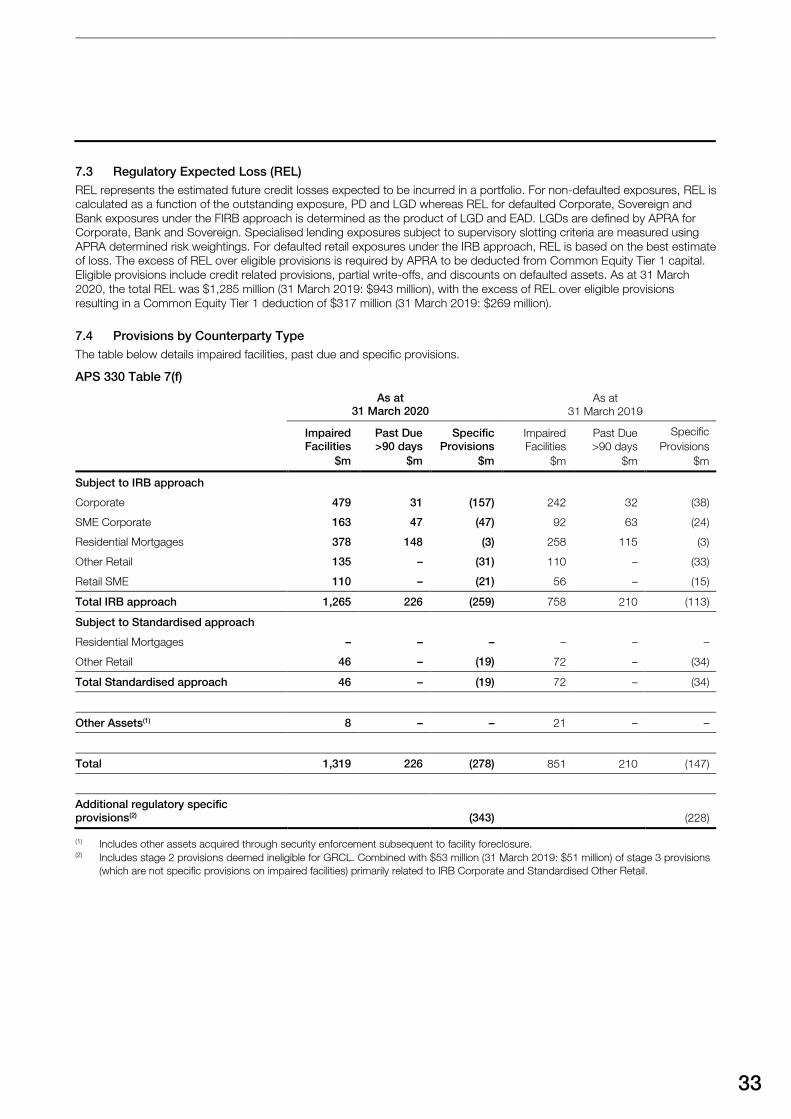
33
7.3 Regulatory Expected Loss (REL)
REL represents the estimated future credit losses expected to be incurred in a portfolio. For non-defaulted exposures, REL is
calculated as a function of the outstanding exposure, PD and LGD whereas REL for defaulted Corporate, Sovereign and
Bank exposures under the FIRB approach is determined as the product of LGD and EAD. LGDs are defined by APRA for
Corporate, Bank and Sovereign. Specialised lending exposures subject to supervisory slotting criteria are measured using
APRA determined risk weightings. For defaulted retail exposures under the IRB approach, REL is based on the best estimate
of loss. The excess of REL over eligible provisions is required by APRA to be deducted from Common Equity Tier 1 capital.
Eligible provisions include credit related provisions, partial write-offs, and discounts on defaulted assets. As at 31 March
2020, the total REL was $1,285 million (31 March 2019: $943 million), with the excess of REL over eligible provisions
resulting in a Common Equity Tier 1 deduction of $317 million (31 March 2019: $269 million).
7.4 Provisions by Counterparty Type
The table below details impaired facilities, past due and specific provisions.
APS 330 Table 7(f)
As at
31 March 2020
As at
31 March 2019
Impaired
Facilities
$m
Past Due
>90 days
$m
Specific
Provisions
$m
Impaired
Facilities
$m
Past Due
>90 days
$m
Specific
Provisions
$m
Subject to IRB approach
Corporate 479 31 (157) 242 32 (38)
SME Corporate 163 47 (47) 92 63 (24)
Residential Mortgages 378 148 (3) 258 115 (3)
Other Retail 135 – (31) 110 – (33)
Retail SME 110 – (21) 56 – (15)
Total IRB approach 1,265 226 (259) 758 210 (113)
Subject to Standardised approach
Residential Mortgages – – – – – –
Other Retail 46 – (19) 72 – (34)
Total Standardised approach 46 – (19) 72 – (34)
Other Assets(1) 8 – – 21 – –
Total 1,319 226 (278) 851 210 (147)
Additional regulatory specific
provisions(2) (343) (228)
(1) Includes other assets acquired through security enforcement subsequent to facility foreclosure.(2) Includes stage 2 provisions deemed ineligible for GRCL. Combined with $53 million (31 March 2019: $51 million) of stage 3 provisions
(which are not specific provisions on impaired facilities) primarily related to IRB Corporate and Standardised Other Retail.
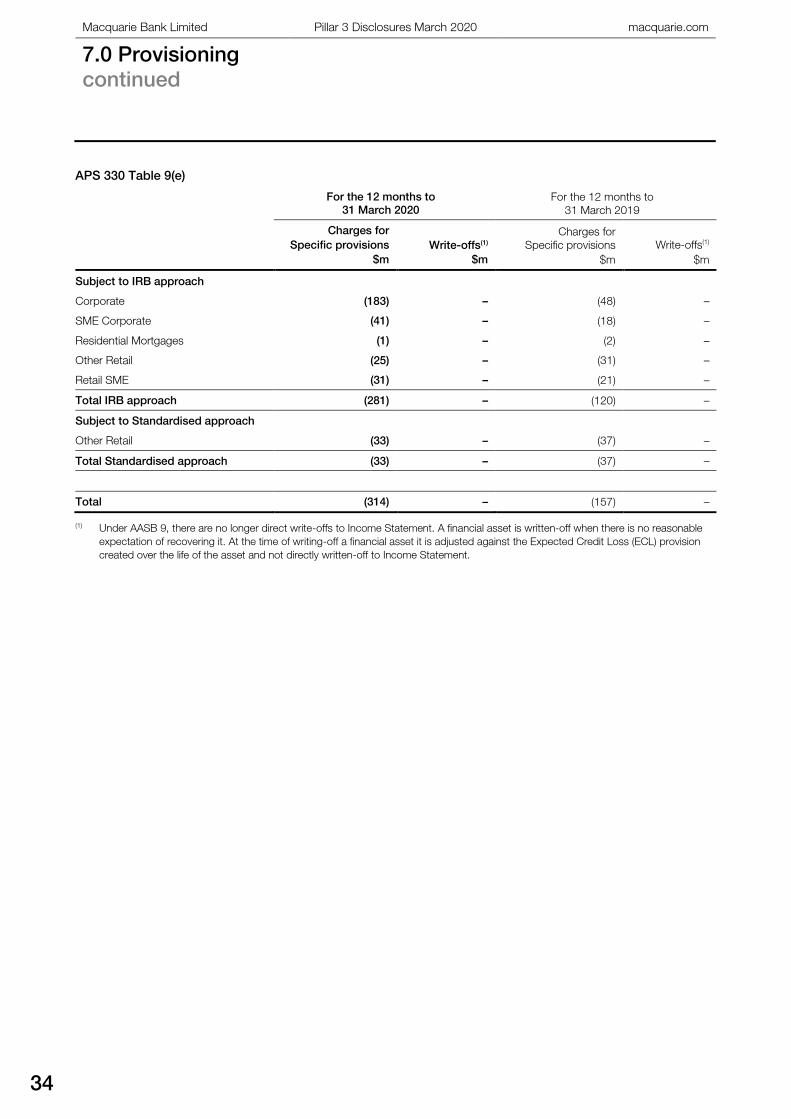
Macquarie Bank Limited Pillar 3 Disclosures March 2020 macquarie.com
7.0 Provisioning
continued
34
APS 330 Table 9(e)
For the 12 months to
31 March 2020
For the 12 months to
31 March 2019
Charges for
Specific provisions
$m
Write-offs(1)
$m
Charges for
Specific provisions
$m
Write-offs(1)
$m
Subject to IRB approach
Corporate (183) – (48) –
SME Corporate (41) – (18) –
Residential Mortgages (1) – (2) –
Other Retail (25) – (31) –
Retail SME (31) – (21) –
Total IRB approach (281) – (120) –
Subject to Standardised approach
Other Retail (33) – (37) –
Total Standardised approach (33) – (37) –
Total (314) – (157) –
(1) Under AASB 9, there are no longer direct write-offs to Income Statement. A financial asset is written-off when there is no reasonable
expectation of recovering it. At the time of writing-off a financial asset it is adjusted against the Expected Credit Loss (ECL) provision
created over the life of the asset and not directly written-off to Income Statement.
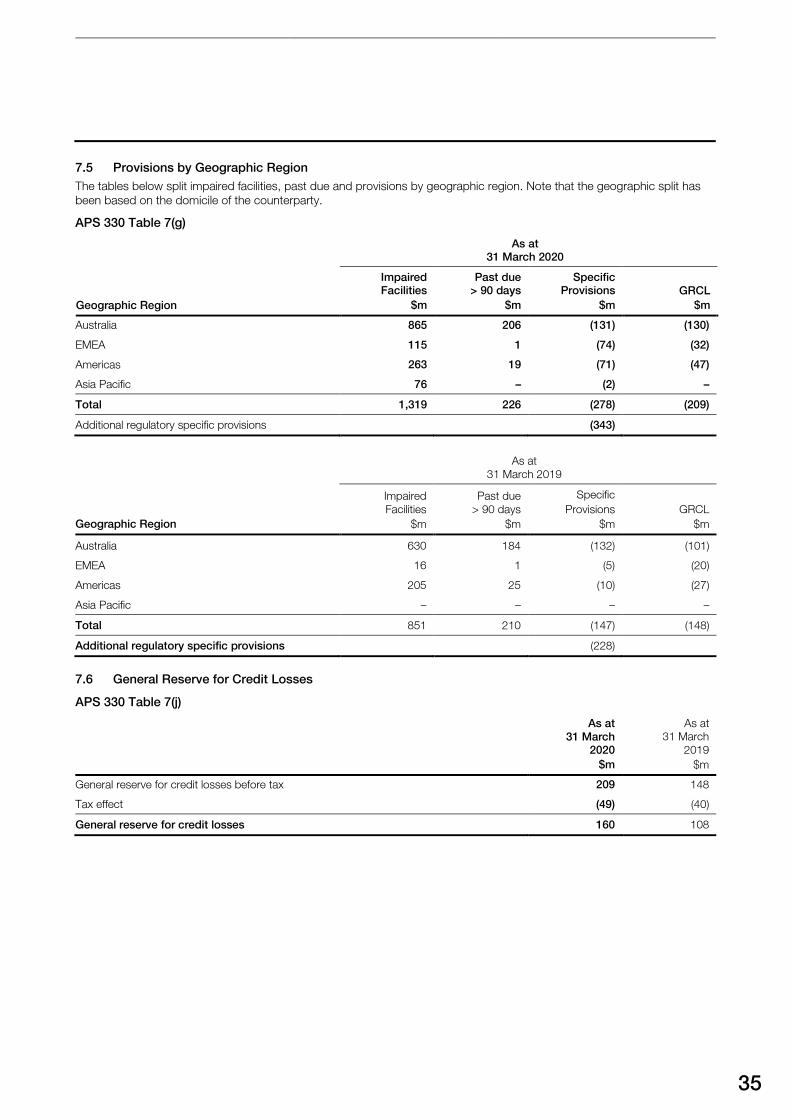
35
7.5 Provisions by Geographic Region
The tables below split impaired facilities, past due and provisions by geographic region. Note that the geographic split has
been based on the domicile of the counterparty.
APS 330 Table 7(g)
As at
31 March 2020
Geographic Region
Impaired
Facilities
$m
Past due
> 90 days
$m
Specific
Provisions
$m
GRCL
$m
Australia 865 206 (131) (130)
EMEA 115 1 (74) (32)
Americas 263 19 (71) (47)
Asia Pacific 76 – (2) –
Total 1,319 226 (278) (209)
Additional regulatory specific provisions (343)
As at
31 March 2019
Geographic Region
Impaired
Facilities
$m
Past due
> 90 days
$m
Specific
Provisions
$m
GRCL
$m
Australia 630 184 (132) (101)
EMEA 16 1 (5) (20)
Americas 205 25 (10) (27)
Asia Pacific – – – –
Total 851 210 (147) (148)
Additional regulatory specific provisions (228)
7.6 General Reserve for Credit Losses
APS 330 Table 7(j)
As at
31 March
2020
$m
As at
31 March
2019
$m
General reserve for credit losses before tax 209 148
Tax effect (49) (40)
General reserve for credit losses 160 108
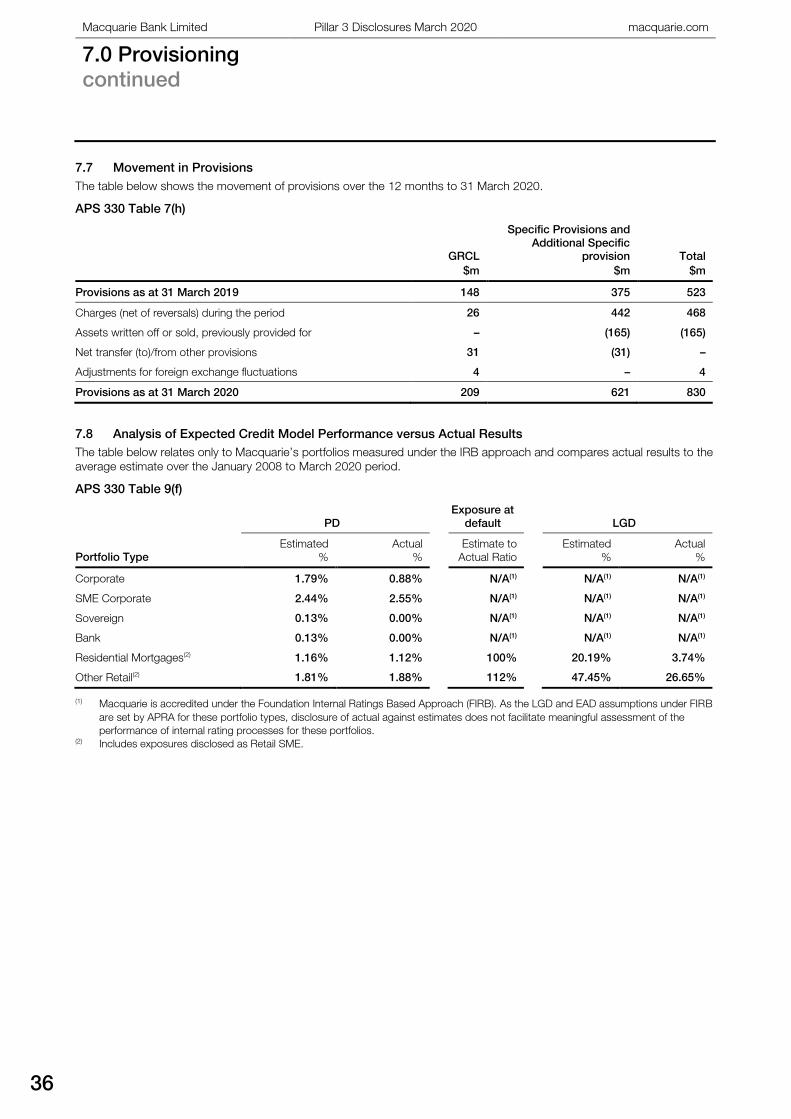
Macquarie Bank Limited Pillar 3 Disclosures March 2020 macquarie.com
7.0 Provisioning
continued
36
7.7 Movement in Provisions
The table below shows the movement of provisions over the 12 months to 31 March 2020.
APS 330 Table 7(h)
GRCL
$m
Specific Provisions and
Additional Specific
provision
$m
Total
$m
Provisions as at 31 March 2019 148 375 523
Charges (net of reversals) during the period 26 442 468
Assets written off or sold, previously provided for – (165) (165)
Net transfer (to)/from other provisions 31 (31) –
Adjustments for foreign exchange fluctuations 4 – 4
Provisions as at 31 March 2020 209 621 830
7.8 Analysis of Expected Credit Model Performance versus Actual Results
The table below relates only to Macquarie’s portfolios measured under the IRB approach and compares actual results to the
average estimate over the January 2008 to March 2020 period.
APS 330 Table 9(f)
PD
Exposure at
default LGD
Portfolio Type
Estimated
%
Actual
%
Estimate to
Actual Ratio
Estimated
%
Actual
%
Corporate 1.79% 0.88% N/A(1) N/A(1) N/A(1)
SME Corporate 2.44% 2.55% N/A(1) N/A(1) N/A(1)
Sovereign 0.13% 0.00% N/A(1) N/A(1) N/A(1)
Bank 0.13% 0.00% N/A(1) N/A(1) N/A(1)
Residential Mortgages(2) 1.16% 1.12% 100% 20.19% 3.74%
Other Retail(2) 1.81% 1.88% 112% 47.45% 26.65%
(1) Macquarie is accredited under the Foundation Internal Ratings Based Approach (FIRB). As the LGD and EAD assumptions under FIRB
are set by APRA for these portfolio types, disclosure of actual against estimates does not facilitate meaningful assessment of the
performance of internal rating processes for these portfolios. (2) Includes exposures disclosed as Retail SME.
8.0 Credit Risk Mitigation
37
8.0 Credit Risk Mitigation
8.1 Netting
Netting arises where a single legal obligation is created
covering all transactions included in a netting agreement.
The most common form of netting which Macquarie applies
for these purposes is close-out netting.
Netting is applied to a counterparty balance only when
appropriate documentation governing transactions between
the Macquarie entity and the counterparty has been entered
into, Legal Risk Management has confirmed that it is legally
effective to net with that counterparty, and APRA Prudential
Standard APS 112 Capital Adequacy: Standardised
Approach to Credit Risk (APS 112), has been
complied with.
8.1.1 Collateral Valuation and Management
RMG Credit limits are set and the related exposures are
calculated before taking any non-cash collateral into
consideration other than for securities finance transactions
where liquid financial instruments are an inherent part of the
lending arrangement. Typically, collateral is required for all
but short-dated, vanilla trading activity.
A wide variety of collateral can be accepted depending on
the counterparty and the nature of the exposure. Some of
the most common forms are charges over:
– cash or gold deposits;
– debt or equity securities;
– company assets; and
– commercial or residential property.
Guarantees are frequently requested from banks, parent or
associated companies. Relative ratings between the obligor
and guarantor are monitored as part of the regulatory capital
calculation process as mitigation will normally cease to be
eligible if the rating of the guarantor falls below that of the
underlying obligor. Collateral taken in the form of tradeable
securities is revalued daily by the same application systems
which are used to trade those particular products. Credit
default swaps are not a common form of credit risk
mitigation. Macquarie policies ensure that all security is
taken in conjunction with a formal written agreement which
gives Macquarie direct and unconditional rights over the
collateral in the event of default by the obligor.
To mitigate credit risk Macquarie makes frequent use of
margining arrangements. In these cases, counterparties
post collateral daily in the form of cash or liquid securities to
cover outstanding trading positions. Macquarie also
engages in reciprocal margining agreements with
counterparties under ISDA or similar agreements where the
Credit Support Annex can contain provisions whereby
margining thresholds may vary in relation to the credit
ratings of the respective parties. As part of the OTC
Margining reforms in various jurisdictions in which
Macquarie operates, limits have been imposed on
thresholds, minimum transfer amounts and rounding for
affected counterparties. Documents have been renegotiated
with these counterparties in order to be compliant with
these regulations. Margining thresholds are incorporated
into the scenarios considered under the MGL Group liquidity
policy which assesses the collateral and funding
requirements in the event of a credit downgrade.
This is part of the general requirement of the MGL Group to
be able to meet all obligations for a period of twelve months
under both an individual and combined name and systemic
challenge. The resultant increase in collateral requirements
is included as an outflow in the scenarios – explicitly
ensuring that Macquarie has sufficient funding coverage in
this event.
Specific protocols surround the acceptance of real estate
as collateral.
Prior to acceptance, any independent valuation must
undergo a formal review process by which it is assessed for
quality and adherence to policy and standing instructions.
The escalation of this review and acceptance process will
depend on:
– the type of property being valued;
– the dollar value of the property being valued; and
– the proposed loan-to-value ratio (LVR).
The value of all real estate collateral is assessed regularly
and is re-valued where appropriate, be it on an asset
specific basis or a market assessment across a pool of
assets, such as residential mortgages. The interval between
re-valuation is contingent on the type of property, extent of
the property’s encumbrance, the LVR at origination and the
market conditions that have prevailed since the valuation
was conducted. All prior claims on the property collateral
are recorded and taken into consideration when calculating
the available security value.
All details regarding security together with netting/margining
rules are recorded in collateral management systems which
support the operational control framework.
8.1.2 Wrong Way Risk
Specific wrong-way risk occurs when exposure to the
counterparty is positively correlated with the counterparty’s
probability of default. RMG Credit runs a monthly monitoring
process to ensure that all instances of specific wrong-way
risk are identified and appropriately escalated. General
wrong-way risk occurs when the probabilities of
counterparty defaults are positively correlated with market
risk factor movements. Macquarie considers these
correlations as part of the credit assessment process.
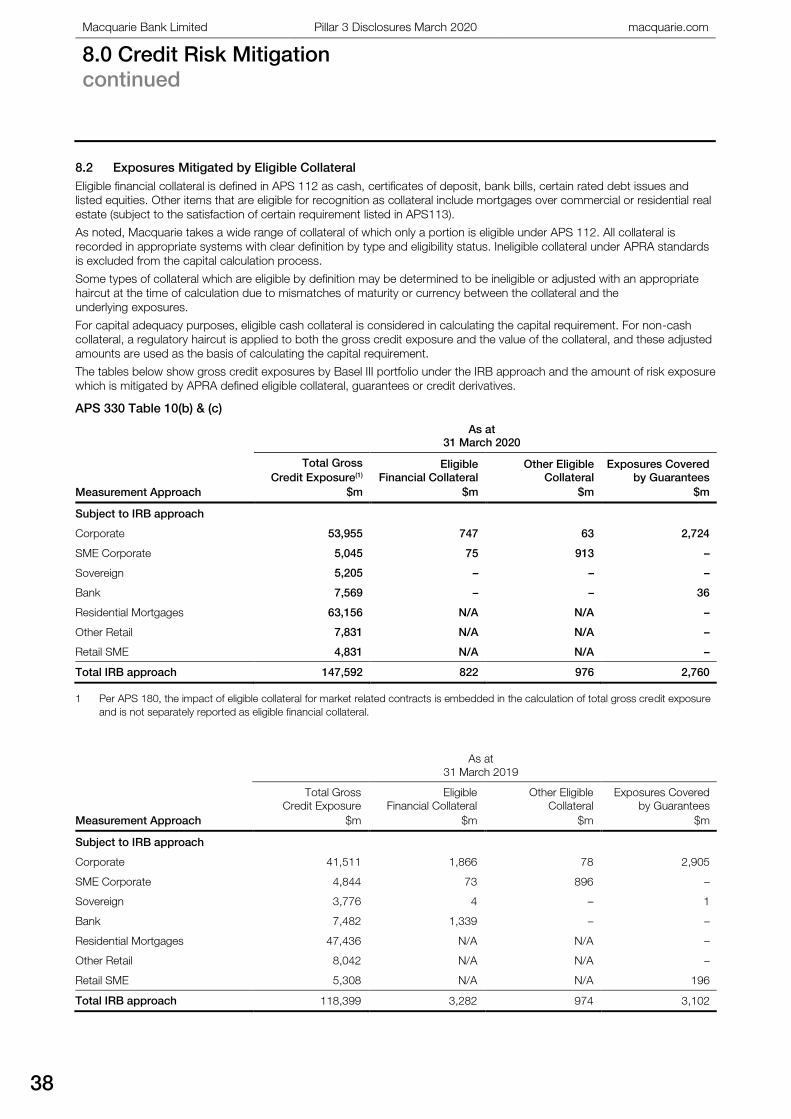
Macquarie Bank Limited Pillar 3 Disclosures March 2020 macquarie.com
8.0 Credit Risk Mitigation
continued
38
8.2 Exposures Mitigated by Eligible Collateral
Eligible financial collateral is defined in APS 112 as cash, certificates of deposit, bank bills, certain rated debt issues and
listed equities. Other items that are eligible for recognition as collateral include mortgages over commercial or residential real
estate (subject to the satisfaction of certain requirement listed in APS113).
As noted, Macquarie takes a wide range of collateral of which only a portion is eligible under APS 112. All collateral is
recorded in appropriate systems with clear definition by type and eligibility status. Ineligible collateral under APRA standards
is excluded from the capital calculation process.
Some types of collateral which are eligible by definition may be determined to be ineligible or adjusted with an appropriate
haircut at the time of calculation due to mismatches of maturity or currency between the collateral and the
underlying exposures.
For capital adequacy purposes, eligible cash collateral is considered in calculating the capital requirement. For non-cash
collateral, a regulatory haircut is applied to both the gross credit exposure and the value of the collateral, and these adjusted
amounts are used as the basis of calculating the capital requirement.
The tables below show gross credit exposures by Basel III portfolio under the IRB approach and the amount of risk exposure
which is mitigated by APRA defined eligible collateral, guarantees or credit derivatives.
APS 330 Table 10(b) & (c)
As at
31 March 2020
Measurement Approach
Total Gross
Credit Exposure(1)
$m
Eligible
Financial Collateral
$m
Other Eligible
Collateral
$m
Exposures Covered
by Guarantees
$m
Subject to IRB approach
Corporate 53,955 747 63 2,724
SME Corporate 5,045 75 913 –
Sovereign 5,205 – – –
Bank 7,569 – – 36
Residential Mortgages 63,156 N/A N/A –
Other Retail 7,831 N/A N/A –
Retail SME 4,831 N/A N/A –
Total IRB approach 147,592 822 976 2,760
1 Per APS 180, the impact of eligible collateral for market related contracts is embedded in the calculation of total gross credit exposure
and is not separately reported as eligible financial collateral.
As at
31 March 2019
Measurement Approach
Total Gross
Credit Exposure
$m
Eligible
Financial Collateral
$m
Other Eligible
Collateral
$m
Exposures Covered
by Guarantees
$m
Subject to IRB approach
Corporate 41,511 1,866 78 2,905
SME Corporate 4,844 73 896 –
Sovereign 3,776 4 – 1
Bank 7,482 1,339 – –
Residential Mortgages 47,436 N/A N/A –
Other Retail 8,042 N/A N/A –
Retail SME 5,308 N/A N/A 196
Total IRB approach 118,399 3,282 974 3,102
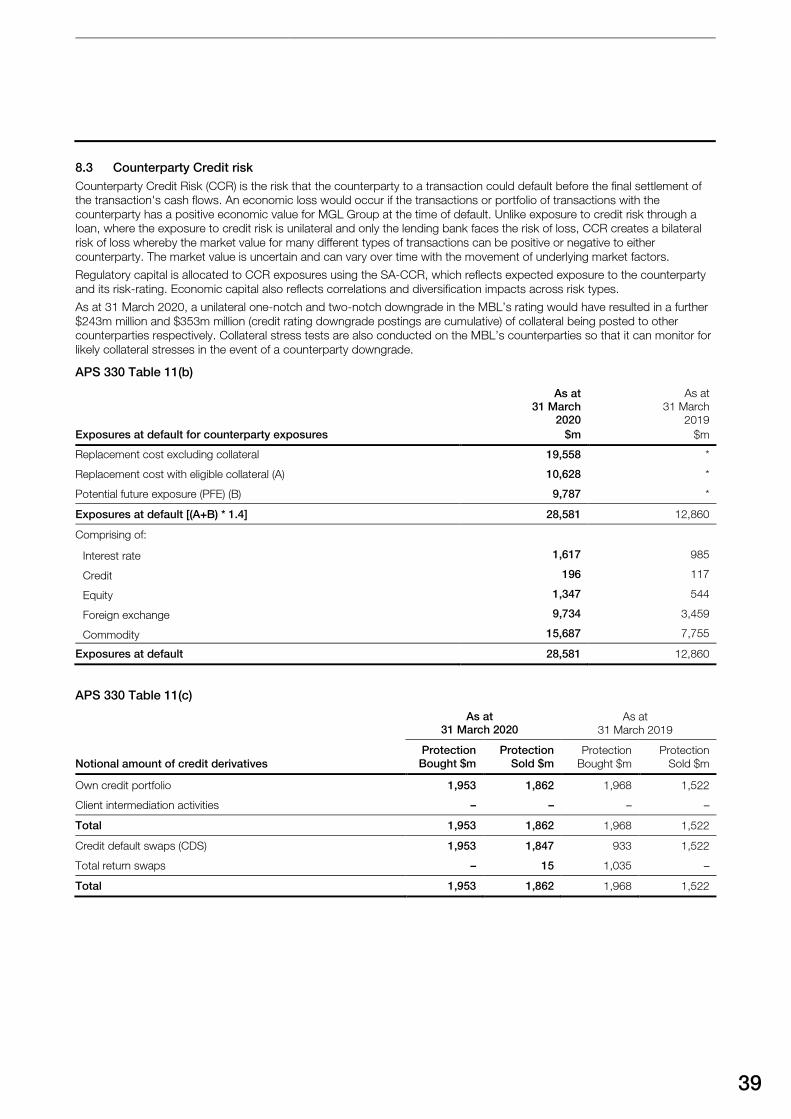
39
8.3 Counterparty Credit risk
Counterparty Credit Risk (CCR) is the risk that the counterparty to a transaction could default before the final settlement of
the transaction's cash flows. An economic loss would occur if the transactions or portfolio of transactions with the
counterparty has a positive economic value for MGL Group at the time of default. Unlike exposure to credit risk through a
loan, where the exposure to credit risk is unilateral and only the lending bank faces the risk of loss, CCR creates a bilateral
risk of loss whereby the market value for many different types of transactions can be positive or negative to either
counterparty. The market value is uncertain and can vary over time with the movement of underlying market factors.
Regulatory capital is allocated to CCR exposures using the SA-CCR, which reflects expected exposure to the counterparty
and its risk-rating. Economic capital also reflects correlations and diversification impacts across risk types.
As at 31 March 2020, a unilateral one-notch and two-notch downgrade in the MBL’s rating would have resulted in a further
$243m million and $353m million (credit rating downgrade postings are cumulative) of collateral being posted to other
counterparties respectively. Collateral stress tests are also conducted on the MBL’s counterparties so that it can monitor for
likely collateral stresses in the event of a counterparty downgrade.
APS 330 Table 11(b)
Exposures at default for counterparty exposures
As at
31 March
2020
$m
As at
31 March
2019
$m
Replacement cost excluding collateral 19,558 *
Replacement cost with eligible collateral (A) 10,628 *
Potential future exposure (PFE) (B) 9,787 *
Exposures at default [(A+B) * 1.4] 28,581 12,860
Comprising of:
Interest rate 1,617 985
Credit 196 117
Equity 1,347 544
Foreign exchange 9,734 3,459
Commodity 15,687 7,755
Exposures at default 28,581 12,860
APS 330 Table 11(c)
As at
31 March 2020
As at
31 March 2019
Notional amount of credit derivatives
Protection
Bought $m
Protection
Sold $m
Protection
Bought $m
Protection
Sold $m
Own credit portfolio 1,953 1,862 1,968 1,522
Client intermediation activities – – – –
Total 1,953 1,862 1,968 1,522
Credit default swaps (CDS) 1,953 1,847 933 1,522
Total return swaps – 15 1,035 –
Total 1,953 1,862 1,968 1,522
Macquarie Bank Limited Pillar 3 Disclosures March 2020 macquarie.com
9.0 Securitisation
40
9.0 Securitisation
9.1 Overview
The revised APS 120 Securitisation (APS 120) became
effective 1 January 2018. A securitisation is defined as “a
financing structure where the cash flow from a pool is used
to make payments on obligations to at least two tranches or
classes of creditors (typically holders of debt securities), with
each tranche or class entitled to receive payments from the
pool before or after another class of creditors, thereby
reflecting different levels of credit risk.”
Macquarie engages in a range of activities in the
securitisation market, including playing the following roles:
– Originator, Arranger, Manager and Servicer on
Macquarie mortgage and auto and equipment finance
securitisation programs;
– Lead Manager on Macquarie originated and third party
securitisations;
– Swap Counterparty to Macquarie originated and third
party securitisations;
– Warehouse facility provider to several third-party
originators;
– Liquidity facility provider to several third-party
originators and provider of redraw facilities to all
Macquarie Mortgage SPVs; and
– Investor in third-party securitisation transactions.
Macquarie has also established contingent liquidity
securitisation SPVs that issue and hold Residential
Mortgage Backed Securities (RMBS) eligible for repurchase
with the RBA.
Macquarie may, as sponsor, use the following types of
special purpose vehicles to securitise third-party exposures:
– trusts, and
– special purpose companies,
issuing RMBS or asset-backed securities (ABS).
Following are the affiliated entities which the MGL group
manages or advises and which can invest either in the
securitisation exposures that Macquarie has securitised or in
SPVs for whom Macquarie is a sponsor (i.e. manager,
adviser, dealer or liquidity and/or credit enhancement
provider):
– Macquarie Core Australian Fixed Interest Fund
– Macquarie Debt Market Opportunity Fund
– Macquarie Australian Diversified Income (High
Grade) Fund
– Macquarie Australian Diversified Income Fund
– Macquarie True Index Global Bond Fund
– Macquarie Global Income Opportunities Fund – SICAV
– Macquarie Global Multi-Sector Fixed Income Fund
– Macquarie Global Income Opportunities Fund
– Macquarie Dynamic Bond Fund
– Macquarie True Index Sovereign Bond Fund
– Macquarie Income Opportunities Fund
– Macquarie True Index Cash Fund
– Macquarie Enhanced Australian Fixed Interest Fund
Any investments by these entities (if any) in securitisation
exposures that Macquarie has securitised or sponsored
does not form a majority of their investment portfolios and
their investment represents a small percentage of the
relevant securitisation issue.
9.1.1 Securitisation Risk Management
RMG is responsible for overseeing the management of the
risk arising from all securitisation exposures. RMG approves
all securitisation transactions and exposures arising from
securitisation activity.
RMG Regulatory Affairs and Aggregate Risk Division (RAAR)
reviews transactions where Macquarie acts as originator,
manager or sponsor to ensure compliance with APS 120
and other regulations. RMG Credit sets limits on
securitisation exposures and reviews transactions to identify
all risks involved. RMG Market Risk reviews market
exposures associated with securitisations, such as swaps,
and other exposures held in the trading book. Macquarie’s
primary risk mitigant is the limit framework and approval
process governing exposures to securitisations.
In addition to credit risk, securitised assets can be subject
to liquidity risk, interest rate risk, and in some instances FX
risk. The nature and scale of these risks varies from
transaction to transaction. All securitised assets are subject
to a degree of operational risk associated with
documentation and the collection of cashflows.
Securitisation exposures are measured daily and monitored
by RMG. RMG completes an annual review of all
securitisation exposures and limits. Regulatory capital is
calculated on all securitisation exposures using the available
approaches in APS 116 and APS 120.
Macquarie applies the following approaches to the
calculation of regulatory capital for securitisation exposures
under APS 120:
– the External Ratings Based approach (ERBA); or
– the Supervisory Formula Approach (SFA).
If one of the above approaches does not apply to an
exposure, then the exposure will be deducted from
Common Equity Tier 1 Capital (CET1).
S&P, Moody’s and Fitch Ratings have all been used to rate
Macquarie securitisations. They have been used to rate
notes and commercial paper issued by Macquarie
securitisation and Commercial Paper programs.
Mitigation of credit risk on securitisation exposures is
performed in accordance with Macquarie’s overall credit risk
mitigation policy. Details of the policy can be found in
section 8.0 of this disclosure.
41
9.1.2 Accounting for Securitisation
Securitisation transactions undertaken by Macquarie are
accounted for in accordance with Australian Accounting
Standards. As noted, securitised positions are managed in
a number of SPVs.
Where these SPVs are deconsolidated for regulatory
purposes under APS 120, they still need to be assessed
under Australian Accounting Standards to determine
whether these SPVs should be considered part of the
accounting consolidated group.
Control exists when the parent is exposed, or has rights, to
variable returns from its involvement with an entity and has
the ability to affect those returns through its power over that
entity. In Macquarie’s case, it has been determined that
under Australian Accounting Standards, Macquarie
consolidates Macquarie mortgage SPVs and auto and
equipment finance SPVs. The assets and liabilities in these
SPVs detailed in the tables within this section are
consolidated into the Macquarie accounting consolidated
group on the basis Macquarie controls those SPVs.
Banking book securitised assets consolidated by Macquarie
are held on the balance sheet at amortised cost. Securitised
exposures in the trading book are held at fair value. There
has been no material change to the methods of valuation
from the prior period.
If there are circumstances where Macquarie is required to
provide financial support for securitised assets, a relevant
liability is recognised on the Bank’s balance sheet. Where a
liability does not currently exist but could arise in the future
as a result of uncertain events not wholly within Macquarie’s
control, a contingent liability is disclosed to the extent such
an obligation may, but probably will not, require an outflow
of resources. A contingent liability does not give rise to an
actual liability being recognised on the Bank’s
balance sheet.
Further information on accounting policies as they relate to
securitisation exposures, including key assumptions and
inputs to valuation processes and Macquarie’s policies on
accounting consolidation, can be found in the Macquarie
Bank Limited financial report.
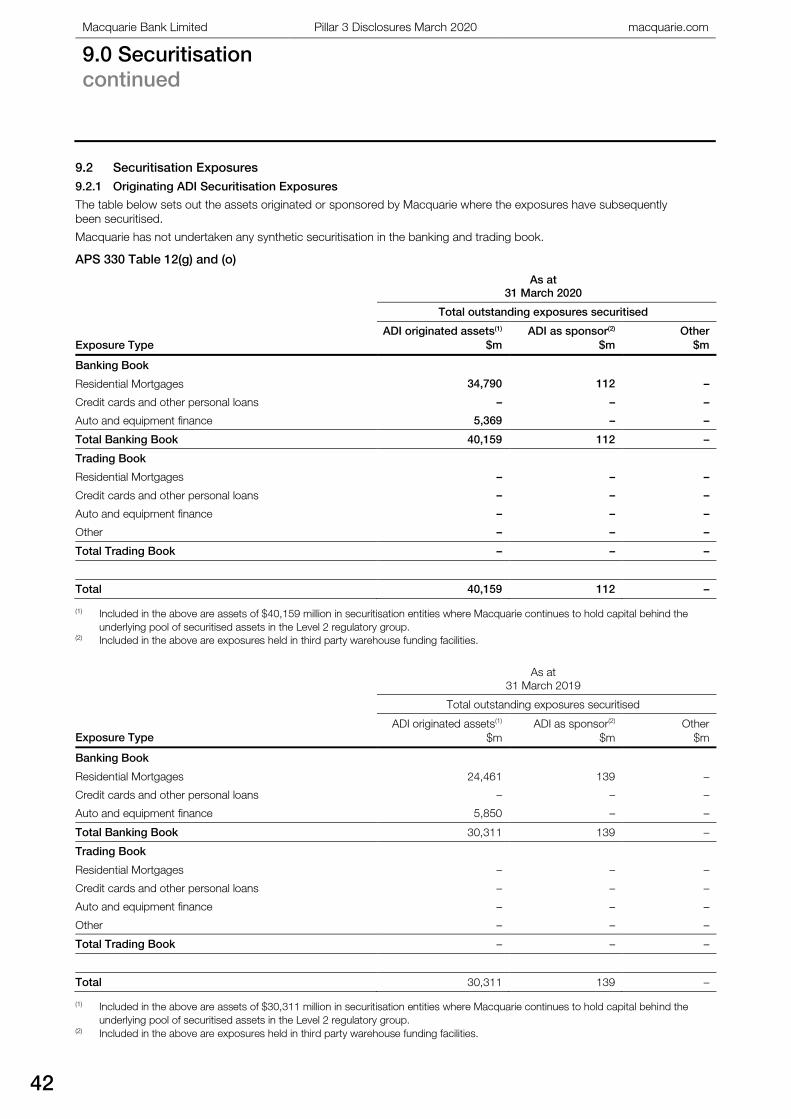
Macquarie Bank Limited Pillar 3 Disclosures March 2020 macquarie.com
9.0 Securitisation
continued
42
9.2 Securitisation Exposures
9.2.1 Originating ADI Securitisation Exposures
The table below sets out the assets originated or sponsored by Macquarie where the exposures have subsequently
been securitised.
Macquarie has not undertaken any synthetic securitisation in the banking and trading book.
APS 330 Table 12(g) and (o)
As at
31 March 2020
Total outstanding exposures securitised
Exposure Type
ADI originated assets(1)
$m
ADI as sponsor(2)
$m
Other
$m
Banking Book
Residential Mortgages 34,790 112 –
Credit cards and other personal loans – – –
Auto and equipment finance 5,369 – –
Total Banking Book 40,159 112 –
Trading Book
Residential Mortgages – – –
Credit cards and other personal loans – – –
Auto and equipment finance – – –
Other – – –
Total Trading Book – – –
Total 40,159 112 –
(1) Included in the above are assets of $40,159 million in securitisation entities where Macquarie continues to hold capital behind the
underlying pool of securitised assets in the Level 2 regulatory group. (2) Included in the above are exposures held in third party warehouse funding facilities.
As at
31 March 2019
Total outstanding exposures securitised
Exposure Type
ADI originated assets(1)
$m
ADI as sponsor(2)
$m
Other
$m
Banking Book
Residential Mortgages 24,461 139 –
Credit cards and other personal loans – – –
Auto and equipment finance 5,850 – –
Total Banking Book 30,311 139 –
Trading Book
Residential Mortgages – – –
Credit cards and other personal loans – – –
Auto and equipment finance – – –
Other – – –
Total Trading Book – – –
Total 30,311 139 –
(1) Included in the above are assets of $30,311 million in securitisation entities where Macquarie continues to hold capital behind the
underlying pool of securitised assets in the Level 2 regulatory group. (2) Included in the above are exposures held in third party warehouse funding facilities.
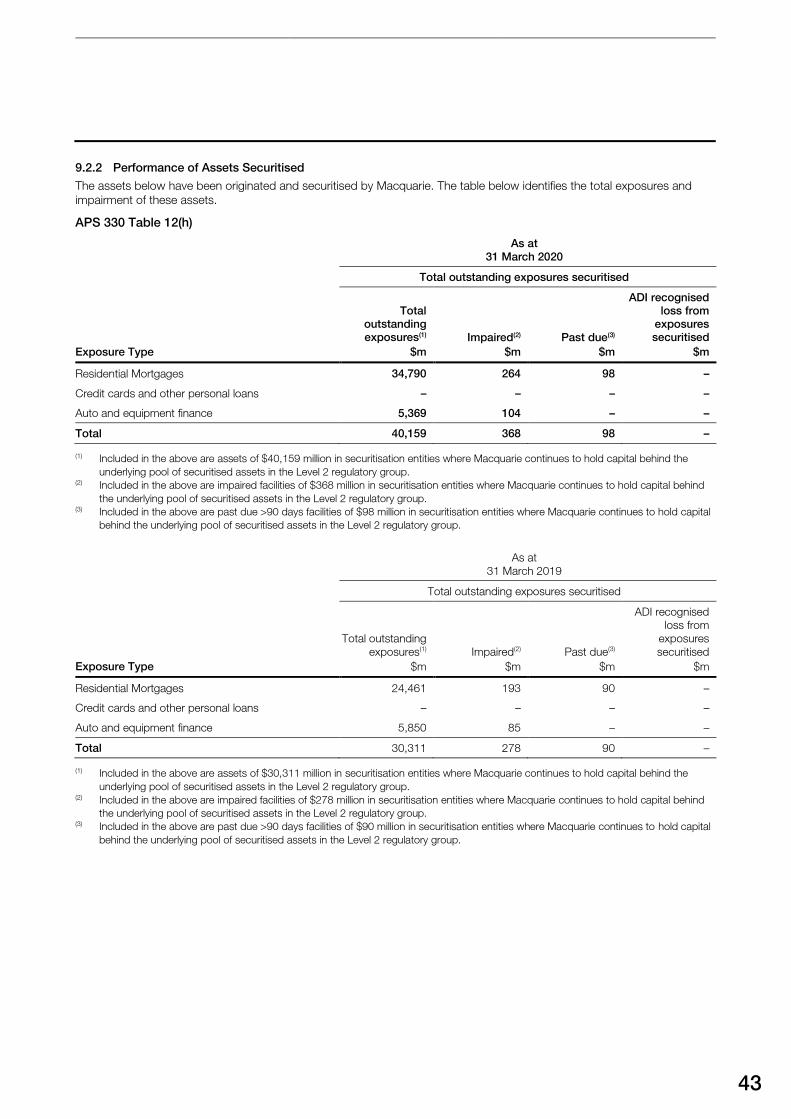
43
9.2.2 Performance of Assets Securitised
The assets below have been originated and securitised by Macquarie. The table below identifies the total exposures and
impairment of these assets.
APS 330 Table 12(h)
As at
31 March 2020
Total outstanding exposures securitised
Exposure Type
Total
outstanding
exposures(1)
$m
Impaired(2)
$m
Past due(3)
$m
ADI recognised
loss from
exposures
securitised
$m
Residential Mortgages 34,790 264 98 –
Credit cards and other personal loans – – – –
Auto and equipment finance 5,369 104 – –
Total 40,159 368 98 –
(1) Included in the above are assets of $40,159 million in securitisation entities where Macquarie continues to hold capital behind the
underlying pool of securitised assets in the Level 2 regulatory group.(2) Included in the above are impaired facilities of $368 million in securitisation entities where Macquarie continues to hold capital behind
the underlying pool of securitised assets in the Level 2 regulatory group.(3) Included in the above are past due >90 days facilities of $98 million in securitisation entities where Macquarie continues to hold capital
behind the underlying pool of securitised assets in the Level 2 regulatory group.
As at
31 March 2019
Total outstanding exposures securitised
Exposure Type
Total outstanding
exposures(1)
$m
Impaired(2)
$m
Past due(3)
$m
ADI recognised
loss from
exposures
securitised
$m
Residential Mortgages 24,461 193 90 –
Credit cards and other personal loans – – – –
Auto and equipment finance 5,850 85 – –
Total 30,311 278 90 –
(1) Included in the above are assets of $30,311 million in securitisation entities where Macquarie continues to hold capital behind the
underlying pool of securitised assets in the Level 2 regulatory group.(2) Included in the above are impaired facilities of $278 million in securitisation entities where Macquarie continues to hold capital behind
the underlying pool of securitised assets in the Level 2 regulatory group.(3) Included in the above are past due >90 days facilities of $90 million in securitisation entities where Macquarie continues to hold capital
behind the underlying pool of securitised assets in the Level 2 regulatory group.
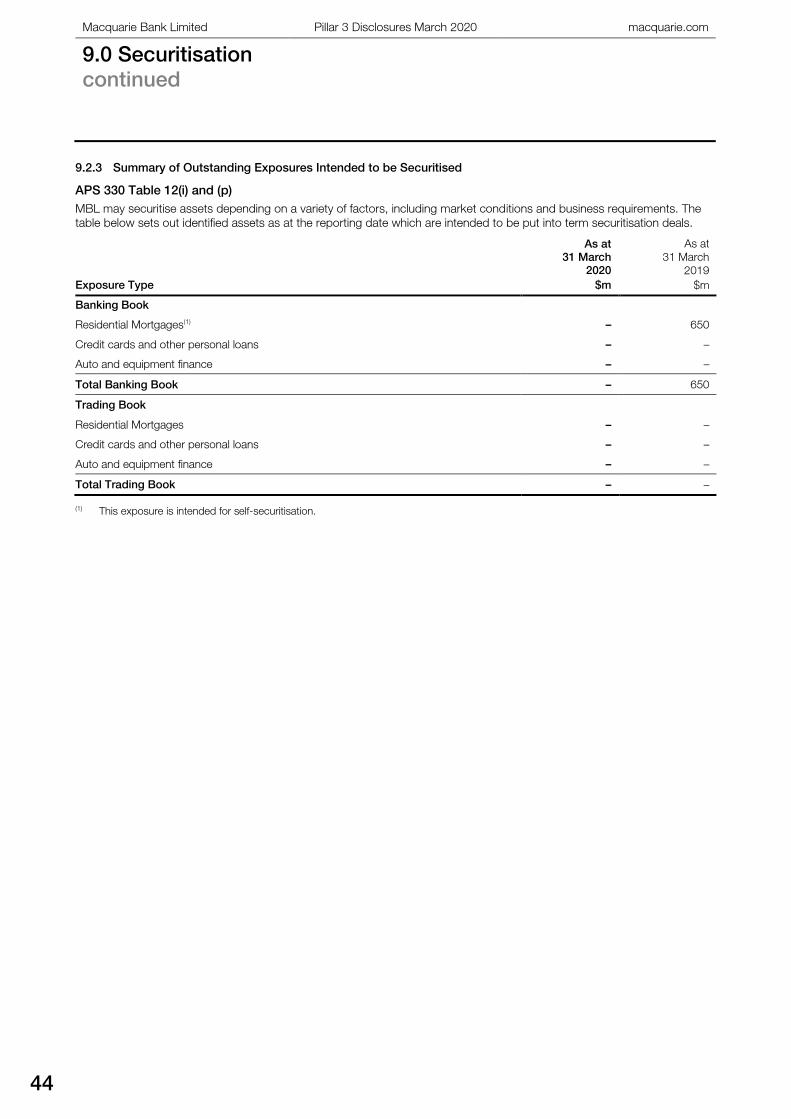
Macquarie Bank Limited Pillar 3 Disclosures March 2020 macquarie.com
9.0 Securitisation
continued
44
9.2.3 Summary of Outstanding Exposures Intended to be Securitised
APS 330 Table 12(i) and (p)
MBL may securitise assets depending on a variety of factors, including market conditions and business requirements. The
table below sets out identified assets as at the reporting date which are intended to be put into term securitisation deals.
Exposure Type
As at
31 March
2020
$m
As at
31 March
2019
$m
Banking Book
Residential Mortgages(1) – 650
Credit cards and other personal loans – –
Auto and equipment finance – –
Total Banking Book – 650
Trading Book
Residential Mortgages – –
Credit cards and other personal loans – –
Auto and equipment finance – –
Total Trading Book – –
(1) This exposure is intended for self-securitisation.
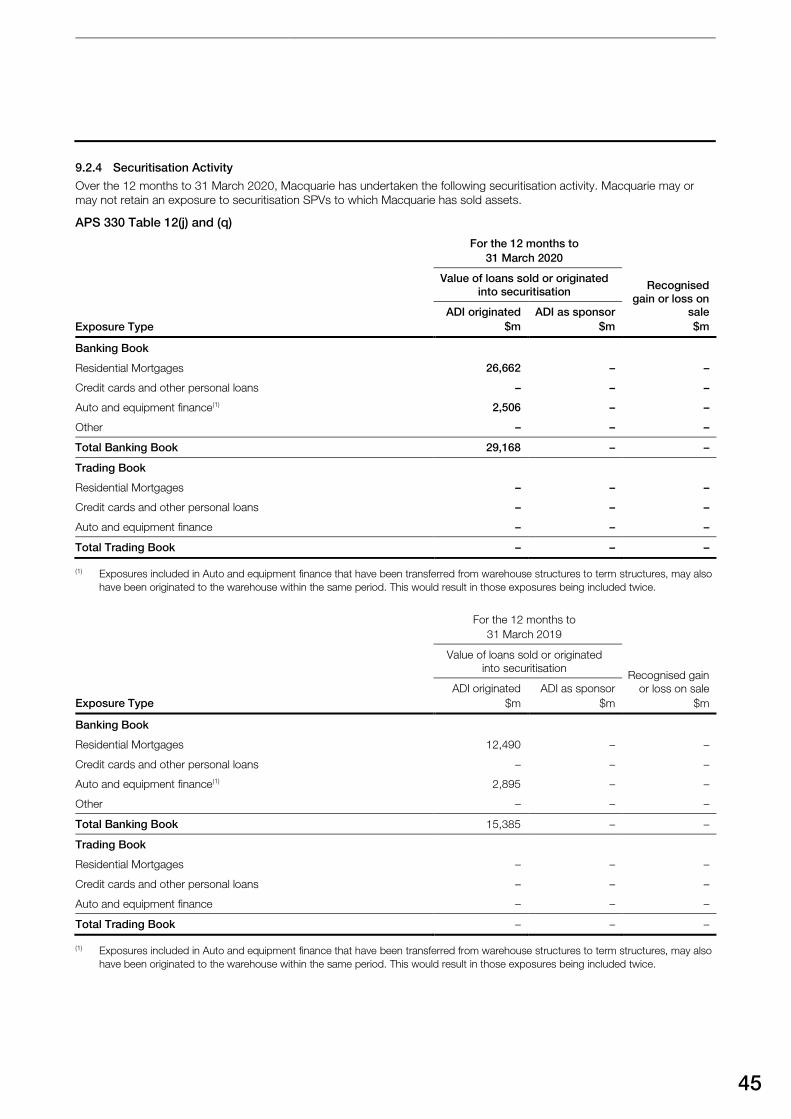
45
9.2.4 Securitisation Activity
Over the 12 months to 31 March 2020, Macquarie has undertaken the following securitisation activity. Macquarie may or
may not retain an exposure to securitisation SPVs to which Macquarie has sold assets.
APS 330 Table 12(j) and (q)
For the 12 months to
31 March 2020
Recognised
gain or loss on
sale
$m
Value of loans sold or originated
into securitisation
Exposure Type
ADI originated
$m
ADI as sponsor
$m
Banking Book
Residential Mortgages 26,662 – –
Credit cards and other personal loans – – –
Auto and equipment finance(1) 2,506 – –
Other – – –
Total Banking Book 29,168 – –
Trading Book
Residential Mortgages – – –
Credit cards and other personal loans – – –
Auto and equipment finance – – –
Total Trading Book – – –
(1) Exposures included in Auto and equipment finance that have been transferred from warehouse structures to term structures, may also
have been originated to the warehouse within the same period. This would result in those exposures being included twice.
For the 12 months to
31 March 2019
Recognised gain
or loss on sale
$m
Value of loans sold or originated
into securitisation
Exposure Type
ADI originated
$m
ADI as sponsor
$m
Banking Book
Residential Mortgages 12,490 – –
Credit cards and other personal loans – – –
Auto and equipment finance(1) 2,895 – –
Other – – –
Total Banking Book 15,385 – –
Trading Book
Residential Mortgages – – –
Credit cards and other personal loans – – –
Auto and equipment finance – – –
Total Trading Book – – –
(1) Exposures included in Auto and equipment finance that have been transferred from warehouse structures to term structures, may also
have been originated to the warehouse within the same period. This would result in those exposures being included twice.
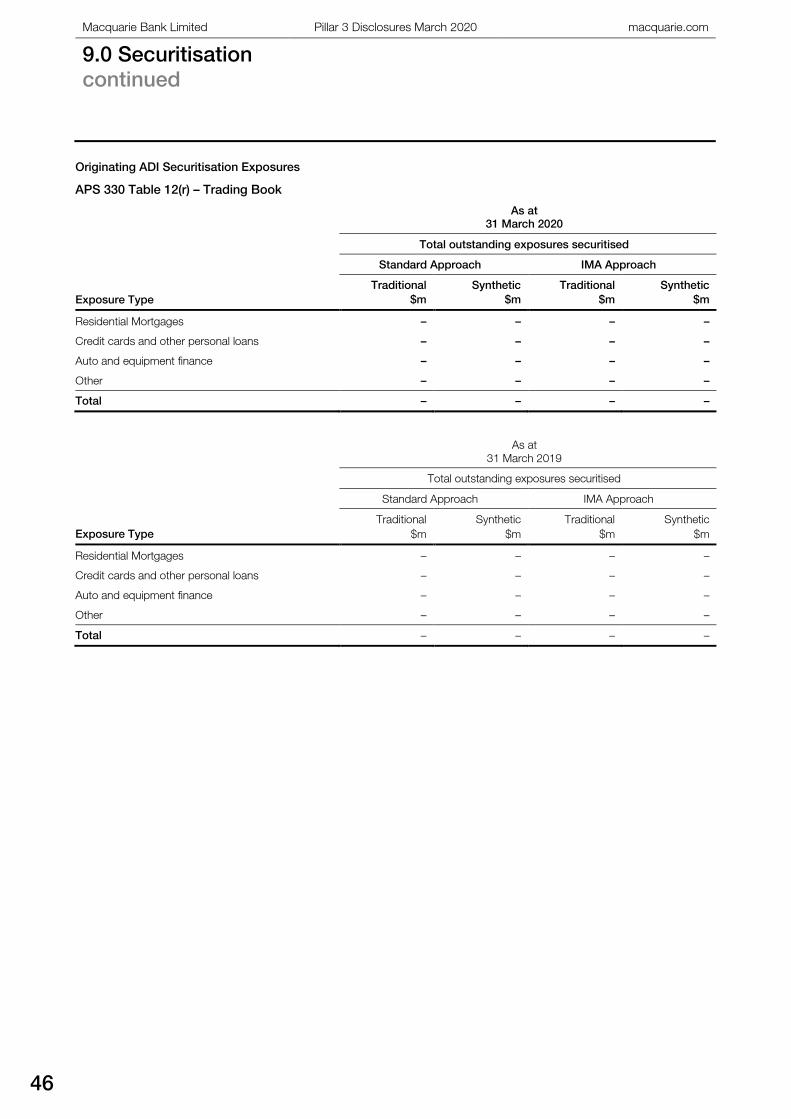
Macquarie Bank Limited Pillar 3 Disclosures March 2020 macquarie.com
9.0 Securitisation
continued
46
Originating ADI Securitisation Exposures
APS 330 Table 12(r) – Trading Book
As at
31 March 2020
Total outstanding exposures securitised
Standard Approach IMA Approach
Exposure Type
Traditional
$m
Synthetic
$m
Traditional
$m
Synthetic
$m
Residential Mortgages – – – –
Credit cards and other personal loans – – – –
Auto and equipment finance – – – –
Other – – – –
Total – – – –
As at
31 March 2019
Total outstanding exposures securitised
Standard Approach IMA Approach
Exposure Type
Traditional
$m
Synthetic
$m
Traditional
$m
Synthetic
$m
Residential Mortgages – – – –
Credit cards and other personal loans – – – –
Auto and equipment finance – – – –
Other – – – –
Total – – – –
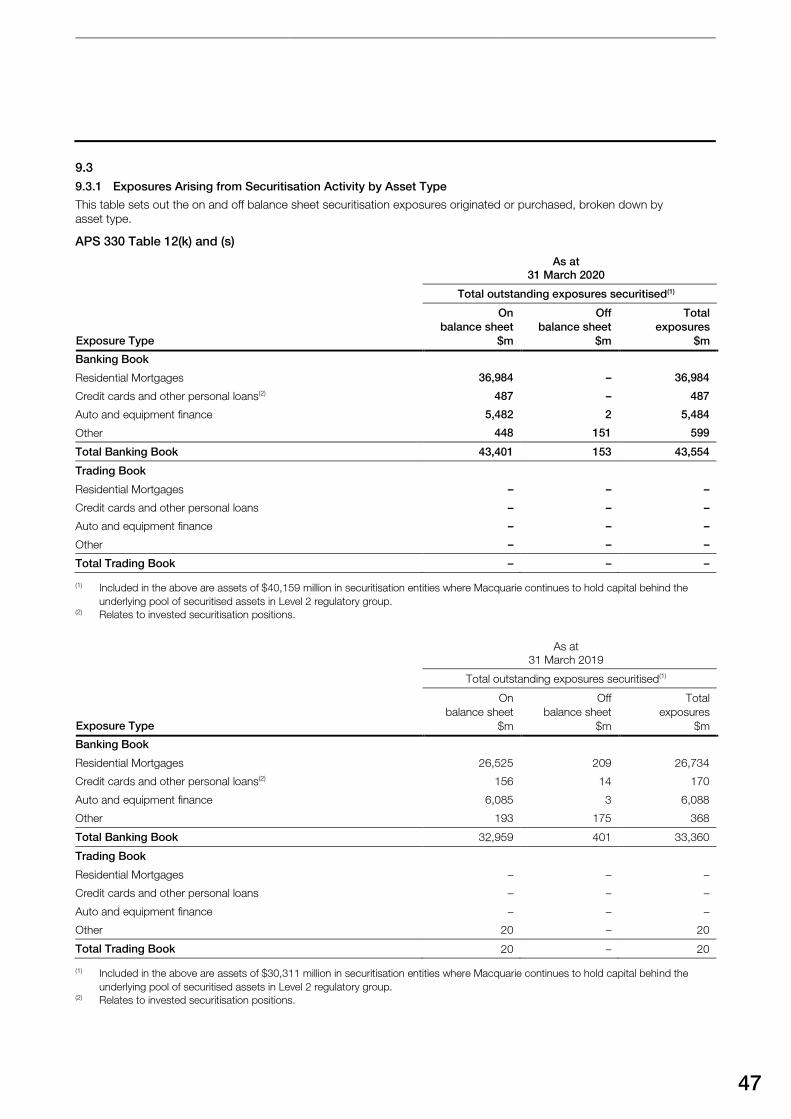
47
9.3
9.3.1 Exposures Arising from Securitisation Activity by Asset Type
This table sets out the on and off balance sheet securitisation exposures originated or purchased, broken down by
asset type.
APS 330 Table 12(k) and (s)
As at
31 March 2020
Total outstanding exposures securitised(1)
Exposure Type
On
balance sheet
$m
Off
balance sheet
$m
Total
exposures
$m
Banking Book
Residential Mortgages 36,984 – 36,984
Credit cards and other personal loans(2) 487 – 487
Auto and equipment finance 5,482 2 5,484
Other 448 151 599
Total Banking Book 43,401 153 43,554
Trading Book
Residential Mortgages – – –
Credit cards and other personal loans – – –
Auto and equipment finance – – –
Other – – –
Total Trading Book – – –
(1) Included in the above are assets of $40,159 million in securitisation entities where Macquarie continues to hold capital behind the
underlying pool of securitised assets in Level 2 regulatory group. (2) Relates to invested securitisation positions.
As at
31 March 2019
Total outstanding exposures securitised(1)
Exposure Type
On
balance sheet
$m
Off
balance sheet
$m
Total
exposures
$m
Banking Book
Residential Mortgages 26,525 209 26,734
Credit cards and other personal loans(2) 156 14 170
Auto and equipment finance 6,085 3 6,088
Other 193 175 368
Total Banking Book 32,959 401 33,360
Trading Book
Residential Mortgages – – –
Credit cards and other personal loans – – –
Auto and equipment finance – – –
Other 20 – 20
Total Trading Book 20 – 20
(1) Included in the above are assets of $30,311 million in securitisation entities where Macquarie continues to hold capital behind the
underlying pool of securitised assets in Level 2 regulatory group. (2) Relates to invested securitisation positions.
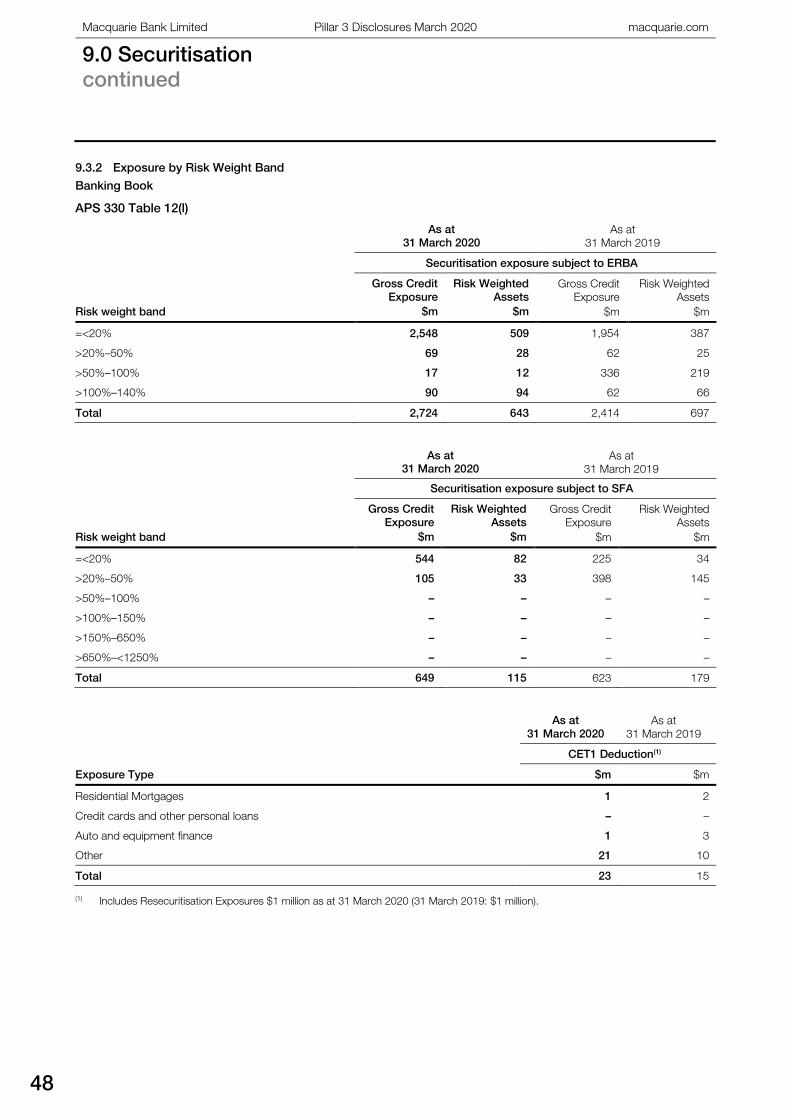
Macquarie Bank Limited Pillar 3 Disclosures March 2020 macquarie.com
9.0 Securitisation
continued
48
9.3.2 Exposure by Risk Weight Band
Banking Book
APS 330 Table 12(l)
As at
31 March 2020
As at
31 March 2019
Securitisation exposure subject to ERBA
Risk weight band
Gross Credit
Exposure
$m
Risk Weighted
Assets
$m
Gross Credit
Exposure
$m
Risk Weighted
Assets
$m
=<20% 2,548 509 1,954 387
>20%–50% 69 28 62 25
>50%–100% 17 12 336 219
>100%–140% 90 94 62 66
Total 2,724 643 2,414 697
As at
31 March 2020
As at
31 March 2019
Securitisation exposure subject to SFA
Risk weight band
Gross Credit
Exposure
$m
Risk Weighted
Assets
$m
Gross Credit
Exposure
$m
Risk Weighted
Assets
$m
=<20% 544 82 225 34
>20%–50% 105 33 398 145
>50%–100% – – – –
>100%–150% – – – –
>150%–650% – – – –
>650%–<1250% – – – –
Total 649 115 623 179
As at
31 March 2020
As at
31 March 2019
CET1 Deduction(1)
Exposure Type $m $m
Residential Mortgages 1 2
Credit cards and other personal loans – –
Auto and equipment finance 1 3
Other 21 10
Total 23 15
(1) Includes Resecuritisation Exposures $1 million as at 31 March 2020 (31 March 2019: $1 million).
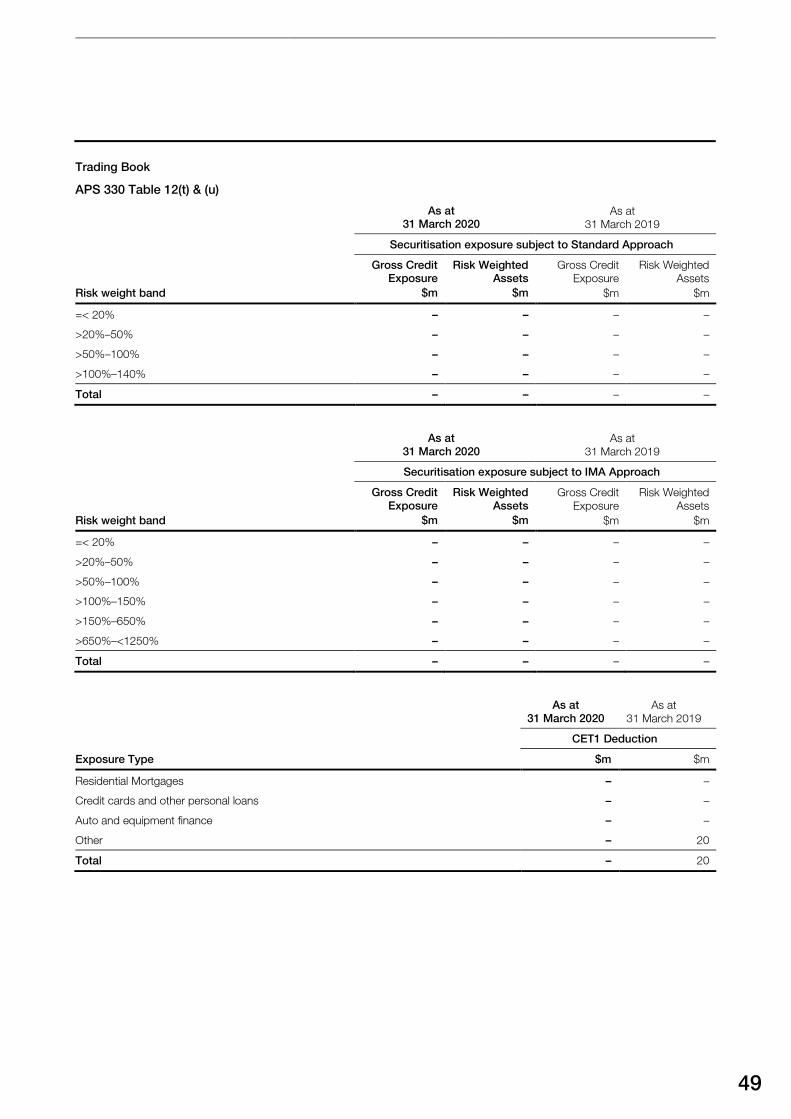
49
Trading Book
APS 330 Table 12(t) & (u)
As at
31 March 2020
As at
31 March 2019
Securitisation exposure subject to Standard Approach
Risk weight band
Gross Credit
Exposure
$m
Risk Weighted
Assets
$m
Gross Credit
Exposure
$m
Risk Weighted
Assets
$m
=< 20% – – – –
>20%–50% – – – –
>50%–100% – – – –
>100%–140% – – – –
Total – – – –
As at
31 March 2020
As at
31 March 2019
Securitisation exposure subject to IMA Approach
Risk weight band
Gross Credit
Exposure
$m
Risk Weighted
Assets
$m
Gross Credit
Exposure
$m
Risk Weighted
Assets
$m
=< 20% – – – –
>20%–50% – – – –
>50%–100% – – – –
>100%–150% – – – –
>150%–650% – – – –
>650%–<1250% – – – –
Total – – – –
As at
31 March 2020
As at
31 March 2019
CET1 Deduction
Exposure Type $m $m
Residential Mortgages – –
Credit cards and other personal loans – –
Auto and equipment finance – –
Other – 20
Total – 20
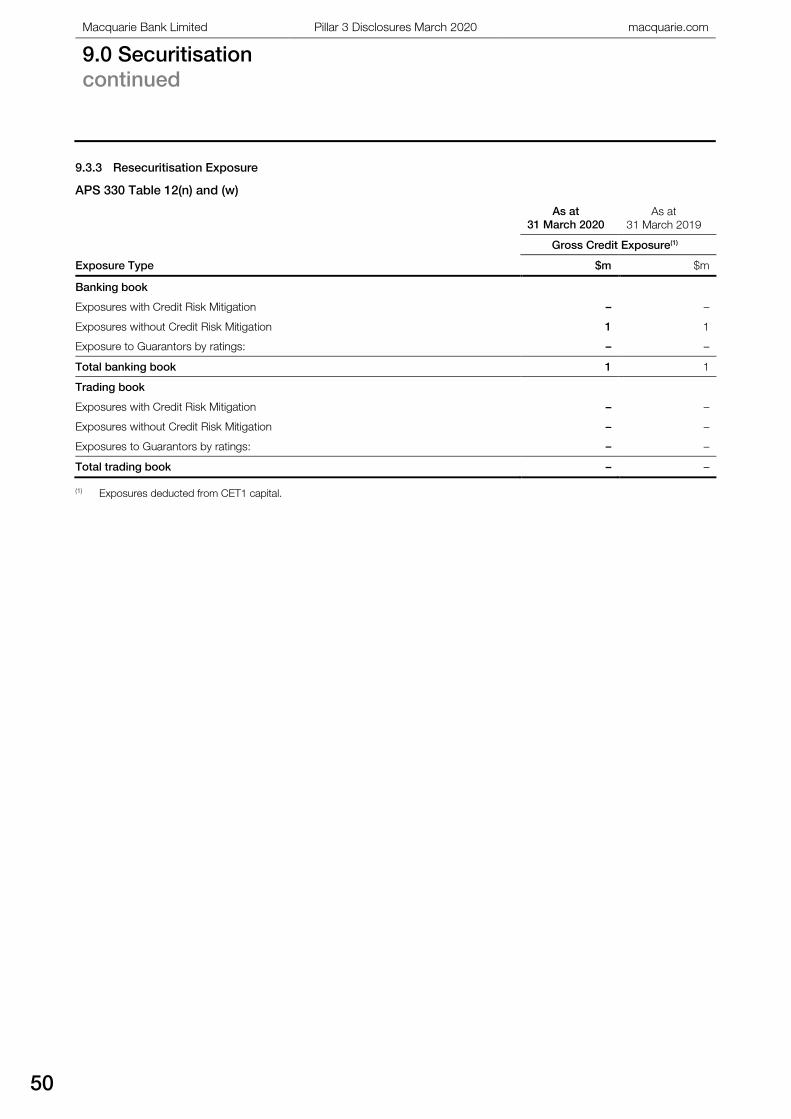
Macquarie Bank Limited Pillar 3 Disclosures March 2020 macquarie.com
9.0 Securitisation
continued
50
9.3.3 Resecuritisation Exposure
APS 330 Table 12(n) and (w)
As at
31 March 2020
As at
31 March 2019
Gross Credit Exposure(1)
Exposure Type $m $m
Banking book
Exposures with Credit Risk Mitigation – –
Exposures without Credit Risk Mitigation 1 1
Exposure to Guarantors by ratings: – –
Total banking book 1 1
Trading book
Exposures with Credit Risk Mitigation – –
Exposures without Credit Risk Mitigation – –
Exposures to Guarantors by ratings: – –
Total trading book – –
(1) Exposures deducted from CET1 capital.
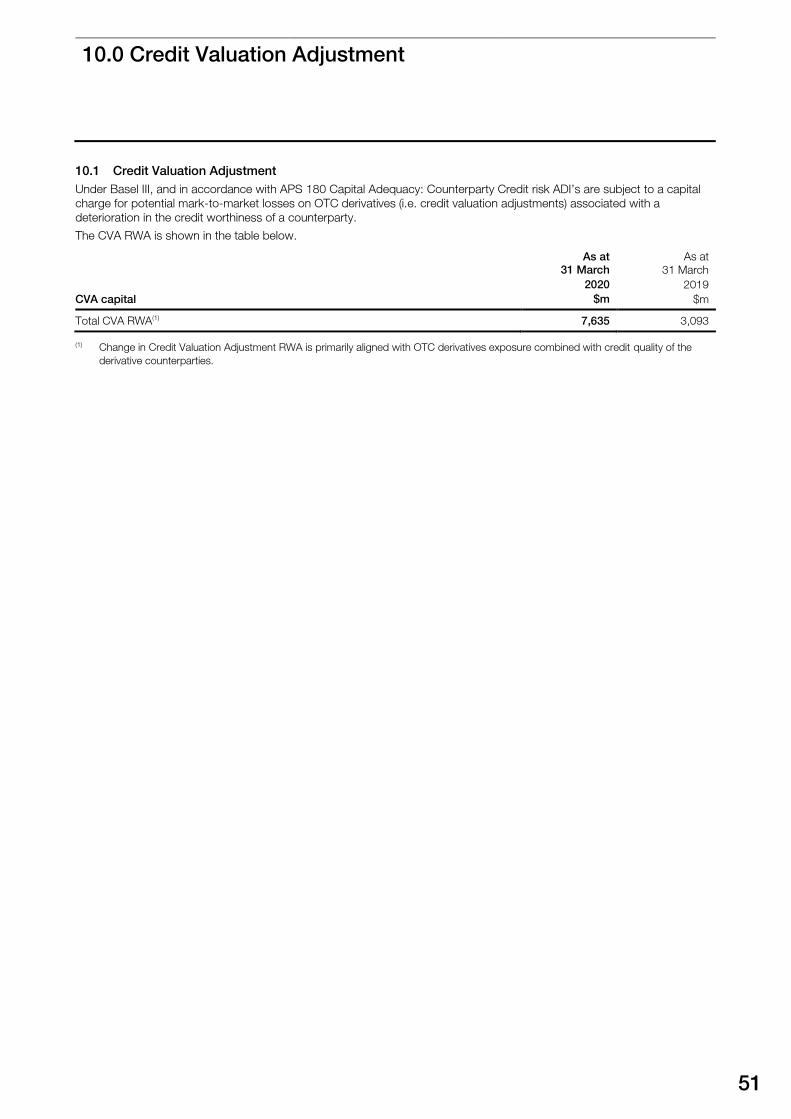
10.0 Credit Valuation Adjustment
51
10.0 Credit Valuation Adjustment
10.1 Credit Valuation Adjustment
Under Basel III, and in accordance with APS 180 Capital Adequacy: Counterparty Credit risk ADI’s are subject to a capital
charge for potential mark-to-market losses on OTC derivatives (i.e. credit valuation adjustments) associated with a
deterioration in the credit worthiness of a counterparty.
The CVA RWA is shown in the table below.
CVA capital
As at
31 March
2020
$m
As at
31 March
2019
$m
Total CVA RWA(1) 7,635 3,093
(1) Change in Credit Valuation Adjustment RWA is primarily aligned with OTC derivatives exposure combined with credit quality of the
derivative counterparties.
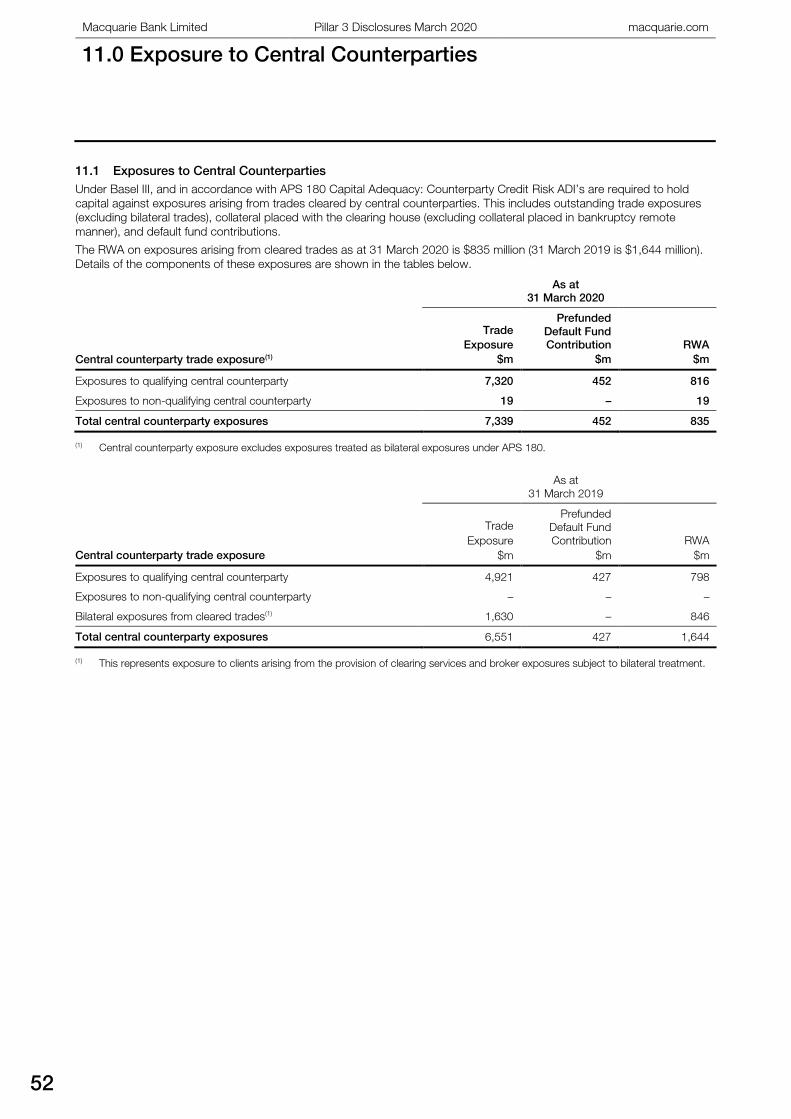
Macquarie Bank Limited Pillar 3 Disclosures March 2020 macquarie.com
11.0 Exposure to Central Counterparties
52
11.0 Exposure to Central Counterparties
11.1 Exposures to Central Counterparties
Under Basel III, and in accordance with APS 180 Capital Adequacy: Counterparty Credit Risk ADI’s are required to hold
capital against exposures arising from trades cleared by central counterparties. This includes outstanding trade exposures
(excluding bilateral trades), collateral placed with the clearing house (excluding collateral placed in bankruptcy remote
manner), and default fund contributions.
The RWA on exposures arising from cleared trades as at 31 March 2020 is $835 million (31 March 2019 is $1,644 million).
Details of the components of these exposures are shown in the tables below.
As at
31 March 2020
Central counterparty trade exposure(1)
Trade
Exposure
$m
Prefunded
Default Fund
Contribution
$m
RWA
$m
Exposures to qualifying central counterparty 7,320 452 816
Exposures to non-qualifying central counterparty 19 – 19
Total central counterparty exposures 7,339 452 835
(1) Central counterparty exposure excludes exposures treated as bilateral exposures under APS 180.
As at
31 March 2019
Central counterparty trade exposure
Trade
Exposure
$m
Prefunded
Default Fund
Contribution
$m
RWA
$m
Exposures to qualifying central counterparty 4,921 427 798
Exposures to non-qualifying central counterparty – – –
Bilateral exposures from cleared trades(1) 1,630 – 846
Total central counterparty exposures 6,551 427 1,644
(1) This represents exposure to clients arising from the provision of clearing services and broker exposures subject to bilateral treatment.
12.0 Market Risk
53
12.0 Market Risk
12.1 Market Risk
Market risk is the risk of adverse changes in the value of
Macquarie’s trading positions as a result of changes in
market conditions. Macquarie is exposed to the
following risks:
– Price: The risk of loss due to changes in price of a risk
factor (Interest rates, foreign exchange,
commodities etc.)
– Volatility: The risk of loss due to changes in the
volatility of a risk factor
– Basis: Risk of imperfect correlation between offsetting
investments in a hedging strategy
– Correlation: Risk that the actual correlation between
two assets or variables is different from the assumed
correlation
– Illiquid market: Risk of inability to sell assets or close
out positions in thinly-traded markets at close to the
last market prices
– Concentration: Risk of over concentration of trading
exposures in certain markets and products
– Valuation adjustments (XVA): Risk of valuation
adjustments to derivative positions; specifically, Credit
Valuation Adjustment (CVA), Debit Valuation Adjustment
(DVA) and Funding Valuation Adjustment (FVA)
Macquarie has long favoured transparent scenario analysis
over complex statistical modelling as the cornerstone of
risk measurement.
12.1.1 Traded Market Risk
All trading activities contain calculated elements of risk
taking. Macquarie is prepared to accept such risks provided
they are within agreed limits, independently and correctly
identified, calculated and monitored by RMG and reported
to senior management on a regular basis.
RMG monitors positions within Macquarie according to a
limit structure that sets limits for all exposures in all markets.
Limits are applied at a granular level to individual trading
desks, through increasing levels of aggregation to Divisions
and Operating Groups, and ultimately, Macquarie. This
approach removes the need for future correlations or
scenarios to be precisely predicted as all risks are stressed
to the extreme and accounted for within the risk profile
agreed for each business and Macquarie in aggregate.
Limits are approved by senior management with appropriate
authority for the size and nature of the risk and Macquarie
adheres to a strict ‘no limit, no dealing’ policy. If a product
or position has not been authorised and given a limit
structure by RMG, then it cannot be traded. Material
breaches of the approved limit structure are communicated
monthly to the Macquarie and Macquarie Bank Boards.
RMG sets three complementary limit structures:
– Contingent loss limits: Worst case scenarios that
shock prices and volatilities by more than has occurred
historically. Multiple scenarios are set for each market
to capture the non-linearity and complexity of
exposures arising from derivatives. A wide range of
assumptions about the correlations between markets
is applied
– Position limits: Volume, maturity and open position
limits are set on a large number of market instruments
and securities in order to constrain concentration risk
and to avoid the accumulation of risky, illiquid positions
– Value-at-Risk (VaR) limits: Statistical measure based
on a 10-day holding period and a 99% confidence
level, as stipulated by the APRA capital adequacy
standard. The model is validated daily by back testing a
one-day VaR against hypothetical and actual daily
trading profit or loss.
The risk of loss from incorrect or inappropriate pricing and
hedging models is mitigated by the requirement for all new
pricing models to be independently tested by the specialists
within Model Risk and Quant Analytics (‘MRQA’)
within RMG.
12.1.2 Aggregate Measures of Market Risk
Traded market risk
Aggregate traded market risk is constrained by two risk
measures, Value at Risk (VaR) and the Macro-Economic
Linkages (MEL) stress scenarios. The VaR model predicts
the maximum likely loss in Macquarie’s trading portfolio due
to adverse movements in global markets over holding
periods of one and ten days. The MEL scenario uses the
contingent loss approach to capture simultaneous, worst
case movements across all major markets. Whereas MEL
focuses on extreme price movements, VaR focuses on
unexceptional changes in price so that it does not account
for losses that could occur beyond the 99% level of
confidence. Stress testing therefore remains the
predominant focus of RMG as it is considered to be the
most effective mechanism to reduce Macquarie’s exposure
to unexpected market events.
Interest rate risk in the banking book (IRRBB)
Aggregate IRRBB is constrained by two measures,
Economic Value Sensitivity (EVS) and Earnings at Risk (EaR).
The EVS metric measures the change in net present value of
the banking book as a result of changes in interest rates.
The EaR model constrains the impact on reported income
for a change in interest rates, including the Net Interest
Income for accrual portfolios.
Macquarie Bank Limited Pillar 3 Disclosures March 2020 macquarie.com
12.0 Market Risk
continued
54
12.1.3 Value at Risk Model
VaR provides a statistically based summary of overall
market risk in the Group. The VaR model uses a Monte
Carlo simulation to generate normally distributed price and
volatility paths for approximately 6,200 benchmarks, using
volatilities and correlations based on three years of historical
data. Emphasis is placed on more recent market
movements to more accurately reflect current conditions.
Each benchmark represents an asset at a specific maturity,
for example, one year crude oil futures or spot gold. The
benchmarks provide a high level of granularity in assessing
risk, covering a range of points on yield curves and forward
price curves, and distinguishing between similar but distinct
assets; for example crude oil as opposed to heating oil, or
gas traded at different locations. Exposures to individual
equities within a national market are captured by specific
risk modelling incorporated directly into the VaR model.
The integrity of the VaR model is tested against daily
hypothetical and actual trading outcomes (profit and loss)
and reported to APRA quarterly.
12.1.4 Macro Economic Linkage Model
MEL scenarios are large, simultaneous, ‘worst case’
movements in global markets. The MEL scenarios consider
very large movements in a number of markets at once,
based on Macquarie’s understanding of the economic
linkages between markets. The MEL scenarios reflect a
market ‘shock’ or ‘gap’ as opposed to a
sustained deterioration.
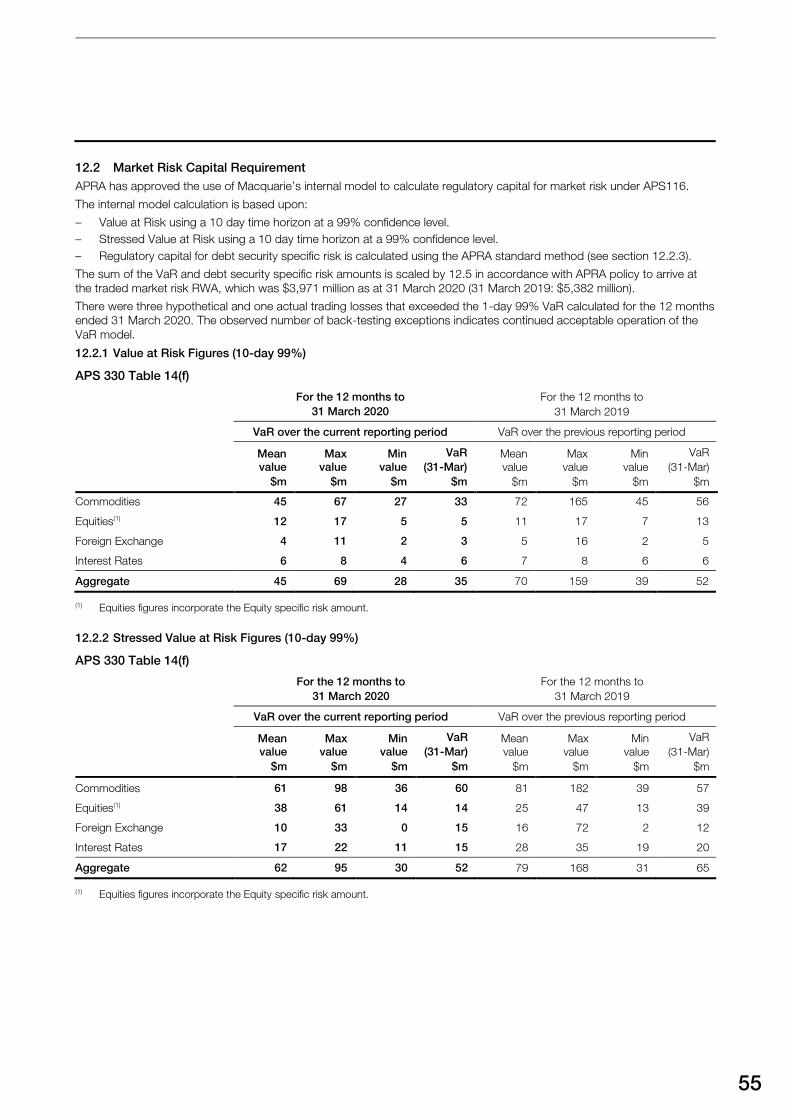
55
12.2 Market Risk Capital Requirement
APRA has approved the use of Macquarie’s internal model to calculate regulatory capital for market risk under APS116.
The internal model calculation is based upon:
– Value at Risk using a 10 day time horizon at a 99% confidence level.
– Stressed Value at Risk using a 10 day time horizon at a 99% confidence level.
– Regulatory capital for debt security specific risk is calculated using the APRA standard method (see section 12.2.3).
The sum of the VaR and debt security specific risk amounts is scaled by 12.5 in accordance with APRA policy to arrive at
the traded market risk RWA, which was $3,971 million as at 31 March 2020 (31 March 2019: $5,382 million).
There were three hypothetical and one actual trading losses that exceeded the 1-day 99% VaR calculated for the 12 months
ended 31 March 2020. The observed number of back-testing exceptions indicates continued acceptable operation of the
VaR model.
12.2.1 Value at Risk Figures (10-day 99%)
APS 330 Table 14(f)
For the 12 months to
31 March 2020
For the 12 months to
31 March 2019
VaR over the current reporting period VaR over the previous reporting period
Mean
value
$m
Max
value
$m
Min
value
$m
VaR
(31-Mar)
$m
Mean
value
$m
Max
value
$m
Min
value
$m
VaR
(31-Mar)
$m
Commodities 45 67 27 33 72 165 45 56
Equities(1) 12 17 5 5 11 17 7 13
Foreign Exchange 4 11 2 3 5 16 2 5
Interest Rates 6 8 4 6 7 8 6 6
Aggregate 45 69 28 35 70 159 39 52
(1) Equities figures incorporate the Equity specific risk amount.
12.2.2 Stressed Value at Risk Figures (10-day 99%)
APS 330 Table 14(f)
For the 12 months to
31 March 2020
For the 12 months to
31 March 2019
VaR over the current reporting period VaR over the previous reporting period
Mean
value
$m
Max
value
$m
Min
value
$m
VaR
(31-Mar)
$m
Mean
value
$m
Max
value
$m
Min
value
$m
VaR
(31-Mar)
$m
Commodities 61 98 36 60 81 182 39 57
Equities(1) 38 61 14 14 25 47 13 39
Foreign Exchange 10 33 0 15 16 72 2 12
Interest Rates 17 22 11 15 28 35 19 20
Aggregate 62 95 30 52 79 168 31 65
(1) Equities figures incorporate the Equity specific risk amount.
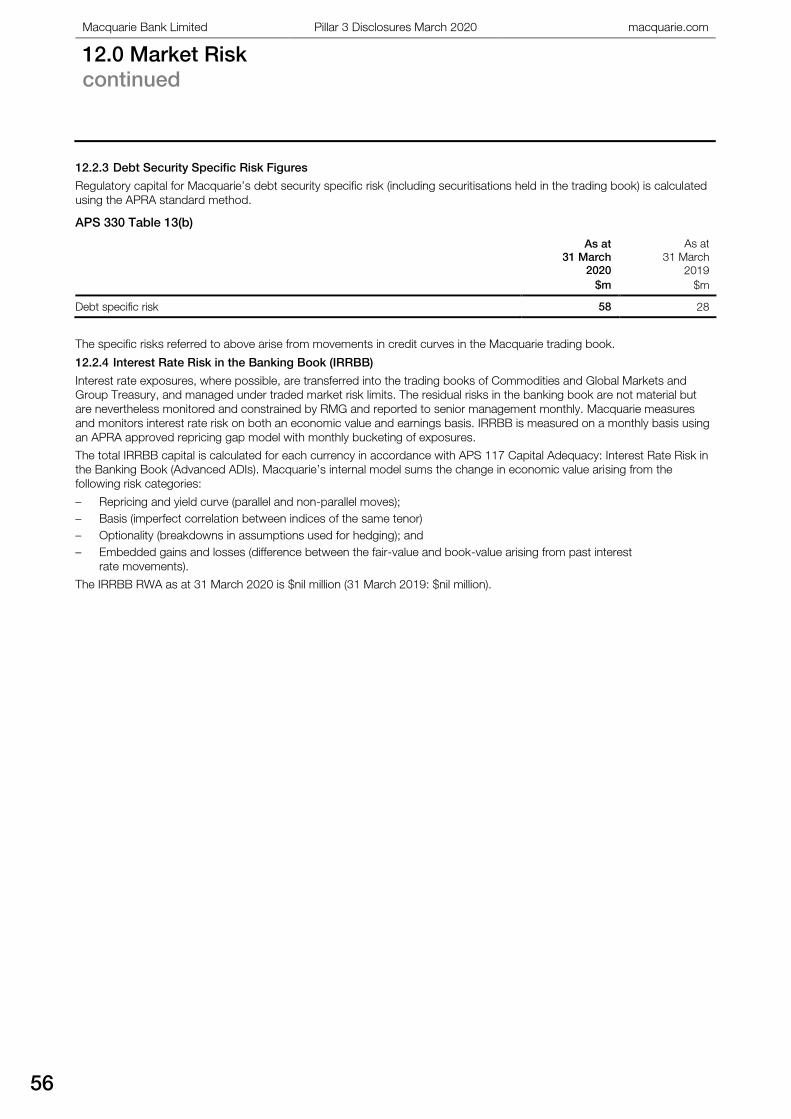
Macquarie Bank Limited Pillar 3 Disclosures March 2020 macquarie.com
12.0 Market Risk
continued
56
12.2.3 Debt Security Specific Risk Figures
Regulatory capital for Macquarie’s debt security specific risk (including securitisations held in the trading book) is calculated
using the APRA standard method.
APS 330 Table 13(b)
As at
31 March
2020
$m
As at
31 March
2019
$m
Debt specific risk 58 28
The specific risks referred to above arise from movements in credit curves in the Macquarie trading book.
12.2.4 Interest Rate Risk in the Banking Book (IRRBB)
Interest rate exposures, where possible, are transferred into the trading books of Commodities and Global Markets and
Group Treasury, and managed under traded market risk limits. The residual risks in the banking book are not material but
are nevertheless monitored and constrained by RMG and reported to senior management monthly. Macquarie measures
and monitors interest rate risk on both an economic value and earnings basis. IRRBB is measured on a monthly basis using
an APRA approved repricing gap model with monthly bucketing of exposures.
The total IRRBB capital is calculated for each currency in accordance with APS 117 Capital Adequacy: Interest Rate Risk in
the Banking Book (Advanced ADIs). Macquarie’s internal model sums the change in economic value arising from the
following risk categories:
– Repricing and yield curve (parallel and non-parallel moves);
– Basis (imperfect correlation between indices of the same tenor)
– Optionality (breakdowns in assumptions used for hedging); and
– Embedded gains and losses (difference between the fair-value and book-value arising from past interest
rate movements).
The IRRBB RWA as at 31 March 2020 is $nil million (31 March 2019: $nil million).
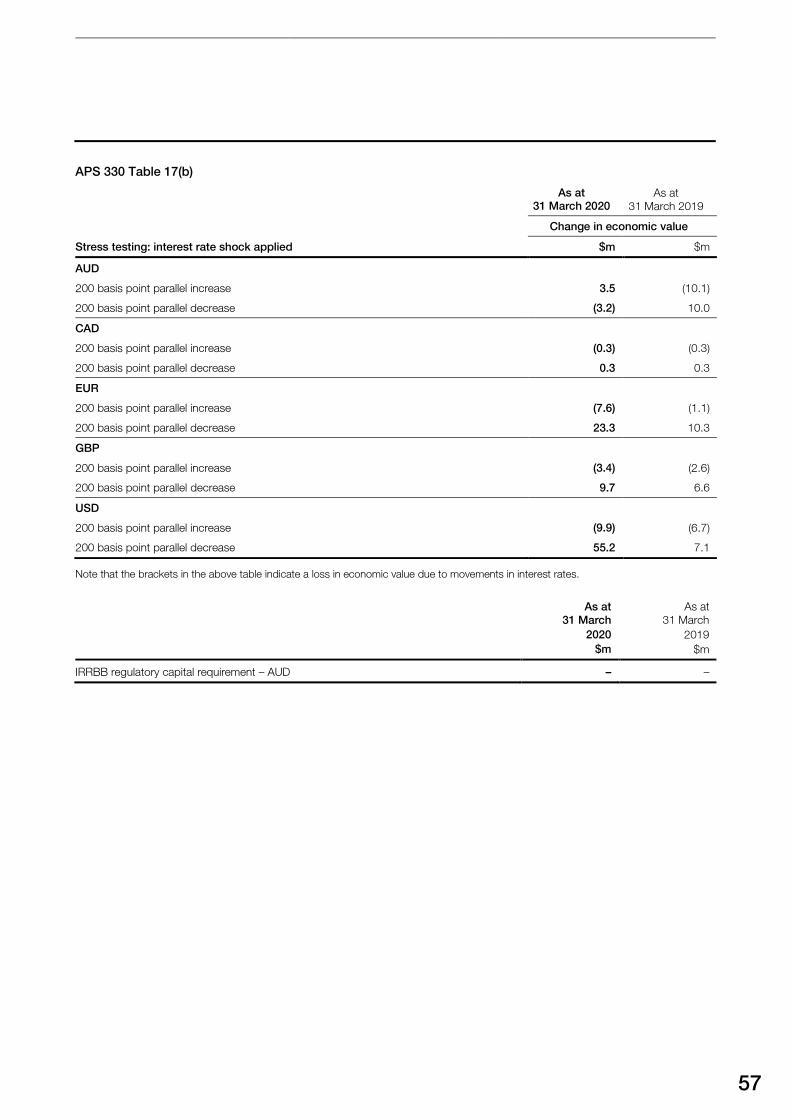
57
APS 330 Table 17(b)
As at
31 March 2020
As at
31 March 2019
Change in economic value
Stress testing: interest rate shock applied $m $m
AUD
200 basis point parallel increase 3.5 (10.1)
200 basis point parallel decrease (3.2) 10.0
CAD
200 basis point parallel increase (0.3) (0.3)
200 basis point parallel decrease 0.3 0.3
EUR
200 basis point parallel increase (7.6) (1.1)
200 basis point parallel decrease 23.3 10.3
GBP
200 basis point parallel increase (3.4) (2.6)
200 basis point parallel decrease 9.7 6.6
USD
200 basis point parallel increase (9.9) (6.7)
200 basis point parallel decrease 55.2 7.1
Note that the brackets in the above table indicate a loss in economic value due to movements in interest rates.
As at
31 March
2020
$m
As at
31 March
2019
$m
IRRBB regulatory capital requirement – AUD – –
Macquarie Bank Limited Pillar 3 Disclosures March 2020 macquarie.com
13.0 Equity Risk
58
13.0 Equity Risk
Equity risk is the risk of loss arising from banking book
equity-type exposures. These exposures include:
– holdings in specialised funds managed by Macquarie;
– property equity, including property trusts and direct
property equity investments; and
– other equity investments.
All of the above equity risk positions are subject to an
aggregate Equity Risk Limit (ERL). The ERL is set by the
Board by reference to the Risk Appetite Test that is
described further in the Capital Adequacy section 4. When
the Board sets the limit, it also considers the level of
earnings, capital and market conditions. RMG reviews the
limit semi-annually and reports the results of the review to
the Group Risk and Compliance Committee (GRCC) and
the Board.
13.1 Accounting for Equity Holdings in the
Banking Book
Equity investment positions have varying accounting
treatments depending on the nature of the exposure.
These include:
– equity accounting for investments in associates;
– Investment fair valued through profit or loss. Macquarie
has not elected to designate any equity positions as fair
value through OCI.
In addition to equity investment positions in the Banking
Book, Macquarie also has equity investments in trading
portfolios at fair value through profit or loss, which are
included in the Market Risk calculation.
13.1.1 Investments in Associates
Equity accounting is applied to investments in which
Macquarie has significant influence or joint control (joint
ventures). These equity investments are described as
Investments in Associates. Equity accounting is applied
such that Macquarie’s share of its investee’s post
acquisition profit or losses are recorded in Macquarie’s
income statement, and the share of its post-acquisition
movements in reserves in Macquarie’s Consolidated
Statement of Comprehensive Income. Dividends or
distributions from associates or joint ventures reduce the
carrying amount of the investment. Where there is an
indicator of impairment, the carrying amount of the
investment is tested for impairment by comparing its
recoverable amount with its carrying value. Impairment
losses are recognised as impairment charges as part of
other operating income and charges. A reversal of a
previously recognised impairment loss is recognised only to
the extent that the investment’s carrying value does not
exceed the carrying amount that would have been
determined (including consideration of any equity accounted
losses), if no impairment loss had been recognised.
13.1.2 Fair value Investments through profit or loss
Fair value reflects the price that would be received to sell an
asset or paid to transfer a liability in an orderly transaction
between market participants at the measurement date.
Quoted prices or rates are used to determine fair value
where an active market exists. If the market for a financial
instrument is not active, fair values are estimated using
present value or other valuation techniques, using inputs
based on market conditions prevailing at the
measurement date.
Gains and losses arising from subsequent changes in fair
value of equity investments are recognised in the Income
Statement within investment income under other operating
income and charges.
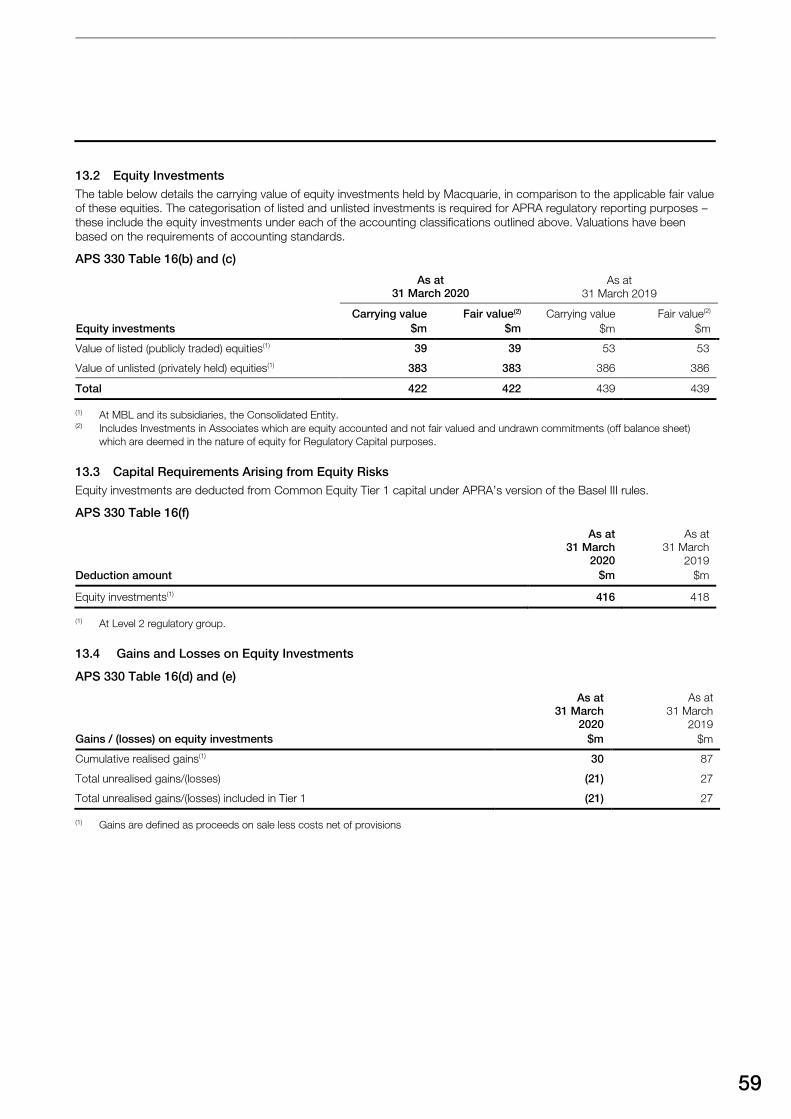
59
13.2 Equity Investments
The table below details the carrying value of equity investments held by Macquarie, in comparison to the applicable fair value
of these equities. The categorisation of listed and unlisted investments is required for APRA regulatory reporting purposes –
these include the equity investments under each of the accounting classifications outlined above. Valuations have been
based on the requirements of accounting standards.
APS 330 Table 16(b) and (c)
Equity investments
As at
31 March 2020
As at
31 March 2019
Carrying value
$m
Fair value(2)
$m
Carrying value
$m
Fair value(2)
$m
Value of listed (publicly traded) equities(1) 39 39 53 53
Value of unlisted (privately held) equities(1) 383 383 386 386
Total 422 422 439 439
(1) At MBL and its subsidiaries, the Consolidated Entity.(2) Includes Investments in Associates which are equity accounted and not fair valued and undrawn commitments (off balance sheet)
which are deemed in the nature of equity for Regulatory Capital purposes.
13.3 Capital Requirements Arising from Equity Risks
Equity investments are deducted from Common Equity Tier 1 capital under APRA’s version of the Basel III rules.
APS 330 Table 16(f)
Deduction amount
As at
31 March
2020
$m
As at
31 March
2019
$m
Equity investments(1) 416 418
(1) At Level 2 regulatory group.
13.4 Gains and Losses on Equity Investments
APS 330 Table 16(d) and (e)
Gains / (losses) on equity investments
As at
31 March
2020
$m
As at
31 March
2019
$m
Cumulative realised gains(1) 30 87
Total unrealised gains/(losses) (21) 27
Total unrealised gains/(losses) included in Tier 1 (21) 27
(1) Gains are defined as proceeds on sale less costs net of provisions
Macquarie Bank Limited Pillar 3 Disclosures March 2020 macquarie.com
14.0 Operational Risk
60
14.0 Operational Risk
Operational risk is inherent in Macquarie’s business.
Macquarie defines operational risk as the risk of loss
resulting from inadequate or failed internal processes,
controls or systems or from external events.
It also includes the failure or inadequate management of
other risk types.
14.1 Macquarie’s Operational Risk Management
Framework
Operational Risk Objectives
Macquarie’s Operational Risk Management Framework
(ORMF) is designed to identify, assess and manage
operational risks within the organisation. The key objectives
of the framework are:
– risk identification, analysis and acceptance.
– execution and monitoring of risk management
practices.
– reporting and escalation of risk information on a routine
and exception basis.
Operational Risk Management Process
Operating and Central Service Groups implement the ORMF
in a manner that is tailored to their specific operational risk
profile. However, to ensure consistency and minimum
standards the framework includes the following
mandatory elements:
– A robust change management process to ensure
operational risks in new activities or products are
identified, addressed and managed prior to
implementation
– An operational risk self-assessment process to identify
operational risks at the business level, evaluate controls
and develop action plans to address deficiencies
– Recording operational risk incidents in a centralised
reporting system. Incidents are analysed to identify
trends and establish lessons learnt on the effectiveness
of controls
– Allocation of operational risk capital to all Macquarie
businesses as a tool to further encourage positive
behaviour in Macquarie’s day-to-day management of
operational risk
– Macquarie-wide policies that require a consistent
approach and minimum standards on specific
operational risk matters
– Embedded operational risk representatives in Operating
Groups who act as delegates of the Operating Group
Head. These representatives are required to assess
whether operational risks are addressed appropriately
and that the ORMF is executed within their area.
Structure and Organisation of the Operational Risk
Function
Most Macquarie operational risk staff operate at the
business level. These Business Operational Risk Managers
(BORMs) are responsible for embedding operational risk
management within their business. They report directly to
the relevant business and have a dotted reporting line to the
Head of RMG Operational Risk.
RMG Operational Risk is a division of RMG and is managed
separately from other risk disciplines within RMG. RMG
Operational Risk is responsible for ensuring the ORMF
remains appropriate and that skilled resources are available
to support it. It is also responsible for Macquarie’s
operational risk capital measurement methodology.
RMG regularly reports on the operational risk profile and the
effectiveness of the Framework to the BRiC and to
senior management.
14.2 Operational Risk Capital Calculation
APRA approved Macquarie’s use of the AMA for assessing
operational risk capital in December 2007.
Macquarie holds operational risk capital to absorb potential
losses arising from operational risk exposures.
Macquarie’s operational risk capital framework has two
main elements:
– A bi-annual scenario approach for modelling
operational risk losses and to determine operational
risk capital
– a process for allocating capital to businesses based on
risk exposures.
Operational risk scenarios identify key risks that, while very
low in probability may, if they occurred, result in large
losses. When identifying the potential for such losses,
consideration is given to the individual statistical distribution
for each scenario, external loss data, internal loss data, risk
and control factors and the contribution of expert opinion
from Operating and Central Service Groups. Scenario
estimates are then modelled to determine the operational
risk component of regulatory capital required to be held by
Macquarie at the 99.9th percentile.
Over time, changes in operational risk capital reflect:
– new or significantly changed business activity or growth
– changes in the external environment such as new
regulations or movements in the economic cycle.
Mitigation of Operational Risk through Insurance
Macquarie does not currently use insurance in its AMA
model for the purpose of operational risk capital reduction.
Operational Risk – RWA
The operational risk RWA as at 31 March 2020 is $10,655
million (31 March 2019: $10,111 million).
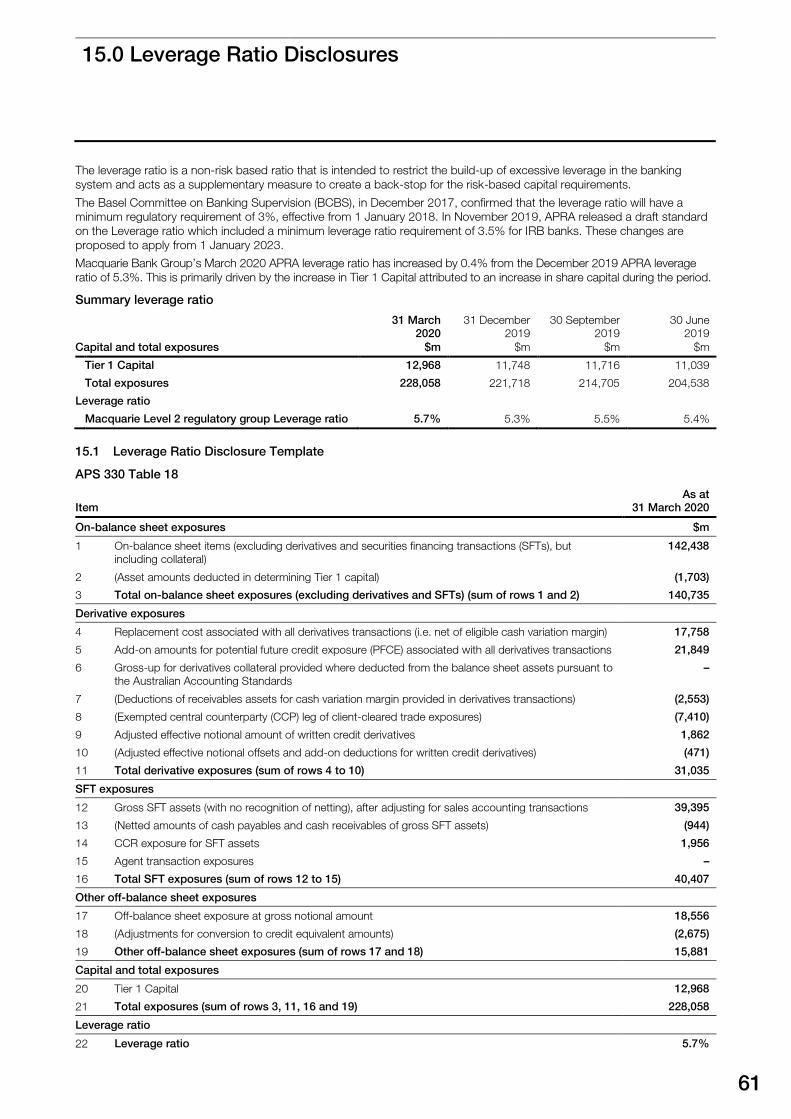
15.0 Leverage Ratio Disclosures
61
15.0 Leverage Ratio Disclosures
The leverage ratio is a non-risk based ratio that is intended to restrict the build-up of excessive leverage in the banking
system and acts as a supplementary measure to create a back-stop for the risk-based capital requirements.
The Basel Committee on Banking Supervision (BCBS), in December 2017, confirmed that the leverage ratio will have a
minimum regulatory requirement of 3%, effective from 1 January 2018. In November 2019, APRA released a draft standard
on the Leverage ratio which included a minimum leverage ratio requirement of 3.5% for IRB banks. These changes are
proposed to apply from 1 January 2023.
Macquarie Bank Group’s March 2020 APRA leverage ratio has increased by 0.4% from the December 2019 APRA leverage
ratio of 5.3%. This is primarily driven by the increase in Tier 1 Capital attributed to an increase in share capital during the period.
Summary leverage ratio
Capital and total exposures
31 March
2020
$m
31 December
2019
$m
30 September
2019
$m
30 June
2019
$m
Tier 1 Capital 12,968 11,748 11,716 11,039
Total exposures 228,058 221,718 214,705 204,538
Leverage ratio
Macquarie Level 2 regulatory group Leverage ratio 5.7% 5.3% 5.5% 5.4%
15.1 Leverage Ratio Disclosure Template
APS 330 Table 18
Item
As at
31 March 2020
On-balance sheet exposures $m
1 On-balance sheet items (excluding derivatives and securities financing transactions (SFTs), but
including collateral)
142,438
2 (Asset amounts deducted in determining Tier 1 capital) (1,703)
3 Total on-balance sheet exposures (excluding derivatives and SFTs) (sum of rows 1 and 2) 140,735
Derivative exposures
4 Replacement cost associated with all derivatives transactions (i.e. net of eligible cash variation margin) 17,758
5 Add-on amounts for potential future credit exposure (PFCE) associated with all derivatives transactions 21,849
6 Gross-up for derivatives collateral provided where deducted from the balance sheet assets pursuant to
the Australian Accounting Standards
–
7 (Deductions of receivables assets for cash variation margin provided in derivatives transactions) (2,553)
8 (Exempted central counterparty (CCP) leg of client-cleared trade exposures) (7,410)
9 Adjusted effective notional amount of written credit derivatives 1,862
10 (Adjusted effective notional offsets and add-on deductions for written credit derivatives) (471)
11 Total derivative exposures (sum of rows 4 to 10) 31,035
SFT exposures
12 Gross SFT assets (with no recognition of netting), after adjusting for sales accounting transactions 39,395
13 (Netted amounts of cash payables and cash receivables of gross SFT assets) (944)
14 CCR exposure for SFT assets 1,956
15 Agent transaction exposures –
16 Total SFT exposures (sum of rows 12 to 15) 40,407
Other off-balance sheet exposures
17 Off-balance sheet exposure at gross notional amount 18,556
18 (Adjustments for conversion to credit equivalent amounts) (2,675)
19 Other off-balance sheet exposures (sum of rows 17 and 18) 15,881
Capital and total exposures
20 Tier 1 Capital 12,968
21 Total exposures (sum of rows 3, 11, 16 and 19) 228,058
Leverage ratio
22 Leverage ratio 5.7%
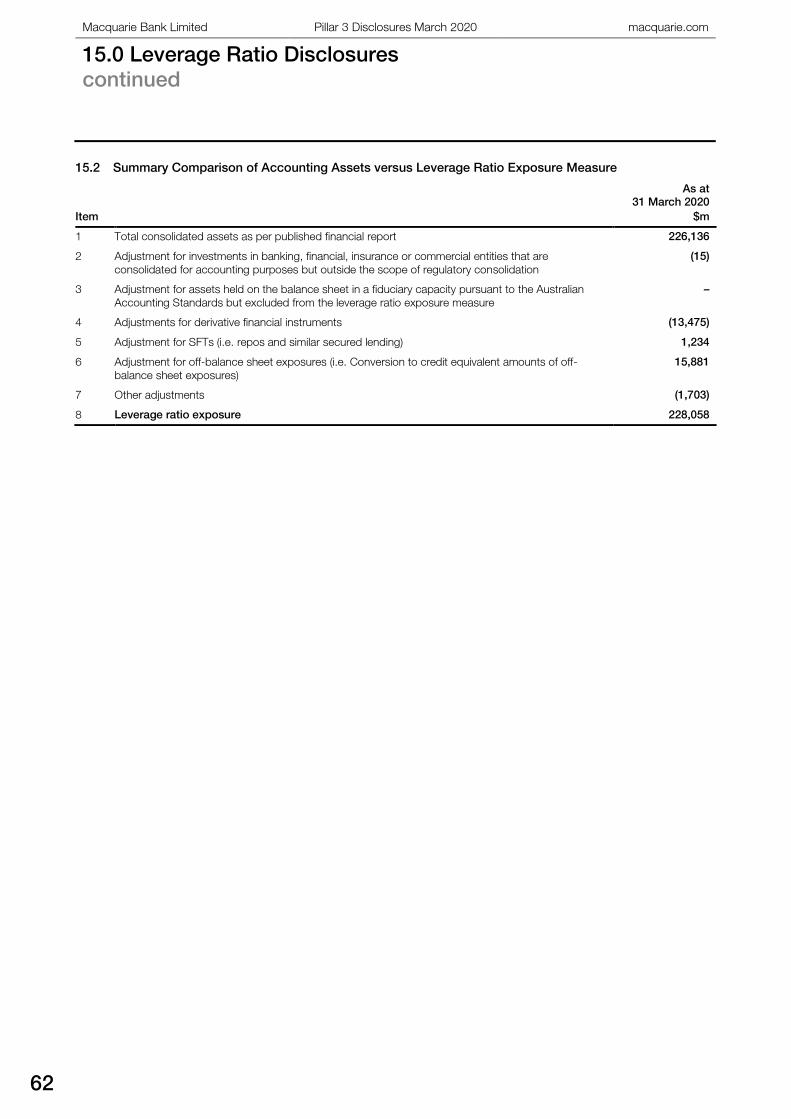
Macquarie Bank Limited Pillar 3 Disclosures March 2020 macquarie.com
15.0 Leverage Ratio Disclosures
continued
62
15.2 Summary Comparison of Accounting Assets versus Leverage Ratio Exposure Measure
Item
As at
31 March 2020
$m
1 Total consolidated assets as per published financial report 226,136
2 Adjustment for investments in banking, financial, insurance or commercial entities that are
consolidated for accounting purposes but outside the scope of regulatory consolidation
(15)
3 Adjustment for assets held on the balance sheet in a fiduciary capacity pursuant to the Australian
Accounting Standards but excluded from the leverage ratio exposure measure
–
4 Adjustments for derivative financial instruments (13,475)
5 Adjustment for SFTs (i.e. repos and similar secured lending) 1,234
6 Adjustment for off-balance sheet exposures (i.e. Conversion to credit equivalent amounts of off-
balance sheet exposures)
15,881
7 Other adjustments (1,703)
8 Leverage ratio exposure 228,058
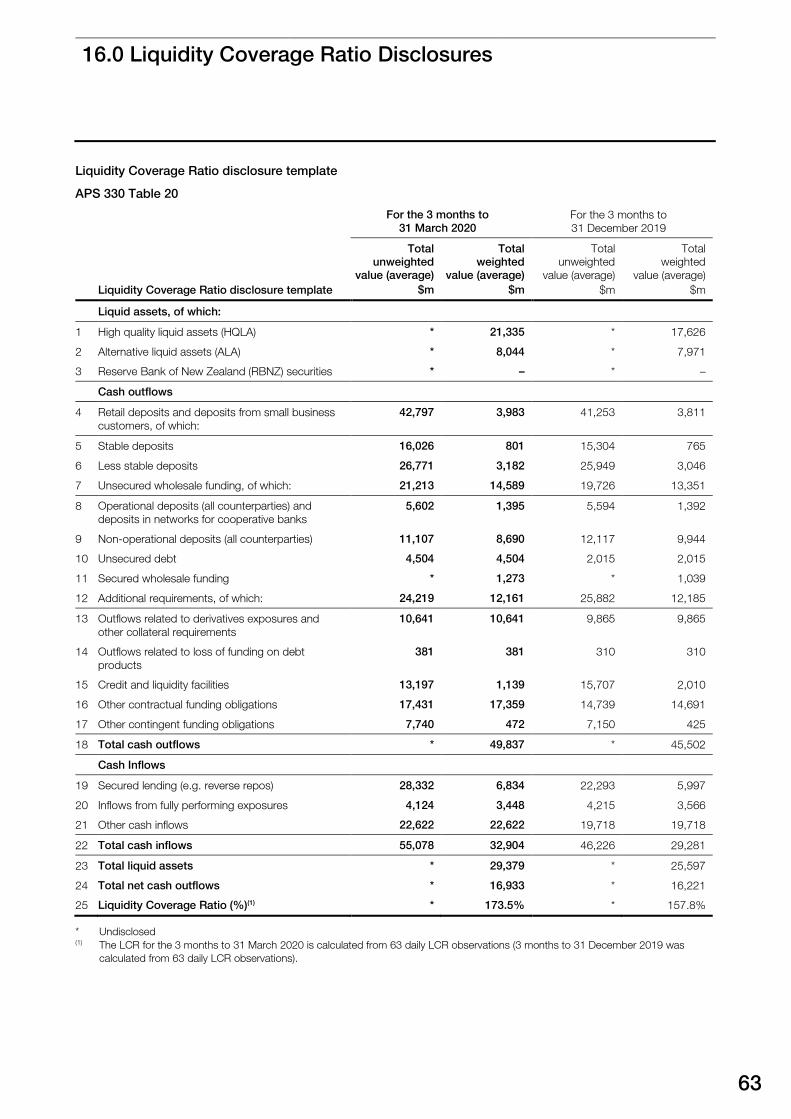
16.0 Liquidity Coverage Ratio Disclosures
63
16.0 Liquidity Coverage Ratio Disclosures
Liquidity Coverage Ratio disclosure template
APS 330 Table 20
For the 3 months to
31 March 2020
For the 3 months to
31 December 2019
Liquidity Coverage Ratio disclosure template
Total
unweighted
value (average)
$m
Total
weighted
value (average)
$m
Total
unweighted
value (average)
$m
Total
weighted
value (average)
$m
Liquid assets, of which:
1 High quality liquid assets (HQLA) * 21,335 * 17,626
2 Alternative liquid assets (ALA) * 8,044 * 7,971
3 Reserve Bank of New Zealand (RBNZ) securities * – * –
Cash outflows
4 Retail deposits and deposits from small business
customers, of which:
42,797 3,983 41,253 3,811
5 Stable deposits 16,026 801 15,304 765
6 Less stable deposits 26,771 3,182 25,949 3,046
7 Unsecured wholesale funding, of which: 21,213 14,589 19,726 13,351
8 Operational deposits (all counterparties) and
deposits in networks for cooperative banks
5,602 1,395 5,594 1,392
9 Non-operational deposits (all counterparties) 11,107 8,690 12,117 9,944
10 Unsecured debt 4,504 4,504 2,015 2,015
11 Secured wholesale funding * 1,273 * 1,039
12 Additional requirements, of which: 24,219 12,161 25,882 12,185
13 Outflows related to derivatives exposures and
other collateral requirements
10,641 10,641 9,865 9,865
14 Outflows related to loss of funding on debt
products
381 381 310 310
15 Credit and liquidity facilities 13,197 1,139 15,707 2,010
16 Other contractual funding obligations 17,431 17,359 14,739 14,691
17 Other contingent funding obligations 7,740 472 7,150 425
18 Total cash outflows * 49,837 * 45,502
Cash Inflows
19 Secured lending (e.g. reverse repos) 28,332 6,834 22,293 5,997
20 Inflows from fully performing exposures 4,124 3,448 4,215 3,566
21 Other cash inflows 22,622 22,622 19,718 19,718
22 Total cash inflows 55,078 32,904 46,226 29,281
23 Total liquid assets * 29,379 * 25,597
24 Total net cash outflows * 16,933 * 16,221
25 Liquidity Coverage Ratio (%)(1) * 173.5% * 157.8%
* Undisclosed(1) The LCR for the 3 months to 31 March 2020 is calculated from 63 daily LCR observations (3 months to 31 December 2019 was
calculated from 63 daily LCR observations).
Macquarie Bank Limited Pillar 3 Disclosures March 2020 macquarie.com
16.0 Liquidity Coverage Ratio Disclosures
continued
64
The Liquidity Coverage Ratio (LCR)
The LCR requires unencumbered liquid assets be held to
cover expected net cash outflows (NCOs) under a
regulatory-defined stress scenario lasting 30 calendar days.
Macquarie’s 3 month average LCR to 31 March 2020 was
173.5% (based on 63 daily observations). This was an
increase of 15.7% from the average for the 3 months to 31
December 2019, as a result of an increase in high quality
liquid assets (HQLA) partially offset by an increase in net
cash outflows.
Macquarie sets internal management and Board-approved
minimum limits for the LCR above the regulatory minimum
level and monitors its aggregate LCR position against these
limits on a daily basis. Macquarie also monitors the LCR
position on a standalone basis for major currencies in which
it operates, with the HQLA portfolio being denominated and
held in both Australian Dollars and a range of other
currencies to ensure Macquarie’s liquidity requirements are
broadly matched by currency.
Macquarie actively considers the impact of business
decisions on the LCR, as well as other internal liquidity
metrics that form part of the broader liquidity risk
management framework. Macquarie’s LCR fluctuates on a
daily basis as a result of normal business activities and,
accordingly, ongoing fluctuations in the reported LCR are
expected and are not necessarily indicative of a changing
risk appetite. Some examples of factors that can influence
the LCR include wholesale funding activities (such as
upcoming maturities and pre-funding expected future asset
growth), the degree of activity in Macquarie’s capital
markets facing businesses, the composition and nature of
liquid asset holdings, and a variety of other external market
considerations that could impact day-to-day collateral
requirements.
High Quality Liquid Assets (HQLA) and the Committed
Liquidity Facility (CLF)
In addition to cash and central bank deposits, Macquarie’s
liquid assets portfolio includes Australian Dollar
Commonwealth Government and semi-Government
securities, any CLF allocation as well as foreign currency
HQLA securities.
Macquarie’s CLF allocation for calendar year 2020 is
$8,500 million, which is reflected in the disclosure template
under ‘Alternative Liquid Assets (ALA)’. Note the disclosed
balance of $8,044 million reflects the required
‘open-repo’ of internal self-securitised RMBS with the RBA
(which increases cash balances in the Exchange Settlement
Account (ESA) with the RBA but is considered an ongoing
‘utilisation’ of the CLF). On 19 March 2020, the RBA announced that it was establishing a Term Funding Facility (TFF) that would offer authorised deposit taking institutions (ADIs) three year funding at a rate of 0.25% per annum in response to COVID-19. As at 31 March 2020, MBL (being an ADI) has an allowance of $1.9 billion. MBL has not included the TFF in its LCR or NSFR for the March quarter.
Net Cash Outflows (NCOs)
Net Cash Outflows (NCOs) in the LCR include contractual
and assumed cash outflows, offset by certain allowable
contractual cash inflows. Some of the key drivers of
Macquarie’s NCOs include:
Retail and SME deposits: assumed regulatory outflow relating to deposits from retail and SME customers that are at-call or potentially callable within 30 days. Note that any superannuation deposits received through a self-managed trust are required by APRA to be classified as ‘less stable’, even though the majority of these deposits are covered by the FCS.
Unsecured wholesale funding: includes remaining
deposits which are not received from retail or SME
customers along with unsecured debt balances
contractually maturing within 30 days.
Secured wholesale funding and lending: represent
inflows and outflows from secured lending and borrowing
activities contractually maturing within 30 days, such as
repurchase and reverse repurchase agreements.
Outflows relating to derivative exposures and other
collateral requirements: includes gross contractual cash
outflows relating to contractually maturing derivative
contracts (with gross inflows on maturing derivative
contracts profiled in ‘other cash inflows’). Further,
contingent liquidity outflows such as potential collateral
requirements from market movements, a 3-notch credit
ratings downgrade and withdrawal of excess collateral
placed with Macquarie are also included in this category.
Inflows from fully performing exposures: In Macquarie’s
LCR, a large component of this balance relates to excess
liquidity placed on an overnight or very short-term basis with
third parties (internally considered part of the cash and liquid
asset portfolio).
Other contractual funding obligations and other cash
inflows: includes other gross flows not profiled elsewhere in
the LCR. The volumes in these categories are large relative
to Macquarie’s total cash outflows and inflows, however
they include the following balances in particular:
Segregated client funds placed with Macquarie:
Macquarie acts as a clearing agent for clients on various
futures exchanges. Clients place margin with Macquarie and
Macquarie places this margin either directly with the
exchange, holds it in other segregated external asset
accounts or retains a portion on deposit with Macquarie.
Although these funds are segregated from Macquarie, some
of the balances are recorded on a gross basis on
Macquarie’s balance sheet and APRA require these to be
profiled as gross inflows and outflows in the LCR.
Security and broker settlement balances: these represent
securities that have been purchased or sold by Macquarie
that have not yet settled and broker balances where stock
has been bought or sold on behalf of clients but payment
has not been made to / received from the client. APRA
require these balances to be reflected on a gross basis in
the LCR as 100% weighted inflows and outflows. The net
effect of these balances on Macquarie’s average LCR is
negligible.
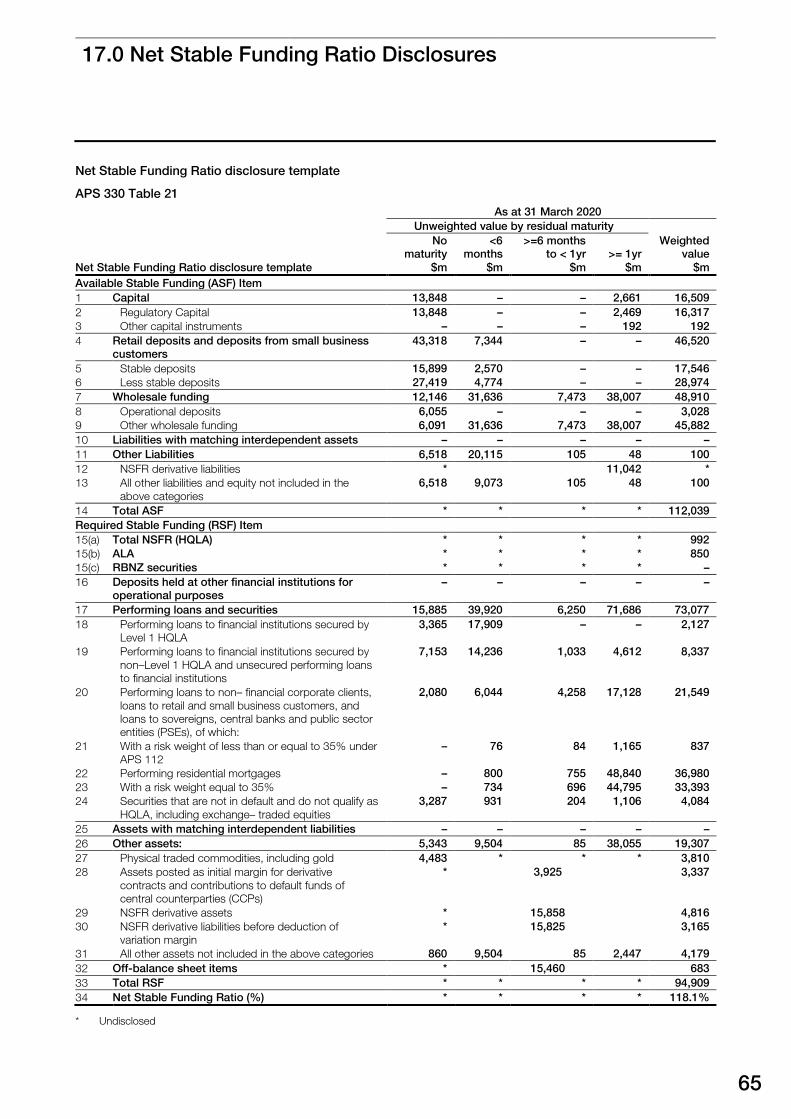
17.0 Net Stable Funding Ratio Disclosures
65
17.0 Net Stable Funding Ratio Disclosures
Net Stable Funding Ratio disclosure template
APS 330 Table 21
As at 31 March 2020
Unweighted value by residual maturity
Net Stable Funding Ratio disclosure template
No
maturity
$m
<6
months
$m
>=6 months
to < 1yr
$m
>= 1yr
$m
Weighted
value
$m
Available Stable Funding (ASF) Item
1 Capital 13,848 – – 2,661 16,509
2 Regulatory Capital 13,848 – – 2,469 16,317
3 Other capital instruments – – – 192 192
4 Retail deposits and deposits from small business
customers
43,318 7,344 – – 46,520
5 Stable deposits 15,899 2,570 – – 17,546
6 Less stable deposits 27,419 4,774 – – 28,974
7 Wholesale funding 12,146 31,636 7,473 38,007 48,910
8 Operational deposits 6,055 – – – 3,028
9 Other wholesale funding 6,091 31,636 7,473 38,007 45,882
10 Liabilities with matching interdependent assets – – – – –
11 Other Liabilities 6,518 20,115 105 48 100
12 NSFR derivative liabilities * 11,042 *
13 All other liabilities and equity not included in the
above categories
6,518 9,073 105 48 100
14 Total ASF * * * * 112,039
Required Stable Funding (RSF) Item
15(a) Total NSFR (HQLA) * * * * 992
15(b) ALA * * * * 850
15(c) RBNZ securities * * * * –
16 Deposits held at other financial institutions for
operational purposes
– – – – –
17 Performing loans and securities 15,885 39,920 6,250 71,686 73,077
18 Performing loans to financial institutions secured by
Level 1 HQLA
3,365 17,909 – – 2,127
19 Performing loans to financial institutions secured by
non–Level 1 HQLA and unsecured performing loans
to financial institutions
7,153 14,236 1,033 4,612 8,337
20 Performing loans to non– financial corporate clients,
loans to retail and small business customers, and
loans to sovereigns, central banks and public sector
entities (PSEs), of which:
2,080 6,044 4,258 17,128 21,549
21 With a risk weight of less than or equal to 35% under
APS 112
– 76 84 1,165 837
22 Performing residential mortgages – 800 755 48,840 36,980
23 With a risk weight equal to 35% – 734 696 44,795 33,393
24 Securities that are not in default and do not qualify as
HQLA, including exchange– traded equities
3,287 931 204 1,106 4,084
25 Assets with matching interdependent liabilities – – – – –
26 Other assets: 5,343 9,504 85 38,055 19,307
27 Physical traded commodities, including gold 4,483 * * * 3,810
28 Assets posted as initial margin for derivative
contracts and contributions to default funds of
central counterparties (CCPs)
* 3,925 3,337
29 NSFR derivative assets * 15,858 4,816
30 NSFR derivative liabilities before deduction of
variation margin
* 15,825 3,165
31 All other assets not included in the above categories 860 9,504 85 2,447 4,179
32 Off-balance sheet items * 15,460 683
33 Total RSF * * * * 94,909
34 Net Stable Funding Ratio (%) * * * * 118.1%
* Undisclosed
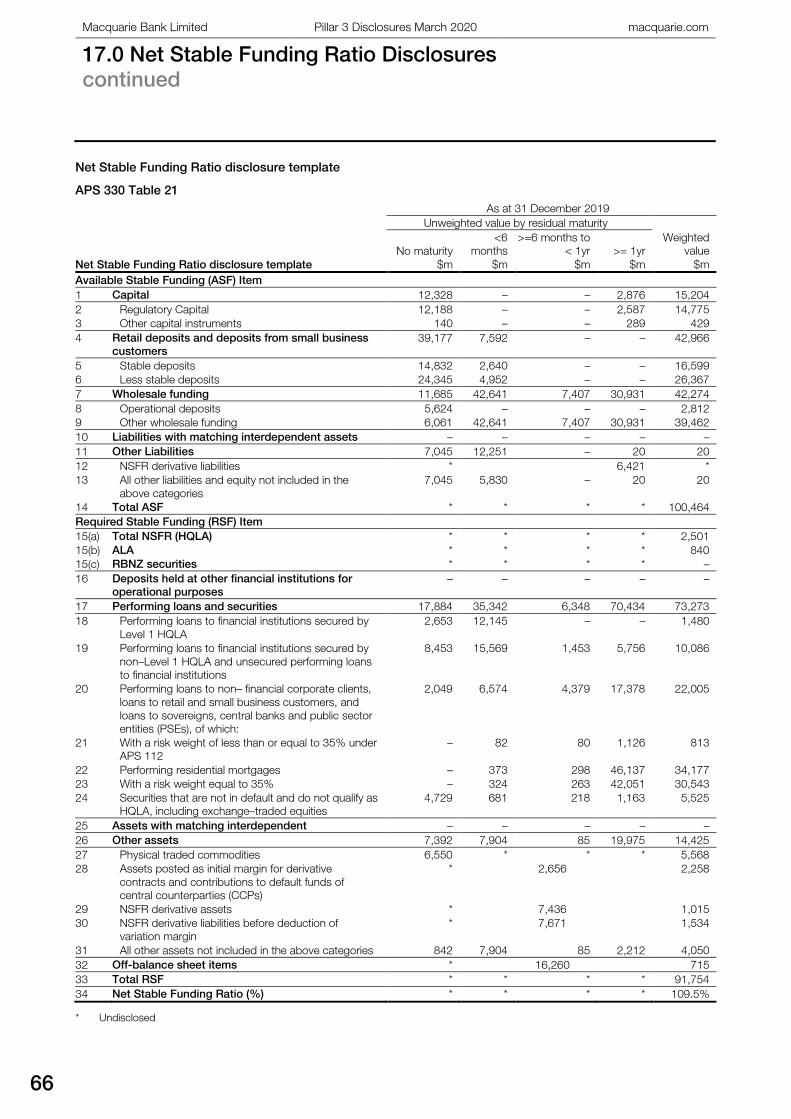
Macquarie Bank Limited Pillar 3 Disclosures March 2020 macquarie.com
17.0 Net Stable Funding Ratio Disclosures
continued
66
Net Stable Funding Ratio disclosure template
APS 330 Table 21
As at 31 December 2019
Unweighted value by residual maturity
Net Stable Funding Ratio disclosure template
No maturity
$m
<6
months
$m
>=6 months to
< 1yr
$m
>= 1yr
$m
Weighted
value
$m
Available Stable Funding (ASF) Item
1 Capital 12,328 – – 2,876 15,204
2 Regulatory Capital 12,188 – – 2,587 14,775
3 Other capital instruments 140 – – 289 429
4 Retail deposits and deposits from small business
customers
39,177 7,592 – – 42,966
5 Stable deposits 14,832 2,640 – – 16,599
6 Less stable deposits 24,345 4,952 – – 26,367
7 Wholesale funding 11,685 42,641 7,407 30,931 42,274
8 Operational deposits 5,624 – – – 2,812
9 Other wholesale funding 6,061 42,641 7,407 30,931 39,462
10 Liabilities with matching interdependent assets – – – – –
11 Other Liabilities 7,045 12,251 – 20 20
12 NSFR derivative liabilities * 6,421 *
13 All other liabilities and equity not included in the
above categories
7,045 5,830 – 20 20
14 Total ASF * * * * 100,464
Required Stable Funding (RSF) Item
15(a) Total NSFR (HQLA) * * * * 2,501
15(b) ALA * * * * 840
15(c) RBNZ securities * * * * –
16 Deposits held at other financial institutions for
operational purposes
– – – – –
17 Performing loans and securities 17,884 35,342 6,348 70,434 73,273
18 Performing loans to financial institutions secured by
Level 1 HQLA
2,653 12,145 – – 1,480
19 Performing loans to financial institutions secured by
non–Level 1 HQLA and unsecured performing loans
to financial institutions
8,453 15,569 1,453 5,756 10,086
20 Performing loans to non– financial corporate clients,
loans to retail and small business customers, and
loans to sovereigns, central banks and public sector
entities (PSEs), of which:
2,049 6,574 4,379 17,378 22,005
21 With a risk weight of less than or equal to 35% under
APS 112
– 82 80 1,126 813
22 Performing residential mortgages – 373 298 46,137 34,177
23 With a risk weight equal to 35% – 324 263 42,051 30,543
24 Securities that are not in default and do not qualify as
HQLA, including exchange–traded equities
4,729 681 218 1,163 5,525
25 Assets with matching interdependent – – – – –
26 Other assets 7,392 7,904 85 19,975 14,425
27 Physical traded commodities 6,550 * * * 5,568
28 Assets posted as initial margin for derivative
contracts and contributions to default funds of
central counterparties (CCPs)
* 2,656 2,258
29 NSFR derivative assets * 7,436 1,015
30 NSFR derivative liabilities before deduction of
variation margin
* 7,671 1,534
31 All other assets not included in the above categories 842 7,904 85 2,212 4,050
32 Off-balance sheet items * 16,260 715
33 Total RSF * * * * 91,754
34 Net Stable Funding Ratio (%) * * * * 109.5%
* Undisclosed
67
The Net Stable Funding Ratio (NSFR)
The NSFR is a twelve month structural funding metric,
requiring that ‘available stable funding’ (ASF) be sufficient to
cover ‘required stable funding’ (RSF), where ‘stable’ funding
has an actual or assumed maturity of greater than twelve
months. Macquarie’s NSFR on 31 March 2020 and 31
December 2019 was 118.1% and 109.5% respectively. The
NSFR increased over the quarter as a result of an increase
in ASF which was only partially offset by an increase in RSF
over the quarter.
The NSFR seeks to encourage ADIs to fund their activities
with more stable sources of funding on an ongoing basis,
and thereby promote greater balance sheet resilience. It
also aims to reduce an ADI’s reliance on less stable sources
of funding. These requirements are in line with Macquarie’s
Board-approved Liquidity Policy and Risk Tolerance.
Macquarie sets internal management and Board-approved
minimum limits for the NSFR above the regulatory minimum
level and monitors its aggregate NSFR position against
these limits on a daily basis.
Whilst the NSFR and LCR are regulatory minima, Macquarie
also models additional internal liquidity scenarios covering
both market-wide and Macquarie name-specific crises.
Macquarie actively considers the impact of business
decisions on the NSFR and LCR, as well as other internal
liquidity metrics that form part of its broader liquidity risk
management framework.
Macquarie’s NSFR fluctuates as a result of normal business
activities and, accordingly, ongoing fluctuations in the
reported NSFR are expected and are not necessarily
indicative of a changing risk appetite. Some examples of
factors that can influence the NSFR include wholesale
funding activities (such as pre-funding expected future asset
growth), growth in home loans and customer deposits,
equity and hybrids issuance, the degree of activity in
Macquarie’s capital markets facing businesses, and a
variety of other external market considerations.
Calculation of the Net Stable Funding Ratio
Under the regulatory rules, Available Stable Funding factors
are applied to Macquarie’s capital and liabilities; while
Required Stable Funding factors are applied to assets and
off-balance sheet exposures. This calculation is shown in
table 21 on pages 65 and 66, and is based on spot
balances.
Macquarie Bank Limited Pillar 3 Disclosures March 2020 macquarie.com
Disclaimer
68
Disclaimer
– The material in this document has been prepared by
Macquarie Bank Limited ABN 46 008 583 542 (MBL)
purely for the purpose of explaining the basis on which
MBL has prepared and disclosed certain capital
requirements and information about the management
of risks relating to those requirements and for no other
purpose. Information in this document should not be
considered as advice or a recommendation to investors
or potential investors in relation to holding, purchasing
or selling securities or other financial products or
instruments and does not take into account your
particular investment objectives, financial situation or
needs. Before acting on any information you should
consider the appropriateness of information having
regard to the matters, any relevant offer document and
in particular, you should seek independent financial
advice. No representation or warranty is made as to the
accuracy, completeness or reliability of the information.
All securities and financial product or instrument
transactions involve risks, which include (among others)
the risk of adverse or unanticipated market, financial or
political developments and, in international transactions,
currency risk.
– This document may contain forward looking statements
that is, statements related to future, not past, events or
other matters – including, without limitation, statements
regarding our intent, belief or current expectations with
respect to MBL’s businesses and operations, market
conditions, results of operation and financial condition,
capital adequacy, provisions for impairments and risk
management practices. Readers are cautioned not to
place undue reliance on these forward looking
statements. Macquarie does not undertake any
obligation to publicly release the result of any revisions
to these forward looking statements or to otherwise
update any forward looking statements, whether as a
result of new information, future events or otherwise,
after the date of this document. Actual results may vary
in a materially positive or negative manner. Forward
looking statements and hypothetical examples are
subject to uncertainty and contingencies outside MBL’s
control. Past performance is not a reliable indication of
future performance.
Unless otherwise specified all information is at
31 March 2020.
– Although Pillar 3 disclosures are intended to provide
transparent disclosures on a common basis the
information contained in this document may not be
directly comparable with other banks. This may be due
to a number of factors such as:
– The mix of business exposures between banks
– Pillar 2 capital requirements are excluded from this
disclosure but play a major role in determining both
the total capital requirements of the bank and any
surplus capital available.
– Difference in implementation of Basel III framework
i.e. APRA has introduced stricter requirements
(APRA superequivalence).
Appendix 1 Regulatory Capital Reconciliation
69
Appendix 1 Regulatory Capital Reconciliation
1.1 Common Disclosures Template
The capital disclosures detailed in the template below represents Basel III common disclosure requirements. These tables
should be read in conjunction with section 1.2 Regulatory Balance sheet and section 1.3 Reconciliation between common
disclosures template and the Regulatory Balance Sheet.
Common Equity Tier 1 capital: instruments and reserves $m
As at
31 March 2020
$m
Table
Reference
1 Directly issued qualifying ordinary shares (and equivalent for mutually-owned entities) capital 8,508 Table f
2 Retained earnings 4,350
3 Accumulated other comprehensive income (and other reserves) 990
4 Directly issued capital subject to phase out from CET1 (only applicable to mutually-owned
companies)
–
5 Ordinary share capital issued by subsidiaries and held by third parties (amount allowed in
group CET1)
–
6 Common Equity Tier 1 capital before regulatory adjustments 13,848
Common Equity Tier 1 capital : regulatory adjustments
7 Prudential valuation adjustments –
8 Goodwill (net of related tax liability) 47 Table b
9 Other intangibles other than mortgage servicing rights (net of related tax liability) 138 Table b
10 Deferred tax assets that rely on future profitability excluding those arising from temporary
differences (net of related tax liability)
69 Table a
11 Cash-flow hedge reserve (157)
12 Shortfall of provisions to expected losses 278
13 Securitisation gain on sale (as set out in paragraph 562 of Basel II framework) –
14 Gains and losses due to changes in own credit risk on fair valued liabilities 145
15 Defined benefit superannuation fund net assets –
16 Investments in own shares (if not already netted off paid-in capital on reported balance
sheet)
–
17 Reciprocal cross-holdings in common equity –
18 Investments in the capital of banking, financial and insurance entities that are outside the
scope of regulatory consolidation, net of eligible short positions, where the ADI does not
own more than 10% of the issued share capital (amount above 10% threshold)
– Table c
19 Significant investments in the ordinary shares of banking, financial and insurance entities
that are outside the scope of regulatory consolidation, net of eligible short positions (amount
above 10% threshold)
– Table c
20 Mortgage service rights (amount above 10% threshold) –
21 Deferred tax assets arising from temporary differences (amount above 10% threshold, net
of related tax liability)
– Table a
22 Amount exceeding the 15% threshold –
23 of which: significant investments in the ordinary shares of financial entities – Table c
24 of which: mortgage servicing rights –
25 of which: deferred tax assets arising from temporary differences – Table a
APRA Specific Regulatory Adjustments –
26 National specific regulatory adjustments (sum of rows 26a, 26b, 26c, 26d, 26e, 26f, 26g,
26h, 26i and 26j)
1,675
26a of which: treasury shares –
26b of which: offset to dividends declared under a dividend reinvestment plan (DRP), to the
extent that the dividends are used to purchase new ordinary shares issued by the ADI
–
26c of which: deferred fee income –
26d of which: equity investments in financial institutions not reported in rows 18, 19 and 23 333 Table c
26e of which: deferred tax assets not reported in rows 10, 21 and 25 420 Table a
26f of which: capitalised expenses 489
26g of which: investments in commercial (non-financial) entities that are deducted under APRA
prudential requirements
255 Table c
26h of which: covered bonds in excess of asset cover in pools –
Macquarie Bank Limited Pillar 3 Disclosures March 2020 macquarie.com
Appendix 1 Regulatory Capital Reconciliation
continued
70
Common Equity Tier 1 capital: instruments and reserves $m
As at
31 March 2020
$m
Table
Reference
26i of which: undercapitalisation of a non-consolidated subsidiary –
26j of which: other national specific regulatory adjustments not reported in rows 26a to 26i 1 178
27 Regulatory adjustments applied to Common Equity Tier 1 due to insufficient Additional
Tier 1 and Tier 2 to cover deductions
–
28 Total regulatory adjustments to Common Equity Tier 1 2,195
29 Common Equity Tier 1 Capital (CET1) 11,653
Additional Tier 1 Capital: instruments –
30 Directly issued qualifying Additional Tier 1 instruments 1,222
31 of which: classified as equity under applicable accounting standards –
32 of which: classified as liabilities under applicable accounting standards 1,222
33 Directly issued capital instruments subject to phase out from Additional Tier 1 93
34 Additional Tier 1 instruments (and CET1 instruments not included in row 5) issued by
subsidiaries and held by third parties (amount allowed in group ATI)
–
35 of which: instruments issued by subsidiaries subject to phase out –
36 Additional Tier 1 Capital before regulatory adjustments 1,315 Table d
Additional Tier 1 Capital: Regulatory adjustments –
37 Investments in own Additional Tier 1 instruments –
38 Reciprocal cross-holdings in Additional Tier 1 instruments –
39 Investments in the capital of banking, financial and insurance entities that are outside the
scope of regulatory consolidation, net of eligible short positions, where the ADI does not
own more than 10% of the issued share capital (amount above 10% threshold)
–
40 Significant investments in the capital of banking, financial and insurance entities that are
outside the scope of regulatory consolidation (net of eligible short positions)
–
41 National specific regulatory adjustments (sum of rows 41a, 41b and 41c) –
41a of which: holdings of capital instruments in group members by other group members on
behalf of third parties
–
41b of which: investments in the capital of financial institutions that are outside the scope of
regulatory consolidations not reported in rows 39 and 40
–
41c of which: other national specific regulatory adjustments not reported in rows 41a and 41b –
42 Regulatory adjustments applied to Additional Tier 1 due to insufficient Tier 2 to
cover deductions
–
43 Total regulatory adjustments to Additional Tier 1 capital –
44 Additional Tier 1 capital (AT1) 1,315
45 Tier 1 Capital (T1=CET1+AT1) 12,968
Tier 2 Capital: instruments and provisions
46 Directly issued qualifying Tier 2 instruments 1,222 Table e
47 Directly issued capital instruments subject to phase out from Tier 2 345 Table e
48 Tier 2 instruments (and CET1 and AT1 instruments not included in rows 5 or 34) issued by
subsidiaries and held by third parties (amount allowed in group T2)
–
49 of which: instruments issued by subsidiaries subject to phase out –
50 Provisions 25
51 Tier 2 Capital before regulatory adjustments 1,592
Tier 2 Capital: regulatory adjustments
52 Investments in own Tier 2 instruments –
53 Reciprocal cross-holdings in Tier 2 instruments –
54 Investments in the Tier 2 capital of banking, financial and insurance entities that are outside
the scope of regulatory consolidation, net of eligible short positions, where the ADI does not
own more than 10% of the issued share capital (amount above 10% threshold)
–
55 Significant investments in the Tier 2 capital of banking, financial and insurance entities that
are outside the scope of regulatory consolidation, net of eligible short positions
–
(1) Includes $139m also applicable for Basel III regulatory adjustments.
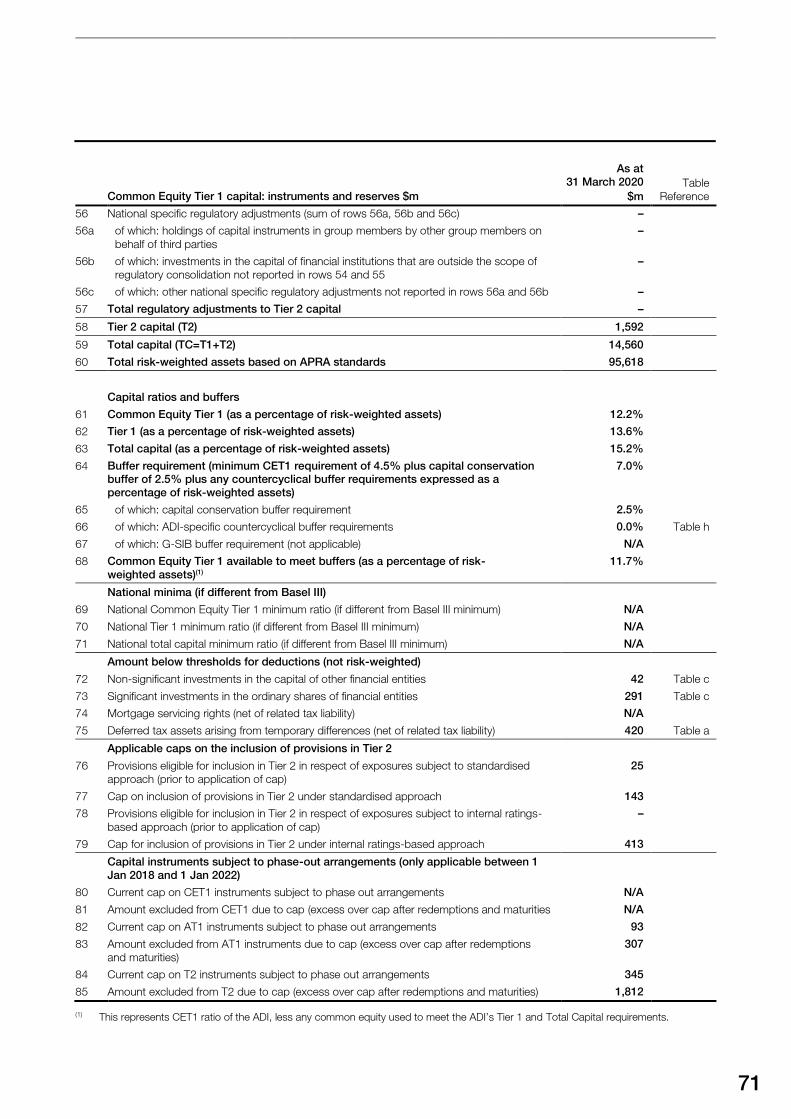
71
Common Equity Tier 1 capital: instruments and reserves $m
As at
31 March 2020
$m
Table
Reference
56 National specific regulatory adjustments (sum of rows 56a, 56b and 56c) –
56a of which: holdings of capital instruments in group members by other group members on
behalf of third parties
–
56b of which: investments in the capital of financial institutions that are outside the scope of
regulatory consolidation not reported in rows 54 and 55
–
56c of which: other national specific regulatory adjustments not reported in rows 56a and 56b –
57 Total regulatory adjustments to Tier 2 capital –
58 Tier 2 capital (T2) 1,592
59 Total capital (TC=T1+T2) 14,560
60 Total risk-weighted assets based on APRA standards 95,618
Capital ratios and buffers
61 Common Equity Tier 1 (as a percentage of risk-weighted assets) 12.2%
62 Tier 1 (as a percentage of risk-weighted assets) 13.6%
63 Total capital (as a percentage of risk-weighted assets) 15.2%
64 Buffer requirement (minimum CET1 requirement of 4.5% plus capital conservation
buffer of 2.5% plus any countercyclical buffer requirements expressed as a
percentage of risk-weighted assets)
7.0%
65 of which: capital conservation buffer requirement 2.5%
66 of which: ADI-specific countercyclical buffer requirements 0.0% Table h
67 of which: G-SIB buffer requirement (not applicable) N/A
68 Common Equity Tier 1 available to meet buffers (as a percentage of risk-
weighted assets)(1)
11.7%
National minima (if different from Basel III)
69 National Common Equity Tier 1 minimum ratio (if different from Basel III minimum) N/A
70 National Tier 1 minimum ratio (if different from Basel III minimum) N/A
71 National total capital minimum ratio (if different from Basel III minimum) N/A
Amount below thresholds for deductions (not risk-weighted)
72 Non-significant investments in the capital of other financial entities 42 Table c
73 Significant investments in the ordinary shares of financial entities 291 Table c
74 Mortgage servicing rights (net of related tax liability) N/A
75 Deferred tax assets arising from temporary differences (net of related tax liability) 420 Table a
Applicable caps on the inclusion of provisions in Tier 2
76 Provisions eligible for inclusion in Tier 2 in respect of exposures subject to standardised
approach (prior to application of cap)
25
77 Cap on inclusion of provisions in Tier 2 under standardised approach 143
78 Provisions eligible for inclusion in Tier 2 in respect of exposures subject to internal ratings-
based approach (prior to application of cap)
–
79 Cap for inclusion of provisions in Tier 2 under internal ratings-based approach 413
Capital instruments subject to phase-out arrangements (only applicable between 1
Jan 2018 and 1 Jan 2022)
80 Current cap on CET1 instruments subject to phase out arrangements N/A
81 Amount excluded from CET1 due to cap (excess over cap after redemptions and maturities N/A
82 Current cap on AT1 instruments subject to phase out arrangements 93
83 Amount excluded from AT1 instruments due to cap (excess over cap after redemptions
and maturities)
307
84 Current cap on T2 instruments subject to phase out arrangements 345
85 Amount excluded from T2 due to cap (excess over cap after redemptions and maturities) 1,812
(1) This represents CET1 ratio of the ADI, less any common equity used to meet the ADI’s Tier 1 and Total Capital requirements.
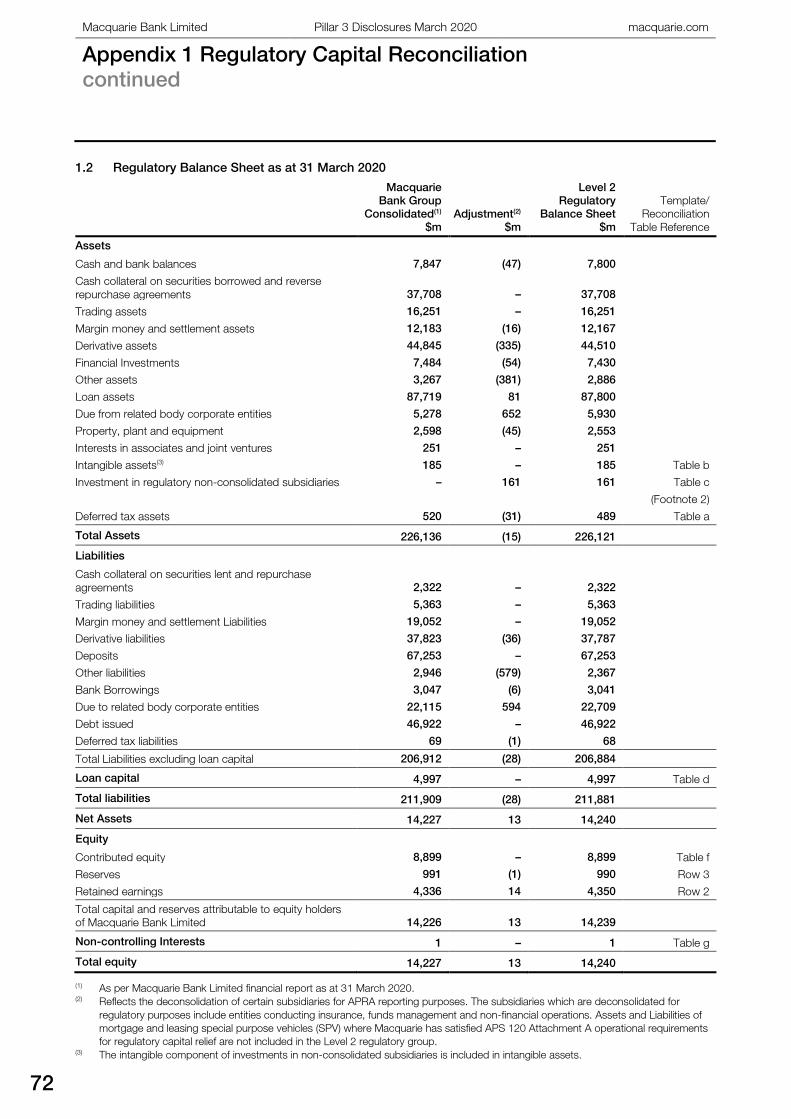
Macquarie Bank Limited Pillar 3 Disclosures March 2020 macquarie.com
Appendix 1 Regulatory Capital Reconciliation
continued
72
1.2 Regulatory Balance Sheet as at 31 March 2020
Macquarie
Bank Group
Consolidated(1)
$m
Adjustment(2)
$m
Level 2
Regulatory
Balance Sheet
$m
Template/
Reconciliation
Table Reference
Assets
Cash and bank balances 7,847 (47) 7,800
Cash collateral on securities borrowed and reverse
repurchase agreements 37,708 – 37,708
Trading assets 16,251 – 16,251
Margin money and settlement assets 12,183 (16) 12,167
Derivative assets 44,845 (335) 44,510
Financial Investments 7,484 (54) 7,430
Other assets 3,267 (381) 2,886
Loan assets 87,719 81 87,800
Due from related body corporate entities 5,278 652 5,930
Property, plant and equipment 2,598 (45) 2,553
Interests in associates and joint ventures 251 – 251
Intangible assets(3) 185 – 185 Table b
Investment in regulatory non-consolidated subsidiaries – 161 161 Table c
(Footnote 2)
Deferred tax assets 520 (31) 489 Table a
Total Assets 226,136 (15) 226,121
Liabilities
Cash collateral on securities lent and repurchase
agreements 2,322 – 2,322
Trading liabilities 5,363 – 5,363
Margin money and settlement Liabilities 19,052 – 19,052
Derivative liabilities 37,823 (36) 37,787
Deposits 67,253 – 67,253
Other liabilities 2,946 (579) 2,367
Bank Borrowings 3,047 (6) 3,041
Due to related body corporate entities 22,115 594 22,709
Debt issued 46,922 – 46,922
Deferred tax liabilities 69 (1) 68
Total Liabilities excluding loan capital 206,912 (28) 206,884
Loan capital 4,997 – 4,997 Table d
Total liabilities 211,909 (28) 211,881
Net Assets 14,227 13 14,240
Equity
Contributed equity 8,899 – 8,899 Table f
Reserves 991 (1) 990 Row 3
Retained earnings 4,336 14 4,350 Row 2
Total capital and reserves attributable to equity holders
of Macquarie Bank Limited 14,226 13 14,239
Non-controlling Interests 1 – 1 Table g
Total equity 14,227 13 14,240
(1) As per Macquarie Bank Limited financial report as at 31 March 2020.(2) Reflects the deconsolidation of certain subsidiaries for APRA reporting purposes. The subsidiaries which are deconsolidated for
regulatory purposes include entities conducting insurance, funds management and non-financial operations. Assets and Liabilities of
mortgage and leasing special purpose vehicles (SPV) where Macquarie has satisfied APS 120 Attachment A operational requirements
for regulatory capital relief are not included in the Level 2 regulatory group.(3) The intangible component of investments in non-consolidated subsidiaries is included in intangible assets.
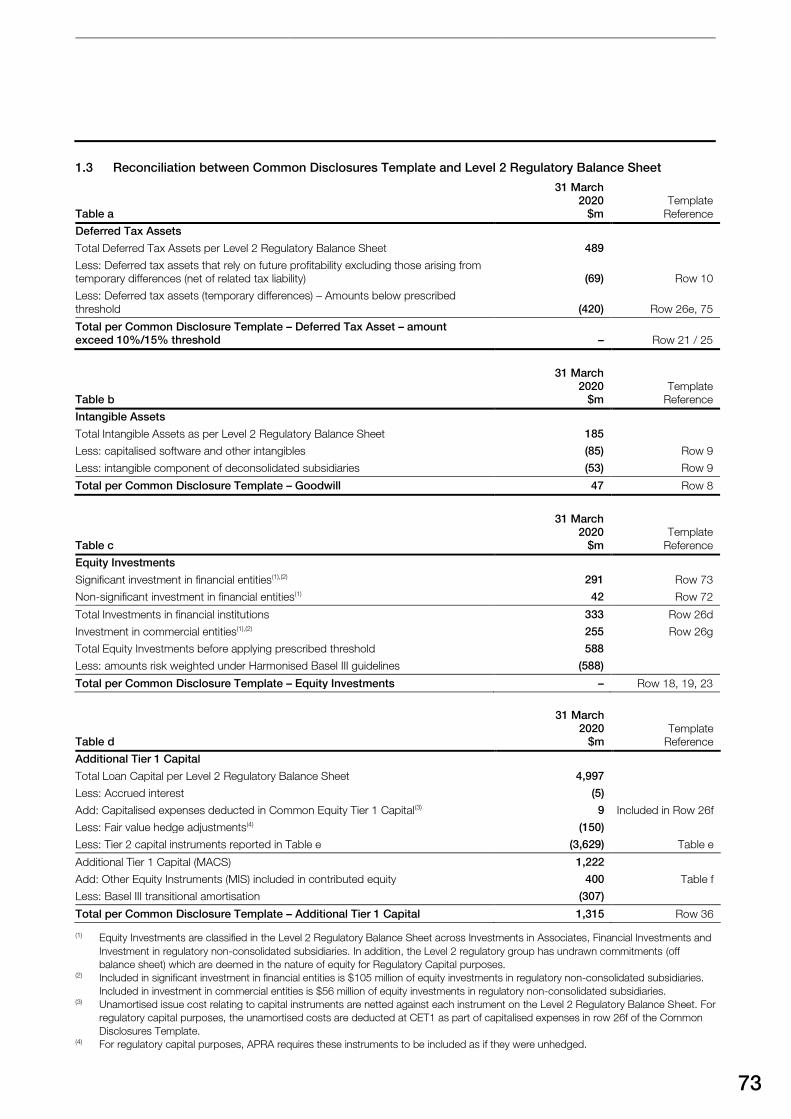
73
1.3 Reconciliation between Common Disclosures Template and Level 2 Regulatory Balance Sheet
Table a
31 March
2020
$m
Template
Reference
Deferred Tax Assets
Total Deferred Tax Assets per Level 2 Regulatory Balance Sheet 489
Less: Deferred tax assets that rely on future profitability excluding those arising from
temporary differences (net of related tax liability) (69) Row 10
Less: Deferred tax assets (temporary differences) – Amounts below prescribed
threshold (420) Row 26e, 75
Total per Common Disclosure Template – Deferred Tax Asset – amount
exceed 10%/15% threshold – Row 21 / 25
Table b
31 March
2020
$m
Template
Reference
Intangible Assets
Total Intangible Assets as per Level 2 Regulatory Balance Sheet 185
Less: capitalised software and other intangibles (85) Row 9
Less: intangible component of deconsolidated subsidiaries (53) Row 9
Total per Common Disclosure Template – Goodwill 47 Row 8
Table c
31 March
2020
$m
Template
Reference
Equity Investments
Significant investment in financial entities(1),(2) 291 Row 73
Non-significant investment in financial entities(1) 42 Row 72
Total Investments in financial institutions 333 Row 26d
Investment in commercial entities(1),(2) 255 Row 26g
Total Equity Investments before applying prescribed threshold 588
Less: amounts risk weighted under Harmonised Basel III guidelines (588)
Total per Common Disclosure Template – Equity Investments – Row 18, 19, 23
Table d
31 March
2020
$m
Template
Reference
Additional Tier 1 Capital
Total Loan Capital per Level 2 Regulatory Balance Sheet 4,997
Less: Accrued interest (5)
Add: Capitalised expenses deducted in Common Equity Tier 1 Capital(3) 9 Included in Row 26f
Less: Fair value hedge adjustments(4) (150)
Less: Tier 2 capital instruments reported in Table e (3,629) Table e
Additional Tier 1 Capital (MACS) 1,222
Add: Other Equity Instruments (MIS) included in contributed equity 400 Table f
Less: Basel III transitional amortisation (307)
Total per Common Disclosure Template – Additional Tier 1 Capital 1,315 Row 36
(1) Equity Investments are classified in the Level 2 Regulatory Balance Sheet across Investments in Associates, Financial Investments and
Investment in regulatory non-consolidated subsidiaries. In addition, the Level 2 regulatory group has undrawn commitments (off
balance sheet) which are deemed in the nature of equity for Regulatory Capital purposes. (2) Included in significant investment in financial entities is $105 million of equity investments in regulatory non-consolidated subsidiaries.
Included in investment in commercial entities is $56 million of equity investments in regulatory non-consolidated subsidiaries. (3) Unamortised issue cost relating to capital instruments are netted against each instrument on the Level 2 Regulatory Balance Sheet. For
regulatory capital purposes, the unamortised costs are deducted at CET1 as part of capitalised expenses in row 26f of the Common
Disclosures Template. (4) For regulatory capital purposes, APRA requires these instruments to be included as if they were unhedged.
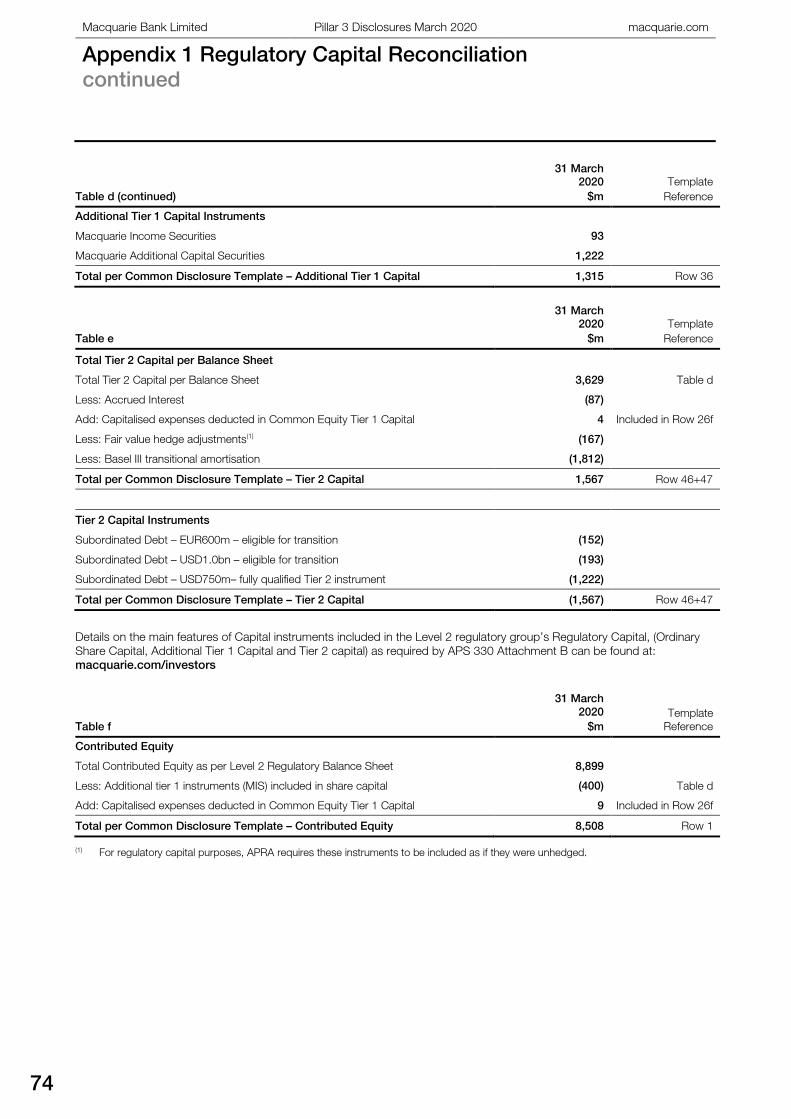
Macquarie Bank Limited Pillar 3 Disclosures March 2020 macquarie.com
Appendix 1 Regulatory Capital Reconciliation
continued
74
Table d (continued)
31 March
2020
$m
Template
Reference
Additional Tier 1 Capital Instruments
Macquarie Income Securities 93
Macquarie Additional Capital Securities 1,222
Total per Common Disclosure Template – Additional Tier 1 Capital 1,315 Row 36
Table e
31 March
2020
$m
Template
Reference
Total Tier 2 Capital per Balance Sheet
Total Tier 2 Capital per Balance Sheet 3,629 Table d
Less: Accrued Interest (87)
Add: Capitalised expenses deducted in Common Equity Tier 1 Capital 4 Included in Row 26f
Less: Fair value hedge adjustments(1) (167)
Less: Basel III transitional amortisation (1,812)
Total per Common Disclosure Template – Tier 2 Capital 1,567 Row 46+47
Tier 2 Capital Instruments
Subordinated Debt – EUR600m – eligible for transition (152)
Subordinated Debt – USD1.0bn – eligible for transition (193)
Subordinated Debt – USD750m– fully qualified Tier 2 instrument (1,222)
Total per Common Disclosure Template – Tier 2 Capital (1,567) Row 46+47
Details on the main features of Capital instruments included in the Level 2 regulatory group’s Regulatory Capital, (Ordinary
Share Capital, Additional Tier 1 Capital and Tier 2 capital) as required by APS 330 Attachment B can be found at:
macquarie.com/investors
Table f
31 March
2020
$m
Template
Reference
Contributed Equity
Total Contributed Equity as per Level 2 Regulatory Balance Sheet 8,899
Less: Additional tier 1 instruments (MIS) included in share capital (400) Table d
Add: Capitalised expenses deducted in Common Equity Tier 1 Capital 9 Included in Row 26f
Total per Common Disclosure Template – Contributed Equity 8,508 Row 1
(1) For regulatory capital purposes, APRA requires these instruments to be included as if they were unhedged.
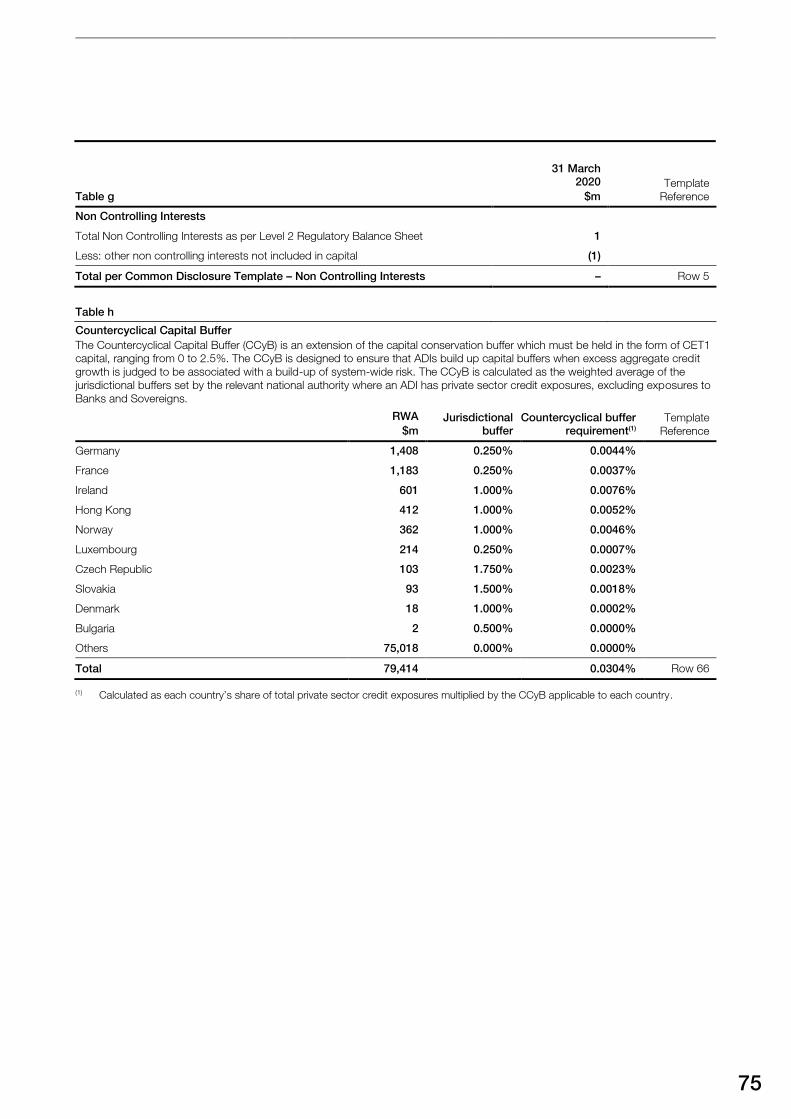
75
Table g
31 March
2020
$m
Template
Reference
Non Controlling Interests
Total Non Controlling Interests as per Level 2 Regulatory Balance Sheet 1
Less: other non controlling interests not included in capital (1)
Total per Common Disclosure Template – Non Controlling Interests – Row 5
Table h
Countercyclical Capital Buffer
The Countercyclical Capital Buffer (CCyB) is an extension of the capital conservation buffer which must be held in the form of CET1
capital, ranging from 0 to 2.5%. The CCyB is designed to ensure that ADIs build up capital buffers when excess aggregate credit
growth is judged to be associated with a build-up of system-wide risk. The CCyB is calculated as the weighted average of the
jurisdictional buffers set by the relevant national authority where an ADI has private sector credit exposures, excluding exposures to
Banks and Sovereigns.
RWA
$m
Jurisdictional
buffer
Countercyclical buffer
requirement(1)
Template
Reference
Germany 1,408 0.250% 0.0044%
France 1,183 0.250% 0.0037%
Ireland 601 1.000% 0.0076%
Hong Kong 412 1.000% 0.0052%
Norway 362 1.000% 0.0046%
Luxembourg 214 0.250% 0.0007%
Czech Republic 103 1.750% 0.0023%
Slovakia 93 1.500% 0.0018%
Denmark 18 1.000% 0.0002%
Bulgaria 2 0.500% 0.0000%
Others 75,018 0.000% 0.0000%
Total 79,414 0.0304% Row 66
(1) Calculated as each country’s share of total private sector credit exposures multiplied by the CCyB applicable to each country.
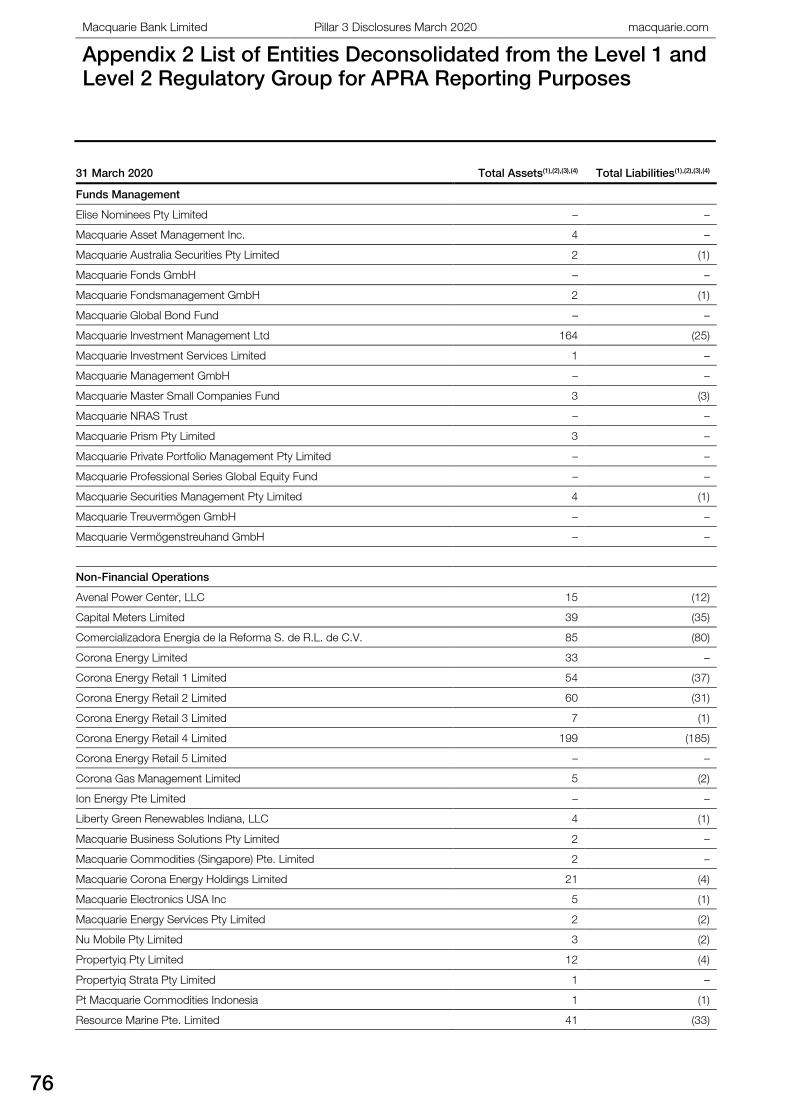
Macquarie Bank Limited Pillar 3 Disclosures March 2020 macquarie.com
Appendix 2 List of Entities Deconsolidated from the Level 1 and Level 2 Regulatory Group for APRA Reporting Purposes
76
Appendix 2 List of Entities Deconsolidated from the Level 1 and Level 2 Regulatory Group for APRA Reporting Purposes
31 March 2020 Total Assets(1),(2),(3),(4) Total Liabilities(1),(2),(3),(4)
Funds Management
Elise Nominees Pty Limited – –
Macquarie Asset Management Inc. 4 –
Macquarie Australia Securities Pty Limited 2 (1)
Macquarie Fonds GmbH – –
Macquarie Fondsmanagement GmbH 2 (1)
Macquarie Global Bond Fund – –
Macquarie Investment Management Ltd 164 (25)
Macquarie Investment Services Limited 1 –
Macquarie Management GmbH – –
Macquarie Master Small Companies Fund 3 (3)
Macquarie NRAS Trust – –
Macquarie Prism Pty Limited 3 –
Macquarie Private Portfolio Management Pty Limited – –
Macquarie Professional Series Global Equity Fund – –
Macquarie Securities Management Pty Limited 4 (1)
Macquarie Treuvermögen GmbH – –
Macquarie Vermögenstreuhand GmbH – –
Non-Financial Operations
Avenal Power Center, LLC 15 (12)
Capital Meters Limited 39 (35)
Comercializadora Energia de la Reforma S. de R.L. de C.V. 85 (80)
Corona Energy Limited 33 –
Corona Energy Retail 1 Limited 54 (37)
Corona Energy Retail 2 Limited 60 (31)
Corona Energy Retail 3 Limited 7 (1)
Corona Energy Retail 4 Limited 199 (185)
Corona Energy Retail 5 Limited – –
Corona Gas Management Limited 5 (2)
Ion Energy Pte Limited – –
Liberty Green Renewables Indiana, LLC 4 (1)
Macquarie Business Solutions Pty Limited 2 –
Macquarie Commodities (Singapore) Pte. Limited 2 –
Macquarie Corona Energy Holdings Limited 21 (4)
Macquarie Electronics USA Inc 5 (1)
Macquarie Energy Services Pty Limited 2 (2)
Nu Mobile Pty Limited 3 (2)
Propertyiq Pty Limited 12 (4)
Propertyiq Strata Pty Limited 1 –
Pt Macquarie Commodities Indonesia 1 (1)
Resource Marine Pte. Limited 41 (33)
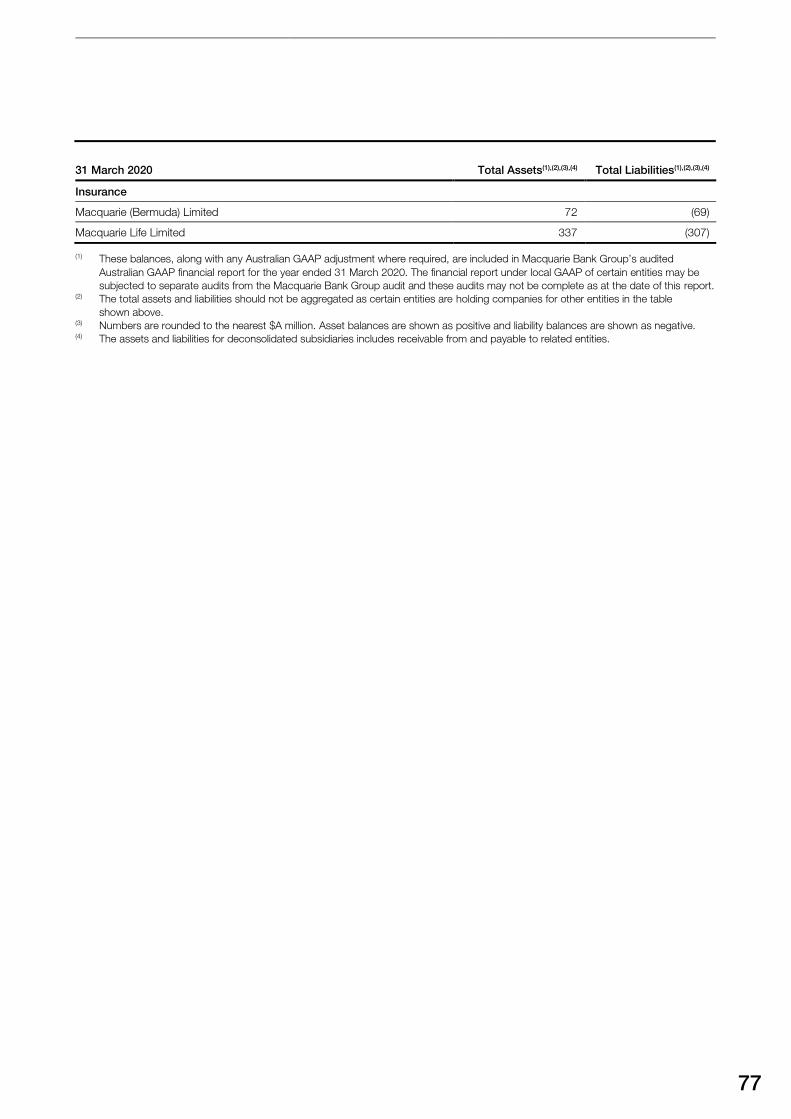
77
31 March 2020 Total Assets(1),(2),(3),(4) Total Liabilities(1),(2),(3),(4)
Insurance
Macquarie (Bermuda) Limited 72 (69)
Macquarie Life Limited 337 (307)
(1) These balances, along with any Australian GAAP adjustment where required, are included in Macquarie Bank Group’s audited
Australian GAAP financial report for the year ended 31 March 2020. The financial report under local GAAP of certain entities may be
subjected to separate audits from the Macquarie Bank Group audit and these audits may not be complete as at the date of this report.(2) The total assets and liabilities should not be aggregated as certain entities are holding companies for other entities in the table
shown above.(3) Numbers are rounded to the nearest $A million. Asset balances are shown as positive and liability balances are shown as negative.(4) The assets and liabilities for deconsolidated subsidiaries includes receivable from and payable to related entities.
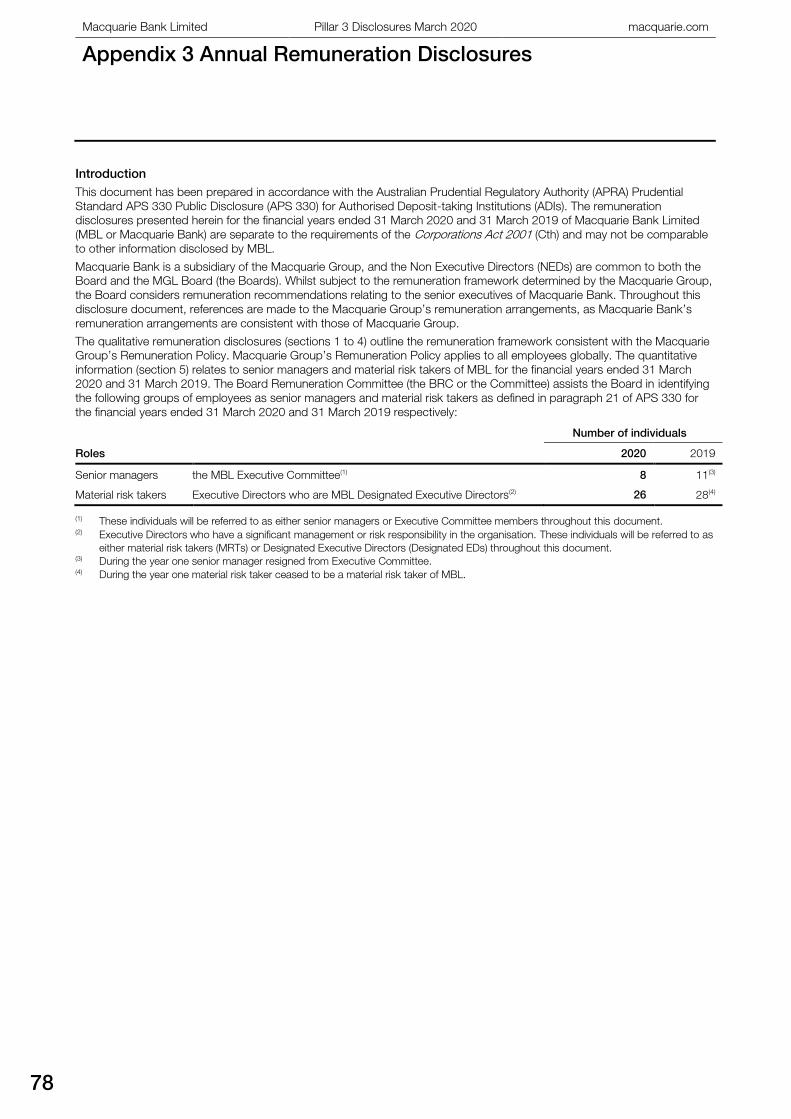
Macquarie Bank Limited Pillar 3 Disclosures March 2020 macquarie.com
Appendix 3 Annual Remuneration Disclosures
78
Appendix 3 Annual Remuneration Disclosures
Introduction
This document has been prepared in accordance with the Australian Prudential Regulatory Authority (APRA) Prudential
Standard APS 330 Public Disclosure (APS 330) for Authorised Deposit-taking Institutions (ADIs). The remuneration
disclosures presented herein for the financial years ended 31 March 2020 and 31 March 2019 of Macquarie Bank Limited
(MBL or Macquarie Bank) are separate to the requirements of the Corporations Act 2001 (Cth) and may not be comparable
to other information disclosed by MBL.
Macquarie Bank is a subsidiary of the Macquarie Group, and the Non Executive Directors (NEDs) are common to both the
Board and the MGL Board (the Boards). Whilst subject to the remuneration framework determined by the Macquarie Group,
the Board considers remuneration recommendations relating to the senior executives of Macquarie Bank. Throughout this
disclosure document, references are made to the Macquarie Group’s remuneration arrangements, as Macquarie Bank’s
remuneration arrangements are consistent with those of Macquarie Group.
The qualitative remuneration disclosures (sections 1 to 4) outline the remuneration framework consistent with the Macquarie
Group’s Remuneration Policy. Macquarie Group’s Remuneration Policy applies to all employees globally. The quantitative
information (section 5) relates to senior managers and material risk takers of MBL for the financial years ended 31 March
2020 and 31 March 2019. The Board Remuneration Committee (the BRC or the Committee) assists the Board in identifying
the following groups of employees as senior managers and material risk takers as defined in paragraph 21 of APS 330 for
the financial years ended 31 March 2020 and 31 March 2019 respectively:
Number of individuals
Roles 2020 2019
Senior managers the MBL Executive Committee(1) 8 11(3)
Material risk takers Executive Directors who are MBL Designated Executive Directors(2) 26 28(4)
(1) These individuals will be referred to as either senior managers or Executive Committee members throughout this document.
(2) Executive Directors who have a significant management or risk responsibility in the organisation. These individuals will be referred to as
either material risk takers (MRTs) or Designated Executive Directors (Designated EDs) throughout this document.(3) During the year one senior manager resigned from Executive Committee.(4) During the year one material risk taker ceased to be a material risk taker of MBL.
79
1 Remuneration Governance
The MGL Board oversees the Macquarie Group’s
remuneration framework. The MGL Board has a BRC
whose objective is to assist the Board and the Board of
Macquarie Bank, a key operating subsidiary, with the
Macquarie Group’s remuneration policies and practices.
The BRC currently comprises seven independent Non-
Executive Directors (NEDs):
Board Remuneration Committee members
Michael Hawker Chairman
Gary Banks Member
Jillian Broadbent Member
Gordon Cairns Member
Philip Coffey Member
Diane Grady Member
Peter Warne Member
The BRC members have the required experience and
expertise in human resources, remuneration and risk to
enable them to achieve effective governance of the
Macquarie Group’s remuneration framework. The BRC has
a regular meeting cycle and met nine times during FY2020.
Strict processes are in place to ensure conflicts of interest
are appropriately managed.
The BRC pays close attention to the design and the
operation of remuneration practices for all of the Macquarie
Group, not just for the most senior executives. The
responsibilities of the BRC are outlined in its Charter, which
is reviewed and approved annually by the Board. Some of
the responsibilities include:
– overseeing the process for the annual review of the
CEOs by the Macquarie Group and Macquarie Bank
Boards
– recommending to the Board the remuneration
outcomes for all Executive KMP, Designated Executive
Directors and other senior executives
– assessing the effectiveness of the Remuneration Policy
to ensure compliance with legal and regulatory
requirements, as well as to support the alignment of
remuneration with prudent risk taking and professional
conduct across the organisation
– recommending the Remuneration Policy to the Board
for approval.
The Charter is available at macquarie.com/leadership-
corporate-governance.
Macquarie Group’s strong remuneration governance
framework provides the BRC with multiple opportunities to
review and challenge both individual remuneration
outcomes and the company-wide profit share pool. There is
a consistent and comprehensive process for the BRC to
assess performance and determine remuneration outcomes
for Macquarie Bank’s most senior staff.
The BRC has retained Pay Governance as its independent
remuneration consultant, for the use of the MGL Board to
obtain advice on the appropriateness of Macquarie Group’s
remuneration framework.
The only service that Pay Governance provides to the
Macquarie Group is executive compensation consulting to
the BRC. This year, Pay Governance provided information
on global remuneration and regulatory trends, considered
alignment with shareholder interests, compared individual
remuneration for Executive KMP where relevant comparator
company information was available and considered
Macquarie Group’s overall remuneration approach
compared to comparator company organisations.
Board and Committee fees are reviewed annually. Per diem
fees may also be paid from time to time for approved
additional work. Macquarie Group’s NEDs are remunerated
for their services from the maximum aggregate amount
approved for this purpose. MGL shareholders approved the
current limit ($A5.0 million per annum) at MGL’s 2019
Annual General Meeting. The Board ensures that NED
remuneration for MGL and MBL taken together does not
exceed this shareholder approved maximum amount. An
internal review of NED fees was completed during the year.
The Boards determined, following this review, that Board
and Committee fees should remain unchanged, with the
Chairman receiving an annual fee of $A267,000 and each
Board member receiving an annual fee of $A78,000. Board
and Committee fees are reviewed annually.
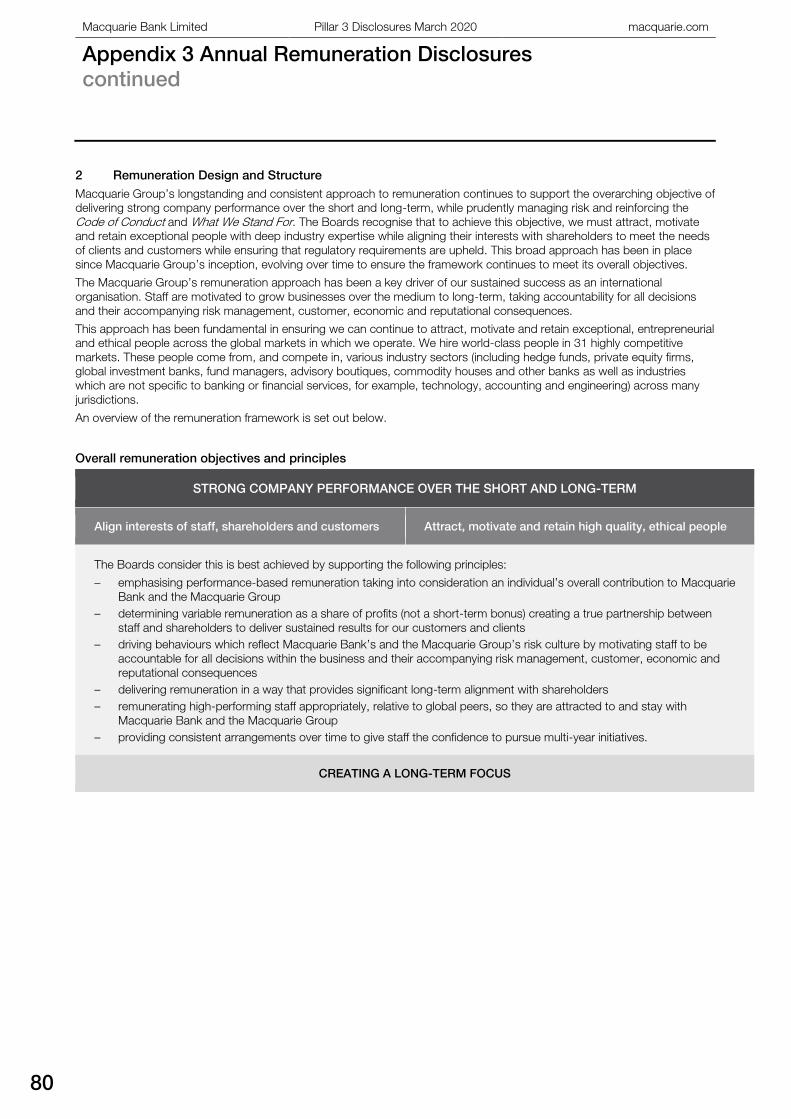
Macquarie Bank Limited Pillar 3 Disclosures March 2020 macquarie.com
Appendix 3 Annual Remuneration Disclosures
continued
80
2 Remuneration Design and Structure
Macquarie Group’s longstanding and consistent approach to remuneration continues to support the overarching objective of
delivering strong company performance over the short and long-term, while prudently managing risk and reinforcing the
Code of Conduct and What We Stand For. The Boards recognise that to achieve this objective, we must attract, motivate
and retain exceptional people with deep industry expertise while aligning their interests with shareholders to meet the needs
of clients and customers while ensuring that regulatory requirements are upheld. This broad approach has been in place
since Macquarie Group’s inception, evolving over time to ensure the framework continues to meet its overall objectives.
The Macquarie Group’s remuneration approach has been a key driver of our sustained success as an international
organisation. Staff are motivated to grow businesses over the medium to long-term, taking accountability for all decisions
and their accompanying risk management, customer, economic and reputational consequences.
This approach has been fundamental in ensuring we can continue to attract, motivate and retain exceptional, entrepreneurial
and ethical people across the global markets in which we operate. We hire world-class people in 31 highly competitive
markets. These people come from, and compete in, various industry sectors (including hedge funds, private equity firms,
global investment banks, fund managers, advisory boutiques, commodity houses and other banks as well as industries
which are not specific to banking or financial services, for example, technology, accounting and engineering) across many
jurisdictions.
An overview of the remuneration framework is set out below.
Overall remuneration objectives and principles
STRONG COMPANY PERFORMANCE OVER THE SHORT AND LONG-TERM
Align interests of staff, shareholders and customers Attract, motivate and retain high quality, ethical people
The Boards consider this is best achieved by supporting the following principles:
– emphasising performance-based remuneration taking into consideration an individual’s overall contribution to Macquarie
Bank and the Macquarie Group
– determining variable remuneration as a share of profits (not a short-term bonus) creating a true partnership between
staff and shareholders to deliver sustained results for our customers and clients
– driving behaviours which reflect Macquarie Bank’s and the Macquarie Group’s risk culture by motivating staff to be
accountable for all decisions within the business and their accompanying risk management, customer, economic and
reputational consequences
– delivering remuneration in a way that provides significant long-term alignment with shareholders
– remunerating high-performing staff appropriately, relative to global peers, so they are attracted to and stay with
Macquarie Bank and the Macquarie Group
– providing consistent arrangements over time to give staff the confidence to pursue multi-year initiatives.
CREATING A LONG-TERM FOCUS
81
Macquarie Group’s remuneration framework works as an integrated whole. An individual’s remuneration comprises fixed
remuneration, profit share and, for Executive committee members (our Executive KMP), Performance Share Units (PSUs).
The table below provides an overview of these components.
FIXED REMUNERATION
Fixed – for Executive Committee members, is a low level and a low proportion of total remuneration relative to the
industry but sufficient to avoid inappropriate risk-taking
– for risk and financial control staff, generally a higher proportion of total remuneration than for front office staff.
PERFORMANCE-BASED REMUNERATION
Profit share – all permanent employees are eligible to participate
– significant portion of profit share is retained (100% for the Macquarie Group CEO(1) , the Macquarie Bank
CEO, and all Executive Committee members in FY2020) with a long deferral period (three to seven years for
Executive Committee members)
– retained profit share is delivered in a combination of Macquarie Group equity and Macquarie-managed fund
equity to strengthen alignment with future performance
– Malus provisions apply to certain senior employees
– retained profit share is subject to forfeiture upon leaving Macquarie Group except in certain circumstances
(such as retirement from the Macquarie Group, redundancy, death, serious incapacitation, disability, serious
ill-health or other limited exceptional circumstances).
PSUs – are only awarded to Executive Committee members to drive company-wide performance
– are a meaningful incentive but not the major element of total remuneration
– vesting of PSUs is subject to achievement of performance hurdles measured equally against ROE relative to
an international reference group (50%) and absolute EPS growth (50%)
– PSU awards vest after four years(2)
– no retesting of hurdles
– an international reference group recognises the extent of the Macquarie Group’s diversification and
internationalisation.
– Malus provisions apply
– unvested PSUs are subject to forfeiture upon leaving Macquarie except in certain circumstances (such as
retirement from Macquarie, redundancy, death, serious incapacitation, disability, serious ill-health or other
limited exceptional circumstances).
(1) To further align the interests of staff and shareholders and to ensure we continue to retain key people through this period of economic
uncertainty due to COVID-19, 100% of FY2020 profit share is being retained for the CEO and all Executive KMP and delivered in a
combination of Macquarie Group equity and Macquarie-managed fund equity. (2) The Macquarie Group is subject to the Banking Executive Accountability Regime (BEAR) effective 1 July 2019. The vesting period of
PSUs awarded from FY2020 has been extended to four years, subject to performance hurdles. PSUs awarded prior to FY2020 vested
in two equal tranches after three and four years.
The Boards have discretion to change the remuneration arrangements on an annual basis to meet changing market
conditions as well as to comply with regulatory and corporate governance developments.
2.1 Risk and Financial Control Personnel
The Boards and management seek to ensure that remuneration for risk and financial control personnel, including the Chief
Financial Officer (CFO), the Chief Risk Officer (CRO) and the Group General Counsel, is structured so that it does not
compromise the independence of these personnel in carrying out their functions and is determined in a way that maintains
Macquarie’s robust risk management framework.
The proportion of fixed compensation for risk and financial control staff is generally higher than for other staff, with profit
share allocations being less variable than those awarded to staff performing front office functions. The CRO, CFO and Group
General Counsel are each responsible for reviewing the remuneration of all staff across Macquarie whose primary role is risk
and financial control and for alerting the BRC to any pay discrepancies. Each of the CRO, CFO and General Counsel provide
written confirmation to the BRC each year that remuneration for such staff has been determined in such a way that
preserves the independence of the function and maintains Macquarie’s robust risk management framework.
Macquarie Bank Limited Pillar 3 Disclosures March 2020 macquarie.com
Appendix 3 Annual Remuneration Disclosures
continued
82
3 Remuneration and Risk
Risk Culture
Macquarie Group’s What We Stand For principles of
Opportunity, Accountability and Integrity remain pivotal to our
culture and effectively guide our staff in managing risk-reward
and making decisions that realise opportunity for the benefit of
our clients, our shareholders, our people and the communities
in which we operate. Staff are made aware that these principles
must form the basis of all behaviours and actions. These
behavioural expectations are outlined in the Board approved
Code of Conduct, which is actively promoted by Management
and cascaded through the organisation through multiple
mechanisms. Macquarie invests significant time and effort into
communicating and reinforcing Macquarie’s culture through
senior management communications, policy reminders, training
and learning and development activities.
Strong risk management is a fundamental part of everyone’s
role at Macquarie. Staff understand that they are rewarded for
their performance, including their approach to managing risk.
They also understand that there are potential consequences for
non-compliance with Macquarie’s behavioural expectations.
Staff training and communications emphasise the link between
risk, conduct, policy breaches and consequence management
outcomes, including, where appropriate, adjustments to
performance-based remuneration.
Alignment of remuneration with prudent risk taking
The Boards considers that the effective alignment of
remuneration with prudent risk-taking is fundamental to its
remuneration approach. Remuneration outcomes reflect an
assessment of a range of factors including risk
management, compliance and behavioural measures to
promote good conduct and commitment to the Code of Conduct and What We Stand For. In addition, the
remuneration framework is characterised by significant
retention and long deferral periods, which enable risk
outcomes to be considered over long periods.
The Boards and the BRC continue to take risk and conduct
matters very seriously. There are robust processes in place
to ensure that all risk, reputation and conduct-related
matters are specifically considered when determining
remuneration outcomes. These processes may result in a
downward adjustment to group and/or individual profit
share allocations where appropriate. A wide range of risks
that could have a financial or non-financial impact on the
Macquarie Group and Macquarie Bank are considered,
including if there has been a detriment to customers.
To assist the Boards and the BRC:
– the Boards are able to assess Macquarie’s culture in a
number of ways including through staff survey results,
human capital reporting, risk culture reports, consequence
management reports, strategy presentations as well as
through personal observation of management and staff
behaviour and actions (including meeting with staff and
visits to overseas offices)
– the Chief Risk Officer (CRO) provides the BRC with an
independent report detailing material losses, large
transactions with residual risk, significant regulatory and
legal matters, significant compliance and operational
incidents, internal audit issues, other non-financial risk
matters as well as information regarding economic capital
– the Global Head of HR discusses the CRO’s report with
the Group Heads to ensure any matters listed are
appropriately reflected in remuneration outcomes for
relevant staff and provides a report to the BRC on how
this has been achieved
– the General Counsel, in conjunction with HR, considers
whether there are any incidents that should be brought
to the attention of the BRC which might lead to a Malus
determination and reports to the BRC at year end.
The BRC conducts a detailed review of all the material
presented and uses this information when considering
remuneration outcomes for relevant businesses and individuals.
Consequence management
The Macquarie Group operates a robust consequence
management process whereby incidents, breaches of policy
and misconduct are regularly reported to senior management.
Macquarie Group’s Consequence Management Guideline
applies wherever a breach of internal policy or regulatory
requirement is identified. Consequences may include further
training, removal of delegated authorities or permissions,
adjustments to performance-based remuneration, impact on
promotion, formal warnings or termination. Where an employee
has received a formal warning, their performance-based
remuneration will likely be impacted and in some cases, it will
be reduced to zero. Promotion decisions may also be
impacted. Impacts may also be applied where a formal warning
has not been issued. In each case, judgement is exercised as
to the appropriate consequence(s) based on all the relevant
circumstances. Where an individual’s employment is terminated
due to a compliance or conduct concern (or they resign),
retained and unvested remuneration is forfeited as per
Macquarie’s standard policy.
To assist the Boards and the BRC:
– RMG and HR routinely provide information on identified
breaches of policies and regulatory rules to (amongst other
purposes) ensure appropriate consequence management
is applied. RMG and HR data relating to employee
conduct, including individual employee warnings, incidents
and breaches is regularly reported to senior management
– the Global Head of HR annually reports to the BRC on
the outcomes from the consequence management
process and confirms these matters have been
considered in determining remuneration and promotion
outcomes where appropriate.
In FY2020, for Macquarie Bank, there were 79 (FY2019:89)
matters involving conduct/policy breach that resulted in
formal consequences. Of those matters:
– for 15 matters, termination of employment was the
outcome (FY2019: 9)
– for 64 matters, a formal warning was issued (FY2019:
80). Where a formal warning was issued, additional
consequences were applied as appropriate including
additional training, removal of delegated authorities or
permissions, adjustments to performance-based
remuneration and/or impact to promotion. Of the 64
matters, 4 have resulted in individuals subsequently
leaving Macquarie Bank.
These matters were considered to be isolated issues and
there was no evidence of broader systemic conduct issues.
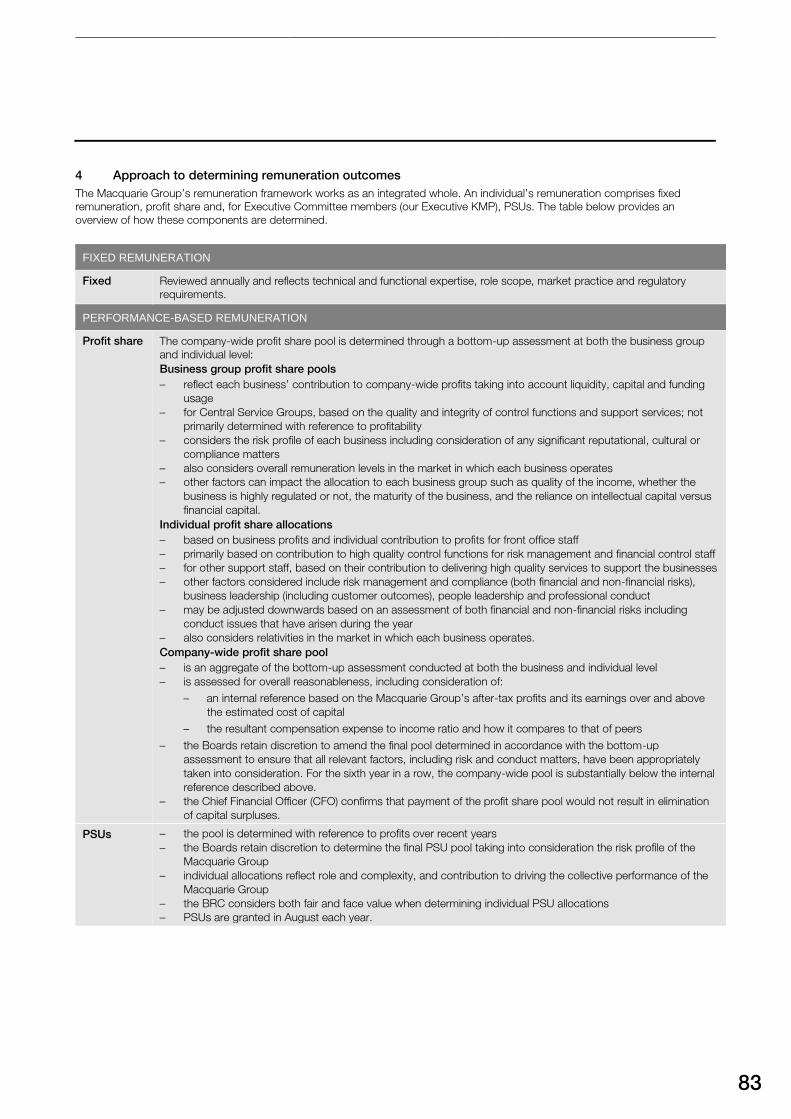
83
4 Approach to determining remuneration outcomes
The Macquarie Group’s remuneration framework works as an integrated whole. An individual’s remuneration comprises fixed
remuneration, profit share and, for Executive Committee members (our Executive KMP), PSUs. The table below provides an
overview of how these components are determined.
FIXED REMUNERATION
Fixed Reviewed annually and reflects technical and functional expertise, role scope, market practice and regulatory
requirements.
PERFORMANCE-BASED REMUNERATION
Profit share The company-wide profit share pool is determined through a bottom-up assessment at both the business group
and individual level:
Business group profit share pools
– reflect each business’ contribution to company-wide profits taking into account liquidity, capital and funding
usage
– for Central Service Groups, based on the quality and integrity of control functions and support services; not
primarily determined with reference to profitability
– considers the risk profile of each business including consideration of any significant reputational, cultural or
compliance matters
– also considers overall remuneration levels in the market in which each business operates
– other factors can impact the allocation to each business group such as quality of the income, whether the
business is highly regulated or not, the maturity of the business, and the reliance on intellectual capital versus
financial capital.
Individual profit share allocations
– based on business profits and individual contribution to profits for front office staff
– primarily based on contribution to high quality control functions for risk management and financial control staff
– for other support staff, based on their contribution to delivering high quality services to support the businesses
– other factors considered include risk management and compliance (both financial and non-financial risks),
business leadership (including customer outcomes), people leadership and professional conduct
– may be adjusted downwards based on an assessment of both financial and non-financial risks including
conduct issues that have arisen during the year
– also considers relativities in the market in which each business operates.
Company-wide profit share pool
– is an aggregate of the bottom-up assessment conducted at both the business and individual level
– is assessed for overall reasonableness, including consideration of:
– an internal reference based on the Macquarie Group’s after-tax profits and its earnings over and above
the estimated cost of capital
– the resultant compensation expense to income ratio and how it compares to that of peers
– the Boards retain discretion to amend the final pool determined in accordance with the bottom-up
assessment to ensure that all relevant factors, including risk and conduct matters, have been appropriately
taken into consideration. For the sixth year in a row, the company-wide pool is substantially below the internal
reference described above.
– the Chief Financial Officer (CFO) confirms that payment of the profit share pool would not result in elimination
of capital surpluses.
PSUs – the pool is determined with reference to profits over recent years
– the Boards retain discretion to determine the final PSU pool taking into consideration the risk profile of the
Macquarie Group
– individual allocations reflect role and complexity, and contribution to driving the collective performance of the
Macquarie Group
– the BRC considers both fair and face value when determining individual PSU allocations
– PSUs are granted in August each year.
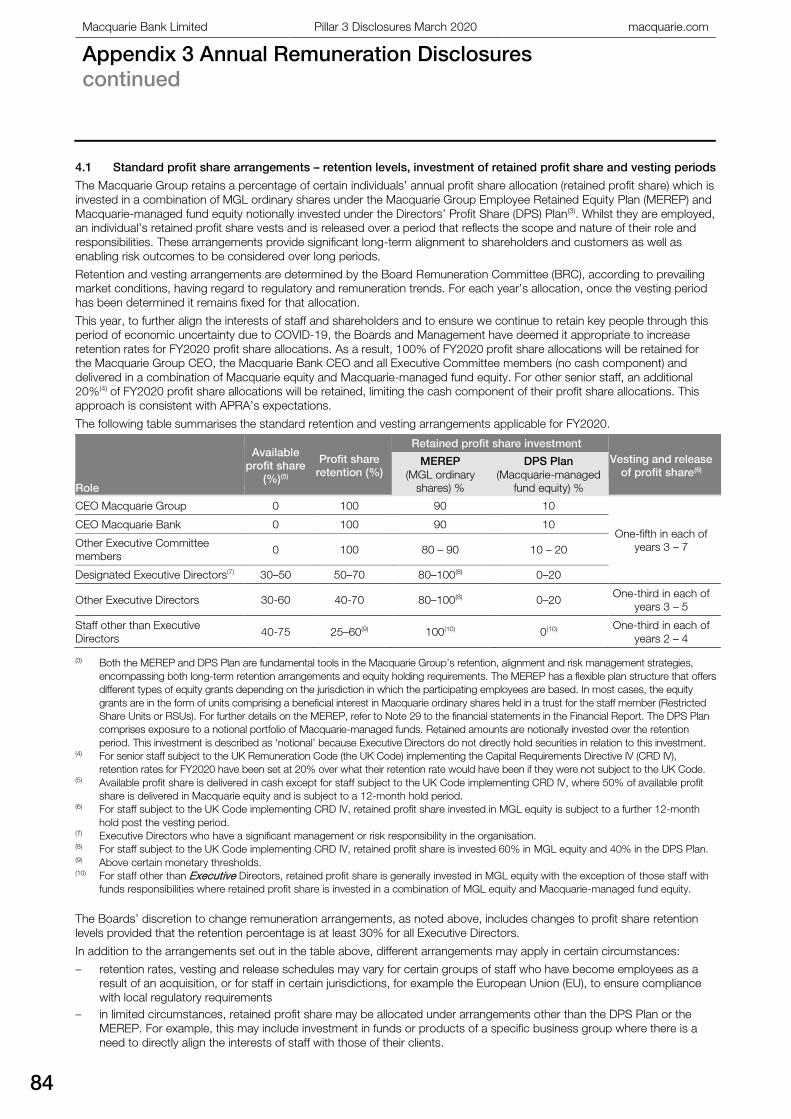
Macquarie Bank Limited Pillar 3 Disclosures March 2020 macquarie.com
Appendix 3 Annual Remuneration Disclosures
continued
84
4.1 Standard profit share arrangements – retention levels, investment of retained profit share and vesting periods
The Macquarie Group retains a percentage of certain individuals’ annual profit share allocation (retained profit share) which is
invested in a combination of MGL ordinary shares under the Macquarie Group Employee Retained Equity Plan (MEREP) and
Macquarie-managed fund equity notionally invested under the Directors’ Profit Share (DPS) Plan(3). Whilst they are employed,
an individual’s retained profit share vests and is released over a period that reflects the scope and nature of their role and
responsibilities. These arrangements provide significant long-term alignment to shareholders and customers as well as
enabling risk outcomes to be considered over long periods.
Retention and vesting arrangements are determined by the Board Remuneration Committee (BRC), according to prevailing
market conditions, having regard to regulatory and remuneration trends. For each year’s allocation, once the vesting period
has been determined it remains fixed for that allocation.
This year, to further align the interests of staff and shareholders and to ensure we continue to retain key people through this
period of economic uncertainty due to COVID-19, the Boards and Management have deemed it appropriate to increase
retention rates for FY2020 profit share allocations. As a result, 100% of FY2020 profit share allocations will be retained for
the Macquarie Group CEO, the Macquarie Bank CEO and all Executive Committee members (no cash component) and
delivered in a combination of Macquarie equity and Macquarie-managed fund equity. For other senior staff, an additional
20%(4) of FY2020 profit share allocations will be retained, limiting the cash component of their profit share allocations. This
approach is consistent with APRA’s expectations.
The following table summarises the standard retention and vesting arrangements applicable for FY2020.
Role
Available
profit share
(%)(5)
Profit share
retention (%)
Retained profit share investment
Vesting and release
of profit share(6) MEREP
(MGL ordinary
shares) %
DPS Plan
(Macquarie-managed
fund equity) %
CEO Macquarie Group 0 100 90 10
One-fifth in each of
years 3 – 7
CEO Macquarie Bank 0 100 90 10
Other Executive Committee
members 0 100 80 – 90 10 – 20
Designated Executive Directors(7) 30–50 50–70 80–100(8) 0–20
Other Executive Directors 30-60 40-70 80–100(8) 0–20 One-third in each of
years 3 – 5
Staff other than Executive
Directors 40-75 25–60(9) 100(10) 0(10)
One-third in each of
years 2 – 4
(3) Both the MEREP and DPS Plan are fundamental tools in the Macquarie Group’s retention, alignment and risk management strategies,
encompassing both long-term retention arrangements and equity holding requirements. The MEREP has a flexible plan structure that offers
different types of equity grants depending on the jurisdiction in which the participating employees are based. In most cases, the equity
grants are in the form of units comprising a beneficial interest in Macquarie ordinary shares held in a trust for the staff member (Restricted
Share Units or RSUs). For further details on the MEREP, refer to Note 29 to the financial statements in the Financial Report. The DPS Plan
comprises exposure to a notional portfolio of Macquarie-managed funds. Retained amounts are notionally invested over the retention
period. This investment is described as ‘notional’ because Executive Directors do not directly hold securities in relation to this investment.(4) For senior staff subject to the UK Remuneration Code (the UK Code) implementing the Capital Requirements Directive IV (CRD IV),
retention rates for FY2020 have been set at 20% over what their retention rate would have been if they were not subject to the UK Code.(5) Available profit share is delivered in cash except for staff subject to the UK Code implementing CRD IV, where 50% of available profit
share is delivered in Macquarie equity and is subject to a 12-month hold period.(6) For staff subject to the UK Code implementing CRD IV, retained profit share invested in MGL equity is subject to a further 12-month
hold post the vesting period.(7) Executive Directors who have a significant management or risk responsibility in the organisation.(8) For staff subject to the UK Code implementing CRD IV, retained profit share is invested 60% in MGL equity and 40% in the DPS Plan.(9) Above certain monetary thresholds.(10) For staff other than Executive Directors, retained profit share is generally invested in MGL equity with the exception of those staff with
funds responsibilities where retained profit share is invested in a combination of MGL equity and Macquarie-managed fund equity.
The Boards’ discretion to change remuneration arrangements, as noted above, includes changes to profit share retention
levels provided that the retention percentage is at least 30% for all Executive Directors.
In addition to the arrangements set out in the table above, different arrangements may apply in certain circumstances:
– retention rates, vesting and release schedules may vary for certain groups of staff who have become employees as a
result of an acquisition, or for staff in certain jurisdictions, for example the European Union (EU), to ensure compliance
with local regulatory requirements
– in limited circumstances, retained profit share may be allocated under arrangements other than the DPS Plan or the
MEREP. For example, this may include investment in funds or products of a specific business group where there is a
need to directly align the interests of staff with those of their clients.
85
4.2 Forfeiture of Retained Profit Share – Malus Events
Since 2012, the Boards or their delegates have had the ability to reduce or eliminate unvested profit share for certain senior
employees in certain circumstances (Malus). The current Malus provisions provide the Boards or its delegates with the ability
to reduce or eliminate in full, the unvested profit share awarded in respect of FY2015 onwards to certain senior employees if
it determined that the individual has at any time:
– acted dishonestly (including, but not limited to, misappropriating funds or deliberately concealing a transaction)
– acted or failed to act in a way that contributed to a breach of a significant legal or significant regulatory requirement
relevant to the Macquarie Group
– acted or failed to act in a way that contributed to MGL, Macquarie Bank or any Operating Group within the Macquarie
Group incurring:
– significant reputational harm
– a significant unexpected financial loss, impairment charge, cost or provision
– acted or failed to act in a way that contributed to MGL or Macquarie Bank making a material financial restatement.
Each of the above is a Malus Event.
Additional provisions may apply to staff in certain jurisdictions to ensure compliance with local regulations. This includes, for
example, staff in the European Union (EU) who are required to comply with local regulatory requirements. These individuals
are subject to additional Malus and clawback provisions under EU regulations.
The Macquarie Group has always had and continues to have, the ability to terminate staff where a Malus Event has
occurred, at which time any unvested profit share would be forfeited in full. The BRC considers whether, and the extent to
which, to apply Malus, taking into account local employment laws, the nature and circumstances of the event and any other
redress that has been or may be applied.
4.3 Early Vesting and Release of Retained Profit Share
An Executive Director’s unvested retained profit share is only paid out on termination of employment in the case of
retirement from the Macquarie Group, redundancy, death, serious incapacitation, disability, serious ill-health or other limited
exceptional circumstances. The Boards have discretion to accelerate the vesting of retained profit share under these
circumstances (subject to the conditions of early release as set out below).
Discretion may be exercised in certain other limited exceptional circumstances on the grounds of business efficacy, in
relation to strategic business objectives, including in connection with the divestment or internalisation of Macquarie Group
businesses, or when an employee resigns to fulfil a public service role in a governmental organisation or agency. Where such
discretion is exercised, the Boards may impose such other conditions as it considers appropriate.
This year, such discretion has not been exercised.
4.3.1 Conditions of Early Release to Departing Executive Directors – Post Employment Events
In addition to the Malus provisions set out in section 4.2, where discretion has been exercised to accelerate the vesting of
retained profit share of any departing Executive Director, the Boards may reduce or eliminate their retained profit share, if it
determined that the Executive Director has at any time during their employment or the relevant release periods after their
employment committed a Malus Event (as described above) or:
a) taken staff to a competitor or been instrumental in causing staff to go to a competitor, or
b) joined a competitor of the Macquarie Group or otherwise participated in a business that competes with the
Macquarie Group.
Each of the above is a Post Employment Event.
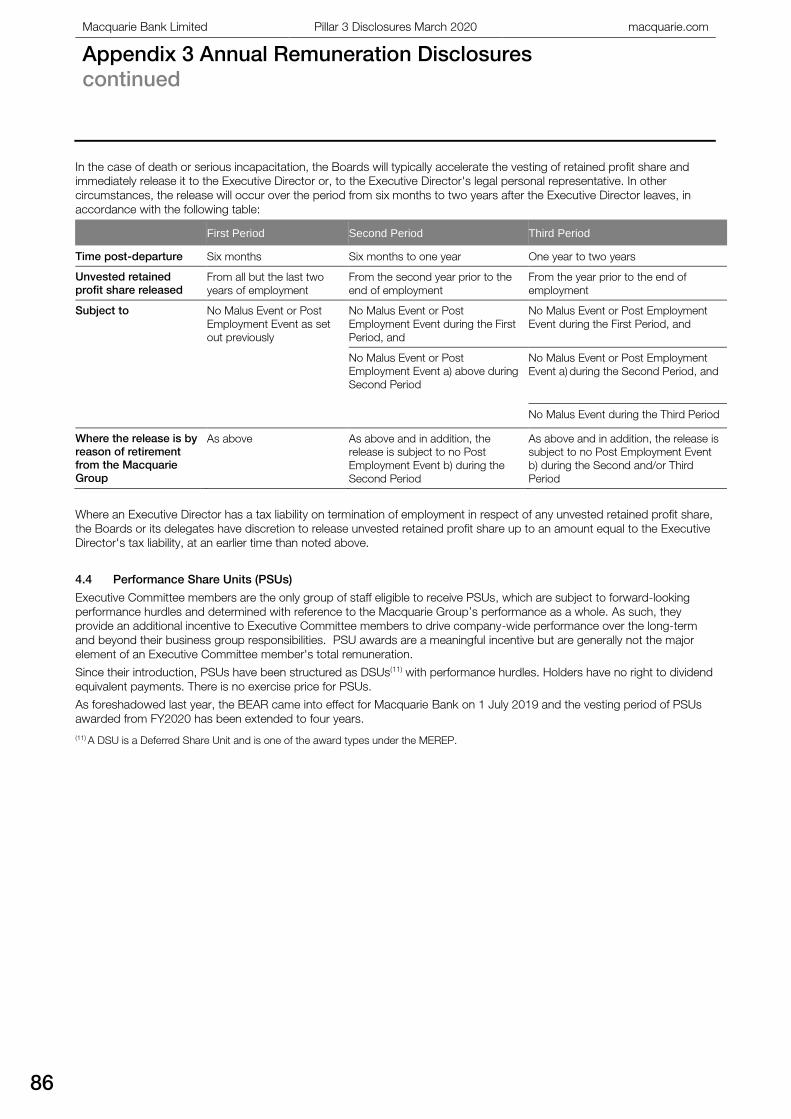
Macquarie Bank Limited Pillar 3 Disclosures March 2020 macquarie.com
Appendix 3 Annual Remuneration Disclosures
continued
86
In the case of death or serious incapacitation, the Boards will typically accelerate the vesting of retained profit share and
immediately release it to the Executive Director or, to the Executive Director's legal personal representative. In other
circumstances, the release will occur over the period from six months to two years after the Executive Director leaves, in
accordance with the following table:
First Period Second Period Third Period
Time post-departure Six months Six months to one year One year to two years
Unvested retained
profit share released From all but the last two
years of employment
From the second year prior to the
end of employment
From the year prior to the end of
employment
Subject to No Malus Event or Post
Employment Event as set
out previously
No Malus Event or Post
Employment Event during the First
Period, and
No Malus Event or Post Employment
Event during the First Period, and
No Malus Event or Post
Employment Event a) above during
Second Period
No Malus Event or Post Employment
Event a) during the Second Period, and
No Malus Event during the Third Period
Where the release is by
reason of retirement
from the Macquarie
Group
As above As above and in addition, the
release is subject to no Post
Employment Event b) during the
Second Period
As above and in addition, the release is
subject to no Post Employment Event
b) during the Second and/or Third
Period
Where an Executive Director has a tax liability on termination of employment in respect of any unvested retained profit share,
the Boards or its delegates have discretion to release unvested retained profit share up to an amount equal to the Executive
Director's tax liability, at an earlier time than noted above.
4.4 Performance Share Units (PSUs)
Executive Committee members are the only group of staff eligible to receive PSUs, which are subject to forward-looking
performance hurdles and determined with reference to the Macquarie Group’s performance as a whole. As such, they
provide an additional incentive to Executive Committee members to drive company-wide performance over the long-term
and beyond their business group responsibilities. PSU awards are a meaningful incentive but are generally not the major
element of an Executive Committee member's total remuneration.
Since their introduction, PSUs have been structured as DSUs(11) with performance hurdles. Holders have no right to dividend
equivalent payments. There is no exercise price for PSUs.
As foreshadowed last year, the BEAR came into effect for Macquarie Bank on 1 July 2019 and the vesting period of PSUs
awarded from FY2020 has been extended to four years.
(11) A DSU is a Deferred Share Unit and is one of the award types under the MEREP.
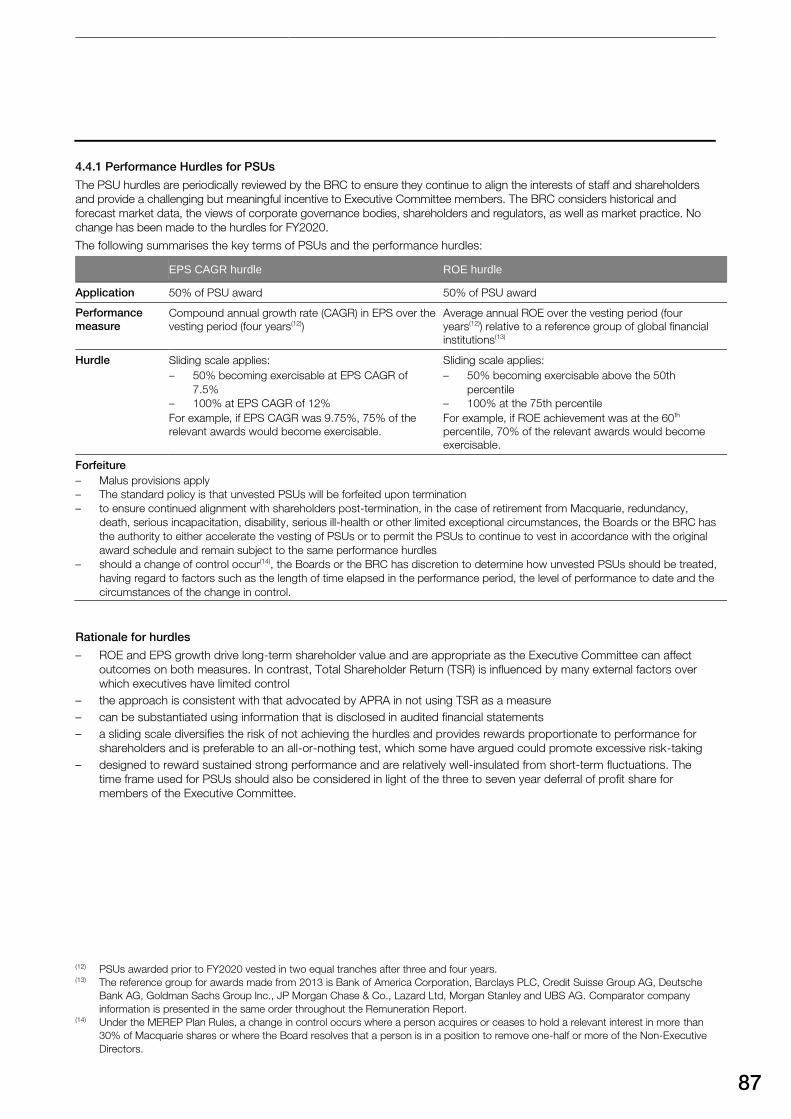
87
4.4.1 Performance Hurdles for PSUs
The PSU hurdles are periodically reviewed by the BRC to ensure they continue to align the interests of staff and shareholders
and provide a challenging but meaningful incentive to Executive Committee members. The BRC considers historical and
forecast market data, the views of corporate governance bodies, shareholders and regulators, as well as market practice. No
change has been made to the hurdles for FY2020.
The following summarises the key terms of PSUs and the performance hurdles:
EPS CAGR hurdle ROE hurdle
Application 50% of PSU award 50% of PSU award
Performance
measure
Compound annual growth rate (CAGR) in EPS over the
vesting period (four years(12))
Average annual ROE over the vesting period (four
years(12)) relative to a reference group of global financial
institutions(13)
Hurdle Sliding scale applies:
– 50% becoming exercisable at EPS CAGR of
7.5%
– 100% at EPS CAGR of 12%
For example, if EPS CAGR was 9.75%, 75% of the
relevant awards would become exercisable.
Sliding scale applies:
– 50% becoming exercisable above the 50th
percentile
– 100% at the 75th percentile
For example, if ROE achievement was at the 60th
percentile, 70% of the relevant awards would become
exercisable.
Forfeiture
– Malus provisions apply
– The standard policy is that unvested PSUs will be forfeited upon termination
– to ensure continued alignment with shareholders post-termination, in the case of retirement from Macquarie, redundancy,
death, serious incapacitation, disability, serious ill-health or other limited exceptional circumstances, the Boards or the BRC has
the authority to either accelerate the vesting of PSUs or to permit the PSUs to continue to vest in accordance with the original
award schedule and remain subject to the same performance hurdles
– should a change of control occur(14), the Boards or the BRC has discretion to determine how unvested PSUs should be treated,
having regard to factors such as the length of time elapsed in the performance period, the level of performance to date and the
circumstances of the change in control.
Rationale for hurdles
– ROE and EPS growth drive long-term shareholder value and are appropriate as the Executive Committee can affect
outcomes on both measures. In contrast, Total Shareholder Return (TSR) is influenced by many external factors over
which executives have limited control
– the approach is consistent with that advocated by APRA in not using TSR as a measure
– can be substantiated using information that is disclosed in audited financial statements
– a sliding scale diversifies the risk of not achieving the hurdles and provides rewards proportionate to performance for
shareholders and is preferable to an all-or-nothing test, which some have argued could promote excessive risk-taking
– designed to reward sustained strong performance and are relatively well-insulated from short-term fluctuations. The
time frame used for PSUs should also be considered in light of the three to seven year deferral of profit share for
members of the Executive Committee.
(12) PSUs awarded prior to FY2020 vested in two equal tranches after three and four years. (13) The reference group for awards made from 2013 is Bank of America Corporation, Barclays PLC, Credit Suisse Group AG, Deutsche
Bank AG, Goldman Sachs Group Inc., JP Morgan Chase & Co., Lazard Ltd, Morgan Stanley and UBS AG. Comparator company
information is presented in the same order throughout the Remuneration Report. (14) Under the MEREP Plan Rules, a change in control occurs where a person acquires or ceases to hold a relevant interest in more than
30% of Macquarie shares or where the Board resolves that a person is in a position to remove one-half or more of the Non-Executive
Directors.
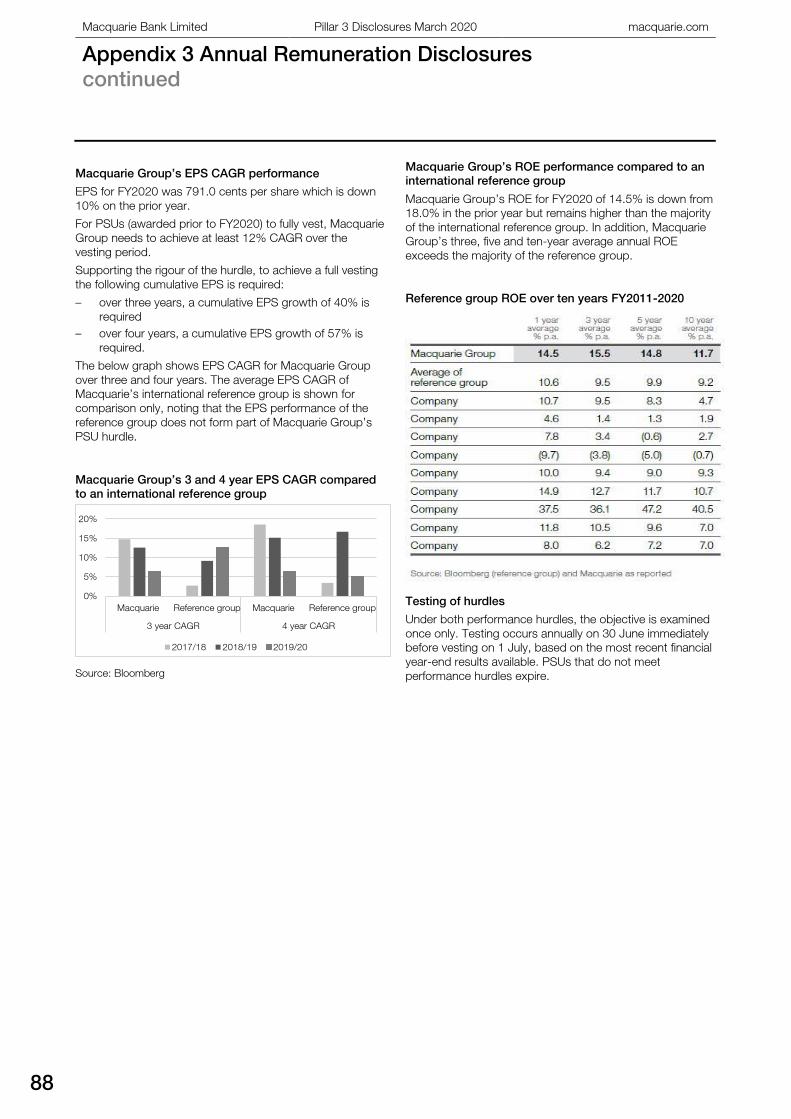
Macquarie Bank Limited Pillar 3 Disclosures March 2020 macquarie.com
Appendix 3 Annual Remuneration Disclosures
continued
88
Macquarie Group’s EPS CAGR performance
EPS for FY2020 was 791.0 cents per share which is down
10% on the prior year.
For PSUs (awarded prior to FY2020) to fully vest, Macquarie
Group needs to achieve at least 12% CAGR over the
vesting period.
Supporting the rigour of the hurdle, to achieve a full vesting
the following cumulative EPS is required:
– over three years, a cumulative EPS growth of 40% is
required
– over four years, a cumulative EPS growth of 57% is
required.
The below graph shows EPS CAGR for Macquarie Group
over three and four years. The average EPS CAGR of
Macquarie’s international reference group is shown for
comparison only, noting that the EPS performance of the
reference group does not form part of Macquarie Group’s
PSU hurdle.
Macquarie Group’s 3 and 4 year EPS CAGR compared
to an international reference group
Source: Bloomberg
Macquarie Group’s ROE performance compared to an
international reference group
Macquarie Group’s ROE for FY2020 of 14.5% is down from
18.0% in the prior year but remains higher than the majority
of the international reference group. In addition, Macquarie
Group’s three, five and ten-year average annual ROE
exceeds the majority of the reference group.
Reference group ROE over ten years FY2011-2020
Testing of hurdles
Under both performance hurdles, the objective is examined
once only. Testing occurs annually on 30 June immediately
before vesting on 1 July, based on the most recent financial
year-end results available. PSUs that do not meet
performance hurdles expire.
0%
5%
10%
15%
20%
Macquarie Reference group Macquarie Reference group
3 year CAGR 4 year CAGR
2017/18 2018/19 2019/20
89
4.5 Other features of Macquarie’s Remuneration Structure
Minimum
shareholding
requirement
Executive Directors are required to hold a relevant interest in MGL ordinary shares that have a value equal to
5% of an Executive Director’s aggregate profit share allocation for each of the past five years (10 years for
Executive Committee members), which can be satisfied by the requirements of the profit share retention
policy. For Executive Committee members, compliance with this policy equates to a minimum shareholding
requirement of between 180% to 710% of fixed remuneration.
Promotion
Awards
Staff who are promoted to Associate Director, Division Director or Executive Director receive an allocation of
MEREP awards based on Director-level set with reference to an Australian dollar value. Currently these
awards range from $A25,000 to $A175,000 depending on the promotion level.
Hedging The Macquarie Group prohibits staff from hedging shares held to meet the minimum shareholding
requirement and unvested equity held in the MEREP.
Employment contracts
The following table summarises key features of the employment contracts for Executive Committee members including
the CEO:
Length of contract Permanent open-ended.
Remuneration review period 1 April to 31 March annually.
Profit share participation Executive Committee members are eligible to be considered for a profit share allocation that
ensures that a large part of their remuneration is ‘at risk’.
PSU participation Executive Committee members are eligible to receive PSUs.
Termination of employment Requires no more than four weeks’ notice(15) by Macquarie or the Executive Committee
member (Post-employment restrictions apply).
Post-employment restrictions Restrictions include non-solicitation provisions applicable for six months, and paid non-
competition provisions applicable, at Macquarie’s election, for up to three months post-
termination.
(15) Subject to compliance with local regulatory and legal requirements. In Australia, Executive Directors given notice by the Macquarie Group
may receive an additional week’s notice if they are over 45 years of age and have more than two years’ continuous service at the time of the
termination of their employment. In the UK, the statutory minimum notice period increases from four weeks to a maximum 12 weeks based
on years of service.
Macquarie Bank Limited Pillar 3 Disclosures March 2020 macquarie.com
Appendix 3 Annual Remuneration Disclosures
continued
90
5 Quantitative Disclosures for Senior Managers and Material Risk Takers
The following tables have been prepared in accordance with APS 330 for the financial years ended 31 March 2020 and 31
March 2019. These tables are prepared on a different basis than those required by Australian Accounting Standards and the
Corporations Act, as disclosed in Macquarie Bank’s Annual Report.
These disclosures reflect remuneration for services to MBL for the reporting period when the individual was a senior
manager or material risk taker.
5.1 Total Value of Remuneration Awards for Senior Managers and Material Risk Takers(1)
The following table sets out the total value of remuneration awarded to senior managers and material risk takers in respect of
their performance for the financial years ended 31 March 2020 and 31 March 2019. 7 senior managers (FY2019: 11) and 25
material risk takers (FY2019: 28) received a variable remuneration award in respect of services to MBL in FY2020.
Senior managers Material risk takers
Non-Deferred Deferred Non-Deferred Deferred
$A’000 2020 2019 2020 2019 2020 2019 2020 2019
3,873 5,582 - - 12,705 17,813 -
- - - - - - -
- - - - - - -
- 33,626 - - 19,116 28,693 -
- - 55,908 66,370 251(5) 1,711(5) 30,049 30,588
Fixed remuneration(2)
Cash-based
Shares and share-linked instruments
Other
Variable remuneration(3)
Cash-based
Shares and share-linked instruments(4)
Other - - - - - -
5.2 Deferred Remuneration for Senior Managers and Material Risk Takers – Total Value Outstanding, Vested and
Any Downward Adjustments
The following table sets out the total value of deferred remuneration outstanding at 31 March 2020 and 31 March 2019
respectively, remuneration granted in previous years that vested during the current financial year and any realised reductions
due to ex post explicit and implicit adjustments. All outstanding deferred remuneration is exposed to ex post explicit and
implicit adjustments.
Senior managers Material risk takers
$A’000 2020 2019 2020 2019
- - - -
125,005 410,512 103,995 161,285
67,410 90,707 31,298 37,952
(1,050) - - -
Outstanding deferred remuneration(6)
Cash-based
Shares and share-linked instruments(7)
Deferred remuneration vested during the financial year(8)
Deferred remuneration adjustments during the financial year
Reductions due to ex post explicit adjustments(9)
Reductions due to ex post implicit adjustments - - - -
As set out below, no senior managers were awarded a guaranteed or sign-on award for the financial year ended 31 March
2020 (FY2019: Nil). No guarantee awards and no sign-on award were granted to material risk takers during FY2020
(FY2019: Nil). During FY2020 one payment related to unused leave entitlements associated with termination was made to a
senior manager (FY2019: Nil). No termination payments were made to a material risk taker during FY2020 (FY2019: Nil).
Senior managers Material risk takers
No. of individuals Total amount No. of individuals Total amount
$A’000 2020 2019 2020 2019 2020 2019 2020 2019
Termination payments(10) 1 - 188 - - - - -
91
Notes to the quantitative remuneration disclosures
(1) Remuneration awarded in respect of FY2020 and FY2019 performance reflects remuneration relating to services to MBL for the portion
of the relevant periods that each individual was a senior manager or material risk taker of MBL. (2) Fixed remuneration comprises current year salary, including superannuation and other cash allowances. (3) Variable remuneration awarded in respect of performance for FY2020 and FY2019 includes the total value of non-deferred and
deferred components related to the FY2020 and FY2019 awards. The non-deferred (cash-based) components will be granted and
paid in the following financial year and the payment of deferred components are deferred to a future period. (4) Includes the value of retained profit share invested in MGL ordinary shares under the MEREP, retained profit share notionally invested
in Macquarie managed-fund equity under the DPS Plan, and for senior managers, PSUs. (5) This relates to EU Material Risk Takers in the UK for whom a portion of their non-deferred profit share is delivered in MGL ordinary
shares in accordance with the Remuneration Code. (6) Value as at 31 March 2020 and 31 March 2019 of unvested deferred remuneration. (7) Includes the value as at 31 March 2020 (for FY2020) and 31 March 2019 (for FY2019) of retained profit share invested in MGL ordinary
shares under the MEREP, retained profit share notionally invested in Macquarie managed-fund equity under the DPS Plan, and for
senior managers, the fair value of PSUs at the same date. The value of retained profit share invested in the MEREP for FY2020 has
been calculated based on the 31 March 2020 share price of $A85.75. For FY2019, the value of retained profit share invested in the
MEREP has been calculated based on the 31 March 2019 share price of $A129.42. (8) Value as at the date of vesting of deferred remuneration that vested during the financial years ended 31 March 2020 and 31 March
2019 for senior managers and material risk takers, including vesting for staff who terminated during FY2020. The value has been
calculated based on the share price on the date of vesting which for FY2020 was in the range of $A119.93 to $A134.60 (FY2019:
$A110.09 to $A124.02). (9) Explicit adjustments include any realised reductions relating to forfeitures, lapses as a result of failure to meet performance hurdles, and
adjustments made under the Malus and Post Employment Event provisions. (10) This amount reflects payments made in FY2020 and FY2019 associated with termination of employment with Macquarie Group in
accordance with Macquarie Group policies, Executive Director remuneration arrangements, individual employment agreements, and/or
local legal requirements. Payments associated with termination will typically include unused long-service and annual leave entitlements,
and redundancy amounts, where applicable, but will exclude the release (in accordance with Macquarie Group’s remuneration
arrangements) of deferred remuneration awarded in prior years which is included in deferred remuneration vested during the relevant
financial year. There are no ex-gratia termination payments. Individuals may also retain deferred remuneration held in the MEREP, the
DPS Plan or as PSUs (senior managers only), which may be released in future years subject to the relevant restriction periods, DPS
release provisions and performance hurdles per Macquarie Group policies, Executive Director remuneration arrangements and/or
individual employment agreements.
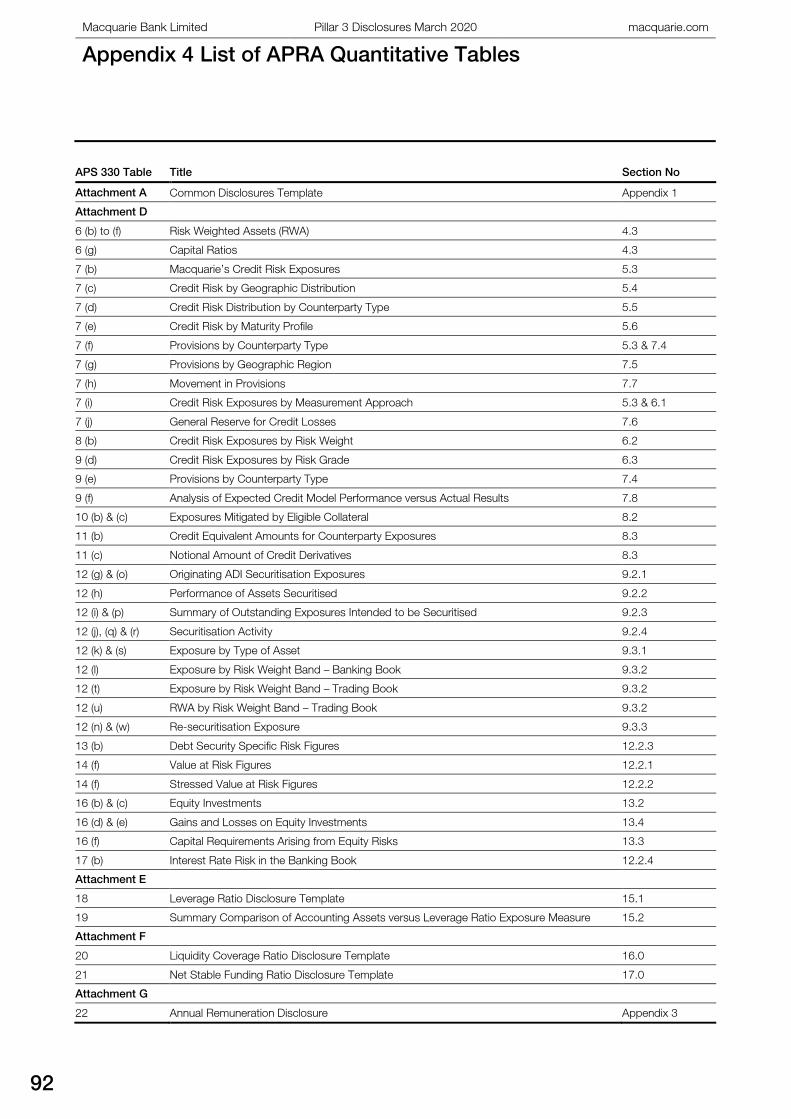
Macquarie Bank Limited Pillar 3 Disclosures March 2020 macquarie.com
Appendix 4 List of APRA Quantitative Tables
92
Appendix 4 List of APRA Quantitative Tables
APS 330 Table Title Section No
Attachment A Common Disclosures Template Appendix 1
Attachment D
6 (b) to (f) Risk Weighted Assets (RWA) 4.3
6 (g) Capital Ratios 4.3
7 (b) Macquarie’s Credit Risk Exposures 5.3
7 (c) Credit Risk by Geographic Distribution 5.4
7 (d) Credit Risk Distribution by Counterparty Type 5.5
7 (e) Credit Risk by Maturity Profile 5.6
7 (f) Provisions by Counterparty Type 5.3 & 7.4
7 (g) Provisions by Geographic Region 7.5
7 (h) Movement in Provisions 7.7
7 (i) Credit Risk Exposures by Measurement Approach 5.3 & 6.1
7 (j) General Reserve for Credit Losses 7.6
8 (b) Credit Risk Exposures by Risk Weight 6.2
9 (d) Credit Risk Exposures by Risk Grade 6.3
9 (e) Provisions by Counterparty Type 7.4
9 (f) Analysis of Expected Credit Model Performance versus Actual Results 7.8
10 (b) & (c) Exposures Mitigated by Eligible Collateral 8.2
11 (b) Credit Equivalent Amounts for Counterparty Exposures 8.3
11 (c) Notional Amount of Credit Derivatives 8.3
12 (g) & (o) Originating ADI Securitisation Exposures 9.2.1
12 (h) Performance of Assets Securitised 9.2.2
12 (i) & (p) Summary of Outstanding Exposures Intended to be Securitised 9.2.3
12 (j), (q) & (r) Securitisation Activity 9.2.4
12 (k) & (s) Exposure by Type of Asset 9.3.1
12 (l) Exposure by Risk Weight Band – Banking Book 9.3.2
12 (t) Exposure by Risk Weight Band – Trading Book 9.3.2
12 (u) RWA by Risk Weight Band – Trading Book 9.3.2
12 (n) & (w) Re-securitisation Exposure 9.3.3
13 (b) Debt Security Specific Risk Figures 12.2.3
14 (f) Value at Risk Figures 12.2.1
14 (f) Stressed Value at Risk Figures 12.2.2
16 (b) & (c) Equity Investments 13.2
16 (d) & (e) Gains and Losses on Equity Investments 13.4
16 (f) Capital Requirements Arising from Equity Risks 13.3
17 (b) Interest Rate Risk in the Banking Book 12.2.4
Attachment E
18 Leverage Ratio Disclosure Template 15.1
19 Summary Comparison of Accounting Assets versus Leverage Ratio Exposure Measure 15.2
Attachment F
20 Liquidity Coverage Ratio Disclosure Template 16.0
21 Net Stable Funding Ratio Disclosure Template 17.0
Attachment G
22 Annual Remuneration Disclosure Appendix 3
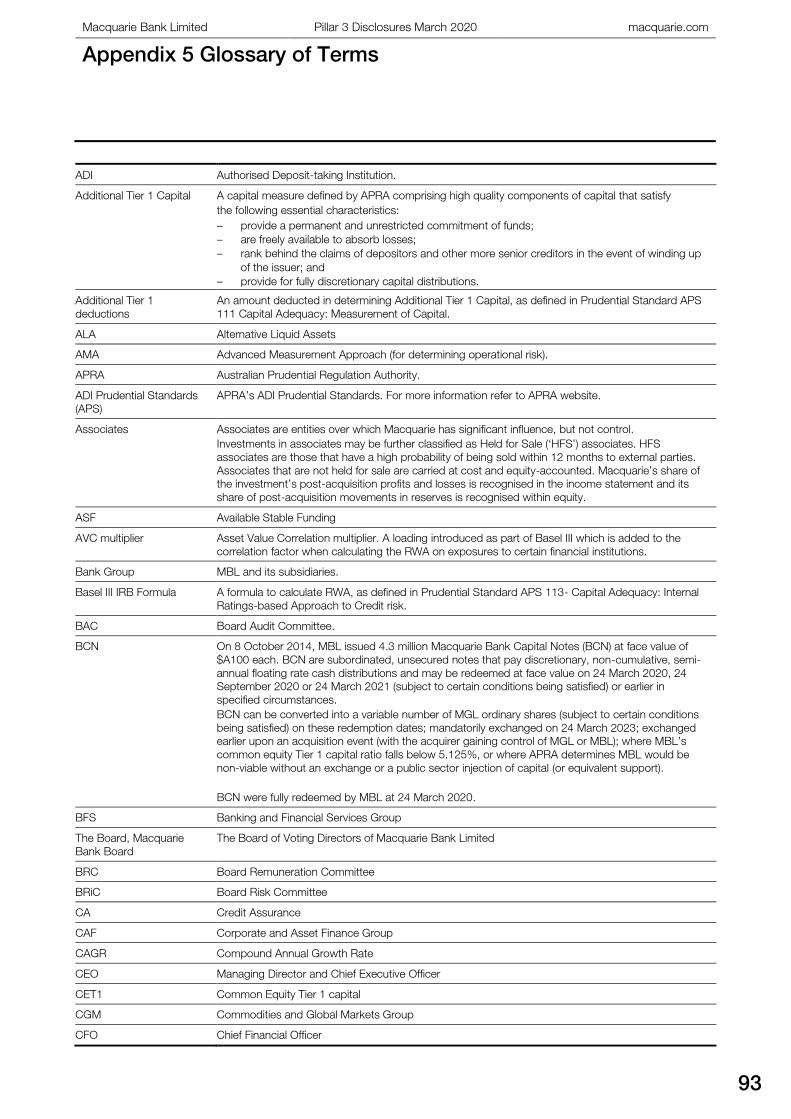
Macquarie Bank Limited Pillar 3 Disclosures March 2020 macquarie.com
Appendix 5 Glossary of Terms
93
Appendix 5 Glossary of Terms
ADI Authorised Deposit-taking Institution.
Additional Tier 1 Capital A capital measure defined by APRA comprising high quality components of capital that satisfy
the following essential characteristics:
– provide a permanent and unrestricted commitment of funds;
– are freely available to absorb losses;
– rank behind the claims of depositors and other more senior creditors in the event of winding up
of the issuer; and
– provide for fully discretionary capital distributions.
Additional Tier 1
deductions
An amount deducted in determining Additional Tier 1 Capital, as defined in Prudential Standard APS
111 Capital Adequacy: Measurement of Capital.
ALA Alternative Liquid Assets
AMA Advanced Measurement Approach (for determining operational risk).
APRA Australian Prudential Regulation Authority.
ADI Prudential Standards
(APS)
APRA’s ADI Prudential Standards. For more information refer to APRA website.
Associates Associates are entities over which Macquarie has significant influence, but not control.
Investments in associates may be further classified as Held for Sale (‘HFS’) associates. HFS
associates are those that have a high probability of being sold within 12 months to external parties.
Associates that are not held for sale are carried at cost and equity-accounted. Macquarie’s share of
the investment’s post-acquisition profits and losses is recognised in the income statement and its
share of post-acquisition movements in reserves is recognised within equity.
ASF Available Stable Funding
AVC multiplier Asset Value Correlation multiplier. A loading introduced as part of Basel III which is added to the
correlation factor when calculating the RWA on exposures to certain financial institutions.
Bank Group MBL and its subsidiaries.
Basel III IRB Formula A formula to calculate RWA, as defined in Prudential Standard APS 113- Capital Adequacy: Internal
Ratings-based Approach to Credit risk.
BAC Board Audit Committee.
BCN On 8 October 2014, MBL issued 4.3 million Macquarie Bank Capital Notes (BCN) at face value of
$A100 each. BCN are subordinated, unsecured notes that pay discretionary, non-cumulative, semi-
annual floating rate cash distributions and may be redeemed at face value on 24 March 2020, 24
September 2020 or 24 March 2021 (subject to certain conditions being satisfied) or earlier in
specified circumstances.
BCN can be converted into a variable number of MGL ordinary shares (subject to certain conditions
being satisfied) on these redemption dates; mandatorily exchanged on 24 March 2023; exchanged
earlier upon an acquisition event (with the acquirer gaining control of MGL or MBL); where MBL’s
common equity Tier 1 capital ratio falls below 5.125%, or where APRA determines MBL would be
non-viable without an exchange or a public sector injection of capital (or equivalent support).
BCN were fully redeemed by MBL at 24 March 2020.
BFS Banking and Financial Services Group
The Board, Macquarie
Bank Board
The Board of Voting Directors of Macquarie Bank Limited
BRC Board Remuneration Committee
BRiC Board Risk Committee
CA Credit Assurance
CAF Corporate and Asset Finance Group
CAGR Compound Annual Growth Rate
CEO Managing Director and Chief Executive Officer
CET1 Common Equity Tier 1 capital
CGM Commodities and Global Markets Group
CFO Chief Financial Officer
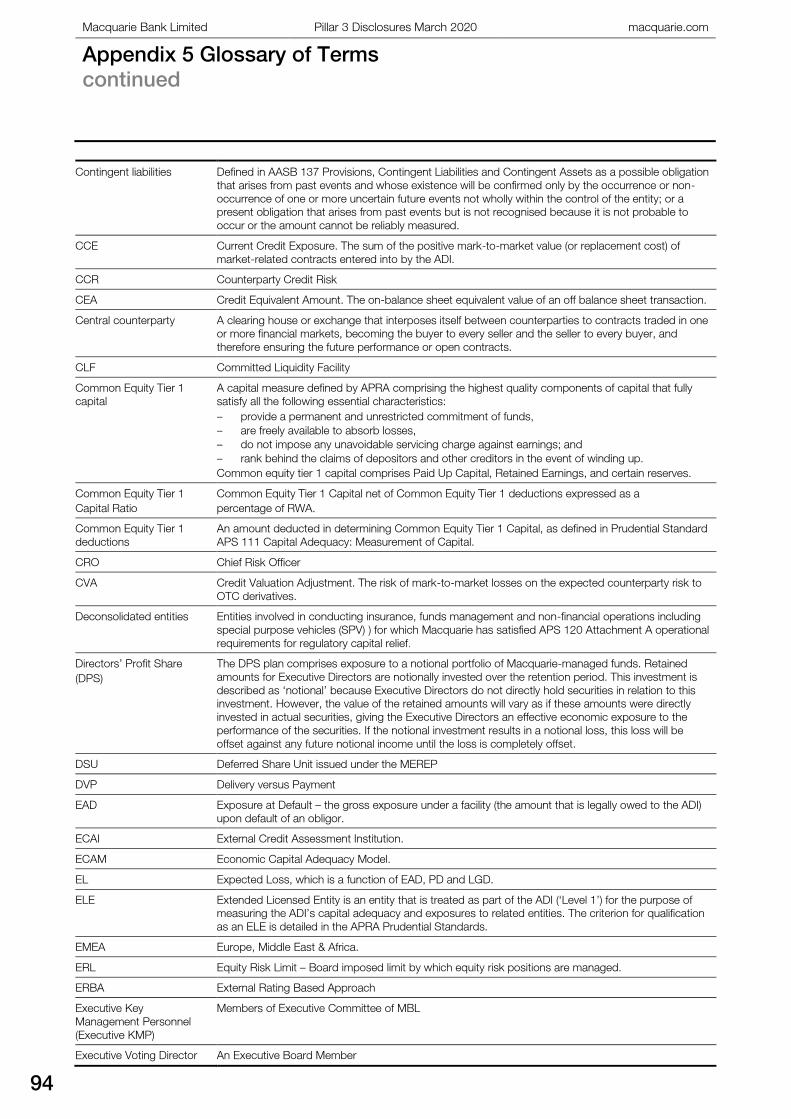
Macquarie Bank Limited Pillar 3 Disclosures March 2020 macquarie.com
Appendix 5 Glossary of Terms
continued
94
Contingent liabilities Defined in AASB 137 Provisions, Contingent Liabilities and Contingent Assets as a possible obligation
that arises from past events and whose existence will be confirmed only by the occurrence or non-
occurrence of one or more uncertain future events not wholly within the control of the entity; or a
present obligation that arises from past events but is not recognised because it is not probable to
occur or the amount cannot be reliably measured.
CCE Current Credit Exposure. The sum of the positive mark-to-market value (or replacement cost) of
market-related contracts entered into by the ADI.
CCR Counterparty Credit Risk
CEA Credit Equivalent Amount. The on-balance sheet equivalent value of an off balance sheet transaction.
Central counterparty A clearing house or exchange that interposes itself between counterparties to contracts traded in one
or more financial markets, becoming the buyer to every seller and the seller to every buyer, and
therefore ensuring the future performance or open contracts.
CLF Committed Liquidity Facility
Common Equity Tier 1
capital
A capital measure defined by APRA comprising the highest quality components of capital that fully
satisfy all the following essential characteristics:
– provide a permanent and unrestricted commitment of funds,
– are freely available to absorb losses,
– do not impose any unavoidable servicing charge against earnings; and
– rank behind the claims of depositors and other creditors in the event of winding up.
Common equity tier 1 capital comprises Paid Up Capital, Retained Earnings, and certain reserves.
Common Equity Tier 1
Capital Ratio
Common Equity Tier 1 Capital net of Common Equity Tier 1 deductions expressed as a
percentage of RWA.
Common Equity Tier 1
deductions
An amount deducted in determining Common Equity Tier 1 Capital, as defined in Prudential Standard
APS 111 Capital Adequacy: Measurement of Capital.
CRO Chief Risk Officer
CVA Credit Valuation Adjustment. The risk of mark-to-market losses on the expected counterparty risk to
OTC derivatives.
Deconsolidated entities Entities involved in conducting insurance, funds management and non-financial operations including
special purpose vehicles (SPV) ) for which Macquarie has satisfied APS 120 Attachment A operational
requirements for regulatory capital relief.
Directors’ Profit Share
(DPS)
The DPS plan comprises exposure to a notional portfolio of Macquarie-managed funds. Retained
amounts for Executive Directors are notionally invested over the retention period. This investment is
described as ‘notional’ because Executive Directors do not directly hold securities in relation to this
investment. However, the value of the retained amounts will vary as if these amounts were directly
invested in actual securities, giving the Executive Directors an effective economic exposure to the
performance of the securities. If the notional investment results in a notional loss, this loss will be
offset against any future notional income until the loss is completely offset.
DSU Deferred Share Unit issued under the MEREP
DVP Delivery versus Payment
EAD Exposure at Default – the gross exposure under a facility (the amount that is legally owed to the ADI)
upon default of an obligor.
ECAI External Credit Assessment Institution.
ECAM Economic Capital Adequacy Model.
EL Expected Loss, which is a function of EAD, PD and LGD.
ELE Extended Licensed Entity is an entity that is treated as part of the ADI (‘Level 1’) for the purpose of
measuring the ADI’s capital adequacy and exposures to related entities. The criterion for qualification
as an ELE is detailed in the APRA Prudential Standards.
EMEA Europe, Middle East & Africa.
ERL Equity Risk Limit – Board imposed limit by which equity risk positions are managed.
ERBA External Rating Based Approach
Executive Key
Management Personnel
(Executive KMP)
Members of Executive Committee of MBL
Executive Voting Director An Executive Board Member
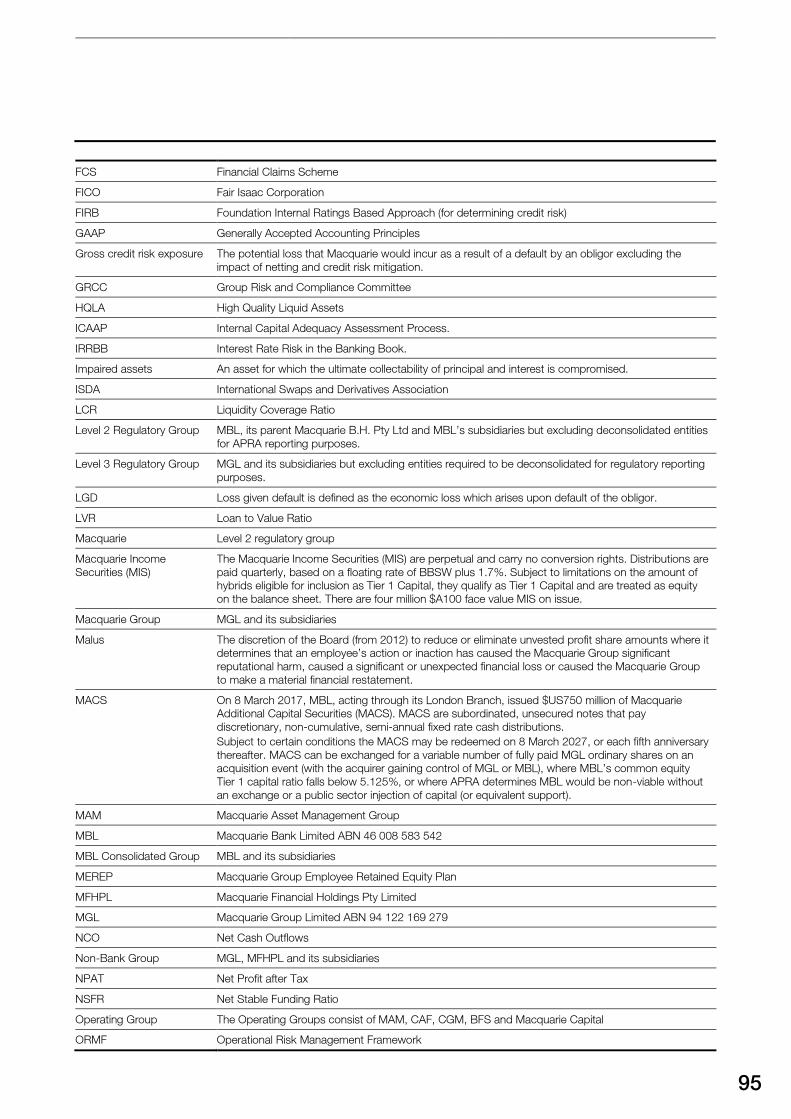
95
FCS Financial Claims Scheme
FICO Fair Isaac Corporation
FIRB Foundation Internal Ratings Based Approach (for determining credit risk)
GAAP Generally Accepted Accounting Principles
Gross credit risk exposure The potential loss that Macquarie would incur as a result of a default by an obligor excluding the
impact of netting and credit risk mitigation.
GRCC Group Risk and Compliance Committee
HQLA High Quality Liquid Assets
ICAAP Internal Capital Adequacy Assessment Process.
IRRBB Interest Rate Risk in the Banking Book.
Impaired assets An asset for which the ultimate collectability of principal and interest is compromised.
ISDA International Swaps and Derivatives Association
LCR Liquidity Coverage Ratio
Level 2 Regulatory Group MBL, its parent Macquarie B.H. Pty Ltd and MBL’s subsidiaries but excluding deconsolidated entities
for APRA reporting purposes.
Level 3 Regulatory Group MGL and its subsidiaries but excluding entities required to be deconsolidated for regulatory reporting
purposes.
LGD Loss given default is defined as the economic loss which arises upon default of the obligor.
LVR Loan to Value Ratio
Macquarie Level 2 regulatory group
Macquarie Income
Securities (MIS)
The Macquarie Income Securities (MIS) are perpetual and carry no conversion rights. Distributions are
paid quarterly, based on a floating rate of BBSW plus 1.7%. Subject to limitations on the amount of
hybrids eligible for inclusion as Tier 1 Capital, they qualify as Tier 1 Capital and are treated as equity
on the balance sheet. There are four million $A100 face value MIS on issue.
Macquarie Group MGL and its subsidiaries
Malus The discretion of the Board (from 2012) to reduce or eliminate unvested profit share amounts where it
determines that an employee’s action or inaction has caused the Macquarie Group significant
reputational harm, caused a significant or unexpected financial loss or caused the Macquarie Group
to make a material financial restatement.
MACS On 8 March 2017, MBL, acting through its London Branch, issued $US750 million of Macquarie
Additional Capital Securities (MACS). MACS are subordinated, unsecured notes that pay
discretionary, non-cumulative, semi-annual fixed rate cash distributions.
Subject to certain conditions the MACS may be redeemed on 8 March 2027, or each fifth anniversary
thereafter. MACS can be exchanged for a variable number of fully paid MGL ordinary shares on an
acquisition event (with the acquirer gaining control of MGL or MBL), where MBL’s common equity
Tier 1 capital ratio falls below 5.125%, or where APRA determines MBL would be non-viable without
an exchange or a public sector injection of capital (or equivalent support).
MAM Macquarie Asset Management Group
MBL Macquarie Bank Limited ABN 46 008 583 542
MBL Consolidated Group MBL and its subsidiaries
MEREP Macquarie Group Employee Retained Equity Plan
MFHPL Macquarie Financial Holdings Pty Limited
MGL Macquarie Group Limited ABN 94 122 169 279
NCO Net Cash Outflows
Non-Bank Group MGL, MFHPL and its subsidiaries
NPAT Net Profit after Tax
NSFR Net Stable Funding Ratio
Operating Group The Operating Groups consist of MAM, CAF, CGM, BFS and Macquarie Capital
ORMF Operational Risk Management Framework
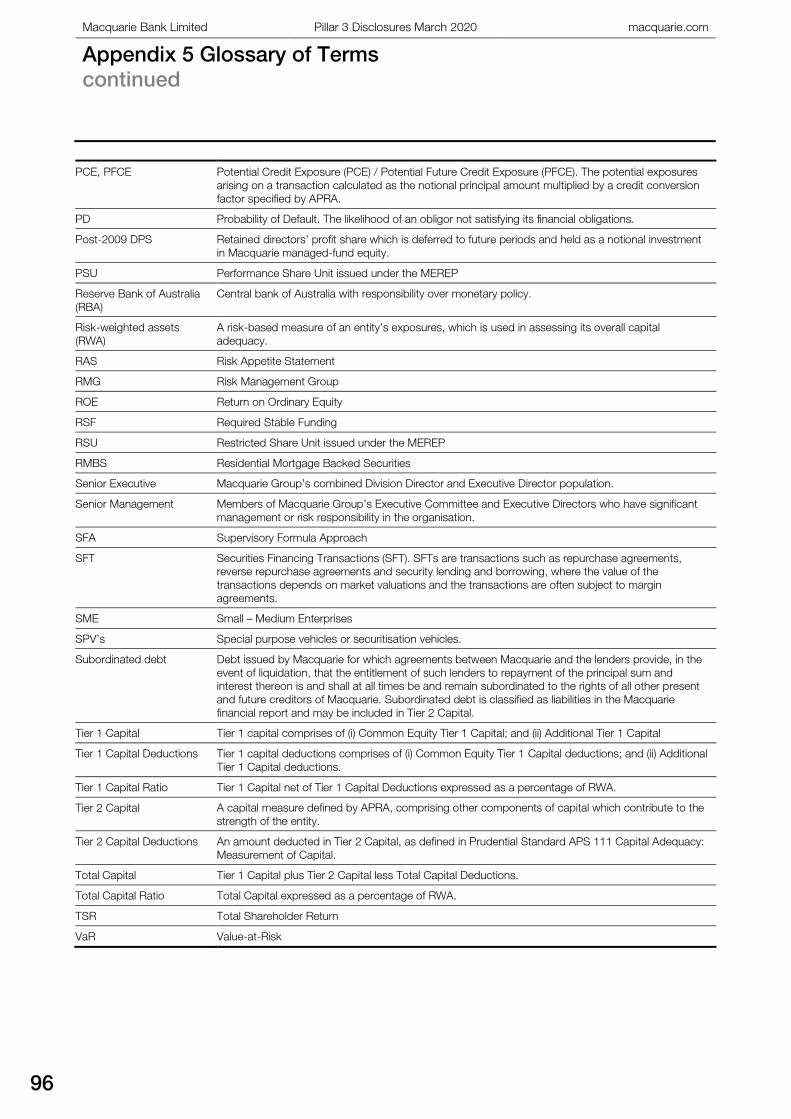
Macquarie Bank Limited Pillar 3 Disclosures March 2020 macquarie.com
Appendix 5 Glossary of Terms
continued
96
PCE, PFCE Potential Credit Exposure (PCE) / Potential Future Credit Exposure (PFCE). The potential exposures
arising on a transaction calculated as the notional principal amount multiplied by a credit conversion
factor specified by APRA.
PD Probability of Default. The likelihood of an obligor not satisfying its financial obligations.
Post-2009 DPS Retained directors’ profit share which is deferred to future periods and held as a notional investment
in Macquarie managed-fund equity.
PSU Performance Share Unit issued under the MEREP
Reserve Bank of Australia
(RBA)
Central bank of Australia with responsibility over monetary policy.
Risk-weighted assets
(RWA)
A risk-based measure of an entity’s exposures, which is used in assessing its overall capital
adequacy.
RAS Risk Appetite Statement
RMG Risk Management Group
ROE Return on Ordinary Equity
RSF Required Stable Funding
RSU Restricted Share Unit issued under the MEREP
RMBS Residential Mortgage Backed Securities
Senior Executive Macquarie Group’s combined Division Director and Executive Director population.
Senior Management Members of Macquarie Group’s Executive Committee and Executive Directors who have significant
management or risk responsibility in the organisation.
SFA Supervisory Formula Approach
SFT Securities Financing Transactions (SFT). SFTs are transactions such as repurchase agreements,
reverse repurchase agreements and security lending and borrowing, where the value of the
transactions depends on market valuations and the transactions are often subject to margin
agreements.
SME Small – Medium Enterprises
SPV’s Special purpose vehicles or securitisation vehicles.
Subordinated debt Debt issued by Macquarie for which agreements between Macquarie and the lenders provide, in the
event of liquidation, that the entitlement of such lenders to repayment of the principal sum and
interest thereon is and shall at all times be and remain subordinated to the rights of all other present
and future creditors of Macquarie. Subordinated debt is classified as liabilities in the Macquarie
financial report and may be included in Tier 2 Capital.
Tier 1 Capital Tier 1 capital comprises of (i) Common Equity Tier 1 Capital; and (ii) Additional Tier 1 Capital
Tier 1 Capital Deductions Tier 1 capital deductions comprises of (i) Common Equity Tier 1 Capital deductions; and (ii) Additional
Tier 1 Capital deductions.
Tier 1 Capital Ratio Tier 1 Capital net of Tier 1 Capital Deductions expressed as a percentage of RWA.
Tier 2 Capital A capital measure defined by APRA, comprising other components of capital which contribute to the
strength of the entity.
Tier 2 Capital Deductions An amount deducted in Tier 2 Capital, as defined in Prudential Standard APS 111 Capital Adequacy:
Measurement of Capital.
Total Capital Tier 1 Capital plus Tier 2 Capital less Total Capital Deductions.
Total Capital Ratio Total Capital expressed as a percentage of RWA.
TSR Total Shareholder Return
VaR Value-at-Risk

This page has been intentionally left blank.