pillar 3 mid-year disclosures (ocbc group as at 30 june 2016) and... · pillar 3 mid-year...
TRANSCRIPT

Oversea-Chinese Banking Corporation Limited
Pillar 3 Mid-Year Disclosures (OCBC Group – As at 30 June 2016)
Incorporated in Singapore
Company Registration Number: 193200032W
Pillar 3 Mid-Year Disclosures June 2016 2
1. INTRODUCTION
The purpose of this document is to provide the information in accordance with Pillar 3 directives under
Monetary Authority of Singapore (“MAS”) Notice 637 on Risk Based Capital Adequacy Requirements
for banks incorporated in Singapore. MAS Notice 637 mandates a minimum level of public disclosures
to be made available to market participants to assist them in assessing the capital adequacy and risk
profile of a bank.
For qualitative descriptions of OCBC Group’s (“Group’s”) capital and risk management objectives and
policies, and disclosures on remuneration, please refer to the Capital Management, Risk
Management and Corporate Governance sections of the 2015 Annual Report.
2. ACCOUNTING AND REGULATORY CONSOLIDATION
The consolidation basis used for regulatory capital computation is similar to that used for financial
reporting except for the following:
Subsidiaries that carry out insurance business are excluded from regulatory consolidation and are treated as investments in major stake companies. The regulatory adjustments applied to these investments are in accordance to MAS Notice 637 paragraphs 6.1.3(p), 6.2.3(e) and 6.3.3(e).
As at 30 June 2016, the subsidiaries that carry out insurance business are as follows: The Great Eastern Life Assurance Company Limited and its insurance entities The Overseas Assurance Corporation Limited and its insurance entities
As at 30 June 2016, the total equity of these insurance subsidiaries was S$7b and total
assets were S$65b.
The basis of consolidation for financial reporting can be found in Note 2.2 in the Notes to the Financial Statements for the year ended 31 December 2015.
3. CAPITAL ADEQUACY
Disclosure on the Group’s capital adequacy ratios and the capital positions for the Group’s significant
banking subsidiaries as at 30 June 2016 are presented in the Capital Adequacy Ratios section of the
Second Quarter 2016 Financial Results. (http://www.ocbc.com/group/investors/index.html)
Disclosures on the composition of the Group’s regulatory capital, including reconciliation between
balance sheet and regulatory capital elements, as well as terms and conditions and main features of
capital instruments can be found under the Capital and Regulatory Disclosures sections of the Bank’s
investor relations website. (http://www.ocbc.com/group/investors/Cap_and_Reg_Disclosures.html)
Disclosures on the Group’s leverage ratio are presented in the Leverage Ratio section of the Second
Quarter 2016 Financial Results (http://www.ocbc.com/group/investors/index.html) and under the Capital and
Regulatory Disclosures section of the Bank’s investor relations website. (http://www.ocbc.com/group/investors/Cap_and_Reg_Disclosures.html)
Pillar 3 Mid-Year Disclosures June 2016 3
4. CREDIT RISK
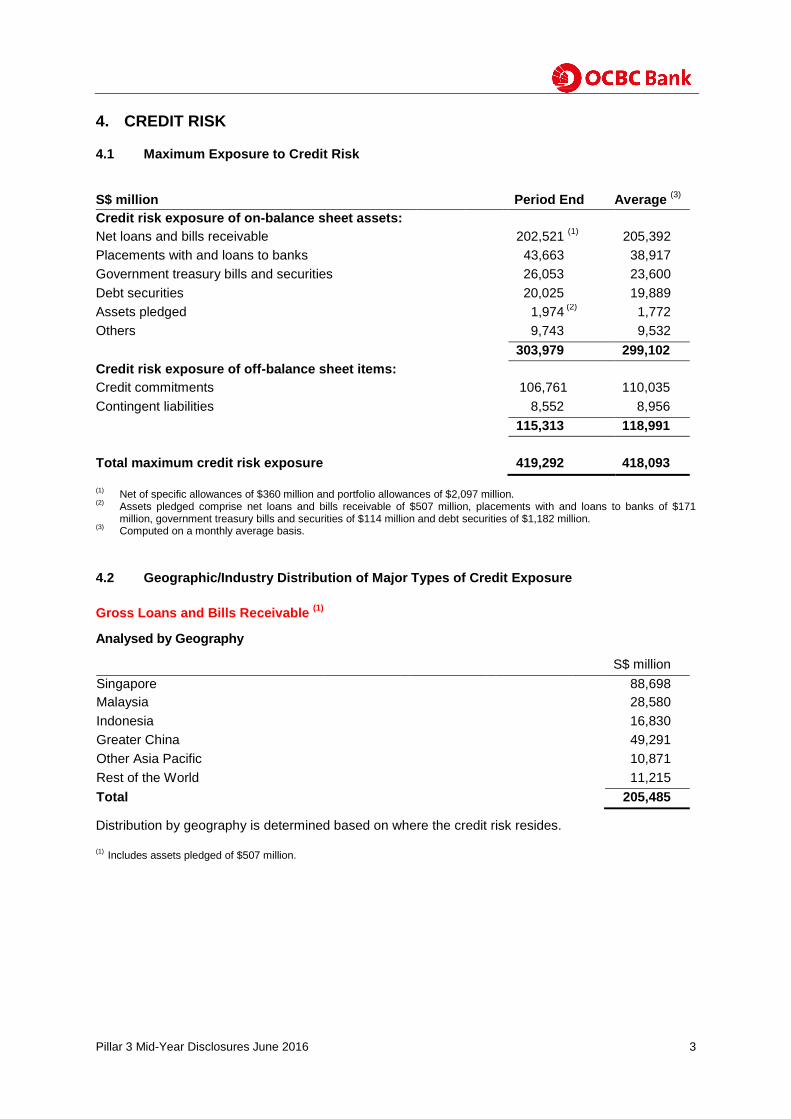
4.1 Maximum Exposure to Credit Risk
S$ million
Period End Average (3)
Credit risk exposure of on-balance sheet assets:
Net loans and bills receivable 202,521 (1)
205,392
Placements with and loans to banks 43,663 38,917
Government treasury bills and securities 26,053 23,600
Debt securities 20,025 19,889
Assets pledged 1,974 (2)
1,772
Others 9,743 9,532
303,979 299,102
Credit risk exposure of off-balance sheet items:
Credit commitments 106,761 110,035
Contingent liabilities 8,552 8,956
115,313 118,991
Total maximum credit risk exposure 419,292 418,093
(1)
Net of specific allowances of $360 million and portfolio allowances of $2,097 million. (2)
Assets pledged comprise net loans and bills receivable of $507 million, placements with and loans to banks of $171 million, government treasury bills and securities of $114 million and debt securities of $1,182 million.
(3) Computed on a monthly average basis.
4.2 Geographic/Industry Distribution of Major Types of Credit Exposure
Gross Loans and Bills Receivable (1)
Analysed by Geography
S$ million
Singapore 88,698
Malaysia 28,580
Indonesia 16,830
Greater China 49,291
Other Asia Pacific 10,871
Rest of the World 11,215
Total 205,485
Distribution by geography is determined based on where the credit risk resides.
(1) Includes assets pledged of $507 million.
Pillar 3 Mid-Year Disclosures June 2016 4
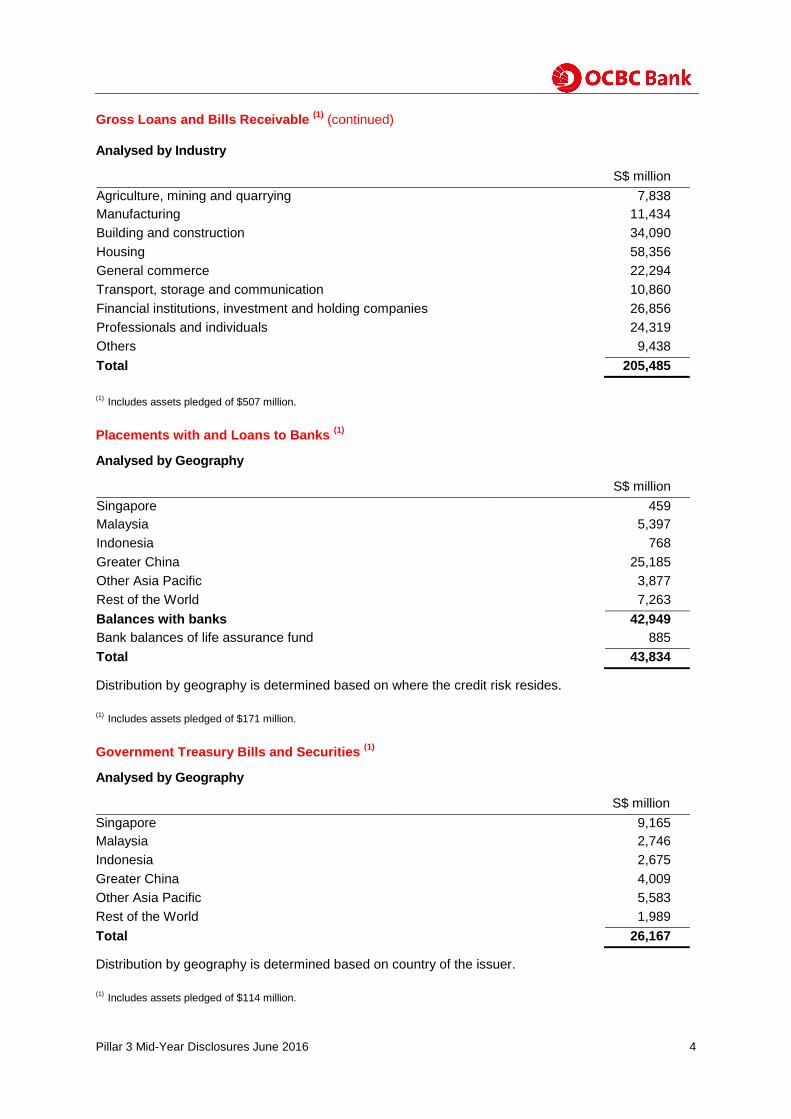
Gross Loans and Bills Receivable (1)
(continued)
Analysed by Industry
S$ million
Agriculture, mining and quarrying 7,838
Manufacturing 11,434
Building and construction 34,090
Housing 58,356
General commerce 22,294
Transport, storage and communication 10,860
Financial institutions, investment and holding companies 26,856
Professionals and individuals 24,319
Others 9,438
Total 205,485
(1)
Includes assets pledged of $507 million.
Placements with and Loans to Banks (1)
Analysed by Geography
S$ million
Singapore 459
Malaysia 5,397
Indonesia 768
Greater China 25,185
Other Asia Pacific 3,877
Rest of the World 7,263
Balances with banks 42,949
Bank balances of life assurance fund 885
Total 43,834
Distribution by geography is determined based on where the credit risk resides.
(1)
Includes assets pledged of $171 million.
Government Treasury Bills and Securities (1)
Analysed by Geography
S$ million
Singapore 9,165
Malaysia 2,746
Indonesia 2,675
Greater China 4,009
Other Asia Pacific 5,583
Rest of the World 1,989
Total 26,167
Distribution by geography is determined based on country of the issuer.
(1)
Includes assets pledged of $114 million.
Pillar 3 Mid-Year Disclosures June 2016 5
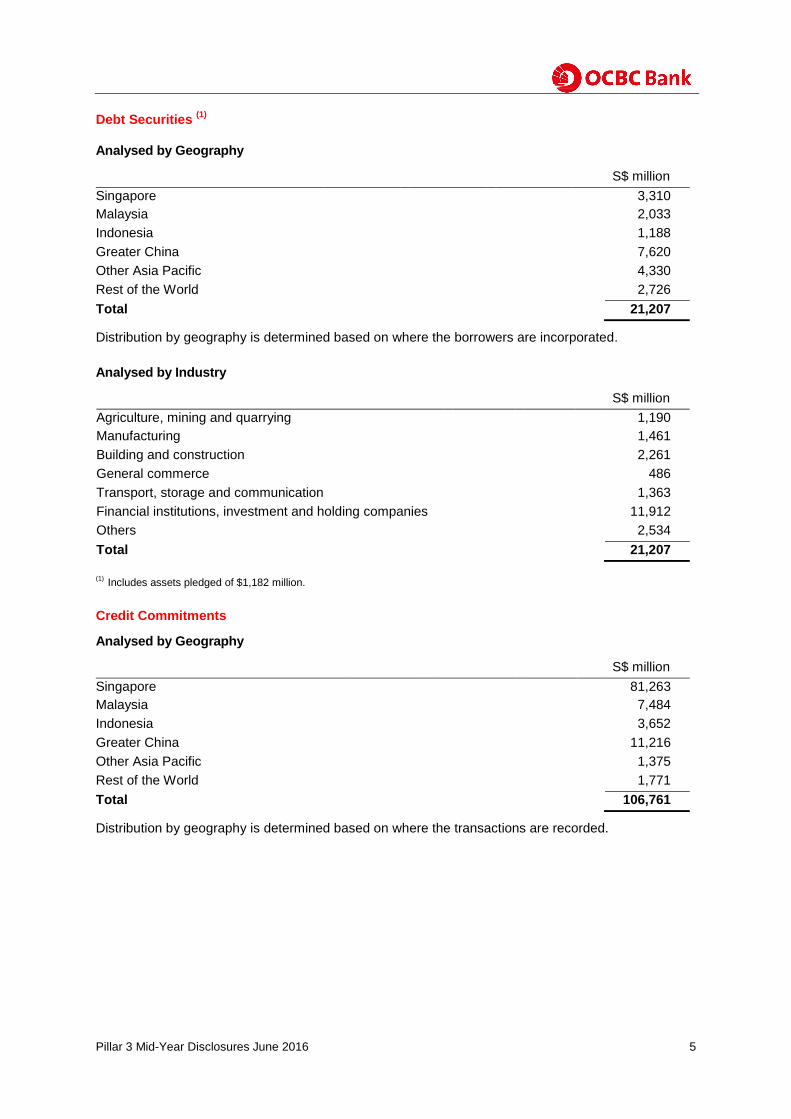
Debt Securities (1)
Analysed by Geography
S$ million
Singapore 3,310
Malaysia 2,033
Indonesia 1,188
Greater China 7,620
Other Asia Pacific 4,330
Rest of the World 2,726
Total 21,207
Distribution by geography is determined based on where the borrowers are incorporated.
Analysed by Industry
S$ million
Agriculture, mining and quarrying 1,190
Manufacturing 1,461
Building and construction 2,261
General commerce 486
Transport, storage and communication 1,363
Financial institutions, investment and holding companies 11,912
Others 2,534
Total 21,207
(1) Includes assets pledged of $1,182 million.
Credit Commitments
Analysed by Geography
S$ million
Singapore 81,263
Malaysia 7,484
Indonesia 3,652
Greater China 11,216
Other Asia Pacific 1,375
Rest of the World 1,771
Total 106,761
Distribution by geography is determined based on where the transactions are recorded.
Pillar 3 Mid-Year Disclosures June 2016 6
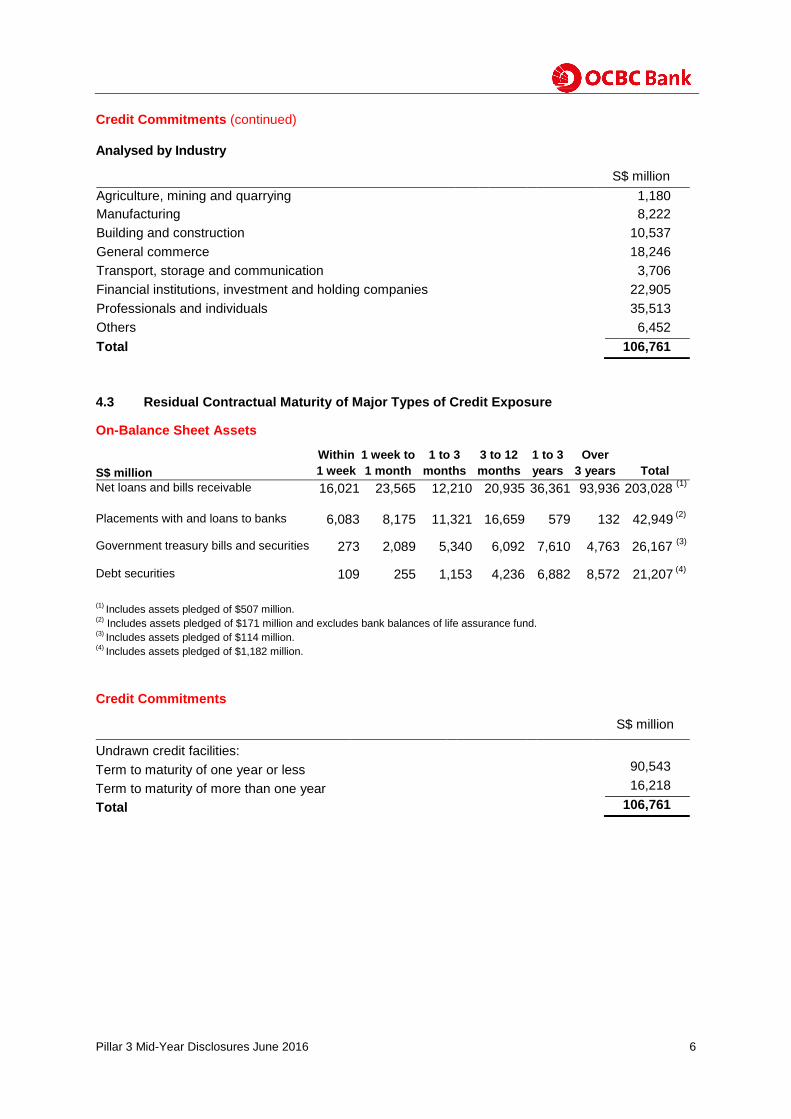
Credit Commitments (continued)
Analysed by Industry
S$ million
Agriculture, mining and quarrying 1,180
Manufacturing 8,222
Building and construction 10,537
General commerce 18,246
Transport, storage and communication 3,706
Financial institutions, investment and holding companies 22,905
Professionals and individuals 35,513
Others 6,452
Total 106,761
4.3 Residual Contractual Maturity of Major Types of Credit Exposure On-Balance Sheet Assets
S$ million
Within
1 week
1 week to
1 month
1 to 3
months
3 to 12
months
1 to 3
years
Over
3 years Total
Net loans and bills receivable 16,021 23,565 12,210 20,935 36,361 93,936 203,028 (1)
Placements with and loans to banks 6,083 8,175 11,321 16,659 579 132 42,949 (2)
Government treasury bills and securities 273 2,089 5,340 6,092 7,610 4,763 26,167 (3)
Debt securities 109 255 1,153 4,236 6,882 8,572 21,207 (4)
(1)
Includes assets pledged of $507 million. (2)
Includes assets pledged of $171 million and excludes bank balances of life assurance fund. (3)
Includes assets pledged of $114 million. (4)
Includes assets pledged of $1,182 million.
Credit Commitments
S$ million
Undrawn credit facilities:
Term to maturity of one year or less 90,543
Term to maturity of more than one year 16,218
Total 106,761
Pillar 3 Mid-Year Disclosures June 2016 7
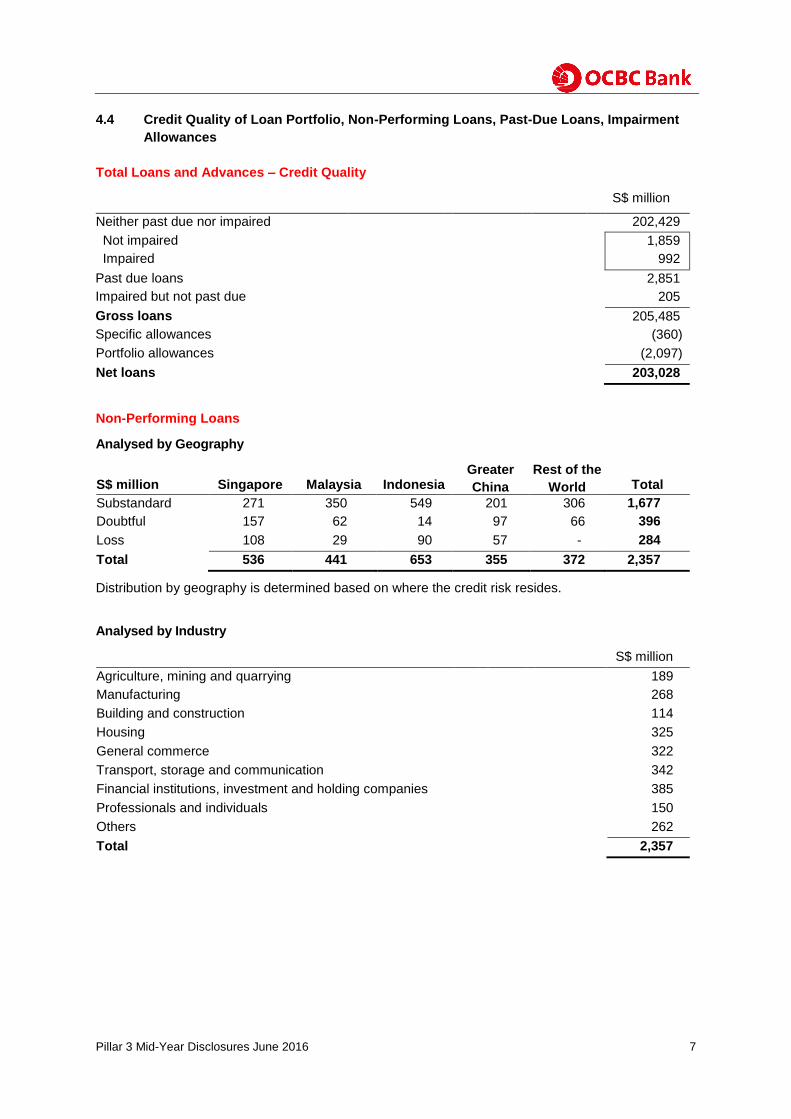
4.4 Credit Quality of Loan Portfolio, Non-Performing Loans, Past-Due Loans, Impairment
Allowances
Total Loans and Advances – Credit Quality
S$ million
Neither past due nor impaired 202,429
Not impaired 1,859
Impaired 992
Past due loans 2,851
Impaired but not past due 205
Gross loans 205,485
Specific allowances (360)
Portfolio allowances (2,097)
Net loans 203,028
Non-Performing Loans
Analysed by Geography
S$ million Singapore Malaysia Indonesia Greater
China
Rest of the
World Total
Substandard 271 350 549 201 306 1,677
Doubtful 157 62 14 97 66 396
Loss 108 29 90 57 - 284
Total 536 441 653 355 372 2,357
Distribution by geography is determined based on where the credit risk resides.
Analysed by Industry
S$ million
Agriculture, mining and quarrying 189
Manufacturing 268
Building and construction 114
Housing 325
General commerce 322
Transport, storage and communication 342
Financial institutions, investment and holding companies 385
Professionals and individuals 150
Others 262
Total 2,357
Pillar 3 Mid-Year Disclosures June 2016 8
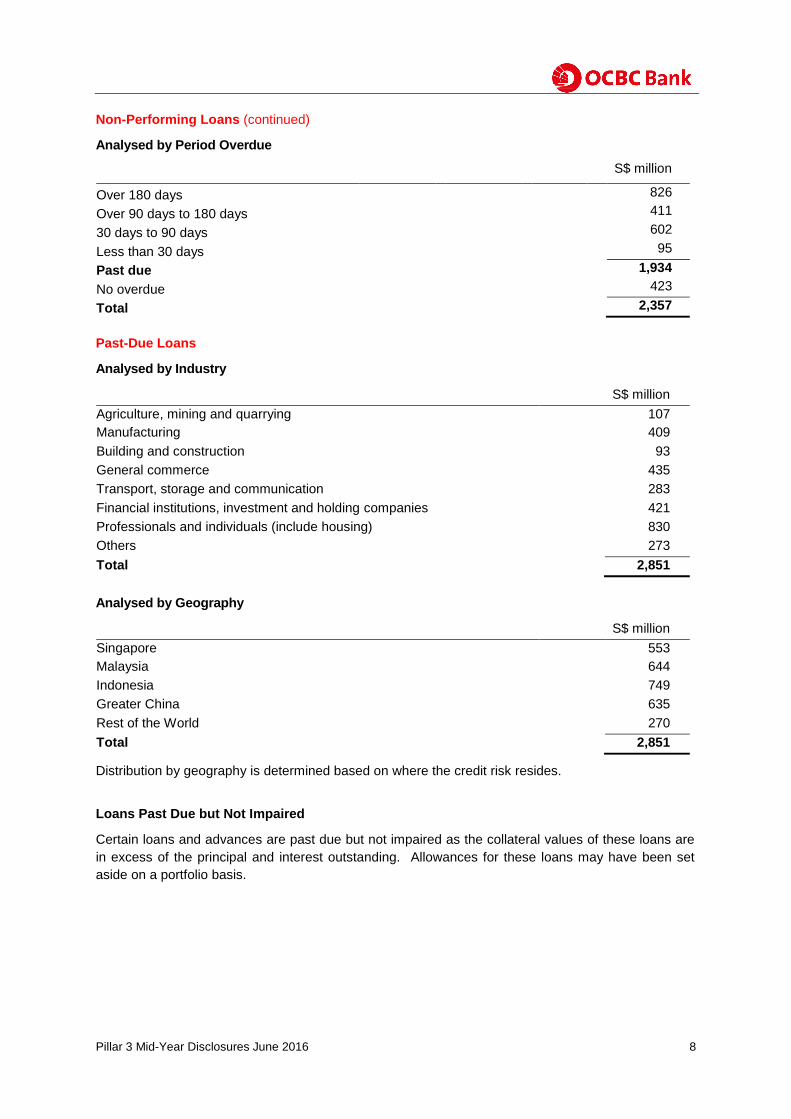
Non-Performing Loans (continued)
Analysed by Period Overdue
S$ million
Over 180 days 826
Over 90 days to 180 days 411
30 days to 90 days 602
Less than 30 days 95
Past due 1,934
No overdue 423
Total 2,357
Past-Due Loans
Analysed by Industry
S$ million
Agriculture, mining and quarrying 107
Manufacturing 409
Building and construction 93
General commerce 435
Transport, storage and communication 283
Financial institutions, investment and holding companies 421
Professionals and individuals (include housing) 830
Others 273
Total 2,851
Analysed by Geography
S$ million
Singapore 553
Malaysia 644
Indonesia 749
Greater China 635
Rest of the World 270
Total 2,851
Distribution by geography is determined based on where the credit risk resides.
Loans Past Due but Not Impaired
Certain loans and advances are past due but not impaired as the collateral values of these loans are
in excess of the principal and interest outstanding. Allowances for these loans may have been set
aside on a portfolio basis.
Pillar 3 Mid-Year Disclosures June 2016 9
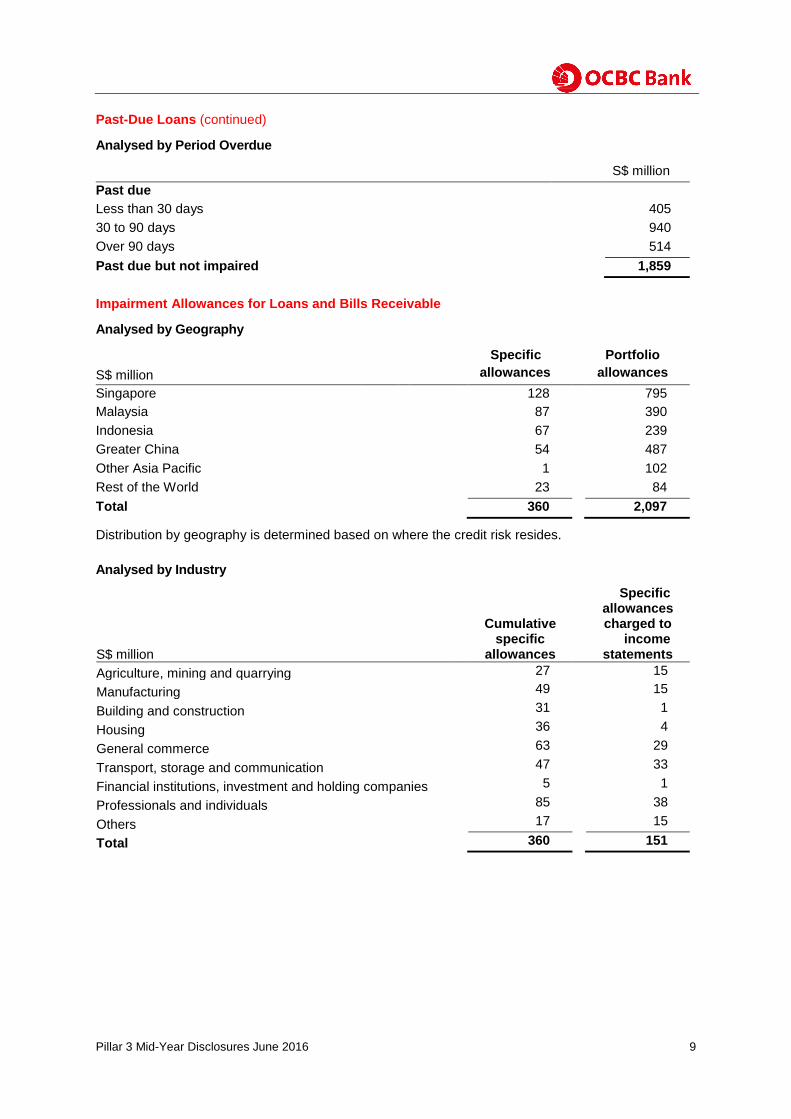
Past-Due Loans (continued)
Analysed by Period Overdue
S$ million
Past due
Less than 30 days 405
30 to 90 days 940
Over 90 days 514
Past due but not impaired 1,859
Impairment Allowances for Loans and Bills Receivable
Analysed by Geography
S$ million
Specific
allowances
Portfolio
allowances
Singapore 128 795
Malaysia 87 390
Indonesia 67 239
Greater China 54 487
Other Asia Pacific 1 102
Rest of the World 23 84
Total 360 2,097
Distribution by geography is determined based on where the credit risk resides.
Analysed by Industry
S$ million
Cumulative specific
allowances
Specific allowances charged to
income statements
Agriculture, mining and quarrying 27 15
Manufacturing 49 15
Building and construction 31 1
Housing 36 4
General commerce 63 29
Transport, storage and communication 47 33
Financial institutions, investment and holding companies 5 1
Professionals and individuals 85 38
Others 17 15
Total 360 151
Pillar 3 Mid-Year Disclosures June 2016 10
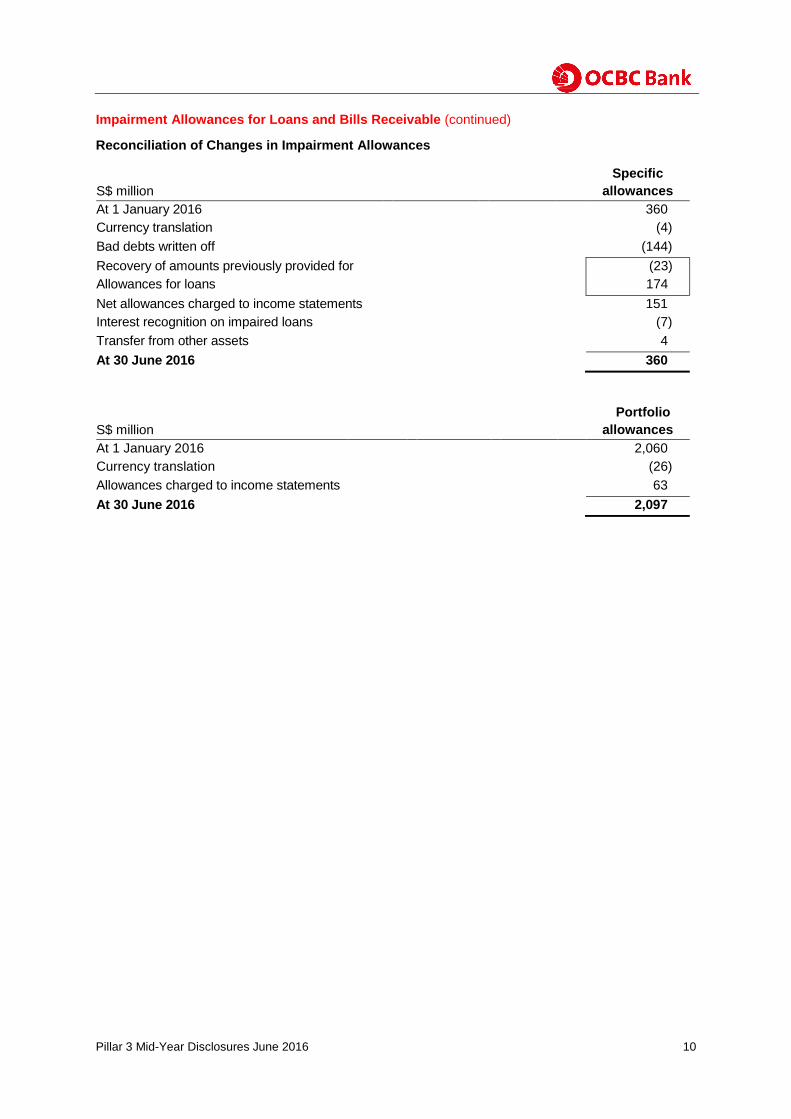
Impairment Allowances for Loans and Bills Receivable (continued)
Reconciliation of Changes in Impairment Allowances
S$ million Specific
allowances
At 1 January 2016 360
Currency translation (4)
Bad debts written off (144)
Recovery of amounts previously provided for (23)
Allowances for loans 174
Net allowances charged to income statements 151
Interest recognition on impaired loans (7)
Transfer from other assets 4
At 30 June 2016 360
S$ million
Portfolio
allowances
At 1 January 2016 2,060
Currency translation (26)
Allowances charged to income statements 63
At 30 June 2016 2,097
Pillar 3 Mid-Year Disclosures June 2016 11
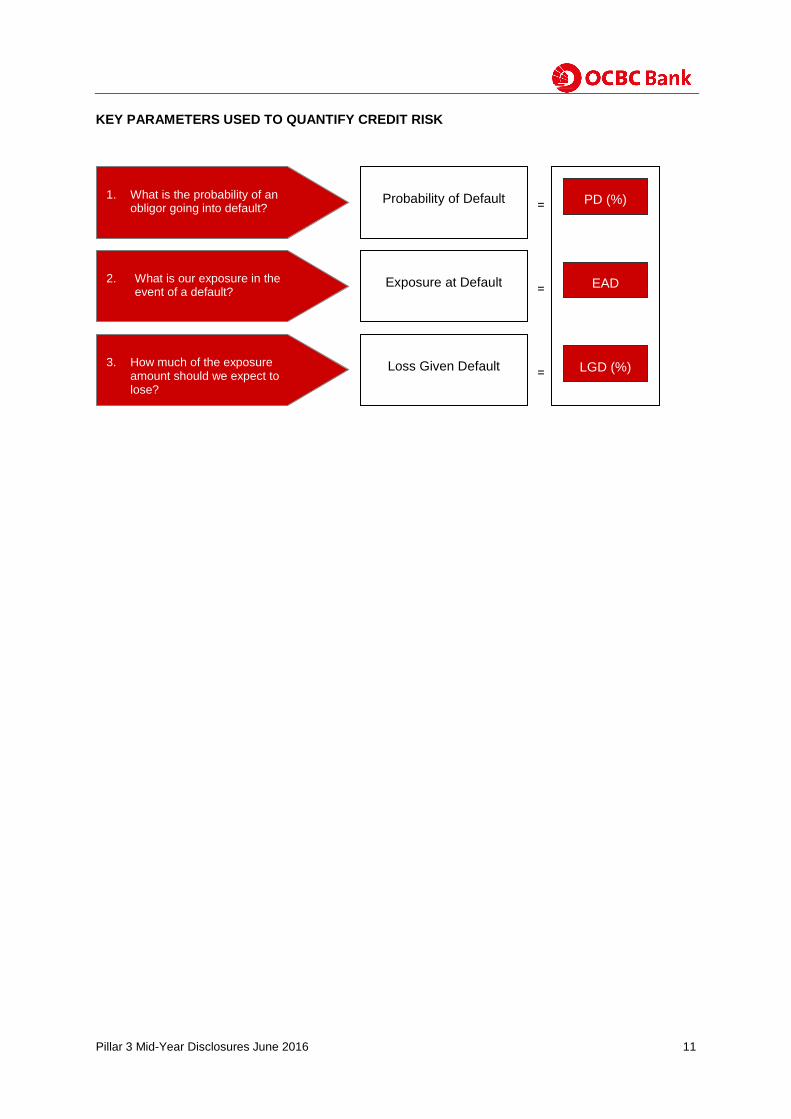
KEY PARAMETERS USED TO QUANTIFY CREDIT RISK
1. What is the probability of an obligor going into default?
2. What is our exposure in the event of a default?
3. How much of the exposure amount should we expect to lose?
Probability of Default
Exposure at Default
Loss Given Default
PD (%)
EAD
LGD (%)
=
=
=
3. What is our exposure in the event of a default?
2. What is our exposure in the event of a default?
Pillar 3 Mid-Year Disclosures June 2016 12
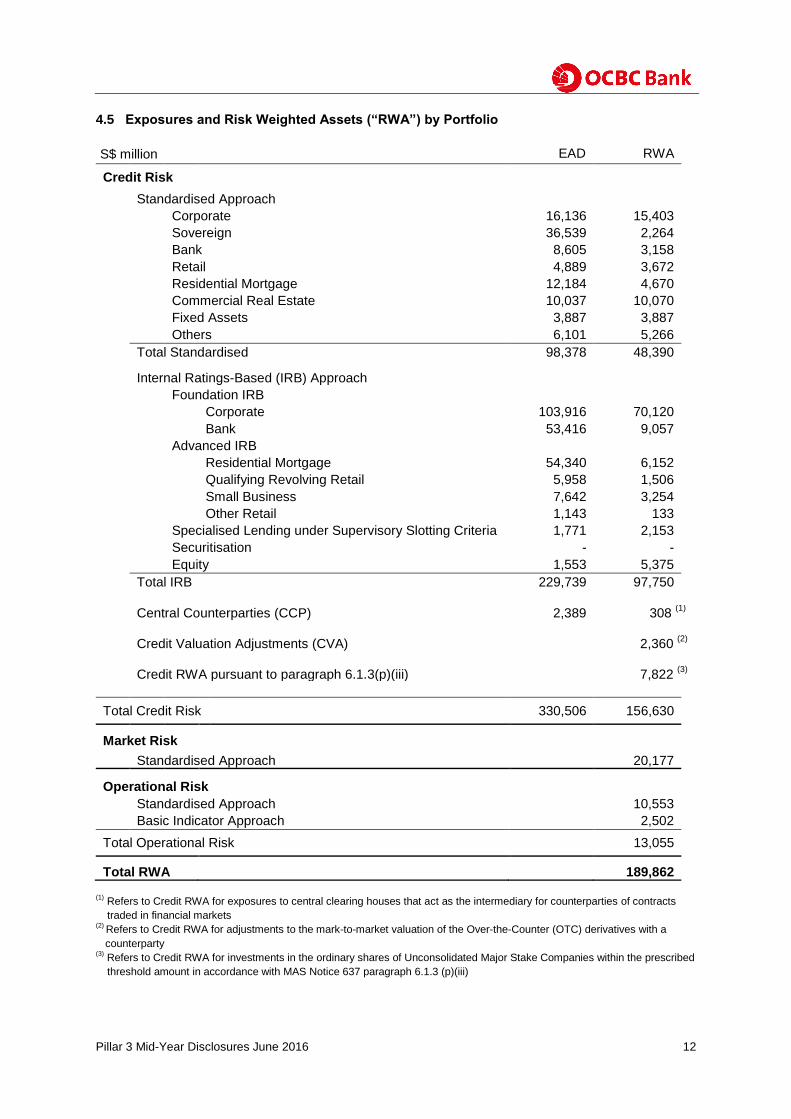
4.5 Exposures and Risk Weighted Assets (“RWA”) by Portfolio
EAD RWA
Credit Risk
Standardised Approach
Corporate 16,136 15,403
Sovereign 36,539 2,264
Bank 8,605 3,158
Retail 4,889 3,672
Residential Mortgage 12,184 4,670
Commercial Real Estate 10,037 10,070
Fixed Assets 3,887 3,887
Others 6,101 5,266
Total Standardised 98,378 48,390
Internal Ratings-Based (IRB) Approach
Foundation IRB
Corporate 103,916 70,120
Bank 53,416 9,057
Advanced IRB
Residential Mortgage 54,340 6,152
Qualifying Revolving Retail 5,958 1,506
Small Business 7,642 3,254
Other Retail 1,143 133
Specialised Lending under Supervisory Slotting Criteria 1,771 2,153
Securitisation - -
Equity 1,553 5,375
Total IRB
229,739 97,750
Central Counterparties (CCP) Credit Valuation Adjustments (CVA)
2,389
308 (1)
2,360 (2)
Credit RWA pursuant to paragraph 6.1.3(p)(iii)
7,822
(3)
Total Credit Risk 330,506 156,630
Market Risk
Standardised Approach 20,177
Operational Risk
Standardised Approach
10,553
Basic Indicator Approach 2,502
Total Operational Risk 13,055
Total RWA 189,862 (1)
Refers to Credit RWA for exposures to central clearing houses that act as the intermediary for counterparties of contracts
traded in financial markets (2)
Refers to Credit RWA for adjustments to the mark-to-market valuation of the Over-the-Counter (OTC) derivatives with a
counterparty (3)
Refers to Credit RWA for investments in the ordinary shares of Unconsolidated Major Stake Companies within the prescribed
threshold amount in accordance with MAS Notice 637 paragraph 6.1.3 (p)(iii)
S$ million
Pillar 3 Mid-Year Disclosures June 2016 13
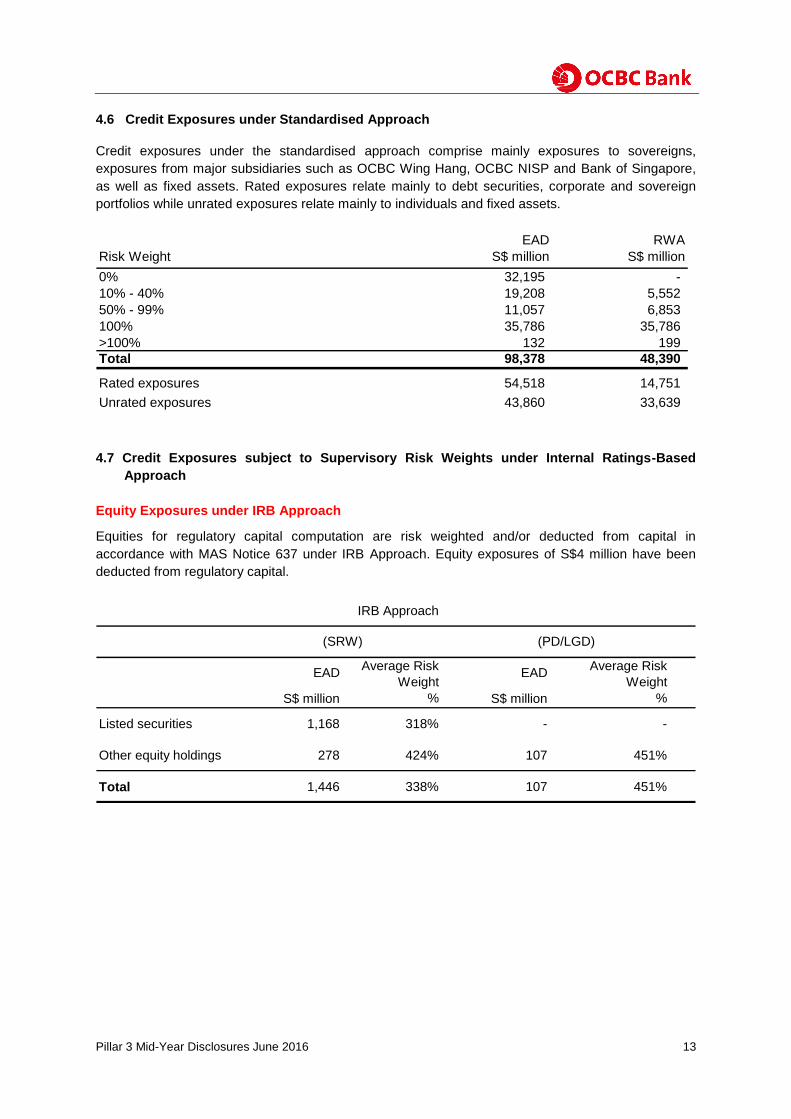
4.6 Credit Exposures under Standardised Approach
Credit exposures under the standardised approach comprise mainly exposures to sovereigns,
exposures from major subsidiaries such as OCBC Wing Hang, OCBC NISP and Bank of Singapore,
as well as fixed assets. Rated exposures relate mainly to debt securities, corporate and sovereign
portfolios while unrated exposures relate mainly to individuals and fixed assets.
4.7 Credit Exposures subject to Supervisory Risk Weights under Internal Ratings-Based
Approach
Equity Exposures under IRB Approach
Equities for regulatory capital computation are risk weighted and/or deducted from capital in
accordance with MAS Notice 637 under IRB Approach. Equity exposures of S$4 million have been
deducted from regulatory capital.
EAD RWA
Risk Weight S$ million S$ million
0% 32,195 -
10% - 40% 19,208 5,552
50% - 99% 11,057 6,853
100% 35,786 35,786
>100% 132 199
Total 98,378 48,390
Rated exposures 54,518 14,751
Unrated exposures 43,860 33,639
IRB Approach
S$ million S$ million
Listed securities 1,168 318% - -
Other equity holdings 278 424% 107 451%
Total 1,446 338% 107 451%
Average Risk
Weight
%
(SRW) (PD/LGD)
EADAverage Risk
Weight
%
EAD
Pillar 3 Mid-Year Disclosures June 2016 14
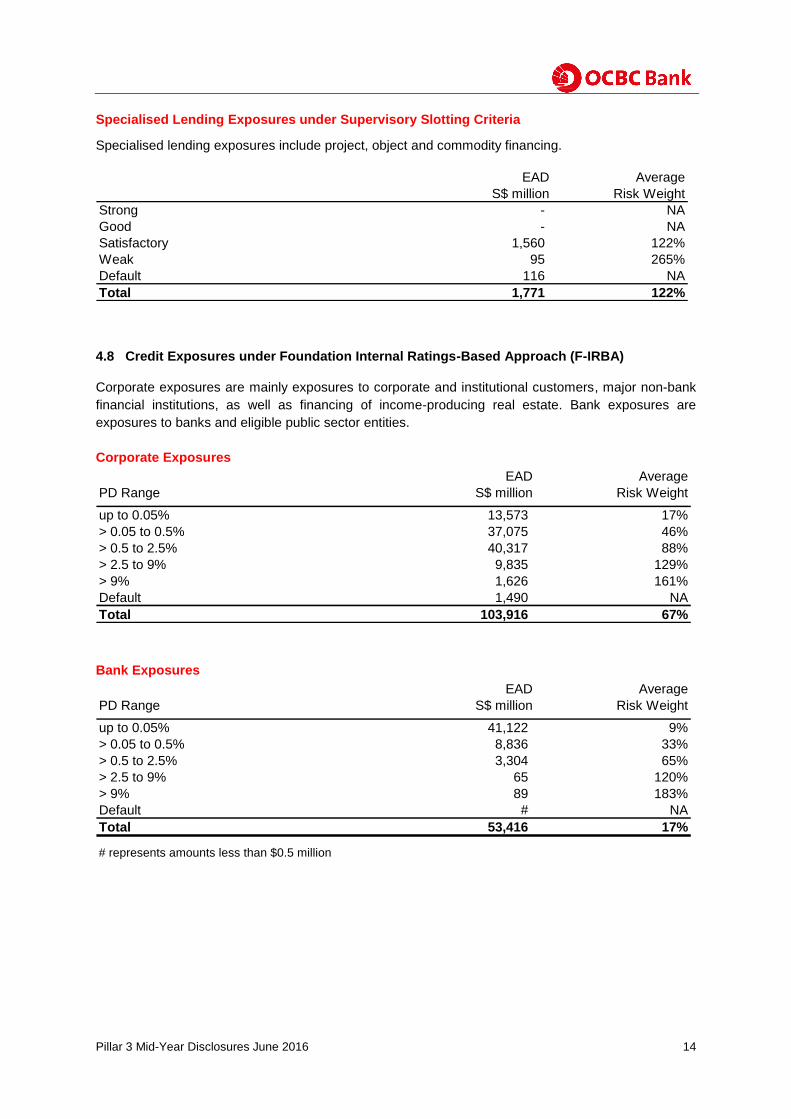
Specialised Lending Exposures under Supervisory Slotting Criteria
Specialised lending exposures include project, object and commodity financing.
4.8 Credit Exposures under Foundation Internal Ratings-Based Approach (F-IRBA)
Corporate exposures are mainly exposures to corporate and institutional customers, major non-bank
financial institutions, as well as financing of income-producing real estate. Bank exposures are
exposures to banks and eligible public sector entities.
Corporate Exposures
Bank Exposures
EAD Average
S$ million Risk Weight
Strong - NA
Good - NA
Satisfactory 1,560 122%
Weak 95 265%
Default 116 NA
Total 1,771 122%
EAD Average
PD Range S$ million Risk Weight
up to 0.05% 13,573 17%
> 0.05 to 0.5% 37,075 46%
> 0.5 to 2.5% 40,317 88%
> 2.5 to 9% 9,835 129%
> 9% 1,626 161%
Default 1,490 NA
Total 103,916 67%
EAD Average
PD Range S$ million Risk Weight
up to 0.05% 41,122 9%
> 0.05 to 0.5% 8,836 33%
> 0.5 to 2.5% 3,304 65%
> 2.5 to 9% 65 120%
> 9% 89 183%
Default # NA
Total 53,416 17%
# represents amounts less than $0.5 million
Pillar 3 Mid-Year Disclosures June 2016 15
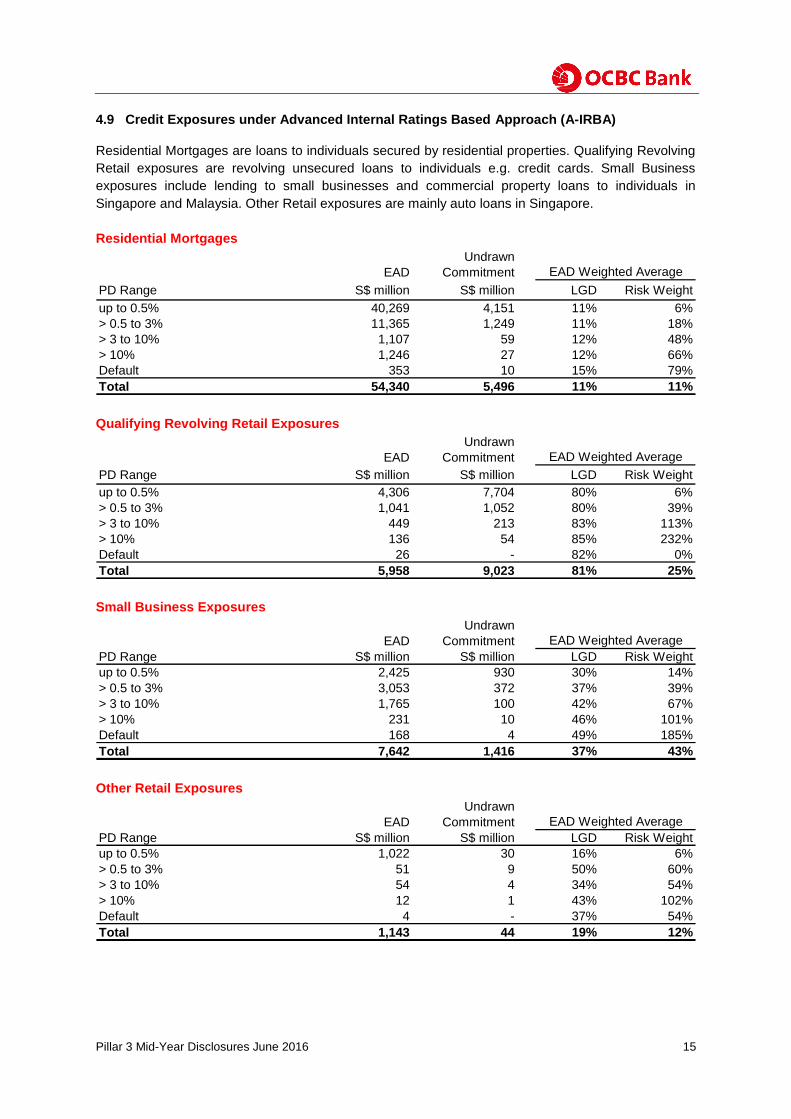
4.9 Credit Exposures under Advanced Internal Ratings Based Approach (A-IRBA)
Residential Mortgages are loans to individuals secured by residential properties. Qualifying Revolving
Retail exposures are revolving unsecured loans to individuals e.g. credit cards. Small Business
exposures include lending to small businesses and commercial property loans to individuals in
Singapore and Malaysia. Other Retail exposures are mainly auto loans in Singapore.
Residential Mortgages
Qualifying Revolving Retail Exposures
Small Business Exposures
Other Retail Exposures
Undrawn
EAD Commitment
PD Range S$ million S$ million LGD Risk Weight
up to 0.5% 40,269 4,151 11% 6%
> 0.5 to 3% 11,365 1,249 11% 18%
> 3 to 10% 1,107 59 12% 48%
> 10% 1,246 27 12% 66%
Default 353 10 15% 79%
Total 54,340 5,496 11% 11%
EAD Weighted Average
Undrawn
EAD Commitment
PD Range S$ million S$ million LGD Risk Weight
up to 0.5% 4,306 7,704 80% 6%
> 0.5 to 3% 1,041 1,052 80% 39%
> 3 to 10% 449 213 83% 113%
> 10% 136 54 85% 232%
Default 26 - 82% 0%
Total 5,958 9,023 81% 25%
EAD Weighted Average
Undrawn
EAD Commitment
PD Range S$ million S$ million LGD Risk Weight
up to 0.5% 2,425 930 30% 14%
> 0.5 to 3% 3,053 372 37% 39%
> 3 to 10% 1,765 100 42% 67%
> 10% 231 10 46% 101%
Default 168 4 49% 185%
Total 7,642 1,416 37% 43%
EAD Weighted Average
Undrawn
EAD Commitment
PD Range S$ million S$ million LGD Risk Weight
up to 0.5% 1,022 30 16% 6%
> 0.5 to 3% 51 9 50% 60%
> 3 to 10% 54 4 34% 54%
> 10% 12 1 43% 102%
Default 4 - 37% 54%
Total 1,143 44 19% 12%
EAD Weighted Average
Pillar 3 Mid-Year Disclosures June 2016 16
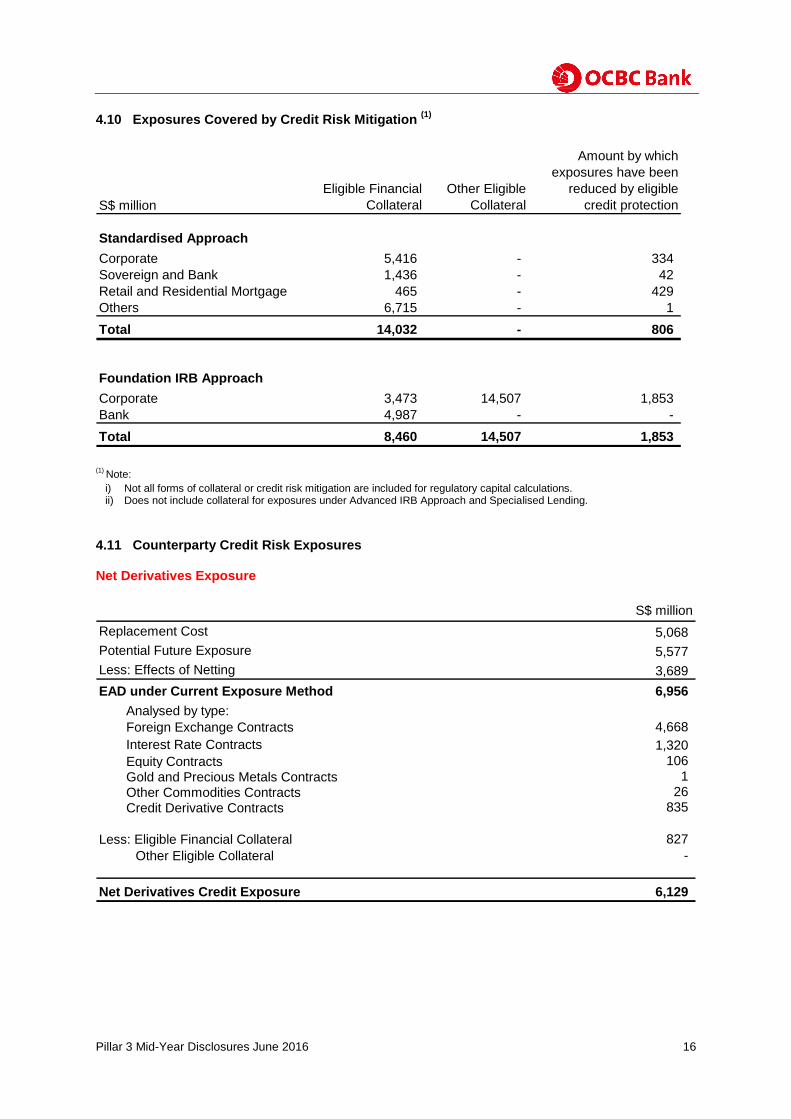
4.10 Exposures Covered by Credit Risk Mitigation (1)
(1) Note:
i) Not all forms of collateral or credit risk mitigation are included for regulatory capital calculations. ii) Does not include collateral for exposures under Advanced IRB Approach and Specialised Lending.
4.11 Counterparty Credit Risk Exposures Net Derivatives Exposure
Eligible Financial
Collateral
Other Eligible
Collateral
Amount by which
exposures have been
reduced by eligible
credit protection
Standardised Approach
Corporate 5,416 - 334
Sovereign and Bank 1,436 - 42
Retail and Residential Mortgage 465 - 429
Others 6,715 - 1
Total 14,032 - 806
Foundation IRB Approach
Corporate 3,473 14,507 1,853
Bank 4,987 - -
Total 8,460 14,507 1,853
S$ million
S$ million
Replacement Cost 5,068
Potential Future Exposure 5,577
Less: Effects of Netting 3,689
EAD under Current Exposure Method 6,956
Analysed by type:
Foreign Exchange Contracts 4,668
Interest Rate Contracts 1,320
Equity Contracts 106
Gold and Precious Metals Contracts 1
Other Commodities Contracts 26
Credit Derivative Contracts 835
Less: Eligible Financial Collateral 827
Other Eligible Collateral -
Net Derivatives Credit Exposure 6,129
Pillar 3 Mid-Year Disclosures June 2016 17
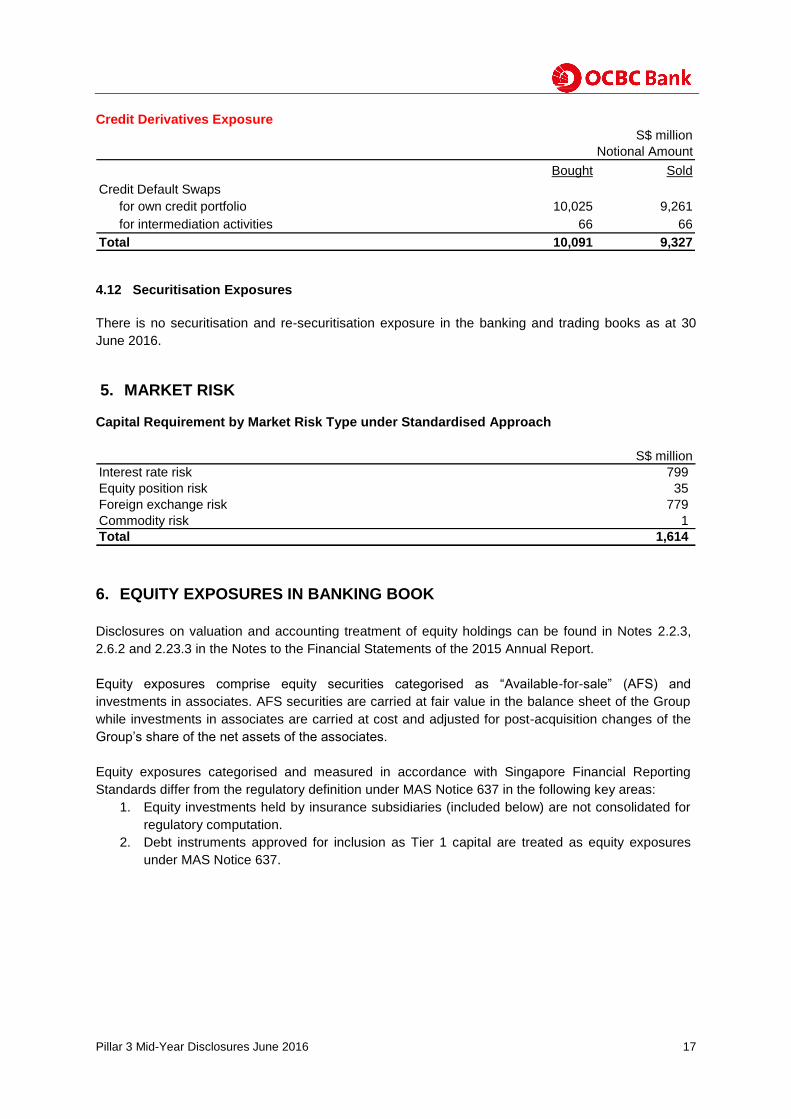
Credit Derivatives Exposure
4.12 Securitisation Exposures
There is no securitisation and re-securitisation exposure in the banking and trading books as at 30
June 2016.
5. MARKET RISK
Capital Requirement by Market Risk Type under Standardised Approach
6. EQUITY EXPOSURES IN BANKING BOOK
Disclosures on valuation and accounting treatment of equity holdings can be found in Notes 2.2.3,
2.6.2 and 2.23.3 in the Notes to the Financial Statements of the 2015 Annual Report.
Equity exposures comprise equity securities categorised as “Available-for-sale” (AFS) and
investments in associates. AFS securities are carried at fair value in the balance sheet of the Group
while investments in associates are carried at cost and adjusted for post-acquisition changes of the
Group’s share of the net assets of the associates.
Equity exposures categorised and measured in accordance with Singapore Financial Reporting
Standards differ from the regulatory definition under MAS Notice 637 in the following key areas:
1. Equity investments held by insurance subsidiaries (included below) are not consolidated for
regulatory computation.
2. Debt instruments approved for inclusion as Tier 1 capital are treated as equity exposures
under MAS Notice 637.
Bought Sold
Credit Default Swaps
for own credit portfolio 10,025 9,261
for intermediation activities 66 66
Total 10,091 9,327
Notional Amount
S$ million
S$ million
Interest rate risk 799
Equity position risk 35
Foreign exchange risk 779
Commodity risk 1
Total 1,614
Pillar 3 Mid-Year Disclosures June 2016 18
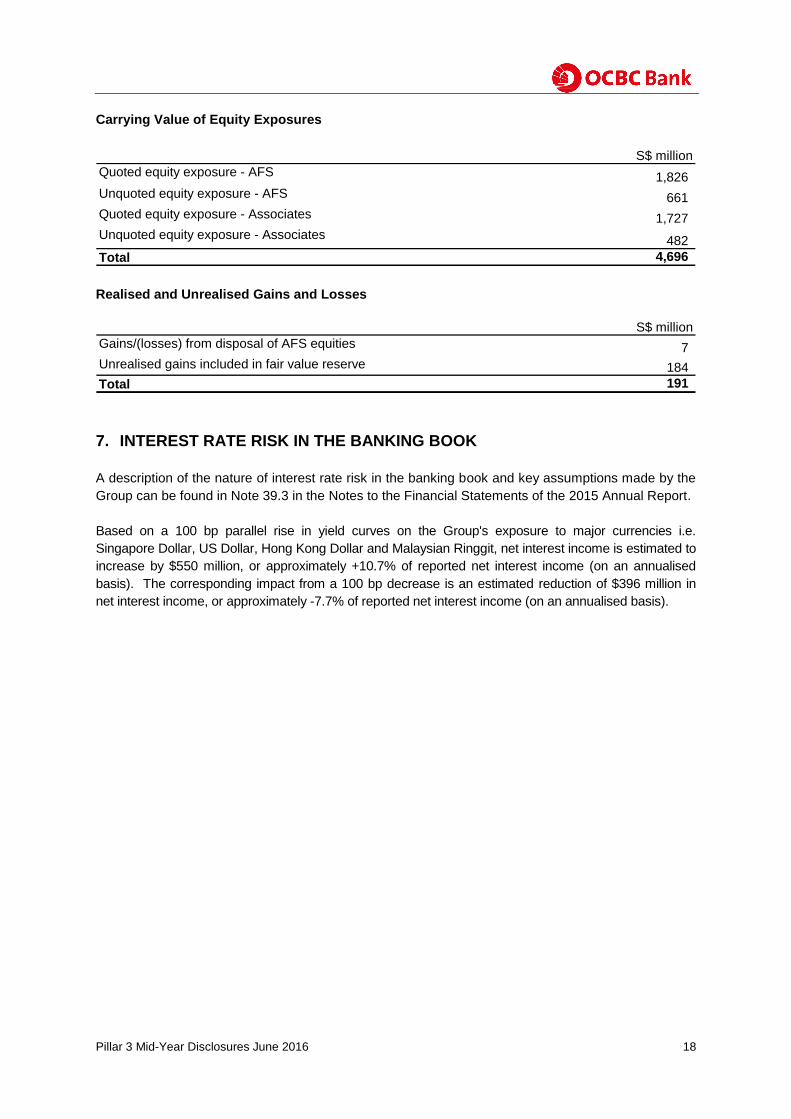
Carrying Value of Equity Exposures
Realised and Unrealised Gains and Losses
7. INTEREST RATE RISK IN THE BANKING BOOK
A description of the nature of interest rate risk in the banking book and key assumptions made by the
Group can be found in Note 39.3 in the Notes to the Financial Statements of the 2015 Annual Report.
Based on a 100 bp parallel rise in yield curves on the Group's exposure to major currencies i.e.
Singapore Dollar, US Dollar, Hong Kong Dollar and Malaysian Ringgit, net interest income is estimated to
increase by $550 million, or approximately +10.7% of reported net interest income (on an annualised
basis). The corresponding impact from a 100 bp decrease is an estimated reduction of $396 million in
net interest income, or approximately -7.7% of reported net interest income (on an annualised basis).
S$ million
Quoted equity exposure - AFS 1,826
Unquoted equity exposure - AFS 661
Quoted equity exposure - Associates 1,727
Unquoted equity exposure - Associates 482
Total 4,696
S$ million
Gains/(losses) from disposal of AFS equities 7
Unrealised gains included in fair value reserve 184
Total 191