piam winter school - tu/epeters/inj_mould_lectures/gregnier_anisotropy.pdf · piam winter school...
TRANSCRIPT
1 / 40
Shrinkage and Warpage
of Injection Molded
Thermoplastic Parts:
Physical Mechanisms and Anisotropy
Gilles Régnier
PIAM Winter School
January 15th - 19th, 2007
Aussois
2 / 40
The industrialproblem
Volumic shrinkageprediction
Linear shrinkagesdetermination
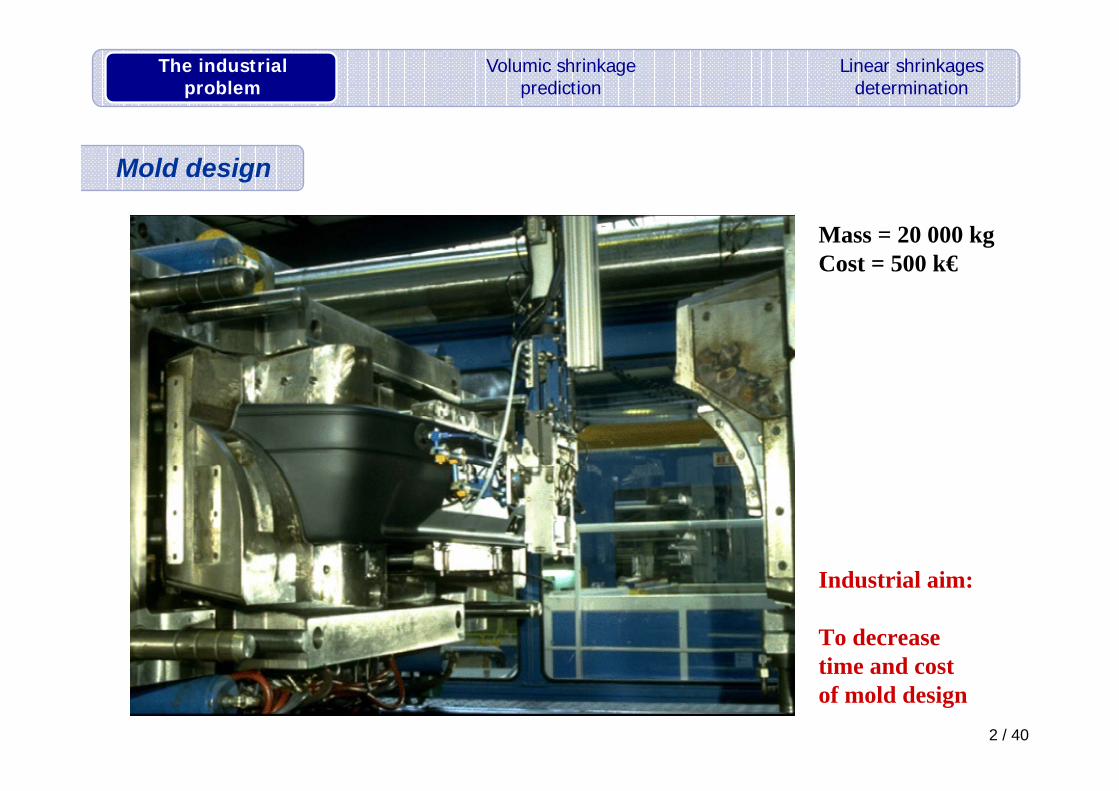
Mold design
Mass = 20 000 kgCost = 500 k€
Industrial aim:
To decreasetime and costof mold design
3 / 40
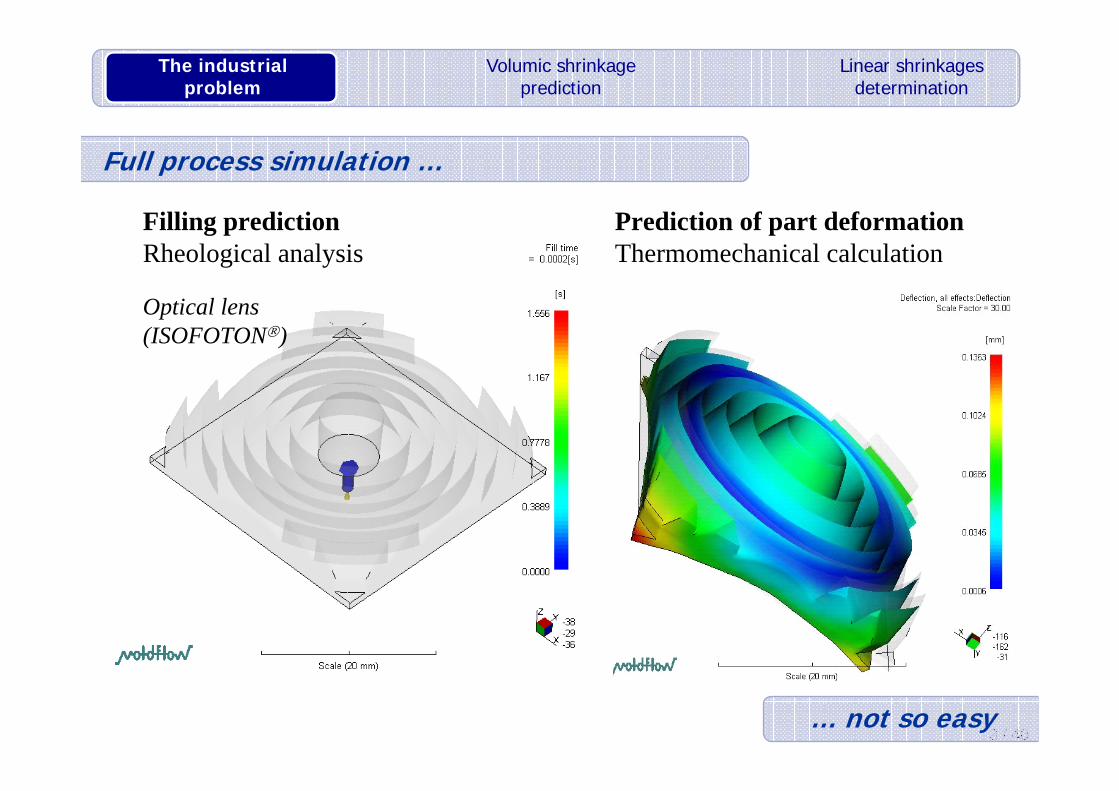
Full process simulation …
Optical lens(ISOFOTON®)
The industrialproblem
Volumic shrinkageprediction
Linear shrinkagesdetermination
Filling predictionRheological analysis
Prediction of part deformationThermomechanical calculation
… not so easy
4 / 40
flowtransverse
normal
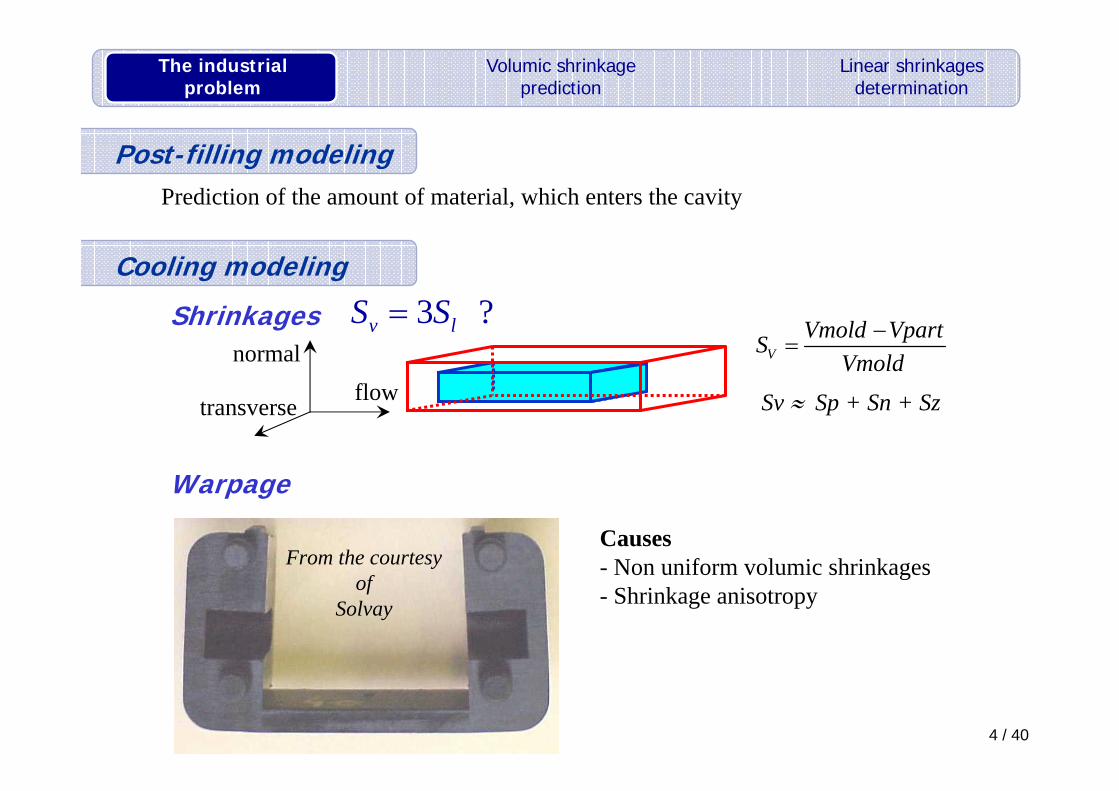
Sv ≈ Sp + Sn + Sz
VVmold VpartS
Vmold−
=3 ?v lS S=
Warpage
Causes- Non uniform volumic shrinkages- Shrinkage anisotropy
Post-filling modelingPrediction of the amount of material, which enters the cavity
Cooling modeling
Shrinkages
From the courtesyof
Solvay
The industrialproblem
Volumic shrinkageprediction
Linear shrinkagesdetermination
5 / 40
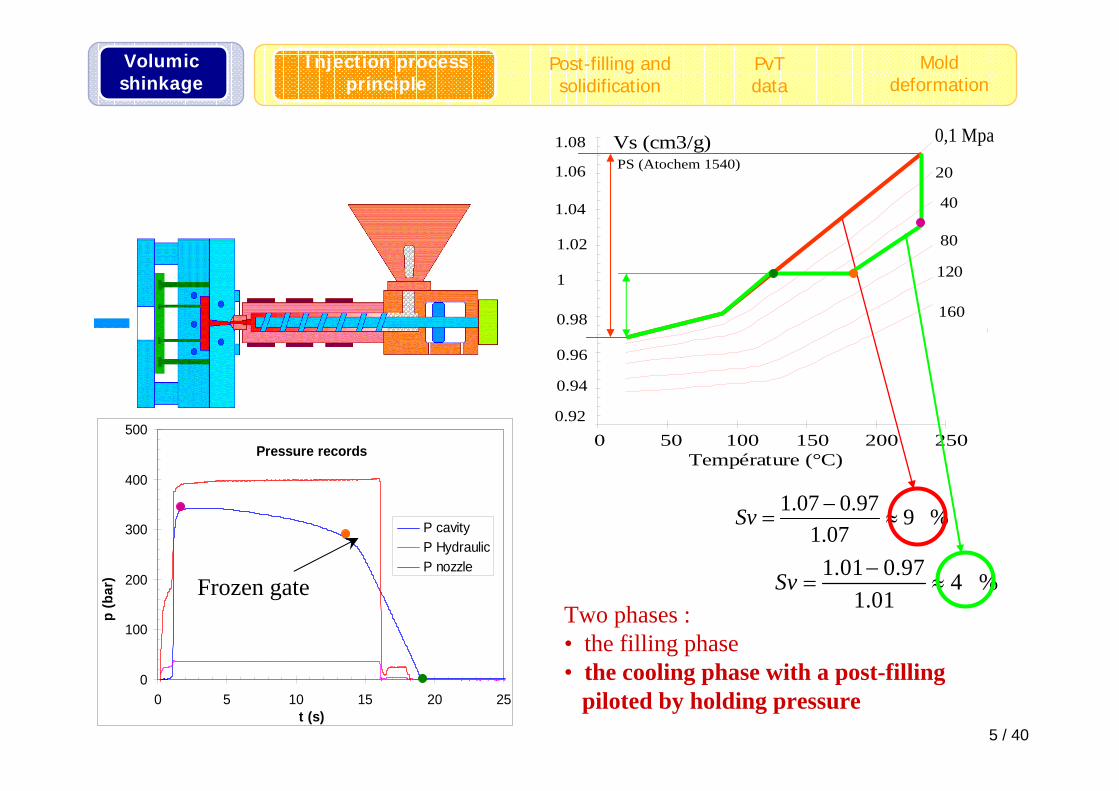
PS (Atochem 1540)
Température (°C)
0.92
0.94
0.96
0.98
1
1.02
1.04
1.06
1.08
0 50 100 150 200 250
20
40
80
120
160
Vs (cm3/g) 0,1 Mpa
1.07 0.97 9 %1.07
Sv −= ≈
Two phases :• the filling phase• the cooling phase with a post-filling
piloted by holding pressure
1.01 0.97 4 %1.01
Sv −= ≈
Pressure records
0
100
200
300
400
500
0 5 10 15 20 25
P cavityP HydraulicP nozzle
p (b
ar)
t (s)
Frozen gate
Volumicshinkage
Post-filling andsolidification
Injection processprinciple
PvTdata
Molddeformation
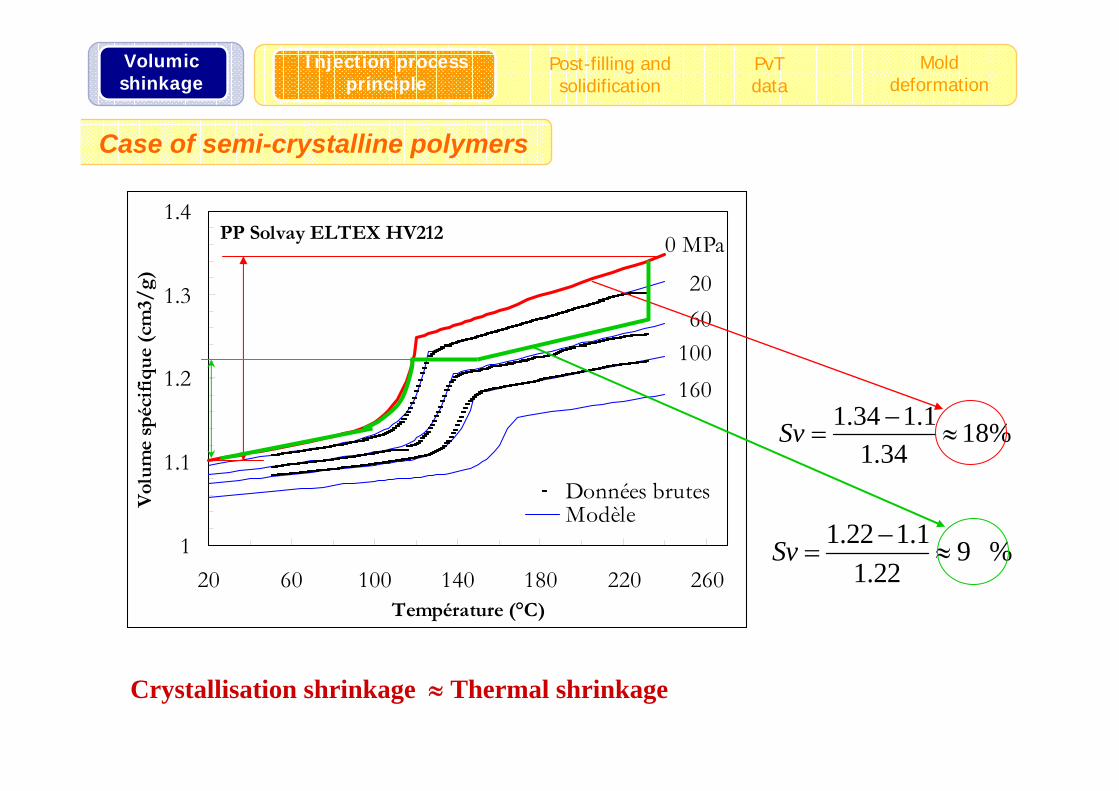
PP Solvay ELTEX HV212
1
1.1
1.2
1.3
1.4
20 60 100 140 180 220 260Température (°C)
Vol
ume
spéc
ifiq
ue
(cm
3/g)
Données brutesModèle
0 MPa
20 60
100 160
1.34 1.1 18%1.34
Sv −= ≈
1.22 1.1 9 %1.22
Sv −= ≈
Crystallisation shrinkage ≈ Thermal shrinkage
Case of semi-crystalline polymers
Volumicshinkage
Post-filling andsolidification
Injection processprinciple
PvTdata
Molddeformation
7 / 40
Volumicshinkage
Post-filling andsolidification
Injection processprinciple
PvTdata
Molddeformation
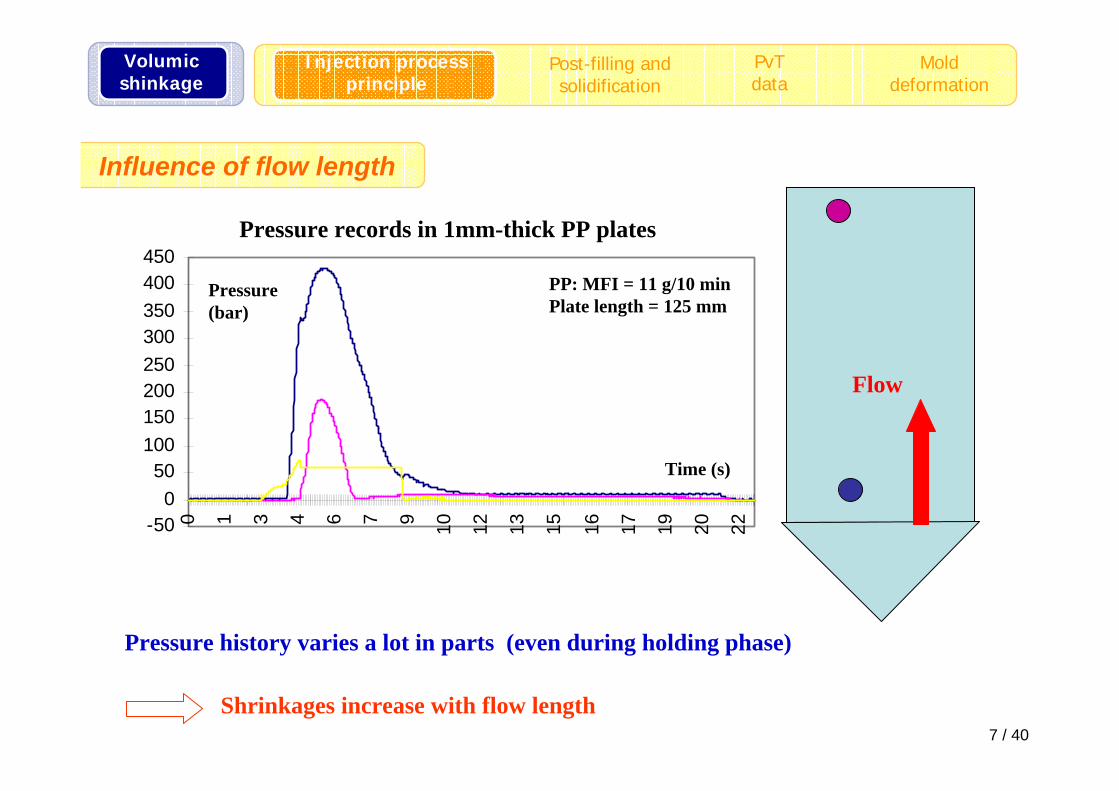
Pressure history varies a lot in parts (even during holding phase)
Shrinkages increase with flow length
Influence of flow length
-500
50100150200250300350400450
0 1 3 4 6 7 9 10 12 13 15 16 17 19 20 22
Ps bar
Pf bar
PHyd bar
Flow
Time (s)
Pressure(bar)
Pressure records in 1mm-thick PP plates
PP: MFI = 11 g/10 minPlate length = 125 mm
8 / 40
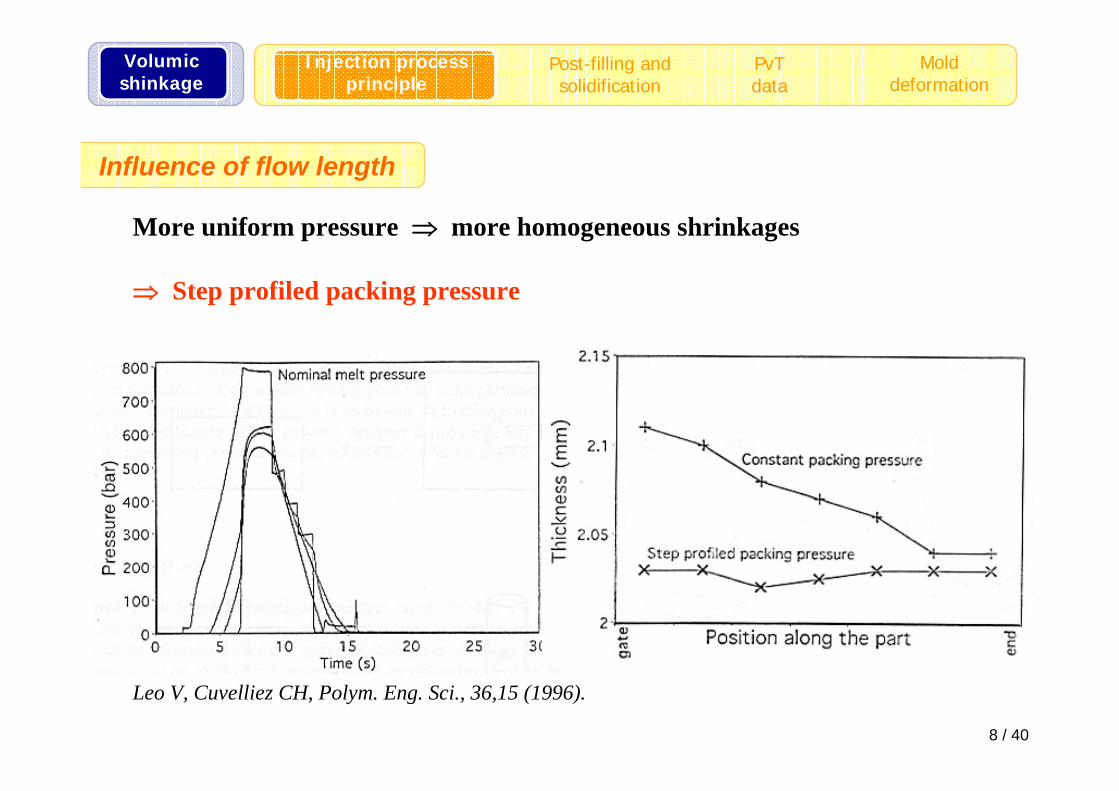
Leo V, Cuvelliez CH, Polym. Eng. Sci., 36,15 (1996).
More uniform pressure ⇒ more homogeneous shrinkages
⇒ Step profiled packing pressure
Volumicshinkage
Post-filling andsolidification
Injection processprinciple
PvTdata
Molddeformation
Influence of flow length
9 / 40
Volumicshinkage
Post-filling andsolidification
Injection processprinciple
PvTdata
Molddeformation
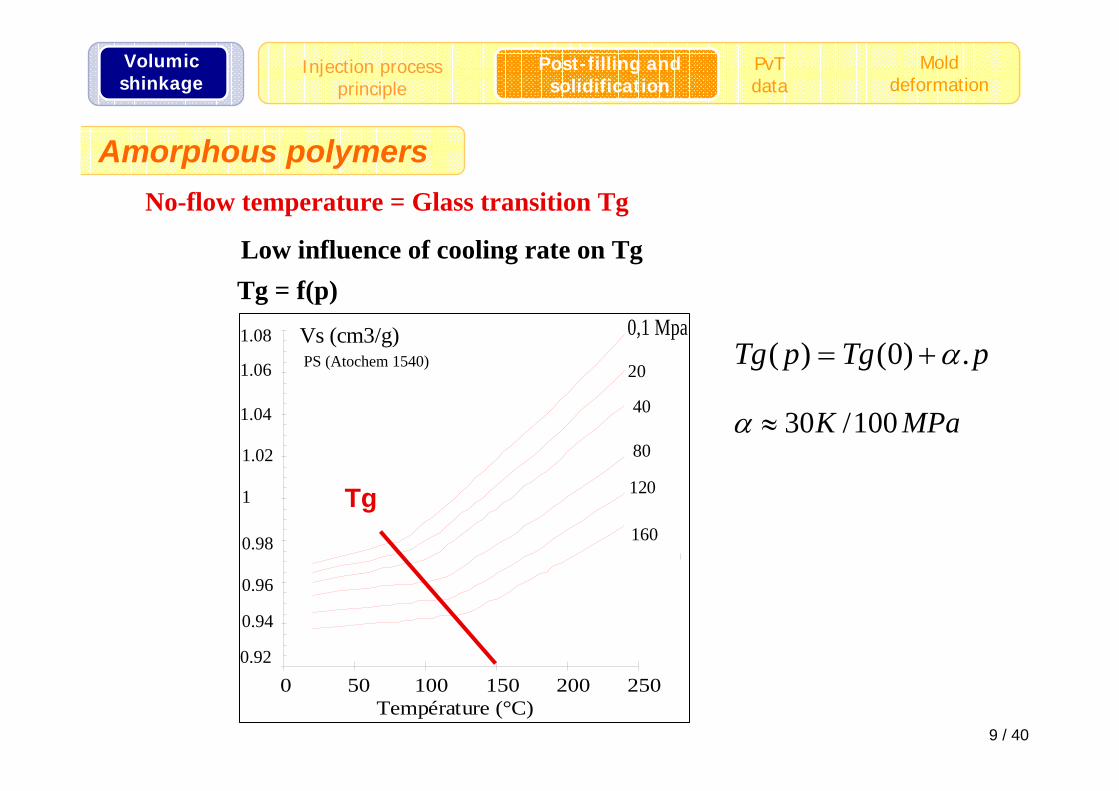
Amorphous polymers
PS (Atochem 1540)
Température (°C)
0.92
0.94
0.96
0.98
1
1.02
1.04
1.06
1.08
0 50 100 150 200 250
20
40
80
120
160
Vs (cm3/g) 0,1 Mpa( ) (0) .Tg p Tg pα= +
Tg = f(p)
Tg
30 /100K MPaα ≈
No-flow temperature = Glass transition Tg
Low influence of cooling rate on Tg

10 / 40
Viscosity PS (BASF 456 F)
10
100
1000
10000
100000
0.1 1 10 100 1000 10000Shear Rate (s-1) / Frequency (rd/s)
η /
η*
(Pa.
s)
Capillary Rh. 202°CCapillary Rh. 230°CCapillary Rh. 260°C
Viscosity PS (BASF 456 F)
10
100
1000
10000
0.1 1 10 100 1000 10000Shear Rate (s-1) / Frequency (rd/s)
/ * (
Pa.s
)
Cone-plate 200°CCone-plate 230°CCapillary Rh. 202°CCapillary Rh. 230°CCapillary Rh. 260°C
Viscosity PS (BASF 456 F)
10
100
1000
10000
100000
1000000
10000000
0.01 0.1 1 10 100 1000 10000Shear Rate (s-1) / Frequency (rd/s)
η /
η*
(Pa.
s)
Cone-plate 120°CCone-plate 130°CCone-plate 140°CCone-plate 155°CCone-plate 170°CCone-plate 200°CCone-plate 230°CCapillary Rh. 202°CCapillary Rh. 230°CCapillary Rh. 260°CWLF 120°CWLF 130°CWLF 140°CWLF 155°CWLF 170°CWLF 200°CWLF 230°CWLF 260°C
Tréf = 373 KC1 = 25.5C2 = 36.3 K
10
2
( )exp
( )ref
refref
C T TC T T
η η⎡ ⎤−
= −⎢ ⎥+ −⎢ ⎥⎣ ⎦
Accurate viscosity model at low temperatures and shear rates
Volumicshinkage
Solidification and post-filling
Injection processprinciple
PvTdata
Molddeformation
'1'2
( )( , ) exp( )
g
g g
C T T pT pT C T T p
αηη α
⎛ ⎞− −= −⎜ ⎟⎜ ⎟+ − −⎝ ⎠
WLF viscosity equation
Amorphous polymers
11 / 40
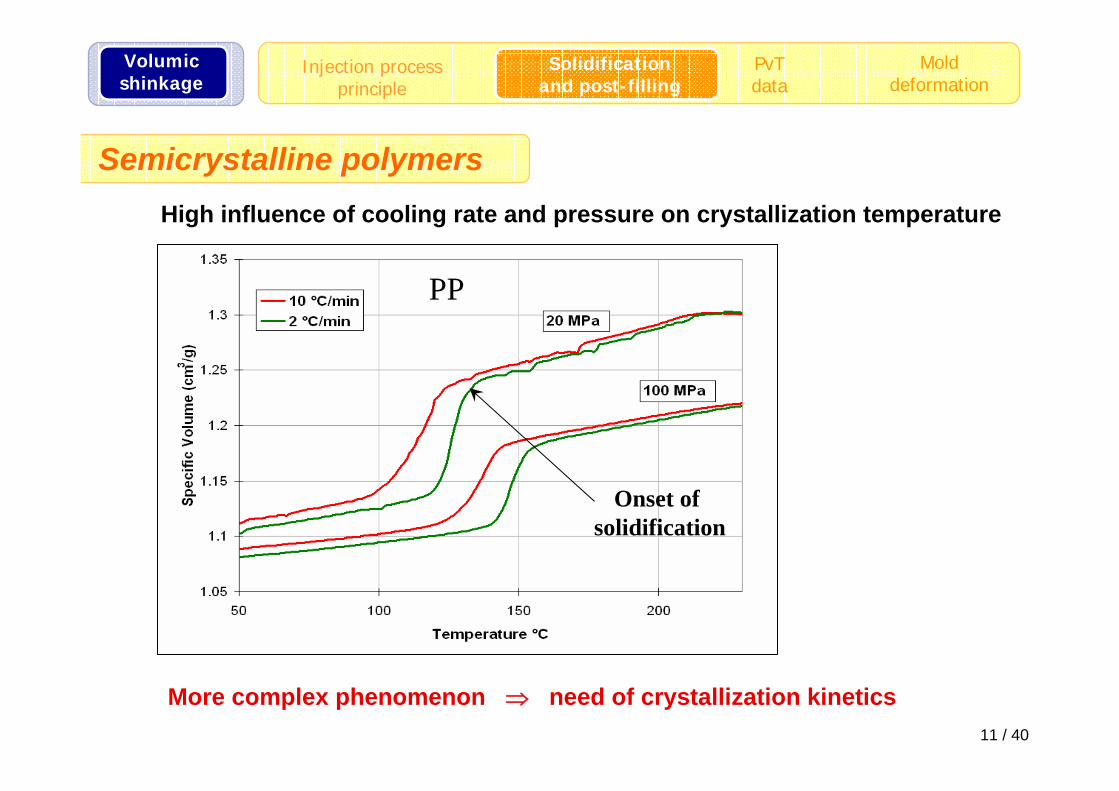
Semicrystalline polymersHigh influence of cooling rate and pressure on crystallization temperature
More complex phenomenon ⇒ need of crystallization kinetics
Onset ofsolidification
Volumicshinkage
Solidification and post-filling
Injection processprinciple
PvTdata
Molddeformation
PP
12 / 40
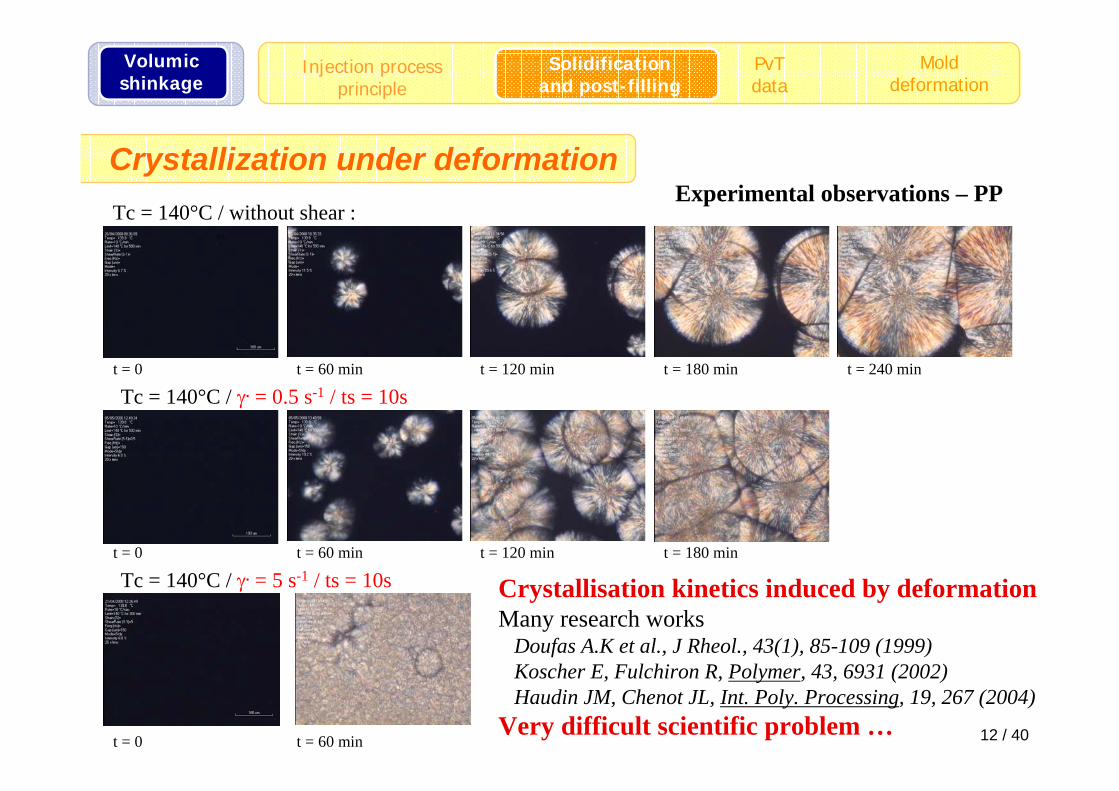
Crystallization under deformation
Tc = 140°C / γ. = 0.5 s-1 / ts = 10s
Tc = 140°C / γ. = 5 s-1 / ts = 10s
Tc = 140°C / without shear :
t = 0 t = 60 min t = 120 min t = 180 min t = 240 min
t = 180 mint = 120 mint = 60 mint = 0
Experimental observations – PP
t = 0 t = 60 min
Volumicshinkage
Solidification and post-filling
Injection processprinciple
PvTdata
Molddeformation
Crystallisation kinetics induced by deformationMany research works
Doufas A.K et al., J Rheol., 43(1), 85-109 (1999) Koscher E, Fulchiron R, Polymer, 43, 6931 (2002)Haudin JM, Chenot JL, Int. Poly. Processing, 19, 267 (2004)
Very difficult scientific problem …
13 / 40
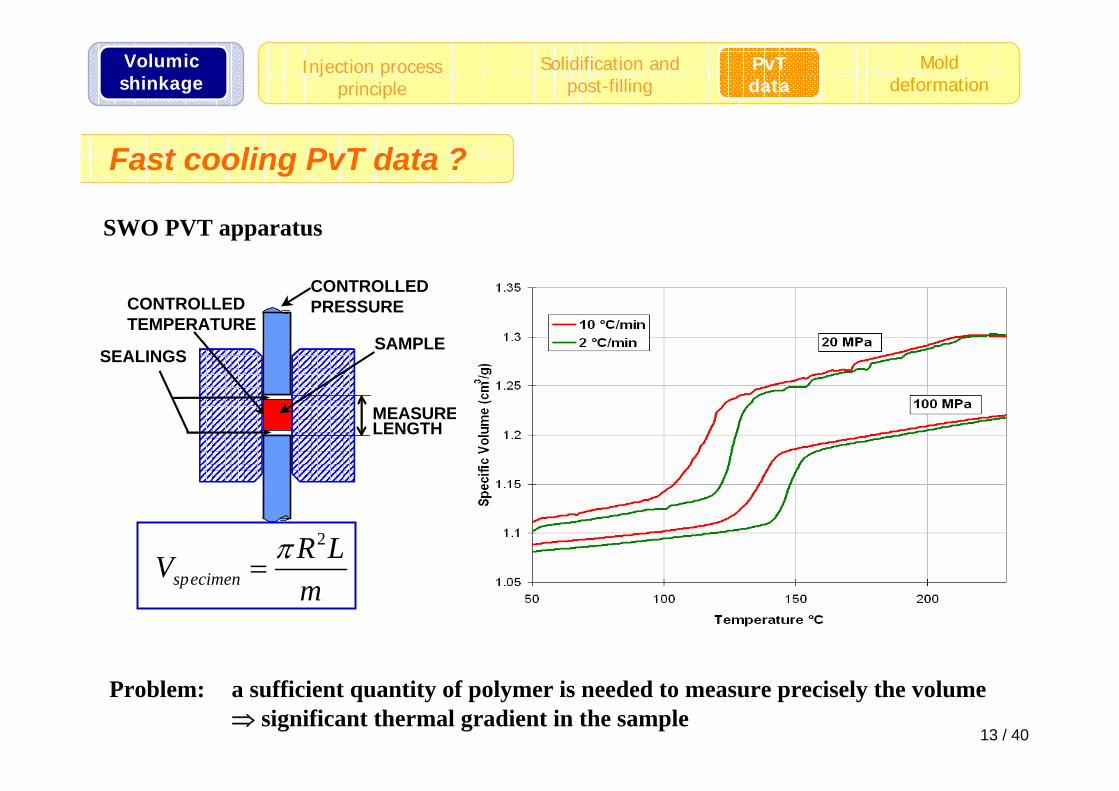
Fast cooling PvT data ?
CONTROLLEDTEMPERATURE
MEASUREDLENGTH
SAMPLESEALINGS
CONTROLLEDPRESSURE
2
specimenR LVm
π=
SWO PVT apparatus
Problem: a sufficient quantity of polymer is needed to measure precisely the volume⇒ significant thermal gradient in the sample
Volumicshinkage
Solidification andpost-filling
Injection processprinciple
PvTdata
Molddeformation
14 / 40
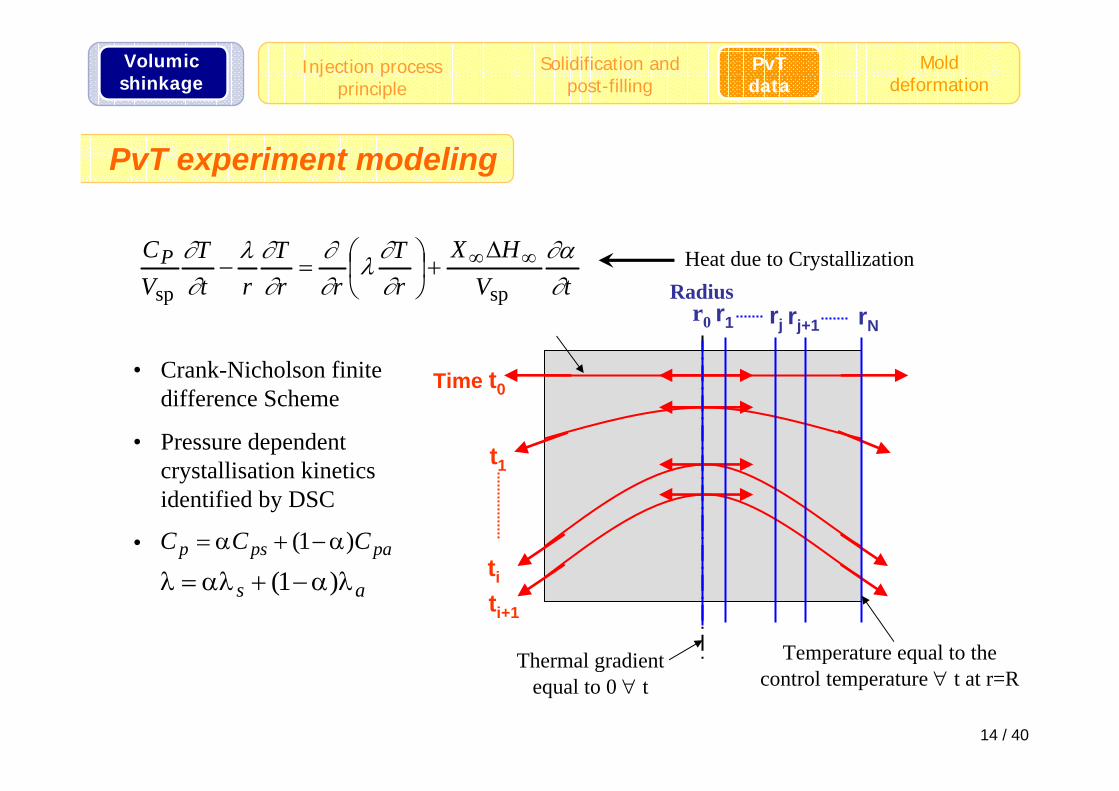
PvT experiment modeling
t1
ti
Time t0
ti+1
Radiusr0 r1 rj rj+1 rN
Thermal gradient equal to 0 ∀ t
Temperature equal to the control temperature ∀ t at r=R
tVHX
rT
rrT
rtT
VCP
∂∂α
∂∂
λ∂∂
∂∂λ
∂∂
spsp
∞∞∆+⎟
⎠⎞
⎜⎝⎛=− Heat due to Crystallization
• Crank-Nicholson finite difference Scheme
• Pressure dependent crystallisation kinetics identified by DSC
•
as λα−+αλ=λ )1(papsp CCC )1( α−+α=
Volumicshinkage
Solidification andpost-filling
Injection processprinciple
PvTdata
Molddeformation

15 / 40
Specific volume modeling(1 )crsp amV X VX Vα α∞ ∞= + − X∞: final crystallinity obtained
from density measurements or DSC
Fitted linear variations of Vcr with P and T
Vcr for Patm and 25°C consistent with the literature (ρ=0.936 g/cm3)
1°C/min
Tait Equation fitted on the liquid part of PVT diagram obtained with a low cooling rate (1°C/min)
1°C/min
Volumicshinkage
Solidification andpost-filling
Injection processprinciple
PvTdata
Molddeformation
16 / 40
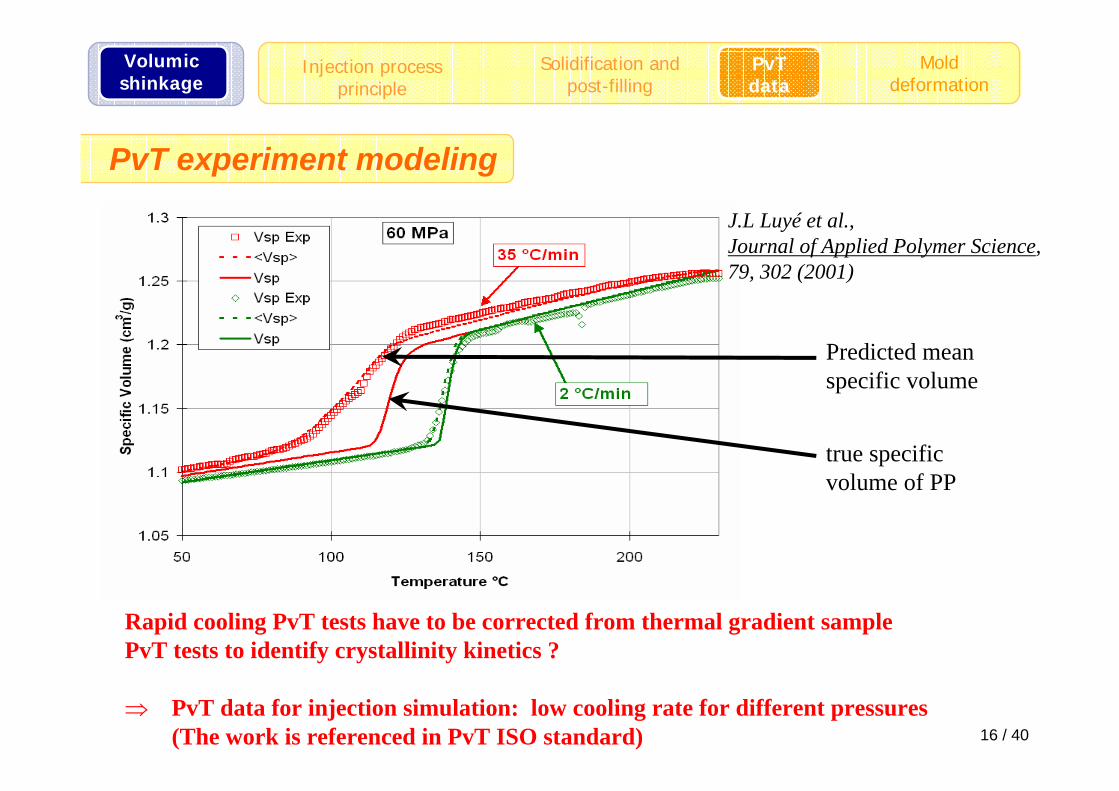
PvT experiment modeling
Rapid cooling PvT tests have to be corrected from thermal gradient samplePvT tests to identify crystallinity kinetics ?
⇒ PvT data for injection simulation: low cooling rate for different pressures(The work is referenced in PvT ISO standard)
Predicted meanspecific volume
true specificvolume of PP
J.L Luyé et al., Journal of Applied Polymer Science,79, 302 (2001)
Volumicshinkage
Solidification andpost-filling
Injection processprinciple
PvTdata
Molddeformation
17 / 40
0
10
20
30
40
50
0 1 2 3 4 5 6 7 8 9 10Time (s)
Pre
ssu
re (
MP
a)
RecordedSimulated
Nozzle
A
B
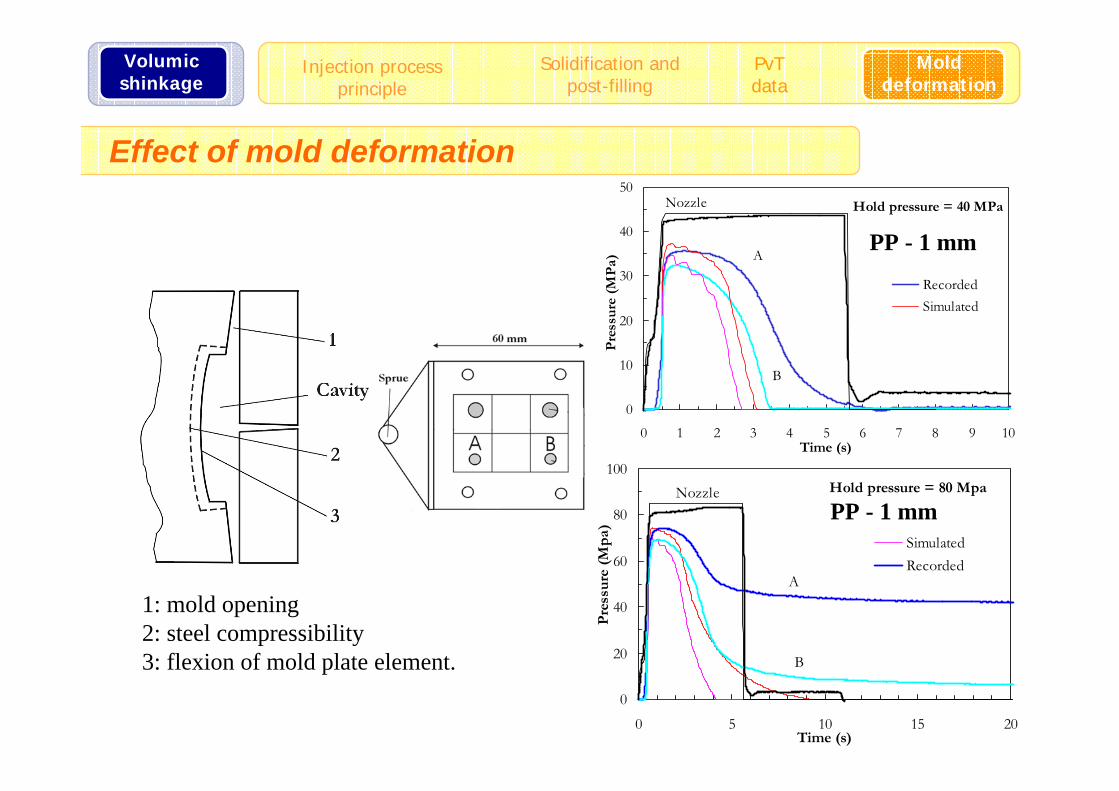
Hold pressure = 40 MPa
0
20
40
60
80
100
0 5 10 15 20Time (s)
Pre
ssu
re (
Mp
a)
SimulatedRecorded
Nozzle
A
B
Hold pressure = 80 Mpa
Effect of mold deformation
1: mold opening2: steel compressibility3: flexion of mold plate element.
PP - 1 mm
PP - 1 mm
Volumicshinkage
Solidification andpost-filling
Injection processprinciple
PvTdata
Molddeformation
18 / 40
-6
-4
-2
0
2
4
6
30 40 50 60 70 80 90Hold Pressure (Mpa)
Vol
um
ic S
hri
nk
age
(%)
Original mouldSv/deformed cavity
Original mouldSv/empty cavityMoldflow simulation
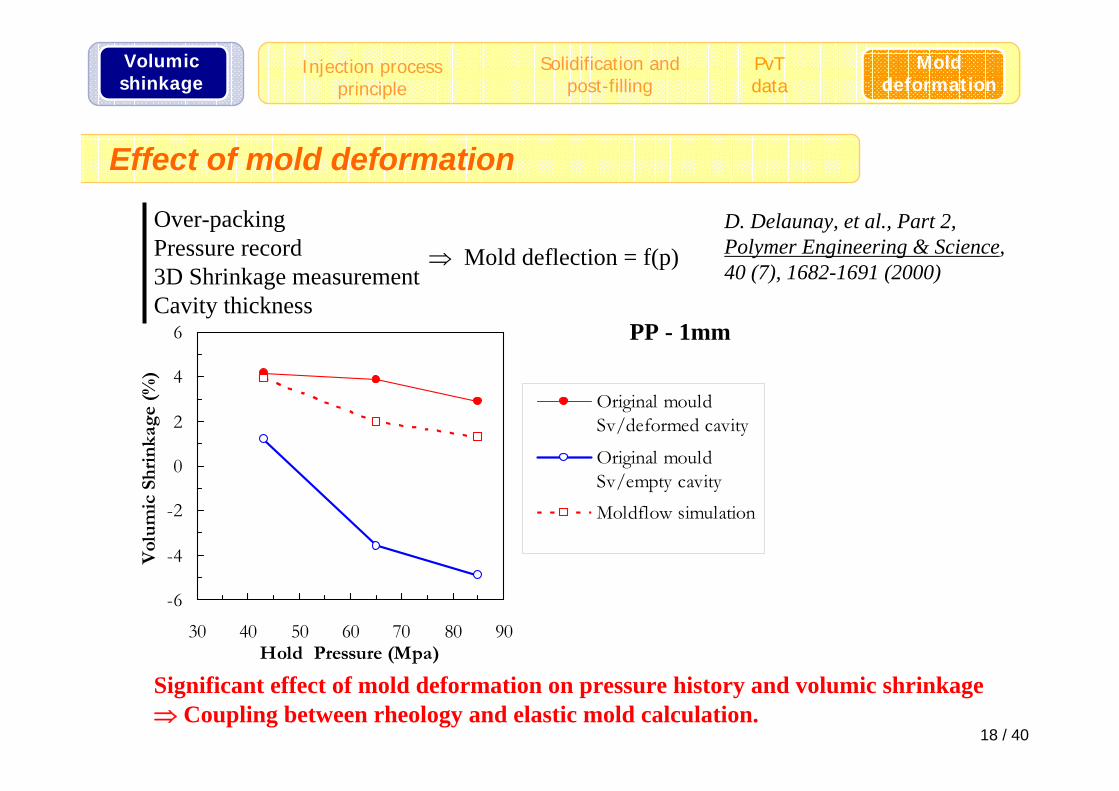
Effect of mold deformation
Over-packingPressure record3D Shrinkage measurementCavity thickness
⇒ Mold deflection = f(p)
Significant effect of mold deformation on pressure history and volumic shrinkage⇒ Coupling between rheology and elastic mold calculation.
D. Delaunay, et al., Part 2, Polymer Engineering & Science, 40 (7), 1682-1691 (2000)
PP - 1mm
Volumicshinkage
Solidification andpost-filling
Injection processprinciple
PvTdata
Molddeformation
19 / 40
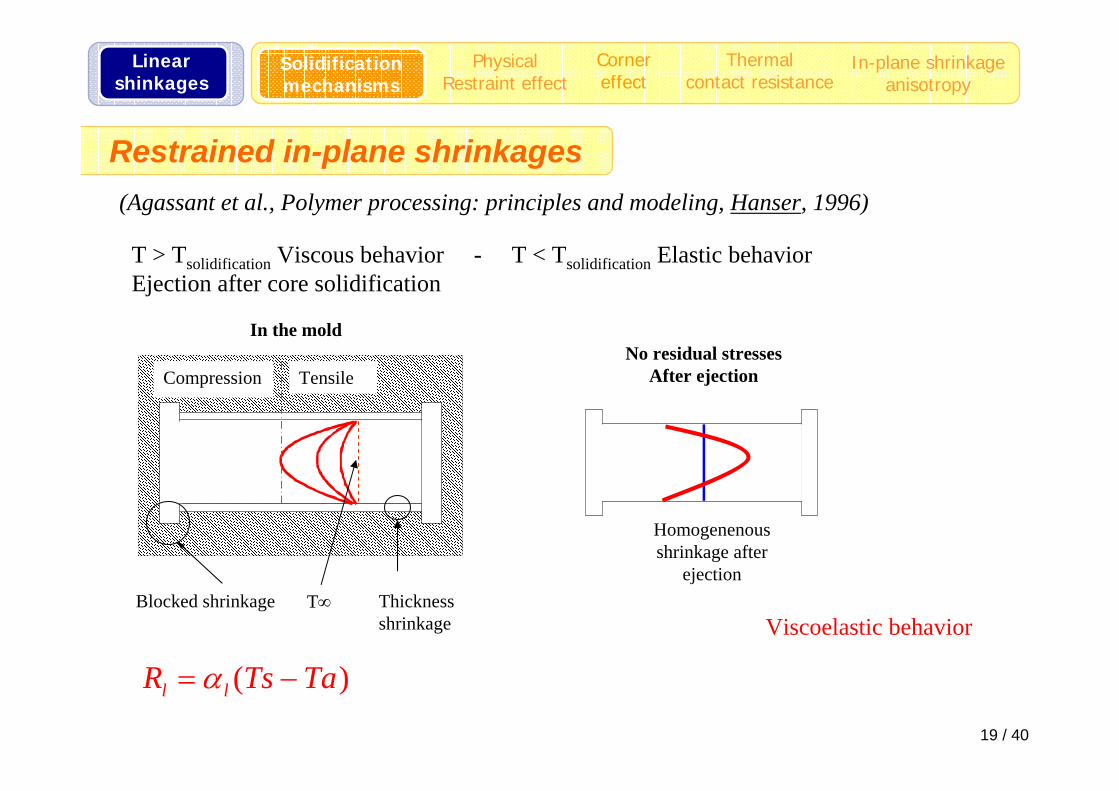
( )l lR Ts Taα= −
No residual stresses After ejectionCompression
Blocked shrinkage
Tensile
Homogenenousshrinkage after
ejection
In the mold
T∞ Thicknessshrinkage
T > Tsolidification Viscous behavior - T < Tsolidification Elastic behaviorEjection after core solidification
(Agassant et al., Polymer processing: principles and modeling, Hanser, 1996)
Restrained in-plane shrinkages
Linearshinkages
PhysicalRestraint effect
Solidification mechanisms
Cornereffect
In-plane shrinkageanisotropy
Thermal contact resistance
Viscoelastic behavior
20 / 40
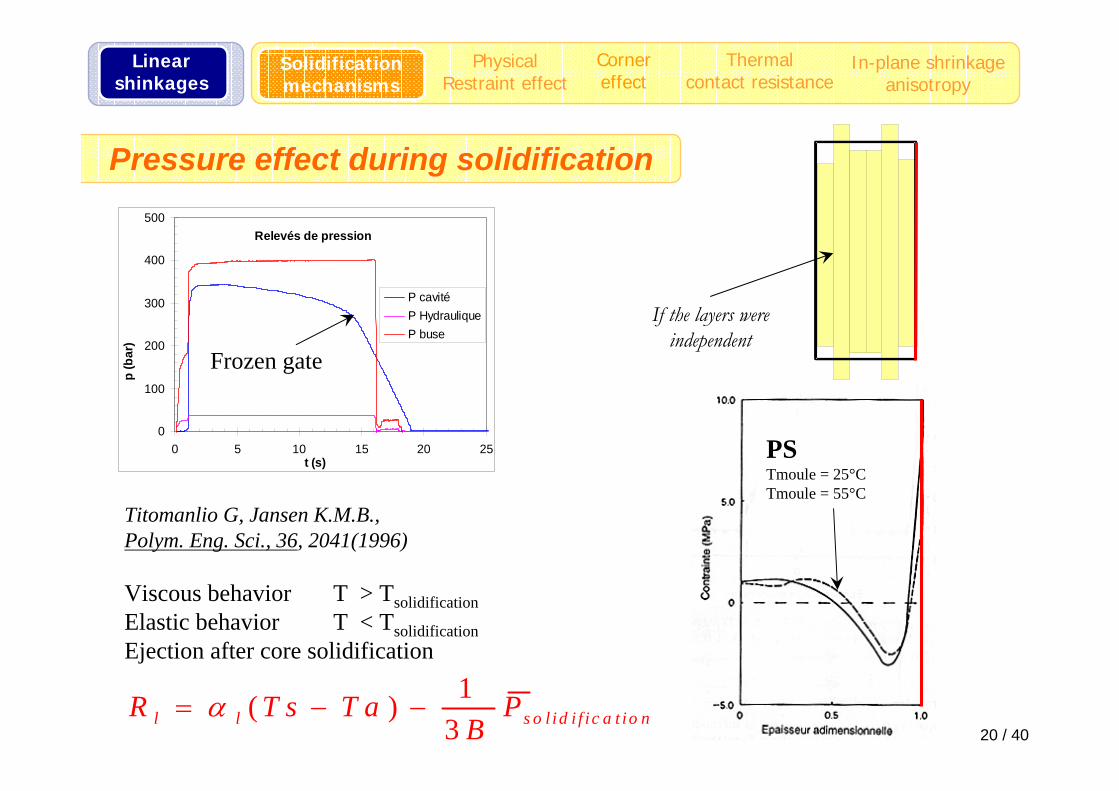
Titomanlio G, Jansen K.M.B.,Polym. Eng. Sci., 36, 2041(1996)
Viscous behavior T > TsolidificationElastic behavior T < TsolidificationEjection after core solidification
1( )3l l s o l id i f i c a t io nR T s T a P
Bα= − −
If the layers wereindependent
Relevés de pression
0
100
200
300
400
500
0 5 10 15 20 25
P cavitéP HydrauliqueP buse
p (b
ar)
t (s)
Frozen gate
Pressure effect during solidification
Linearshinkages
PhysicalRestraint effect
Solidification mechanisms
Cornereffect
In-plane shrinkageanisotropy
Thermal contact resistance
PSTmoule = 25°CTmoule = 55°C

21 / 40
Restrained shrinkage ⇒ Stress relaxation ↑ ⇒ in-plane shrinkage ↓
Effect of physical restraints
00.5
11.5
22.5
33.5
4
0 20 40 60 80Cavity pressure
Shrin
kage
s (%
)
SzS parallelS transverse
PP 3mm
Linearshinkages
PhysicalRestraint effect
Solidification mechanisms
Cornereffect
In-plane shrinkageanisotropy
Thermal contact resistance
22 / 40
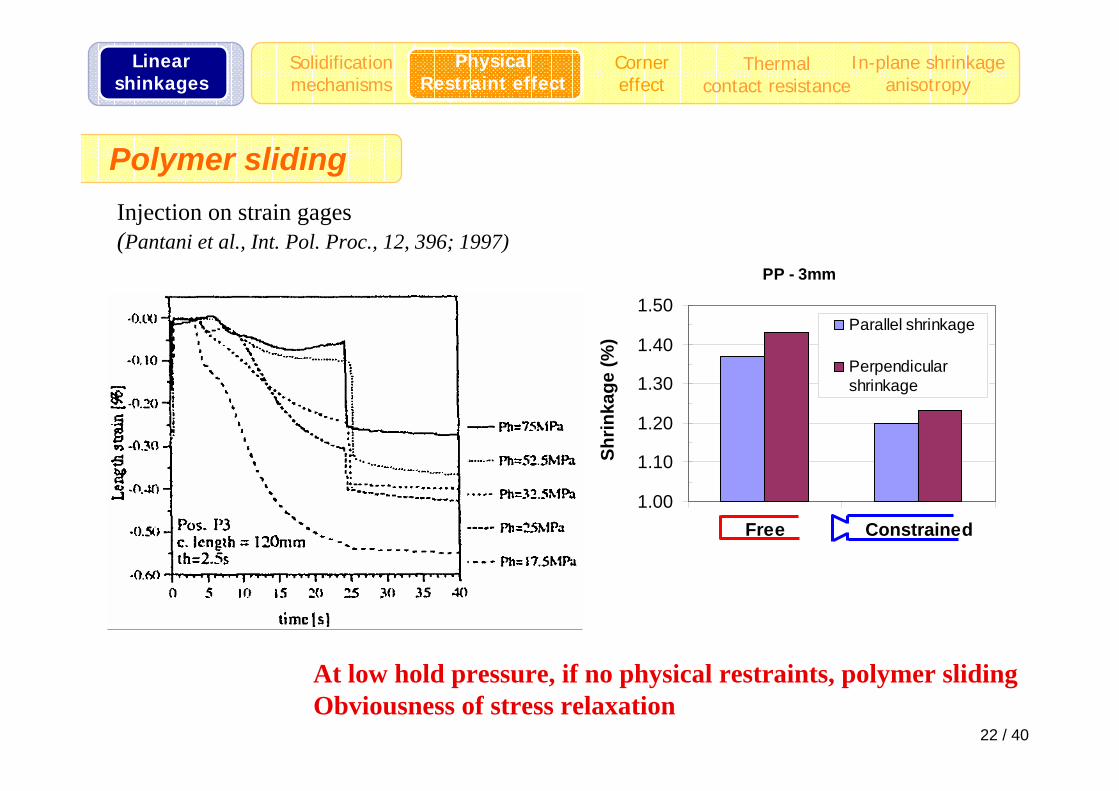
Polymer sliding
Linearshinkages
PhysicalRestraint effect
Solidification mechanisms
Cornereffect
In-plane shrinkageanisotropy
Thermal contact resistance
Injection on strain gages (Pantani et al., Int. Pol. Proc., 12, 396; 1997)
PP - 3mm
1.00
1.10
1.20
1.30
1.40
1.50
Free Constrained
Shrin
kage
(%)
Parallel shrinkage
Perpendicularshrinkage
At low hold pressure, if no physical restraints, polymer slidingObviousness of stress relaxation
23 / 40
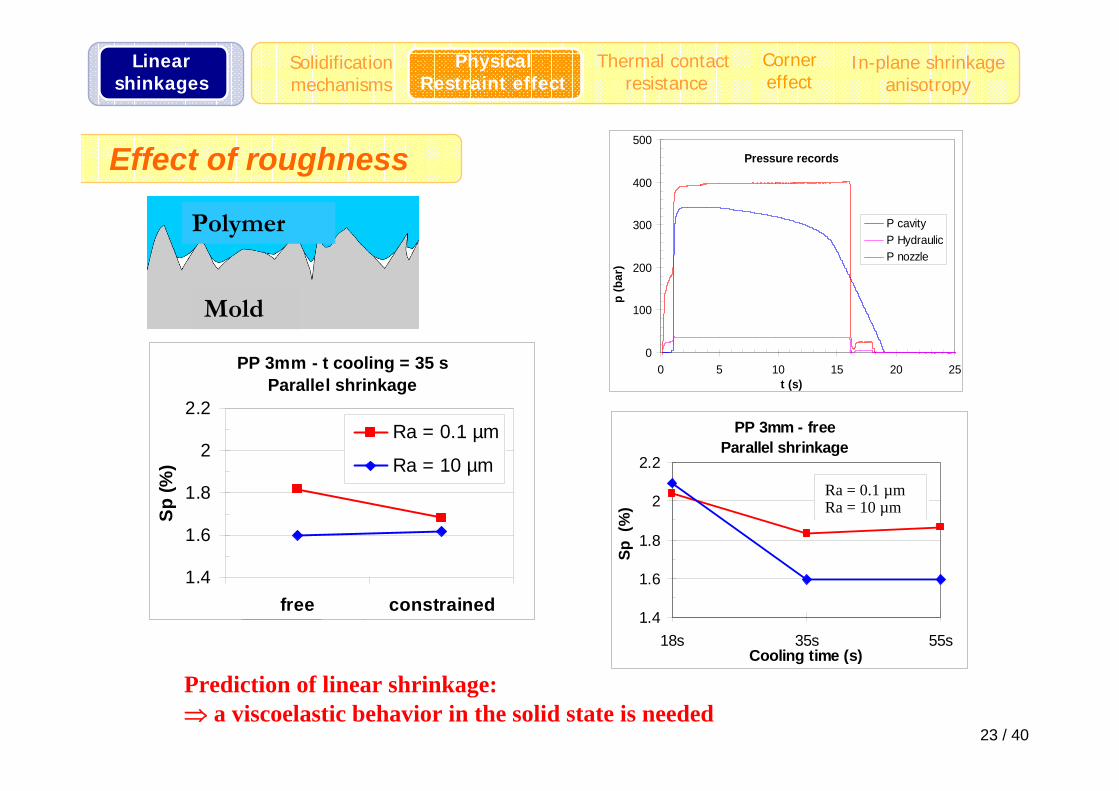
PP 3mm - freeParallel shrinkage
1.4
1.6
1.8
2
2.2
18s 35s 55sCooling time (s)
Sp (
%)
PolieGde Rugo
Ra = 0.1 µmRa = 10 µm
Prediction of linear shrinkage: ⇒ a viscoelastic behavior in the solid state is needed
Pressure records
0
100
200
300
400
500
0 5 10 15 20 25
P cavityP HydraulicP nozzle
p (b
ar)
t (s)
Effect of roughness
PP 3mm - t cooling = 35 sParallel shrinkage
1.4
1.6
1.8
2
2.2
free constrained
Sp (%
)
Ra = 0.1 µm
Ra = 10 µm
Mold
Polymer
Linearshinkages
PhysicalRestraint effect
Solidification mechanisms
Cornereffect
In-plane shrinkageanisotropy
Thermal contactresistance
24 / 40
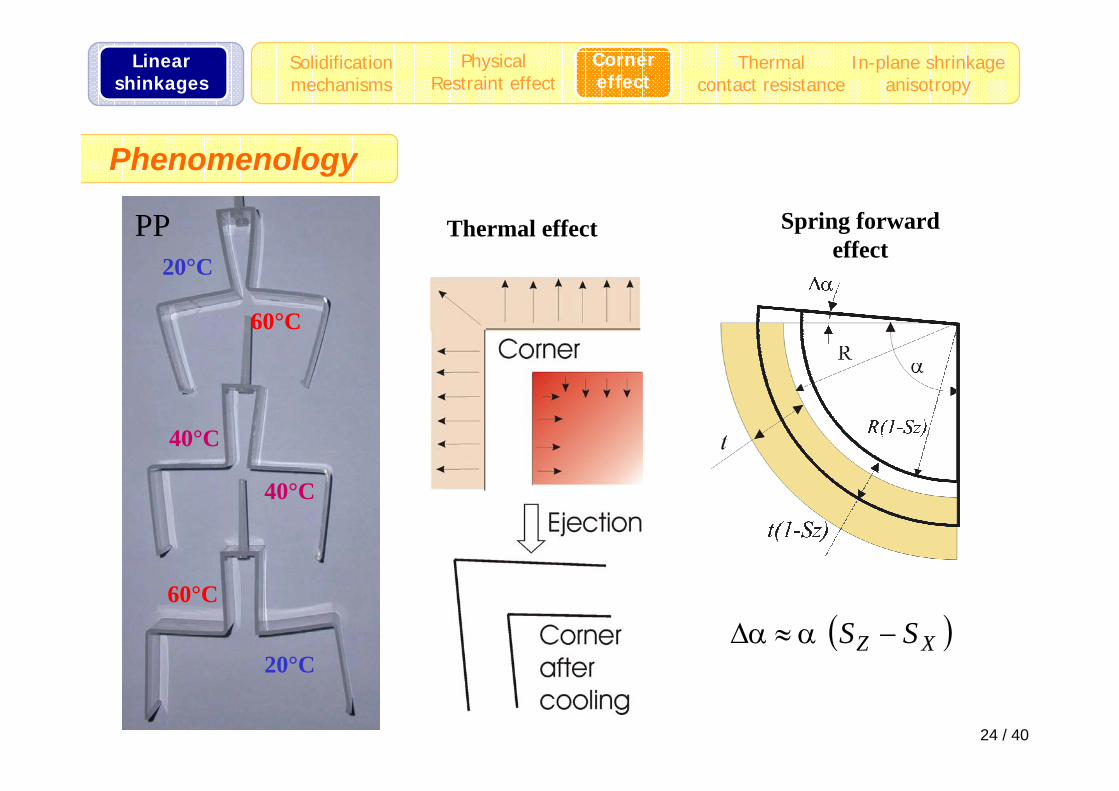
Phenomenology
40°C
40°C
60°C
20°C
60°C
20°CPP Thermal effect
( )XZ SS −α≈α∆
Spring forwardeffect
Linearshinkages
PhysicalRestraint effect
Solidification mechanisms
In-plane shrinkageanisotropy
Thermal contact resistance
Cornereffect
25 / 40
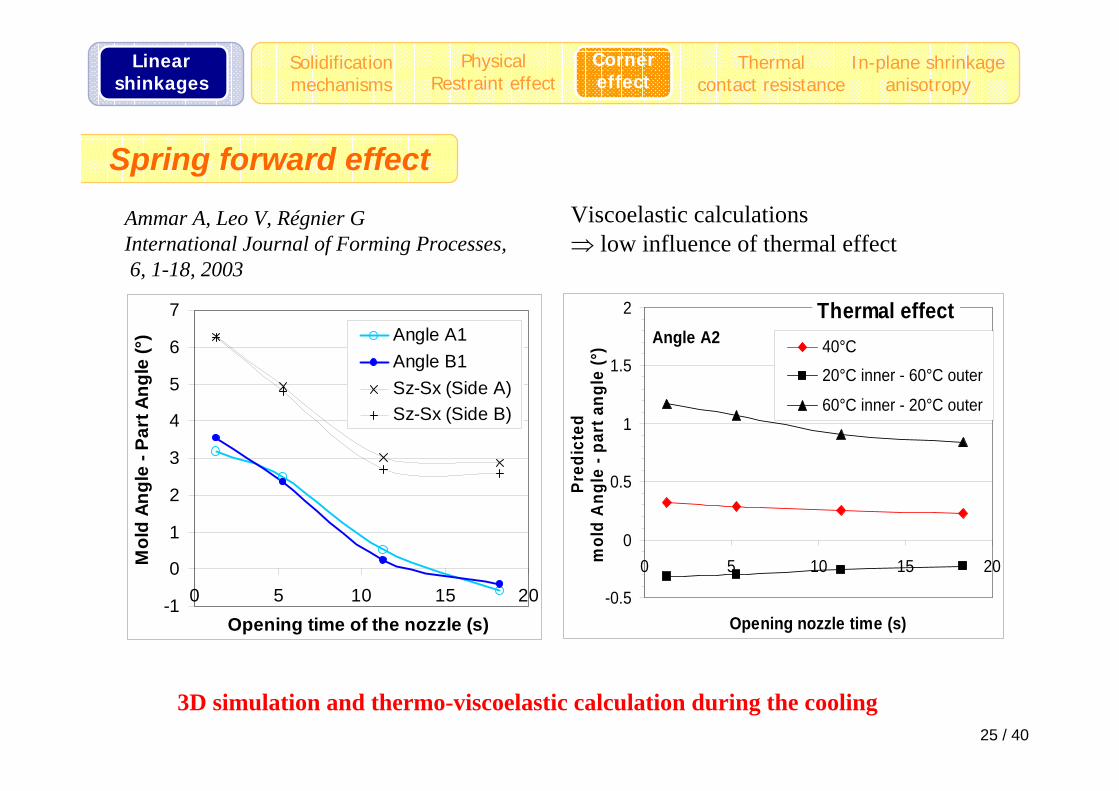
Ammar A, Leo V, Régnier GInternational Journal of Forming Processes,6, 1-18, 2003
Spring forward effect
-1
0
1
2
3
4
5
6
7
0 5 10 15 20Opening time of the nozzle (s)
Mol
d An
gle
- Par
t Ang
le (°
) Angle A1Angle B1Sz-Sx (Side A)Sz-Sx (Side B)
-0.5
0
0.5
1
1.5
2
0 5 10 15 20
Opening nozzle time (s)
Pred
icte
d m
old
Ang
le -
part
ang
le (°
) 40°C20°C inner - 60°C outer
60°C inner - 20°C outer
Angle A2Thermal effect
Viscoelastic calculations⇒ low influence of thermal effect
3D simulation and thermo-viscoelastic calculation during the cooling
Linearshinkages
PhysicalRestraint effect
Solidification mechanisms
In-plane shrinkageanisotropy
Thermal contact resistance
Cornereffect
26 / 40
Π 2
Π 1
0
Middle 1
T 20
T 10
∆T
Middle 2
Disturbed zone
T x 2 ( )
T x 1( )
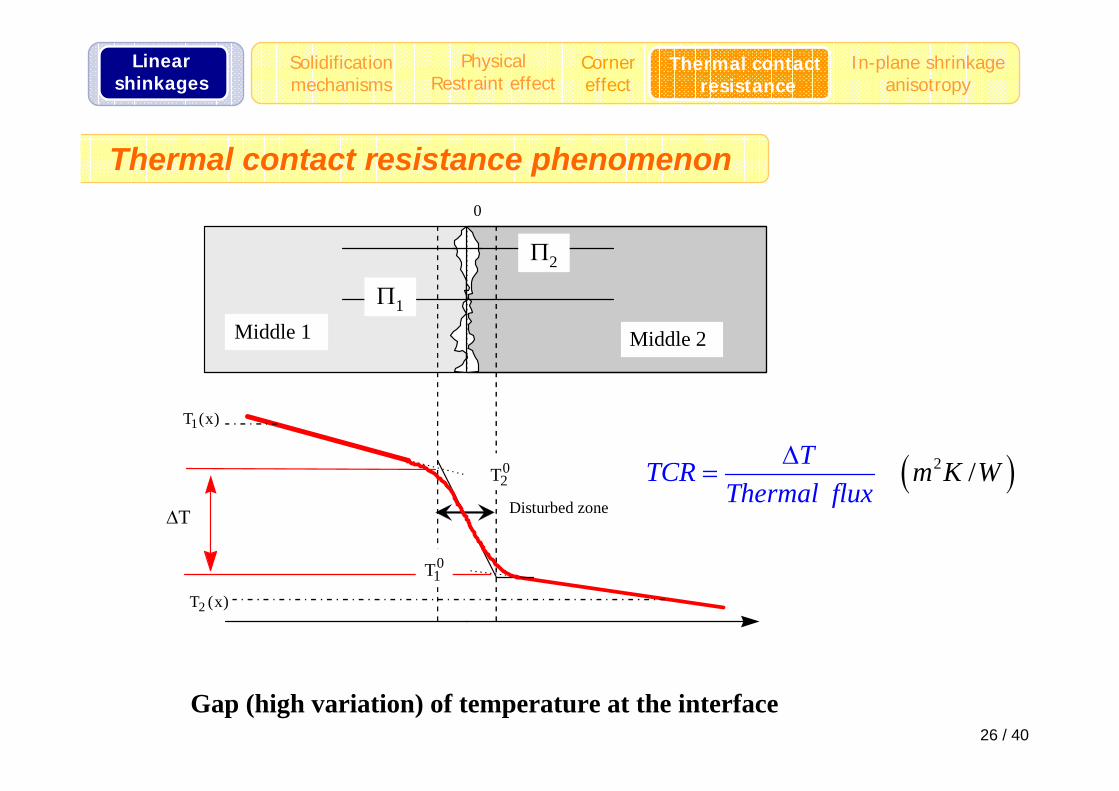
Thermal contact resistance phenomenon
Gap (high variation) of temperature at the interface
( )2 /TTCRTherma
ml flux
K W∆=
Linearshinkages
PhysicalRestraint effect
Solidification mechanisms
Cornereffect
In-plane shrinkageanisotropy
Thermal contactresistance
27 / 40
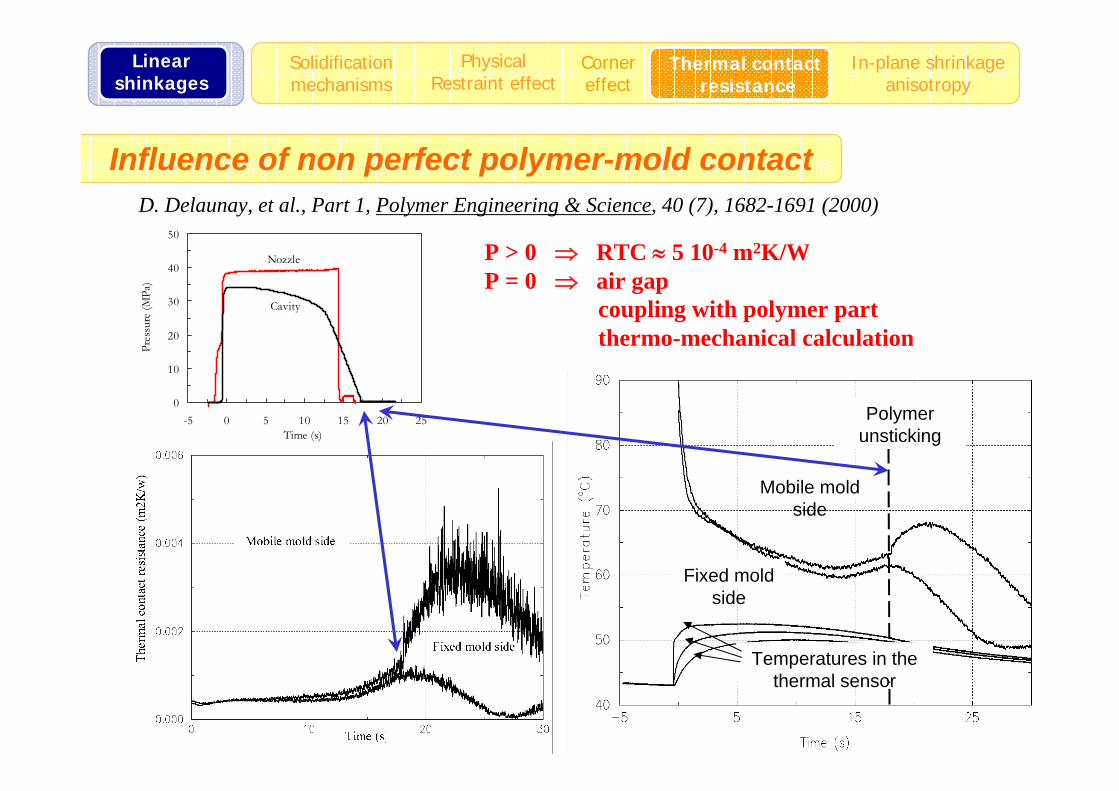
D. Delaunay, et al., Part 1, Polymer Engineering & Science, 40 (7), 1682-1691 (2000)
Influence of non perfect polymer-mold contact
0
10
20
30
40
50
-5 0 5 10 15 20 25Time (s)
Pres
sure
(MPa
)
Nozzle
Cavity
Fixed moldside
Mobile moldside
Polymerunsticking
Temperatures in thethermal sensor
Linearshinkages
PhysicalRestraint effect
Solidification mechanisms
Cornereffect
In-plane shrinkageanisotropy
Thermal contactresistance
P > 0 ⇒ RTC ≈ 5 10-4 m2K/WP = 0 ⇒ air gap
coupling with polymer part thermo-mechanical calculation

28 / 40
SHEAR INDUCEDCRYSTALLIZATION Skin Core
ANISOTROPIC MECHANICAL
PROPERTIES
0
1000
2000
3000
-0.50 -0.30 -0.10 0.10 0.30 0.50Depth (mm)
Youn
g M
odul
us (M
Pa)
E // - 1 mm
En - 1 mm
ANISOTROPY OF SHRINKAGE
0.60.8
1
1.21.4
1.6
1.8
20 30 40 50 60 70 80Cavity pressure (MPa)
In-p
lane
shr
inka
ge (
%)
PP - 1 mm
Parallel
Normal
Why is it important to get induced microstructure?
Microstructure characterizationSpatial distribution of molecular orientation
Linearshinkages
PhysicalRestraint effect
Solidification mechanisms
Thermal contactresistance
Cornereffect
In-plane shrinkageanisotropy

29 / 40
MaterialiPP Solvay ELTEX PP HV 252MFI = 11 g/min for 2.16 kg at 230° CMw = 180.8 g/molMw/Mn = 7.3
Processing parameters• Thickness 1mm and 3 mm• Injection times 0.7s and 1.6s
Sprue
Pressure sensorHeat flux sensor
Zone A Zone B
GateØ6
60
Ø4
6047
17
Feed geometry
Material and injection conditions
Linearshinkages
PhysicalRestraint effect
Solidification mechanisms
Thermal contactresistance
Cornereffect
In-plane shrinkageanisotropy

30 / 40
0
0.2
0.4
0.6
0.8
0 0.5 1 1.5Depth (mm)
Cry
stal
linity
(%)
PP 1 mm
PP 3mm
Crystallinity measurement of the microtomed slicesby means of a density gradient column
α phase
Crystallinity and microstructure
Linearshinkages
PhysicalRestraint effect
Solidification mechanisms
Thermal contactresistance
Cornereffect
In-plane shrinkageanisotropy

31 / 40
Linearshinkages
PhysicalRestraint effect
Solidification mechanisms
Thermal contactresistance
Cornereffect
In-plane shrinkageanisotropy
1mm thick / 0.2 mm deep
0
0.2
0.4
0.6
0.8
1
8009001000110012001300140015001600
cm-1Ab
sorb
ance pll polarization
P//
1mm thick / 0.2 mm deep
0
0.2
0.4
0.6
0.8
1
8009001000110012001300140015001600
cm-1Ab
sorb
ance pll polarization prp polarization
P⊥
( )2
2
+=α+θ
DDcos⊥
=h
//hD
Infrared dichroism principle

32 / 40
Linearshinkages
PhysicalRestraint effect
Solidification mechanisms
Thermal contactresistance
Cornereffect
In-plane shrinkageanisotropy
2
2
1 2 22 2 1
D cotgfD cotg
αα
⎛ ⎞− +⎛ ⎞= ⎜ ⎟ ⎜ ⎟+ −⎝ ⎠ ⎝ ⎠
Uniaxial orientation 23 cos 12
f θ< > −=
Isotrope f = 0Orienté suivant z : f = 1Orienté ⊥ z : f = 0.5
Band (cm-1) Type Transition moment angle (°C)
998 C 181220 C 721256 A+C 02725 A 90
Choice of peaks for PP (Samuels, 1981) (Jasse et Koenig, 1979)
( ) amccrcav fVfVf −+= 1Vc : crystalline volumic fraction
Infrared dichroism principle

33 / 40
-0.10
0.10.20.30.40.50.60.70.80.9
1
0 0.1 0.2 0.3 0.4 0.5 0.6
Depth (mm)
Orie
ntat
ion
func
tion
f crystalline - 988 cm-1f mean - 1256 cm-1fav Calculatedf amorphous - 2725 cm-1
Core Skin
Infrared dichroism on 35µm-thick microtomed slices
Molecular chain orientation – 1 mm plate
Linearshinkages
PhysicalRestraint effect
Solidification mechanisms
Thermal contactresistance
Cornereffect
In-plane shrinkageanisotropy
Mendoza R, Régnier G, Seiler W, Lebrun JL,Polymer,, 44 (11),
3363-3370 (2003).

34 / 40
-0.1
0.0
0.1
0.2
0.3
0.4
0.5
0.6
0 0.2 0.4 0.6 0.8 1 1.2 1.4
Depth (mm)
f cry
stal
line
t = 1 mm - 'injection time = 1.6 st = 1 mm - injection time = 0.7 st = 3 mm - injection time = 1.6 st = 3 mm - injection time = 0.7 s
Crystalline orientation and injection time
Linearshinkages
PhysicalRestraint effect
Solidification mechanisms
Thermal contactresistance
Cornereffect
In-plane shrinkageanisotropy

35 / 40
Morphology prediction
Zheng R, Kennedy, Journal of Rheology,48 (4), 823-842 (2004)
Kwon K, Isayev AI, Kim KH,Van Sweden C, Pol. Eng. Sci.,46, 712(2006)
Linearshinkages
PhysicalRestraint effect
Solidification mechanisms
Thermal contactresistance
Cornereffect
In-plane shrinkageanisotropy
⇒ Possible to consider the mechanical properties prediction of semi-crystalline polymers according to micromechanics modeling
Mechanical properties prediction
Bedoui F, Diani J, Regnier G,Acta Materiala, 54, 1513 (2006)
Viscoelastic flow coupled withflow-induced crystallisation kinetics

36 / 40
NDz
MD
TDCylindrical sampleDiameter = 3mm
CCD camera
Synchrotron microbeam
y
x
DSAXS D = 1.3 mWAXS D = 0.14 m
300 µm100 µm
ESRFD2AM beamline
Coupled WAXS and SAXS microbeam technique
Linearshinkages
PhysicalRestraint effect
Solidification mechanisms
Thermal contactresistance
Cornereffect
In-plane shrinkageanisotropy

37 / 40
Post-fillinglayer
Core
Fillinglayer
Plane 110 Plane 040
Specific bimodal orientationM
N
T
Daughterlamella
Mainlamella
-0.5
-0.25
0
0.25
0.5
0.75
1
0 0.2 0.4 0.6
Depth (mm)
f b
M - t =1.6s M - t =0.7s
T - t =1.6s T - t =0.7s
N - t =1.6s N - t =0.7s
b
WAXS Pole figures – 1mm-thick plate
Linearshinkages
PhysicalRestraint effect
Solidification mechanisms
Thermal contactresistance
Cornereffect
In-plane shrinkageanisotropy

38 / 40
1 mmFilling layer
Post-fillinglayer
Core layer
3 mm
SAXS analysis
Linearshinkages
PhysicalRestraint effect
Solidification mechanisms
Thermal contactresistance
Cornereffect
In-plane shrinkageanisotropy

39 / 40-0.5
-0.25
0
0.25
0.5
0 0.1 0.2 0.3 0.4 0.5Depth (mm)
Orie
ntat
ion
func
tion faM fbM fcM
≈ 2 µm 20 µm< 200 nm
10,5 nm
2,5 nm
? 9 nm
2 nm
M
1 mm-thick plate morphology
Linearshinkages
PhysicalRestraint effect
Solidification mechanisms
Thermal contactresistance
Cornereffect
In-plane shrinkageanisotropy
Mendoza R, Morphologies induites dans les pièces injectées en polyoléfines, PhD thesis of ENSAM, mai 2005

40 / 40
ConclusionsPrediction of shrinkage and warpage : at the end of the simulation process
⇒ all the errors induced by the numerous hypothesis are piled up
Nevertheless, in-plane shrinkage anisotropy prediction ⇒ viscoelastic flow
Amorphous polymersPolymers reinforced by fillersSemi-crystalline polymers
Several big challenges are still remaining:
- Shear-induced crystallization prediction- Microstructure prediction- Thermomechanical properties (final properties and also during process)
Special thanks the SWIM, SCOOP and FISH partners
- Efficient polymer characterization methods- Flow-induced crystallisation kinetics- Viscoelastic law identification on a large range of temperature
Difficulties for shrinkage and warpage prediction