physiology team 439 stroke volume & cardiac output. cardiovascular block/team...
TRANSCRIPT
stroke volume & cardiac output
Editing File
Black: in male / female slides
Red : important
Pink: in female slides only
Blue: in male slides only
Green: notes
Gray: extra information
Physiology Team 439

Objectives
❖ Define stroke volume, end-systolic volume, and end-diastolic volume.
❖ Define cardiac output, venous return, cardiac index & cardiac reserve.
❖ Understand the concept of preload and afterload.
❖ Understand the factors affecting the EDV (the venous return).
❖ Understand the factors affecting the ESV.
❖ Know how cardiac contractility & heart rate changes affect CO.
❖ Identify the factors that affect heart rate.
❖ Know the method for measurement of CO (The direct Fick’s method).
❖ Describe the factors affecting the SV&CO.

Term Definition
End-diastolic volume (EDV): Volume of blood in ventricles at the end of diastole = 110-130 mL.
End-systolic volume (ESV): Amount of blood left in ventricles at the end of systole = 40-60 mL.
Stroke volume (SV): Amount of blood ejected from ventricles during systole = 70-80 mL/beat.
Ejection fraction (EF): Fraction of EDV ejected during a heart beat =SV/EDV = 60-65 %.
● The stroke volume: Amount of blood ejected by each ventricle during systole (per beat)
What determines the stroke volume?
(SV = EDV - ESV)
As if I tell you: There were 10 apples in a basket, and now there are only 3 left. How many did I take? stroke volume.
Recap

Cardiac Output:● Cardiac Output: the volume of blood pumped (ejected) by the left ventricle per minute.
= stroke volume (≈70ml in adult at rest) 5 Liters in an average adult at rest.
What is the amount of blood pumped by the left ventricle per minute? Cardiac Output = Stroke volume x Heart Rate
CO=SVxHR
● Venous Return(VR) is the quantity of blood flowing from the veins into right atrium each minuteCO = VR
the volume leaving the heart (CO) is the same volume that returns to the heart (VR)
CO ≈ 5.6L/min.Men
CO ≈ 4.9L/min.Women
5L/min.Adult Average
Normal Values of Cardiac Output at Rest:Only in Female Slides
The normal adult blood volume is about 5L. This is the body’s entire blood supply, and it passes through the body once each minute. The blood makes one circulation per min.
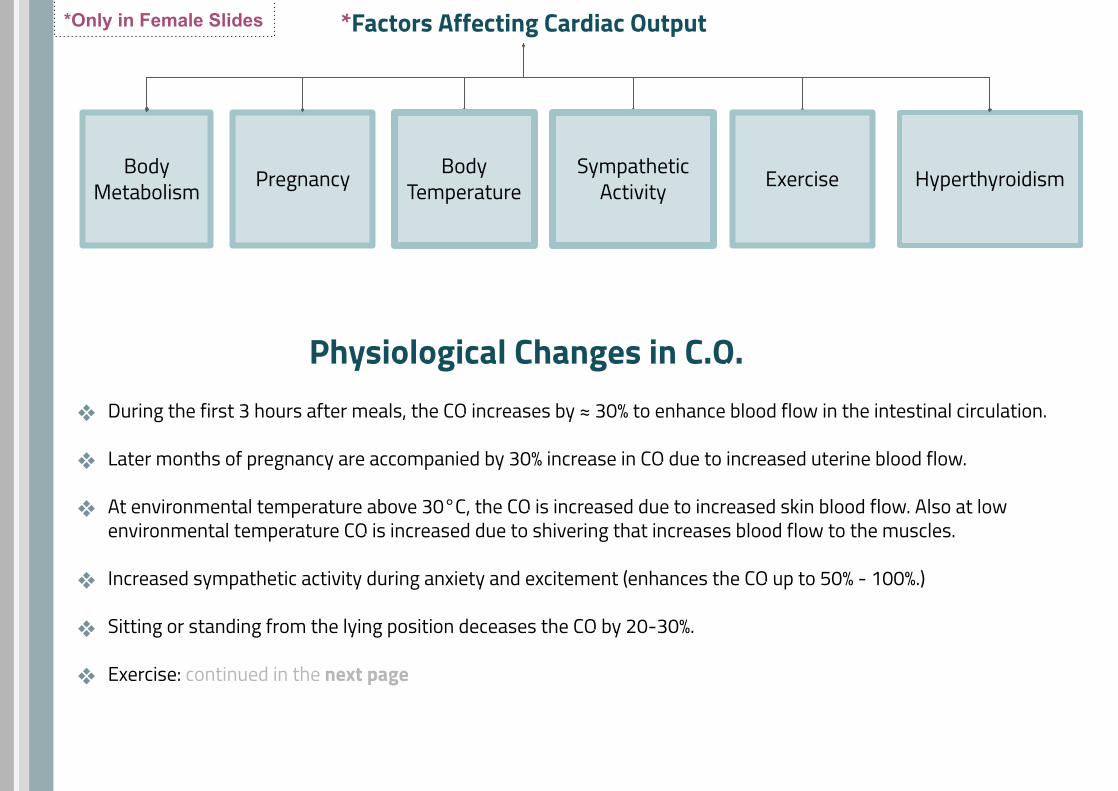
*Factors Affecting Cardiac Output
Sympathetic Activity
Body TemperaturePregnancy Exercise HyperthyroidismBody
Metabolism
Physiological Changes in C.O.During the first 3 hours after meals, the CO increases by ≈ 30% to enhance blood flow in the intestinal circulation.
Later months of pregnancy are accompanied by 30% increase in CO due to increased uterine blood flow.
At environmental temperature above 30°C, the CO is increased due to increased skin blood flow. Also at low environmental temperature CO is increased due to shivering that increases blood flow to the muscles.
Increased sympathetic activity during anxiety and excitement (enhances the CO up to 50% - 100%.)
Sitting or standing from the lying position deceases the CO by 20-30%.
Exercise: continued in the next page
*Only in Female Slides
❖
❖
❖
❖
❖
❖

Type of exercise Moderate Severe
Heart Rate increases to 200% of resting(140 beats/min)
increases to 300% of resting(200 beats/min)
Stroke Volume increases to 120% (85 ml) increases to 175% (125 ml)
Cardiac Output increases to 240% (12 L) increases to 500% - 700% (25 - 35 L)
Effects of Exercise on Heart Rate, SV and CO
In athletes, maximum CO may be 35L or more- can't increase maximum HR beyond 200 beats per min - that is why SV increases to 175 ml. If heart rate increase beyond 200 beats/min CO and SV will decrease because of improper filling of the ventricles.
all due to sympathetic activity
❖
Cardiac Output = Stroke volume x Heart Rate

Cardiac Reserve
During exercise, CO can increase to 20-25 liters/min and as high as 35 - 40 liters/min in well trained athletes because of maximum work or stimulation.
The difference between the resting CO at rest and the maximum volume of blood that the heart is capable of pumping per minute is known as the cardiac reserve.Ex: CO during maximum work- CO at rest = cardiac reserve 35-5=30Cardiac reserve it’s the maximum percentage that the cardiac output can increase above normal is called the cardiac reserve.Basically, under normal conditions, the heart can pump out more than it does. What it (can but) doesn’t pump out during normal contraction is called cardiac reserve
Cardiac IndexCardiac index is CO (litre per min) per square meter of body surface area.
CI = CO/m2 (CO divided by surface area of the body)
Since, CO vary with size of individual, age & gender.(For example, women have smaller CO than men, children have smaller CO than adults).Then, it is important to relate heart performance to the size of the individual.
Normal cardiac index= (3.2 Liters/min/m2 body surface area)
CardiacOutput
From Guyton:Experiments have shown that the cardiac output increases approximately in proportion to the surface area of the body. Therefore, cardiac output is frequently stated in terms of the cardiac index

Preload and AfterloadPreload:It is the amount of blood that returns to the heart from veins (VR).is the amount of blood presented to the VentriclesIt is the load on the muscle in the relaxed state. ( the ability of the ventricle to stretch )Is end-diastolic volume (EDV), which is related to right atrial pressure.
When venous return increases, end-diastolic volume increases and stretches or lengthens the ventricular muscle fibers.Preload increases in: 1- Hypervolemia (→ ↑VR → ↑EDV) 2- Heart failure (accumulation of blood in the ventricle)
Afterload:It is the resistance against which the ventricles contract.The ability of the ventricle to overcome the resistance and pump the bloodAfterload on the left ventricle increases, when aortic pressure increase.Afterload on the right ventricle increases, when pulmonary artery pressure increase.Afterload increase in: 1- Aortic/pulmonary stenosis 2- Hypertension 3- Vasoconstriction
right ventricle: pulmonary stenosis, vasoconstriction of pulmonary circulation.left ventricle: aortic stenosis, systemic vasoconstriction.
In stenosis the valves can’t open properly during systole “ contraction of the ventricles “ )

Preload and Afterload effect on Pressure Volume (PV) curve:
A. Increased preload: Increased venous return leads to Increase in SV based on the Frank-Starling relationship; and is reflected in increased width of the PV loop.
B. Increased afterload: due to an increase in aortic pressure; which leads to decrease in stroke volume.It is reflected in decreased width and increased height of thePV loop.
C. Increased contractility: causes an increased width and height of the PV loop.
Male slide only،Explained in the cardiac cycle in both slides
More details in next slide

Explanation of the PV curve:(A): When an extra amount of blood flows into the ventricles, the cardiac muscle is stretched to a greater length. his stretching in turn causes the muscle to contract with increased force because the actin and myosin filaments are brought to a more nearly optimal degree of overlap for force generation. Therefore, the ventricle, because of its increased pumping, automatically pumps the extra blood into the arteries.
(B): When the pressure in the aorta increases; it makes it more difficult for the left ventricle to pump the blood (due to decreased gradient difference) ...this will make the ESV higher ( more remains in the heart), thus, the distance on the curve between the EDV and the ESV shortens (x- axis i.e. width), and also the pressure inside the ventricle will increase (height)
(C): When the heart pumps large quantities of blood (such as in exercise) , the area of the work diagram becomes much larger. That is, it extends far to the right because the ventricle fills with more blood during diastole, it rises much higher because the ventricle contracts with greater pressure, and it usually extends farther to the left because the ventricle contracts to a smaller volume—especially if the ventricle is stimulated to increased activity by the sympathetic nervous system.
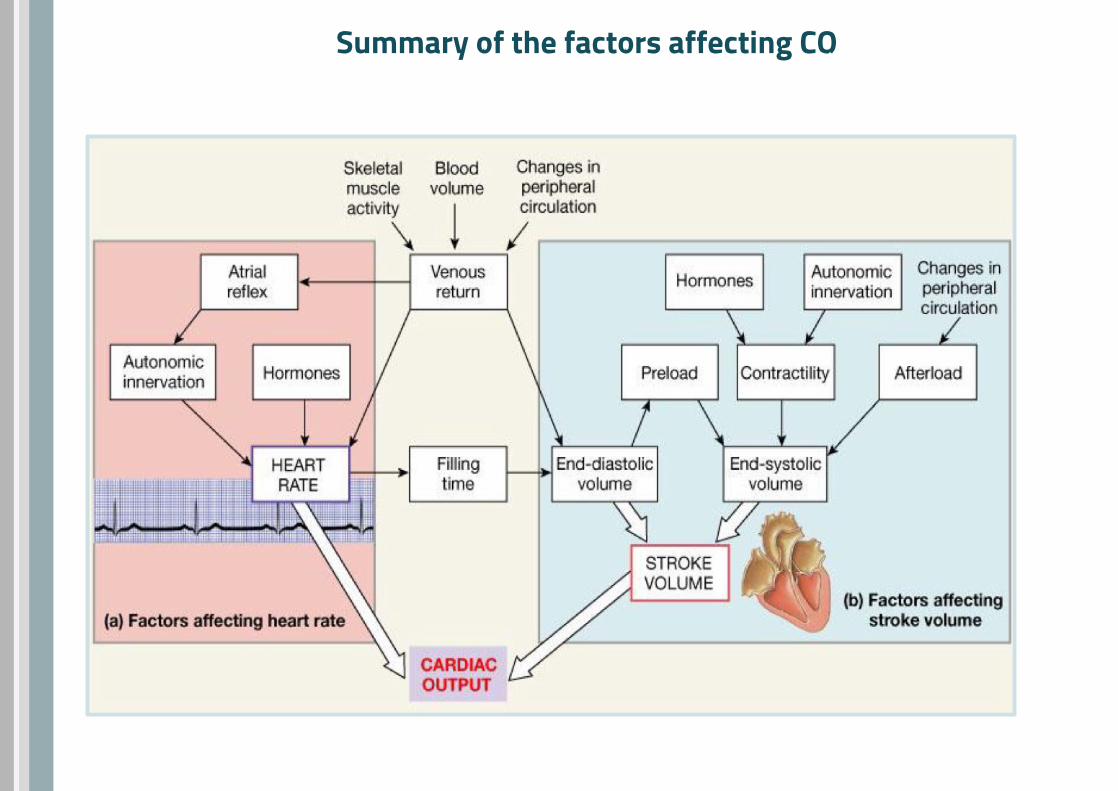
Regulation of Cardiac output:
CO is crucial since it is also the amount of blood that flows into the circulation and is responsible for transporting substances to and from the tissues. Thus, the body has strict control mechanisms that maintain adequate CO.
There are 2 major factors which determine CO; which are the SV and HR.
Female slide ONLY

Determinants of the CO
CO = (EDV - ESV) 𝐱 HRAny Factor affects these parameters will affect the CO
●
1. End-Diastolic Volume (EDV)
● EDV = the volume of blood in the ventricles prior to ventricular ejection.● How does the EDV affect the SV and hence the CO?
↑EDV↑The stretch in the
myocardium(↑initial fiber length)
↑Myocardial contractility (↑strength of contraction)Frank-Starling mechanism
↑ EDV→ ↑ CO↑ HR→ ↑ CO↑ ESV→ ↓ CO
Initial length: volume at the end of diastole & prior to systole.
CO = SV 𝐱 HR● SV = EDV - ESV●

Frank-Starling’s Law
● It is the intrinsic relationship between EDV and SV.
● It reflects the ability of the heart to change its force of contraction and therefore SV in response to changes in VR.
● If EDV (preload) is increased, the ventricular fiber length is also increased, resulting in an increased “tension” of the muscle (i.e SV increases in response to increase of the EDV).
Significance of Frank-Starling’s Law ● The energy of contraction is proportional to the initial length of the
cardiac muscle fibers (the EDV).
● within physiologic limits, the heart pumps all the blood that returns to it by the way of the veins. (Note:If the venous return increase beyond physiological limits, the heart will get stretched out and will not contract properly.)
● The greater the stretch of the cardiac muscle the greater would be the force of contraction. Because Actin & Myosin filaments are brought to more optional degree of sliding, therefore increase force of contraction.
↑VR → ↑EDV → ↑initial length → ↑force on contraction → ↑SV → ↑COwhen it exceeds physiological limits: ↑↑EDV → sarcomere disruption & loss of its function → ↓force of contraction → ↓SV

Factors affecting preload (EDV)
EDV Increases with:
● Increased total blood volume.
● Increased venous return.
● Increased tone:- increased skeletal muscle pump (exercise).- increased negative intrathoracic pressure.
● Stronger atrial contraction.
Indices of left ventricular preload1- ↑ left ventricular end-diastolic volume (LVEDV)2- ↑Left ventricular end-diastolic pressure (LVEDP)
vasoconstrictor tone → ↓ venous capacity → ↑ pressure → ↑ VR
pump more than 25% during atrial systole → ↑ EDV
If preload increase then:
EDV Decreases with:
● Standing.
● Decreased venous return.
● Increased intrapericardial pressure.
● Decreased ventricular compliance.
↓ VR by effect of gravity
pericardial effusion/cardiac tamponade → compression on heart→restricted cardiac inflow → ↓EDV
ventricular compliance: ability to stretch to accomodate blood.

Effect of Right Atrial Pressure on CO
Normally, Rt atrial pressure (RAP) fluctuates with atrial contraction and respiration.
When the mean RAP is about 0 mmHg, the CO in an adult is about 5 L/min.
Because of the steepness of the cardiac function curve, very small changes in RAP (just a few mmHg), can lead to large changes in cardiac output.
Effect of Sympathetic Stimulation on CO
From Guyton
Sympathetic stimulation affects both the heart and the systemic circulation: (1) It makes the heart a stronger pump.(2) in the systemic circulation, it increases the Psf because of contraction of the peripheral vessels, especially the veins, and it increases the resistance to venous return.
RAP ∝ SV & CO (direct relationship within physiological limits).+ve inotropic ⟶ ↑ RAP ⟶ ↑ EDV ⟶↑ SV & CO (opposite when -ve inotropic).
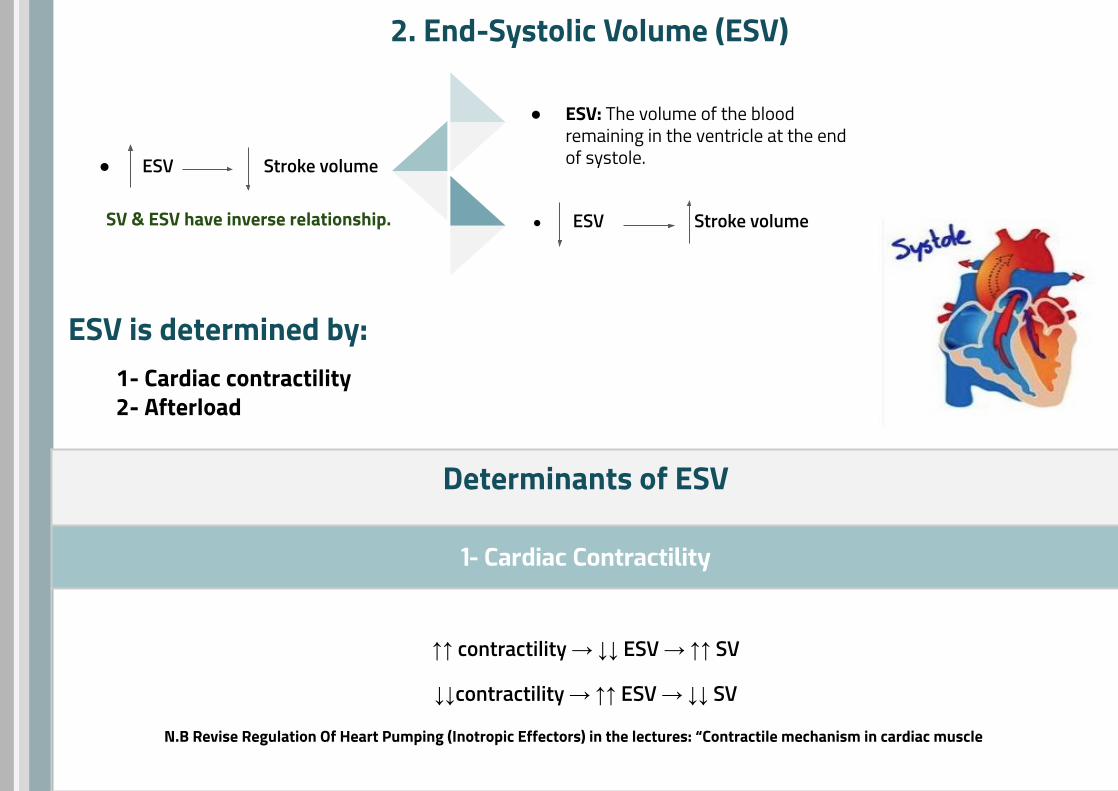
2. End-Systolic Volume (ESV)
● ESV Stroke volume
● ESV: The volume of the blood remaining in the ventricle at the end of systole.● ESV Stroke volume
ESV is determined by:1- Cardiac contractility2- Afterload
Determinants of ESV
1- Cardiac Contractility
↑↑ contractility → ↓↓ ESV → ↑↑ SV
↓↓contractility → ↑↑ ESV → ↓↓ SV
N.B Revise Regulation Of Heart Pumping (Inotropic Effectors) in the lectures: “Contractile mechanism in cardiac muscle
SV & ESV have inverse relationship.
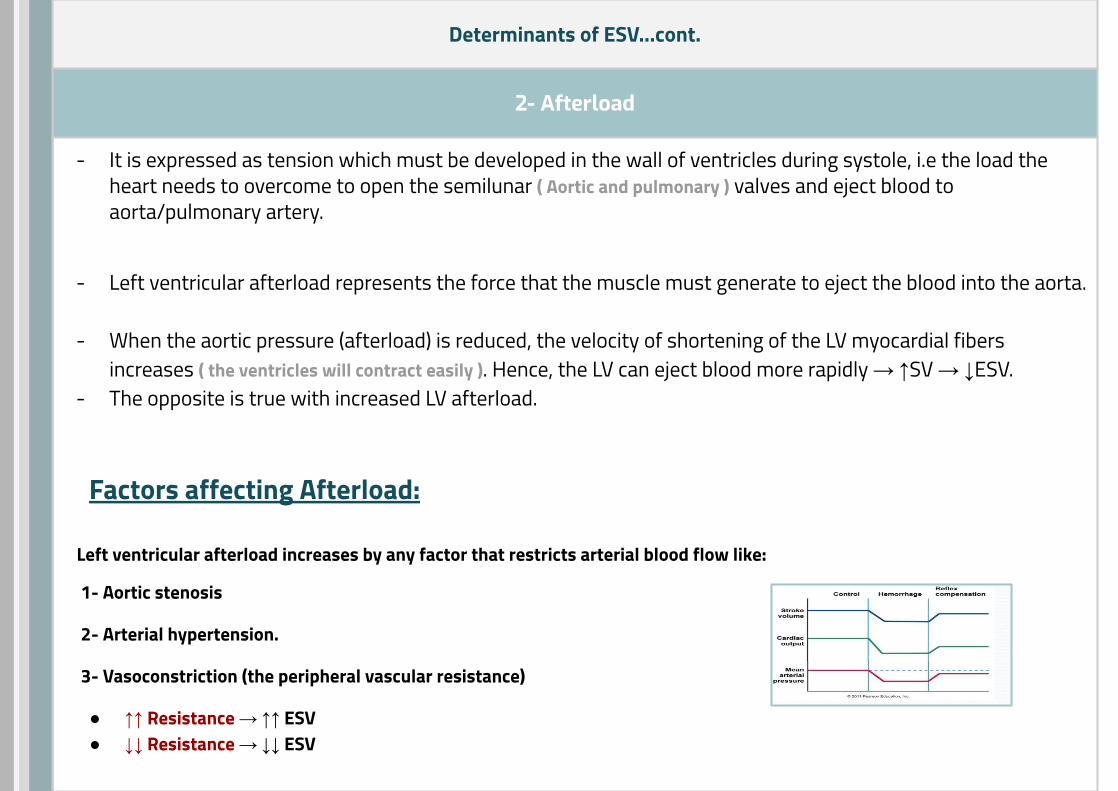
Determinants of ESV...cont.
2- Afterload
- It is expressed as tension which must be developed in the wall of ventricles during systole, i.e the load the heart needs to overcome to open the semilunar ( Aortic and pulmonary ) valves and eject blood to aorta/pulmonary artery.
- Left ventricular afterload represents the force that the muscle must generate to eject the blood into the aorta.
- When the aortic pressure (afterload) is reduced, the velocity of shortening of the LV myocardial fibers increases ( the ventricles will contract easily ). Hence, the LV can eject blood more rapidly → ↑SV → ↓ESV.
- The opposite is true with increased LV afterload.
Factors affecting Afterload:
Left ventricular afterload increases by any factor that restricts arterial blood flow like:
1- Aortic stenosis
2- Arterial hypertension.
3- Vasoconstriction (the peripheral vascular resistance)
● ↑↑ Resistance → ↑↑ ESV ● ↓↓ Resistance → ↓↓ ESV
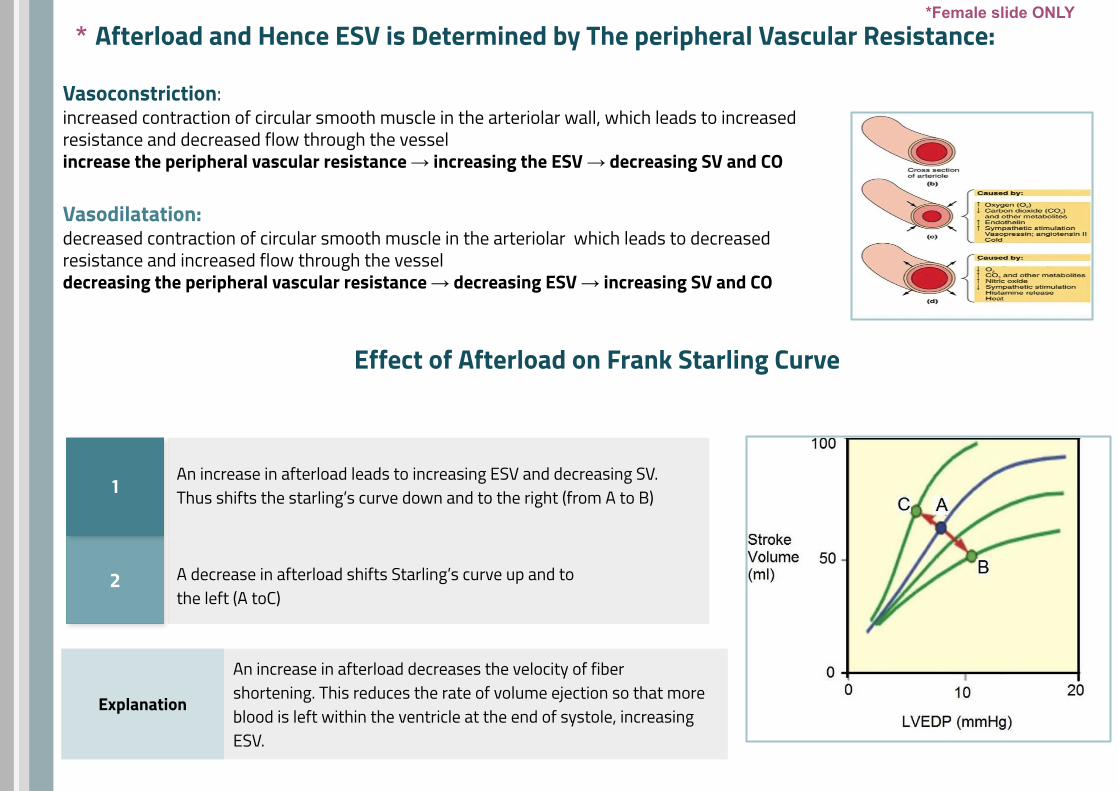
Afterload and Hence ESV is Determined by The peripheral Vascular Resistance:
Vasoconstriction:increased contraction of circular smooth muscle in the arteriolar wall, which leads to increased resistance and decreased flow through the vesselincrease the peripheral vascular resistance → increasing the ESV → decreasing SV and CO
Vasodilatation: decreased contraction of circular smooth muscle in the arteriolar which leads to decreased resistance and increased flow through the vessel decreasing the peripheral vascular resistance → decreasing ESV → increasing SV and CO
Effect of Afterload on Frank Starling Curve
2 A decrease in afterload shifts Starling’s curve up and to the left (A toC)
1An increase in afterload leads to increasing ESV and decreasing SV. Thus shifts the starling’s curve down and to the right (from A to B)
Explanation
An increase in afterload decreases the velocity of fiber shortening. This reduces the rate of volume ejection so that more blood is left within the ventricle at the end of systole, increasing ESV.
**Female slide ONLY

Summary of The Factors Affecting Stroke Volume
↑End diastolic volume ↑Contractility
↑Venous return
↑Stroke volume ↓arterial pressure (afterload)
↑sympathetic activity or epinephrine
Ventricle

Negative dromotropic agent produces a decrease in conduction velocity.
Contractility
Heart rate
Conduction Velocity
Positive inotropic agent produces an increase in contractility.
Negative inotropic agent produces a decrease in contractility.
Positive chronotropic agent produces an increase in HR.
Negative chronotropic agent produces a decrease in HR.
Positive dromotropic agent produces an increase in conduction velocity.
Inotropic, Chronotropic & Dromotropic

Sympathetic stimulation
This slide Only found in Male Slides
Positive ionotropic effect
Parasympathetic stimulation Potassium ion
Acetylcholine
Acidosis
Hypoxia (Decrease oxygen)
Drugs e.g.. Calcium channel blockers,
β- Blockers
FACTORS AFFECTING CONTRACTILITY
Adrenaline & Noradrenaline
Calcium ion
Caffeine
Drugs e.g. Digitalis (Digoxin)
Negative ionotropic effect
Physical factor Warming
Physical factor Cooling
digitalis
chloroform
alkalosis
some bacterial toxins (e.g.
diphtheria toxins)
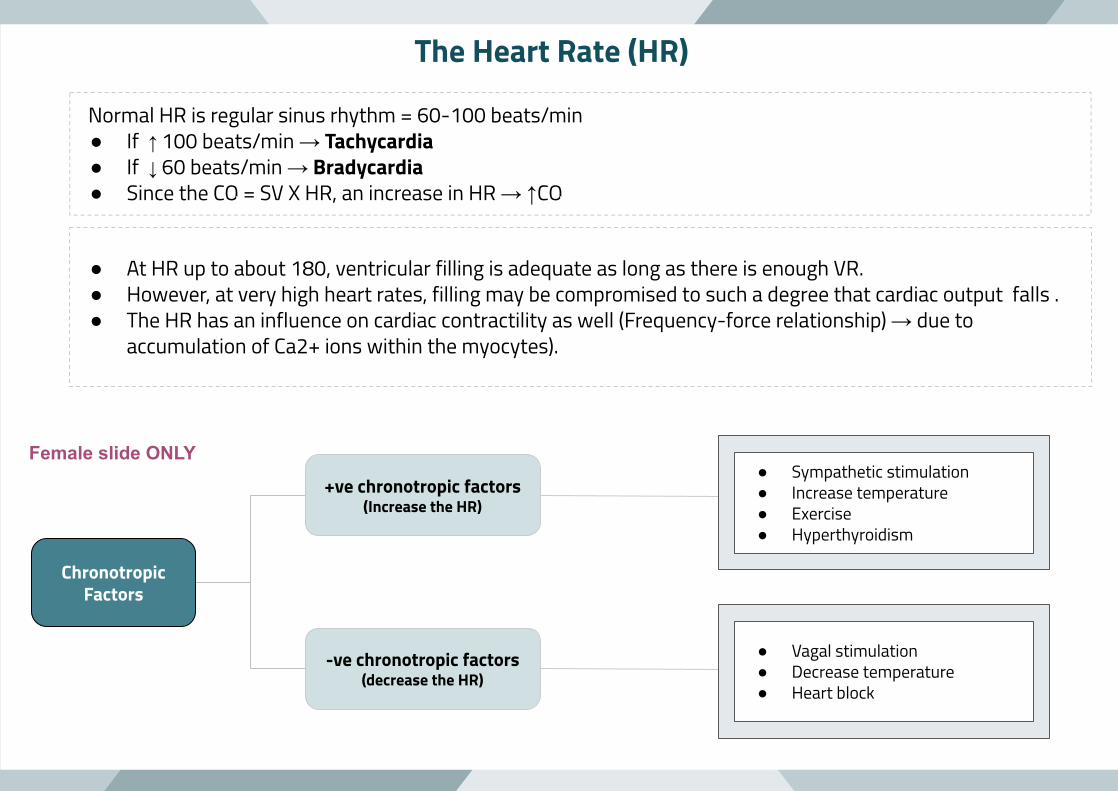
Normal HR is regular sinus rhythm = 60-100 beats/min ● If ↑ 100 beats/min → Tachycardia● If ↓ 60 beats/min → Bradycardia ● Since the CO = SV X HR, an increase in HR → ↑CO
The Heart Rate (HR)
● At HR up to about 180, ventricular filling is adequate as long as there is enough VR.● However, at very high heart rates, filling may be compromised to such a degree that cardiac output falls .● The HR has an influence on cardiac contractility as well (Frequency-force relationship) → due to
accumulation of Ca2+ ions within the myocytes).
Chronotropic Factors
+ve chronotropic factors(Increase the HR)
-ve chronotropic factors(decrease the HR)
● Sympathetic stimulation● Increase temperature● Exercise● Hyperthyroidism
● Vagal stimulation● Decrease temperature● Heart block
Female slide ONLY

1- Autonomic nervous system
Sympathetic nerves increase HR (& contractility) through NE or E which stimulates heart β1 receptors. E.g during stress, crisis or low BP.
Parasympathetic nerves innervate the SA and AV nodes, and the atria and Purkinje System.Parasympathetic nerves do not innervate most of the ventricular myocardium.Nerves (vagus nerve) slow HR (but has little inotropic action). Through Ach release that stimulates muscarinic (M2) receptors.
2- Physical factors
Age: resting HR is faster in fetus and then gradually decreases throughout life Gender: HR is faster in females (72-80 beats/min) than males (64-72 beats/min) .Temperature: heat increases HR as occurs in high fever. Cold has opposite effect .Exercise: increases HR through SNS
3- Hormones and drugs
Epinephrine and thyroxine increase HR.Increased calcium level in blood causes prolonged contraction.Reduced calcium level in blood depress the heart.
4- Blood volume Atrial Reflex (Bainbridge reflex)
● This reflex adjusts HR in response to venous return● Increase blood volume, stimulates stretch receptors in right atrium. ● This triggers increase in HR through increased sympathetic activity .
Regulation of Heart Rate
- so ↑ VR ⟶ ↑ CO through two mechanisms: Bainbridge reflex, Frank-starling’s law.
sympathetic ↑ SA node firing
parasympathetic ↓ SA node firing
-in normal conditions parasympathetic has the upper hand on the heart ( vagal tone ) & sympathetic has the upper hand on blood vessels (vasoconstrictor tone).
*
*
*
*female slide ONLY

↑K+ ions in the extracellular fluids causes the heart to become dilated and flaccid and also slows the HR . ↑K+ decreases the resting membrane potential in the cardiac muscle fibers . The intensity of the action potential also decreases, which makes contraction of the heart progressively weaker
*Effect of Ions & Temperature
↑Ca+2 ions causes spastic contraction . This is caused by a direct effect of calcium ions to initiate the cardiac contractile process . ↓Ca+2 causes flaccidity .
↑Temperature causes a greatly increased heart rate, sometimes to as fast as double normal [↑permeability to ions that self-excitation ] . ↓Temperature causes a greatly decreased heart rate, falling to as low as a few beats per minute .
*Only in male slides
What Is The Influence Of Heart Rate on Myocardial Contractility?Frequency-force relationship
This frequency dependency of force generation in the heart is probably due to accumulation of Ca2+ ions within the myocytes as a result of :
The increased number of depolarization/min → more frequent plateau phases → more Ca+2 entry.
The magnitude of Ca+2 current is also increased → increase the intracellular Ca+2 stores(Ca+2 induced Ca+2 release from sarcoplasmic reticulum )
Both effects enhance the release and uptake of Ca+2 by the sarcoplasmic reticulum, thus Ca+2 availability to the contractile proteins with more force generation through cross-bridge cycling

↑Activity of sympathetic nerves to heart ↓Activity of parasympathetic nerves to heart
Ventricular myocardium SA node
↑Stroke volume ↑Heart rate
↑Cardiac output
Regulation of Cardiac output by Autonomic nerves

Pathological Low or High CO
Causes of low CO :
● Low VR e.g haemorrhage “↓EDV→ ↓SV → ↓CO “ .● Reduced contractility e.g. heart failure “ ↑ESV → ↓CO “ .● Tachyarrhythmias e.g. atrial fibrillation and ventricular tachycardia
“improper filling of the ventricle” .● Marked bradycardia e.g. complete heart block .
Causes of high CO :
● Hyperthyroidism : the increase in the CO is due to the high metabolic rate → vasodilation → ↑ CO to 50% of control .
● AV fistulas “Arteriovenous fistula : communication between venous & arterial systems → ↑VR “.
● Fever● Anaemia● Anxiety
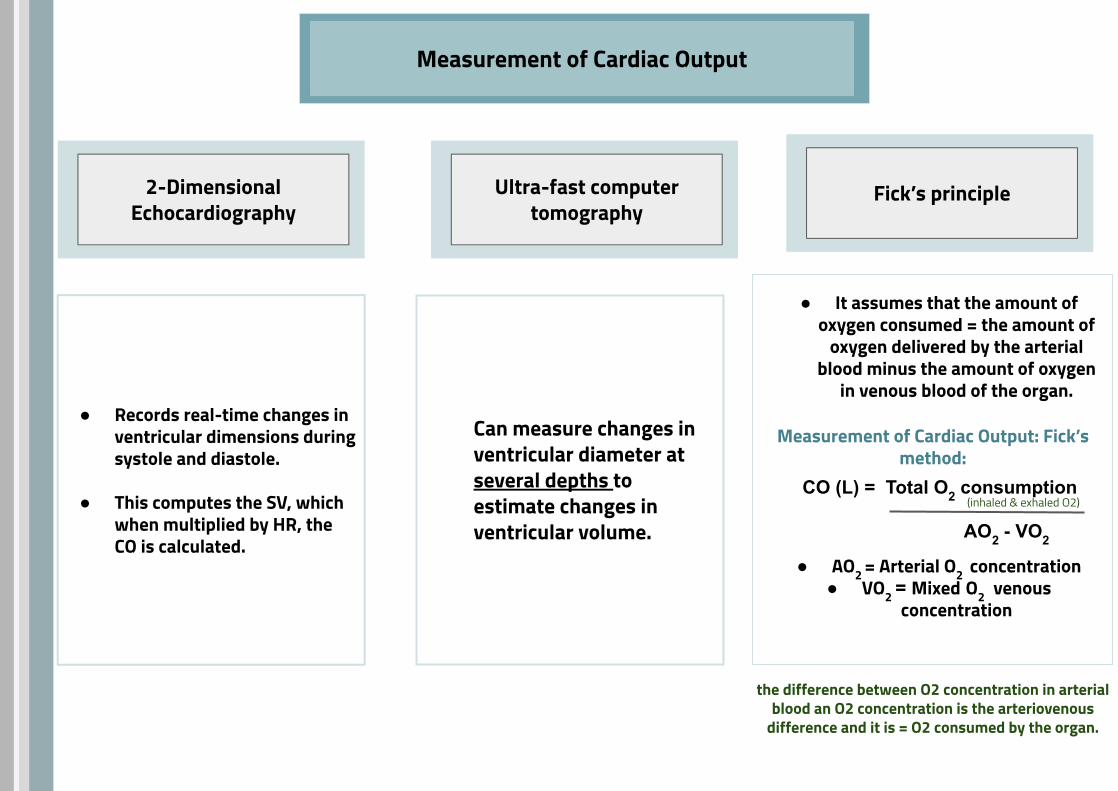
Measurement of Cardiac Output
2-Dimensional Echocardiography
Ultra-fast computer tomography
Fick’s principle
● Records real-time changes in ventricular dimensions during systole and diastole.
● This computes the SV, which when multiplied by HR, the CO is calculated.
Can measure changes in ventricular diameter at several depths to estimate changes in ventricular volume.
● It assumes that the amount of oxygen consumed = the amount of
oxygen delivered by the arterial blood minus the amount of oxygen
in venous blood of the organ.
● AO2 = Arterial O2 concentration ● VO2 = Mixed O2 venous
concentration
CO (L) = Total O2 consumption
AO2 - VO2
Measurement of Cardiac Output: Fick’s method:
the difference between O2 concentration in arterial blood an O2 concentration is the arteriovenous
difference and it is = O2 consumed by the organ.
(inhaled & exhaled O2)
Summary of the factors affecting CO

1- end-systolic volume is determined by:A. Cardiac contractilityB. AfterloadC. A&BD. LVEDV
2- It is the intrinsic relationship between EDV and SV:A. Cardiac OutputB. Frank-Starling’s lawC. Fick’s principleD. contractility
3- An increase in afterload leads to increasing ESV and decreasing SV. Thus shifts the starling’s curve …………... and to the …………...
A. up , leftB. down , leftC. up , rightD. down , right
4- Which one of the following is a +ve chronotropic factor ?A. Parasympathetic stimulation B. Heart blockC. HyperthyroidismD. Decrease temperature
5- The frequency dependency of force generation in the heart is probably due to accumulation of :
A. Ca+2 ionsB. Na ionsC. O2D. CO2
Answer key:1- C 2- B 3- D 4- C5- A 6- D 7-A. 8-C
6- Used to measure the Cardiac output :A. Fick’s principleB. dimensional echocardiographyC. Ultra-fast computer tomography D. All of the above
7- Given that the ESV is 45 ml, EDV is 115ml, and HR is 67, what is the cardiac output ?
A. 4.7 litersB. 4.3 litersC. 5 litersD. 5.2 liters
8- one of the following conditions decrease the width and increase the height of the PV curve:
A. Increased venous returnB. Exercise C. Increased aortic pressureD. B&C
MCQs:

SAQs:
1- Mention THREE factors increasing EDV and THREE factors decreasing it.
2- List the causes of pathological low cardiac output.
3- mention two pathologies where the preload increase.
1/ EDV increasing with: increased total blood volume - increased venous return. - stronger atrial contraction. EDV decreasing with: Standing - Decreased venous return - Increased intrapericardial pressure
2/ Low VR e.g haemorrhage , Reduced contractility e.g. heart failure , Tachyarrhythmias e.g. atrial fibrillation and ventricular tachycardia and Marked bradycardia e.g. complete heart block .
3/1- Hypervolemia, 2- Heart failure

Reviewer:
Teif Almutairi Abdulaziz Alsuhaim
Team Leaders
Sub-LeadersSarah AlQahtani Sadem Al Zayed
Members:
Noura bameri Yasmine Alqarni Basel fageha
Shatha AldhohairSpecial thanks for Omar Al-Suliman
Ghada alabdi Omar Alhalabi