physiology i influence of fertility levels on … rosario influence of... · plant physiology i i i...
TRANSCRIPT

I Plant Physiology I
I INFLUENCE OF FERTILITY LEVELS ON NITRATE REDUCTASE ACTIVITY AND ITS SIGNIFICANCE TO SUGAR YIELD
E.L. Rosario* and Kasem Sooksathan* *
*Department of Agronomy, UP at Los Baiios, College, Laguna, Philippines; **Department of Agronomy, Kasetsart University, Thailand
I ABSTRACT
Nitrate reductase activity (NRA) increased with increasing fertility levels and decreased with increasing plant age. The activity is highest at six months after planting, or two months after the final application of fertilizer N. Based on endogenous NRA at six months, the relative ranking of varieties was in the order: Co 785 > Phil 56226 > Phil 621 20 > F156 > CAC 571 1.
The rate of induction was found to be influenced by the amount of nutrients received by the plant. With a lag phase of about one hour, the maximum activity was recorded at 6, 5 and 3 hours in plants receiving 0, 200-100-400 and 400-200-800 applied fertilizer nutrients (kg/ha), respectively.
Positive correlation between NRA and cane tonnage, and sugar yield, has been established. NRA was negatively correlated with weight of sugar per ton cane (PS/TC).
A significant positive correlation was observed between NRA and TVD leaf nitrogen. Varieties with higher leaf N gave higher NRA values. The possible use of these relationships in determining fertilizer requirements for sugarcane varieties has been discussed.
INTRODUCTION
Variation in physiological and biochemical activities among plants is goGerned by their genetic constitution. Crop physiologists are in continuous search for yield-related physiological and biochemical parameters which could serve as reliable indices for plant selection. One possible approach is the analyses of certain plant components, especially the regulating enzyme systems, and their levels of activity should be related to metabolic potential of the genotype (Hageman et a110, Warner et all8).
It has been established that nitrate reductase (NR) is the controlling point for the input of reduced nitrogen and growth of the plant (Hageman et ~ 1 1 0 ) . Many investigators believe that its substrate (NO-3) is the prime inducer, and its activity, up to a certain level, is dependent upon substrate level (Beevers and Hageman4).
With the knowledge that nitrate reductase is inducible in nature, and since nitrate is the major form of nitrogen available to plants grown under upland conditions, it may be possible to use the enzyme as a tool for selection
9r 1825
1826 PLANT PHYSIOLOGY
of superior varieties in relation to nutrient utilization, particularly that of N. Moreover, NR is under genetic control (Zierserl and Hageman19) and is highly heritable (Warner et' allg), and its activity is highly associated to - yield and quality of several crops (Bar-Akiva et alz, Bowerman and Goodman6, Deckard et a17). These findings strengthen the feasibility of including this enzyme in a selection program.
'1 The assay procedure, particularly the in vivo method, is very simple and inexpensive, and enables a large number of samples to be programmed in a single day. The technique has been used on several sugarcane plantations in Hawaii (Maretzki and Cruz14), but it is relatively new, and information obtained so far is very limited. It would be oi interest to know more about such a technique and to exploit it under Philippine conditions or elsewhere, ~ar t icular l~ in the light of rising costs of fossil fuel and the energy require- ments of N manufacture. The specific, objectives of this study were:
1 . To determine nitrate reductase activity (NRA) in some Philippine commercially grown sugarcane varieties, using different methods of in- duction.
2. To find the levels of nitrate activity of both induced and endogenous nitrate reductase enzymes as influenced by levels of fertility.
3. To demonstrate how sugar yield and its components are associated with NRA, specifically leaf weight and other physiological parameters.
MATERIALS AND METHODS
Five sugarcane varieties, namely CAC 5711, Co785, Phil 5626, F156 and Phil 56226, were subjected to five fertility levels in kilograms per hectare as follows: FO (no fertilizer applied) FI (200-100-400), F2 (400-200-800) and FQ (600-300-1200). The treatments were distributed in a split-plot design, with fertilizer levels as mainplots and the sugarcane varieties as sub-plot. The treatments were replicated 4 times and each plot measured 5 x 5m2. The soil used was Lipa clay loam with the following properties: pH = 5.45; % N = 0.07; available P = 26.94 ppm and available K = 190.58 ppm.
Three-node seedpieces were used, with all except the middle buds re- moved. They were planted in rows spaced at 1 m and the cuttings were planted at 30 cm bud spacing along tQe row. Sampling and yield observations were made on the 3 middle rows of each plot. Plantings were made in September 1974 and the plants were harvested in October 1975.
Nitrate reductase was assayed using the method developed by Jaworskill. One hundred leaf disks from the top visible dewlap (TVD) leaf (50 disks from each side of the midrib) were used to determine in vivo NRA. Three methods were used for nitrate reductase induction as follows.

E.L. ROSARIO AND K. SOOKSATHAN 1827
Method I . Leaf disks were vacuum-infiltrated with either distilled water or 0.3 M KN03 for 1 minute. They were drained, kept in the refrigerator for 6 hours and assayed for endogenous and induced NRA. Just before assay, the tissue that had been vacuum infiltrated with 0.3 M KNOs was washed twice with cold distilled water jn order to remove NO; from outside the tissue.
Method I I . The same as above but, after vacuum infiltration, the tissue was incubated at 30°C in the dark.
Method I I I . The detached, but still intact, leaf was partially split at the midrib. One side of the leaf was dipped in distilled water, the other in 0.1 M KN03. The leaf was kept under natural light in the plastic house lor 4 hours, followed by assay. Activities obtained from the side dipped in water were endogenous values while those from the side dipped in KNOy solution were induced NRA values.
RESULTS AND DISCUSSION
Nitrate Reductase Activity as Injluenc\ed by Fertility Level and Variety
Endogenous Nitrate Reductase Activity (NRA,)
Tlie effects of fertility levels on NRA, at different dates of sampling are presented in Figures 1 to 4. NRA, increased with increasing fertilizer applications, being lowest (0.0336 p moles NO--'dm-2hr-1) at F, and highest (0.6001 p moles NO-'dm-2hr-') at Fa (Fig. I ) . Trends are similar for all sampling dates (Figs. 1 to 4) except that, after 6 months, fertilizer treatment F, did not significantly increase the enzyme activity when compared with the control. Significant increases in NRA, were obtained when the fertility level increased from F, to Fz. The effects of fertilizer on enzyme activity tended to decrease when the crop approached maturity. These results strongly indicate that fertilizer level is a major factor controlling NRA (Hageman and Flesherg).
Different varieties showed different responses to fertilizer application. It was obvious that, at lower fertility levels (F, to FI) Co785 gave the highest NRA, on all sampling dates, followed by F156. At higher levels (F2 and F,) F156 maintained the highest NRA, level throughout the period of observation.
With few exceptions, CAC5711 gave significantly lower NRA, at all fertility levels throughout the period of study. This indicates that fertility requirements of this variety are lower. F156 appears to benefit from in- creasing levels of fertility since it showed its highest NRA, at F2 and FS on all sampling dates.
1828 PLANT PHYSIOLOGY
FIGURE 1. Endogenous NRA of TVD leaf disks of five sugarcane varieties grown at different fertility levels. March, 1975 - 5 months after planting.
- - Fertility levels
When NRA, values on various sampling dates are taken into con- sideration, it is clear that NRA, decreases with age. This is in agreement with the observations or Hageman and Flesherg in corn, Maretzki and Cruz13 in sugarcane, and Shen17 in rice, that NRA decreased with plant age.
Among all dates of observation, April sampling (cane 6 months old or 2 months after the final N application) gave the best results. This supports the work in Hawaii of Maretzki and Cruzl4 who found the highest activity of NRA two months alter the final application of fertilizer nitrogen.
Based on NRA, activity obtained in the April sampling, varieties ranked as follows: F156 > Co785 > Phil 62120 > Phil 56226 > CAC 571 1.

E.L. ROSARIO AND K. SOOKSATHAN
FIGURE 2 . Endogenous NRA of TVD leaf disks of five sugarcane varieties grown at different fertility levels. April, 1975 - 6 months after planting.
P h i l 62120
Phi l 56226
CX! 5711
Cn 785
r . Fo F1 F2 F3
Fert i l i ty levels
I lnduced Nitrate Reductase Activity ( N R A i )
I In general, NRAi followed trends similar to those of NRA,. The activity decreased with increasing age of the plant. Except at lower levels during the 5th month, the highest values were obtained in samples taken at the 6th month. Varieties with higher NRA, also had higher NRAi.
Interactions between lertility levels and varieties were found at 6t" and 7th months after planting. At lower fertility levels (Fo and F1), the highest enzyme activity was recorded in Co785. At Fz level F156 showed the highest NRAi followed by Phil 56226. The latter gave significantly higher NRAi than Phil 62120, Co785 and CAC 5711 under Fz treatments.
From the above results, it is evident that different varieties performed differently in regard to NRAi. Since NRAi is the activity which was obtained after an external substrate was given, this result indicates clearly that different sugarcane genotypes differ in their ability to utilize additional in- crements of fertilizer, particularly N, and this ability is dependent upon the initial N level (Maretzki and'Cruz12). Plants given higher fertilizer N appli- cations could utilize less additional substrate.
PLANT PHYSIOLOGY
FIGURE 3 . Endogenous NRA of TVD leaf disks of five sugarcane varieties grown at different fertility levels. May, 1975 - 7 months after planting.
When NRAi levels fro111 different dates ol sampling were' compared, the 6t" month sampling gave the highest values. This suggests that the best time to sample for both endogellous and induced NRA was two months after the final amount of nitrogen had been applied.
FIGURE 4 . Endogenous NRA of TVD leaf disks of five sugarcane varieties grown at different fertility levels. June, 1975 - 8 months after planting.
0.25 1 1
F I
F1 F2 F3
Fer t i l i ty levels
E.L. ROSARIO AND K. SOOKSATHAN
Ratio of NRAi/NRAe
Tables I to 1,V show the ratios of induced and endogenous NRA at different dates of sampling. The ratios indicate the degree of N saturation in leaf tissue and in the plant as a whole. A low ratio means N saturation. The ratios of 1.6, 1.36, 1.36, 1.02 and 1.13 were obtained from Fo, FI, F2 and F3 treatments, respectively (Table I ) . The ratio from FO was comparable to that of FI but it was significantly higher than those of F2 and Fs treatments. The ratios recorded at F1, F2 and F3 did not show significant differences.
I TABLE I . Ratio of NRt/SRA. of sugarcane leaf disks kept in the refrigerator. March, 1975 - 5 months after planting.
I Variety F e r t i l i t y levels , ~ e a n l FO F1 F2 F3
CAC 5711 1.69 1.85 1.04 1.39 1.49a Co 785 1.85 1.25 0.97 0.99 1.26 b F 156 1.55 1.47 1.03 1.18 1.31ab P h i l 56226 1.44 1.27 0.94 1.22 1.22 b P h i l 62120 1.45 0.97 1.13 0.89 1.11 b
F e r t i l i t y l eve l s - Signif icant a t 0.05 l eve l \ CV(a) = 41% Variety - Signif icant a t 0.05 l eve l CV(b) = 23% Interact ion - Not s ign i f i can t
I TABLE 11. Ratio of NRAi/NRA. of sugarcane leaf disks kept in tp refrigerator. April, 1975 - 6 months after planting.
Variety F e r t i l i t y l eve l s ~ e a n l FO F1 F2 F3
CAC 5711 1.68 1.76 1.05 1.07 1.39a Co 785 1.25 1.24 0.85 0.75 1.02 bc F 156 1.07 1.33 1.09 0.90 1.10 b P h i l 56226 1.33 0.96 1.04 0.93 1.06 b P h i l 62120 1.06 1.10 0.65 0.63 0.86 c
F e r t i l i t y l eve l s - Signif icant a t 0.01 l eve l CV(a) = 30% Variety - Signif icant a t 0.01 l eve l CV(b) = 21% Interact ion - Not s ign i f i can t
I ~ a r i e t y , and f e r t i l i z e r means followed by a cornon l e t t e r a r e not s ign i f i can t ly d i f f e ren t a t '0.05 l eve l ( M T ) .
-
The results from April and March samplings were similar. Ratios obtained from FO and F, were comparable but both differed significantly from those of F2 and F3 treatments. The last two levels gave similar ratios. It has been observed that, at higher fertility levels (Fa and F3), the ratios were below 1. This may suggest an inhibitory effect of very high levels of substrate on NRAi as reported by Bar-Akiva and Sternbaum3, Beevers et all5 and Radin16.
PLANT PHYSIOLOGY
TABLE 111. Ratio of NRA,/NRA, of sugarcane leaf disks kept in the refrigerator. May, 1975 - 7 months after planting.
Variety F e r t i l i t y levels Mean1 FO F1 F2 F3
CAC 5711 1.83 2.26 1.48 1.67 1.81a Co 785 2.23 1.59 0.85 1.16 1.46 b F 156 1.45 1.58 0.93 1.17 1.28 bc Phi l 86226 1.54 1.43 1.07 0.93 1 .24bc Ph i l 62120 1.20 1.57 0.72 0.73 1.05 c
F e r t i l i t y levels - Signif icant a t 0.01 l eve l CV(a) = 21% Variety - Signif icant a t 0.01 level CV(b) = 24% ~n te rac t ion ' - Not s ign i f i can t
Varietal differences definitely influenced the ratios obtained. CAC 5711 maintained the highest ratios at all dates.of sampling while Phil 62120 showed the lowest ratios throughout the period of study. This indicates that a certain ratio would have to be established for each variety before the method could be used as a basis for practical fertilizer recommendations.
TABLE 1V. Ratio of NRA,/NRA, of sugarcane leaf disks kept in the refrigerator. June, 1975 - 8 months after plant~ng.
Variety F e r t i l i t y levels Mean1 FO F1 F2 F 3
CAC 5711 1.84 1.85 1.72 1.37 1.70a Co 785 1.43 1.21 1.06 1.16 1.21 b F 156 1.38 1.39 1.21 1.30 1.32-b Ph i l 56226 1.02 0.98 0.98 0.91 0.97 c Ph i l 62120 0.94 1.10 0.77 0.77 0.90 c
F e r t i l i t y levels - Not s ignif icant CV(a)=25% . Variety - Signif icant a t 0.01 level CV@) = 24% Interaction - Not s ign i f i can t
I ~ a r i e t y and f e r t i l i z e r means followed by a comon l e t t e r a re no t s ignif icant ly d i f fe ren t a t 0.05 l eve l (M).
No consistent ratios were obtained at different dates of sampling. April samplin gave the lowest ratio of 1.09 while May sampling gave the highest value o d 1.37. The values obtained were within the ratio values (1.1 to 1.8) reported by Maretzki and Cruz which indicate N sufficiency.
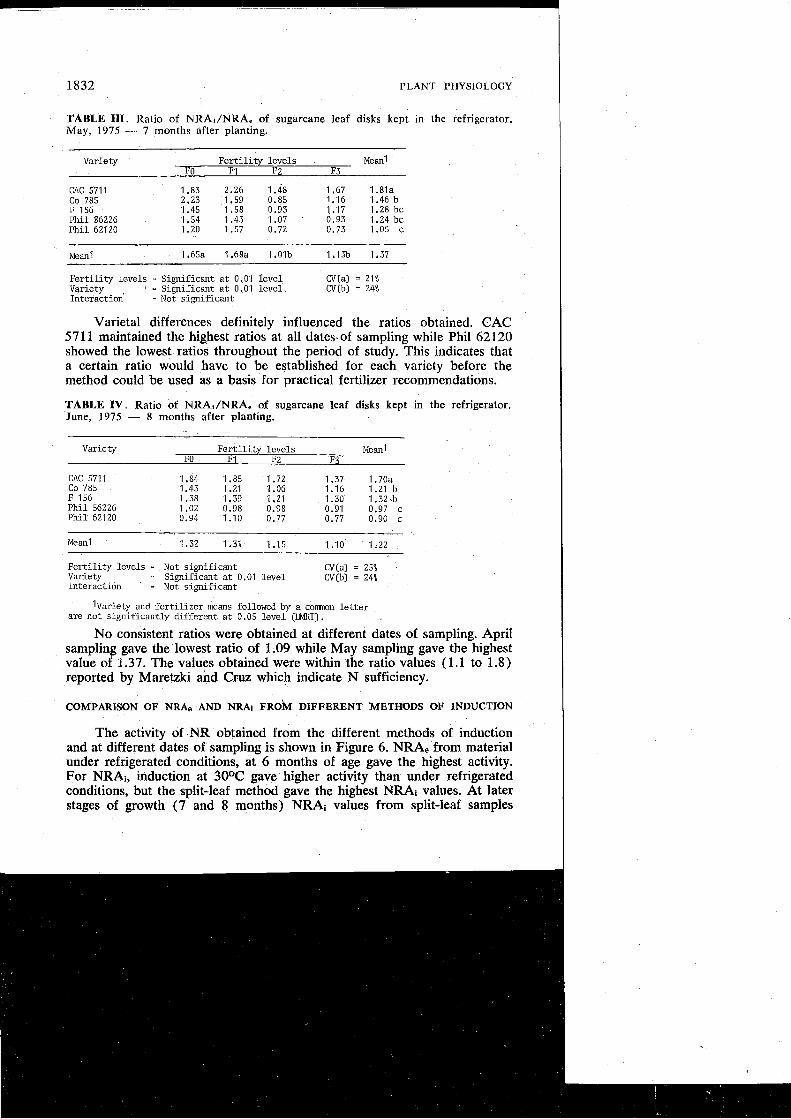
COMPARISON OF NRAe AND NRAi FRO^ DIFFERENT METHODS OF INDUCTION
The activity of NR obtained from the different methods oi induction and at different dates of sampling is shown in Figure 6. NRAe from material under refrigerated conditions, at 6 months of age gave the highest activity. For NRAi, induction at 30°C gave higher activity than under refrigerated conditions, but the split-leaf method gave the highest NRAi values. At later stages of growth (7 and 8 months) NRAi values from split-leaf samples
1 E.L. ROSARIO AND K. SOOKSATHAN
were about twice as high as those from the 30°C treatment. These results
suggest the importance of the induction methods in interpreting absolute ! values of NRA, and NRAI. The induced NRA values from material in the I
refrigerator or watesbath (30°C) were low. ~ FIGURE 5 . Comparison of endogenous and induced NRA at different stages of I
maturity and from different methods of induction (average of five varieties).
The split-leaf method appears to be reliable, although further study
should be made in order to improve the technique. Lateral movement of
I substrate from one side of the leaf blade to the other limited the proper
) assessment of this method in this study. In future studies, this may be
I overcome by measuring endogenous NRA before the induction begins or
by shortening the induction period.
Based on coefficient of variation (CV) values, Method 111 appears
to give better reproducibility for the determination of NRAe and NRAi.
Method 111 has the lowest variability, followed by Method 11. Method I
gives the most erratic values. The high CV values obtained could be due to
the use of individual leaf samples. Pooling the samples should reduced the
variability considerably. Furthermore, although TVD leaves were used, these
leaves were of different ages. A sugarcane leaf is formed in about 10 days
so that the TVD leaf samples vary in age by this time magnitude.
,i'
PLANT PHYSIOLOGY
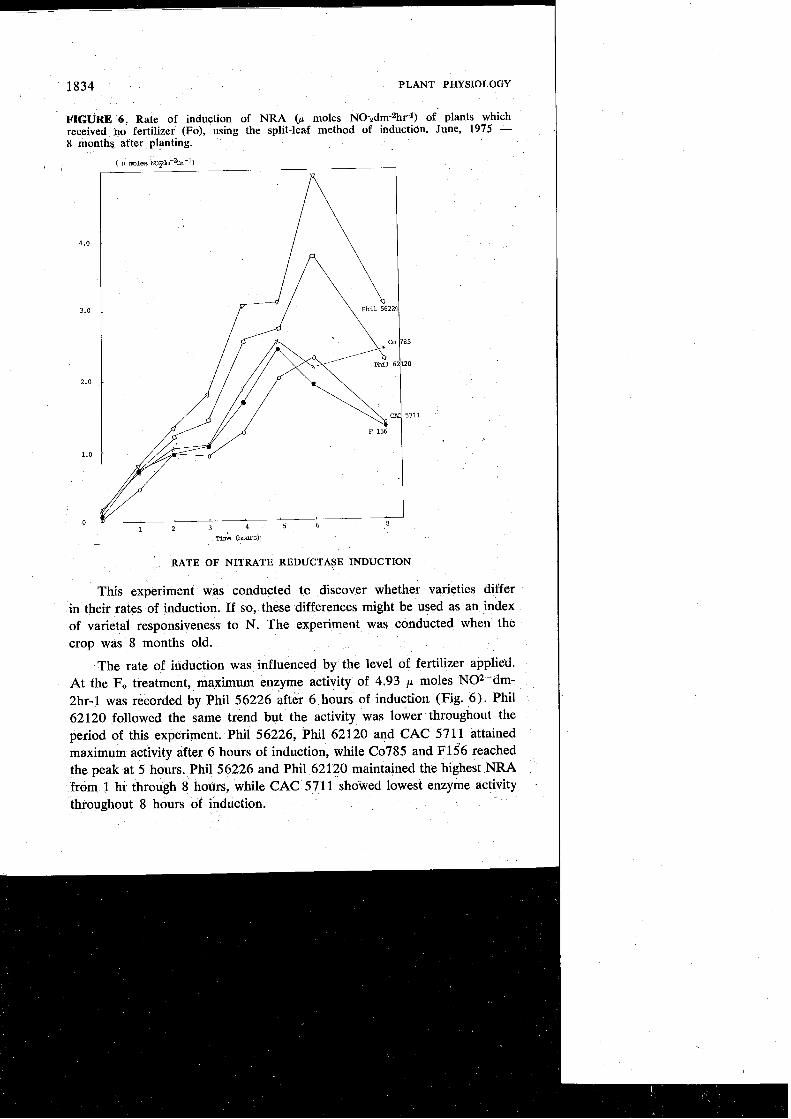
FIGURE 6 . Rate of induction of NRA (p moles Nadm-Zhr") of plants which received no fertilizer (Fo), using the split-leaf method of induction. June, 1975 - 8 months after planting.
TI& ( h o t d i
RATE OF NITRATE REDUCTASE INDUCTION
This experiment was conducted tc discover whether varieties differ in their rates of induction. If so, these differences might be used as an index of varietal responsiveness to N. The experiment was conducted when the crop was 8 months old.
The rate of induction was influenced by the level of fertilizer applied. At the F, treatment, maximum enzyme activity of 4.93 p moles NO2-dm- 2hr-1 was recorded by Phil 56226 after 6 hours of induction (Fig. 6). Phil 62120 followed the same trend but the activity was lower throughout the period of this experiment. Phil 56226, Phil 62120 and CAC 5711 attained maximum activity after 6 hours of induction, while Co785 and ~ 1 5 6 reached the peak at 5 hours. Phil 56226 and Phil 62120 maintained the highest NRA from 1 hr through 8 hours, while CAC 5711 showed lowest enzyme activity - throughout 8 hours of induction.
i
E.L. ROSARIO AND K. SOOKSATHAN 1835 I
Results from plants which received FI treatment were similar to those
receiving Fo. Again, Phil 56226 gave the highest NRA of 3.75 y moles
NO-=dm-lhr-1 after 5 hours of induction. CAC 5711 gave the lowest value
except at 5 hr of induction. Similar trends were observed from plants which
received the F2 treatment. Phil 56226 remained at the top until it reached
the peak after 3 hours of induction. Phil 62120 followed Phil 56226 closely,
while the other varieties showed lower activity. After one hour of induction
CAC 5711 gave higher NRA, but the difference was negligible.
Two peaks of NRA were found in plants receiving the Fz treatment.
The first peak was recorded at 3 hours and the second between 5 and 6
hours after induction.
Some inferences may be drawn from this experiment. Firstly, the
maximum NRAi values decreased with increased fertilizer levels received
by the plant. Secondly, the induction time required for maximum activity
decreased progressively from 6 to 5 and 3 hours as fertilizer application
increased.
Using rate of induction and levels of NRAi as criteria, Phil 56226 and
Phil 62120 showed the best responses. As will be pointed out later, both
varieties gave significantly higher cane tonnage than the other varieties. The
results presented show the possibility of using the rate of induction as a
criterion in selection for fertilizer nitrogen response.
RELEVANCE OF THE VARIOUS METHODS OF NRA DETERMINATION, AT VARIOUS
SAMPLING TIMES, TO DIFFERENT SUGAR YIELD CHARACTERS
Multiple regression analyses were run to discover the relevance of
NRA, and NRAI, as determined by various methods, at different levels of
nitrogen fertilization, on v and morphological characters which
include the following.
1836 ' PLANT PHYSIOLOGY
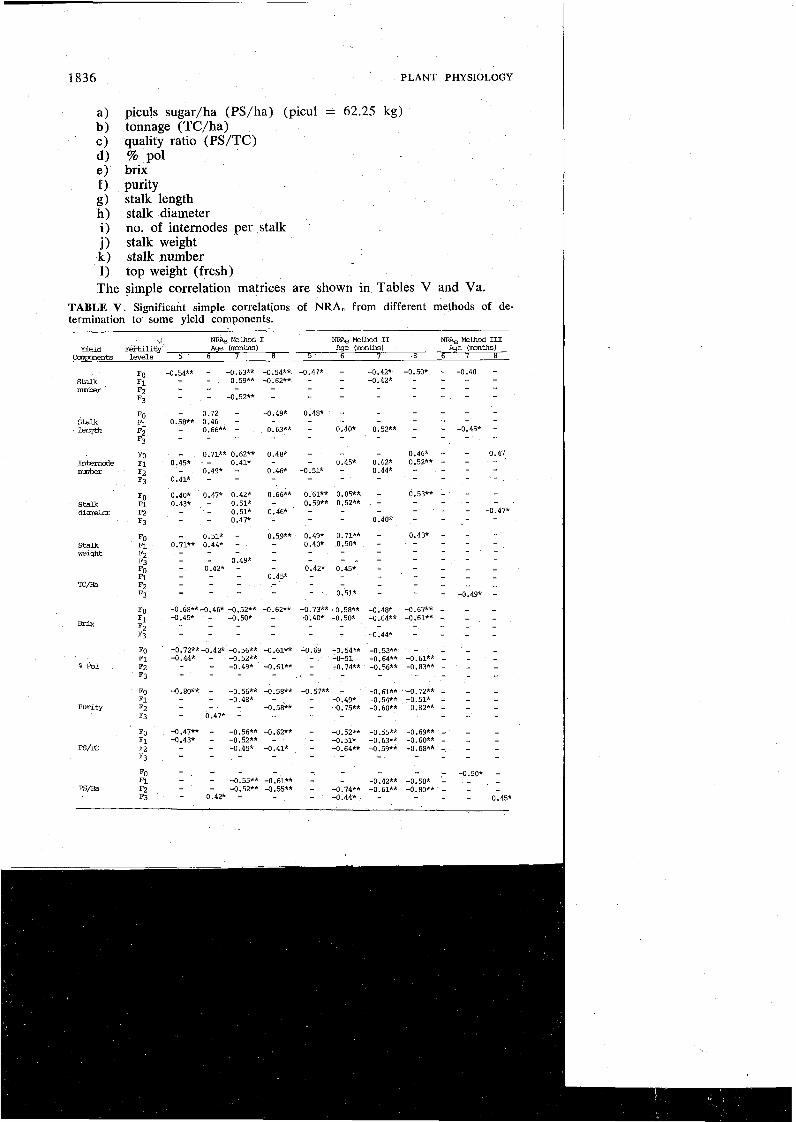
a) piculs sugar/ha (PS/ha) (picul = 62.25 kg) b) tonnage (TC/ha) c ) quality ratio (PS/TC) d) % pol e) brix f ) purity g) stalk length h) stalk diameter i ) no. of internodes per stalk j ) stalk weight k ) stalk number 1) top weight (fresh)
The simple correlation matrices are shown in Tables V and Va. TABLE V . Significant simple correlations of NRA, from different methods of de- termination to some yield components.
N& Wthod I NR& Method I1 NRAe Method 111 Ylela F e x t i l i t y Age (mnths) Age (mnths) Age (mnths)
Canponents levels 5 6 7 8 5 6 7 8 6 7 8
Fo -0.54** - -0.63** -0.54** -0.47* - -0.42* -0.50* - -0.40 - Stalk - - 0.59** -0.62** - - -0.42* - - - - n m h r F1 - - -
F2 - - - -
F3 - - -0.52** - - - - -
Fo - 0.72 - -0.49* 0.48* - - - - - Stalk F 1 0.58** 0.46 - - - - - I* F2 - 0.66** - 0.63** - 0.40" 0.52** - - -0.45* - - - - - - - -
FO - 0.71** 0.62** 0.48" - - 0.46* - - 0.47 Internode F1 0.45* - 0.41* - - 0.45* 0.42* 0.52** - - - n m b a 9 - 0.49" - 0.46* -0.51* - 0.44* - - - -
Fg 0.41* - - - - - -
Fo 0.40* 0.47* 0.42* 0.66** 0.61** 0.85** - 0.53** - - - Stalk F 1 0.43* - 0.51* - 0.59** 0.52** - - - - - aa1nete.r F2 - - 0.51* 0.46* - - - - -0.47*
F3 - - 0.47* - - 0.40* - - - -
- 0.51* - 0.59** 0.49* 0.71** - 0.43* - - - Sta lk 0.71** 0.44* - - 0.40* 0.50* - - - - - we~ght F2 - - - - - - -
F3 - - 0.49* - - * - - - - - F~ - 0.42* - - 0.42* 0.45* - - - - F 1 - - 0.45* - - - - -
E/Ha F2 - - - - . . - F3
- - - 0.51* - - - -0.49* -
Fo -0.80** - -0.56** -0.58** -0.57** - -0.61** -0.72** - - - F 1 - -0.48* - - -0.49* -0.54** -0.51* - - -
P u r i t y F2 - - -0.58&* - -0.75** -0.60** 0.82** - - - F3 - 0.47* - - - - -
E.L. ROSARIO AND K. SOOKSATHAN
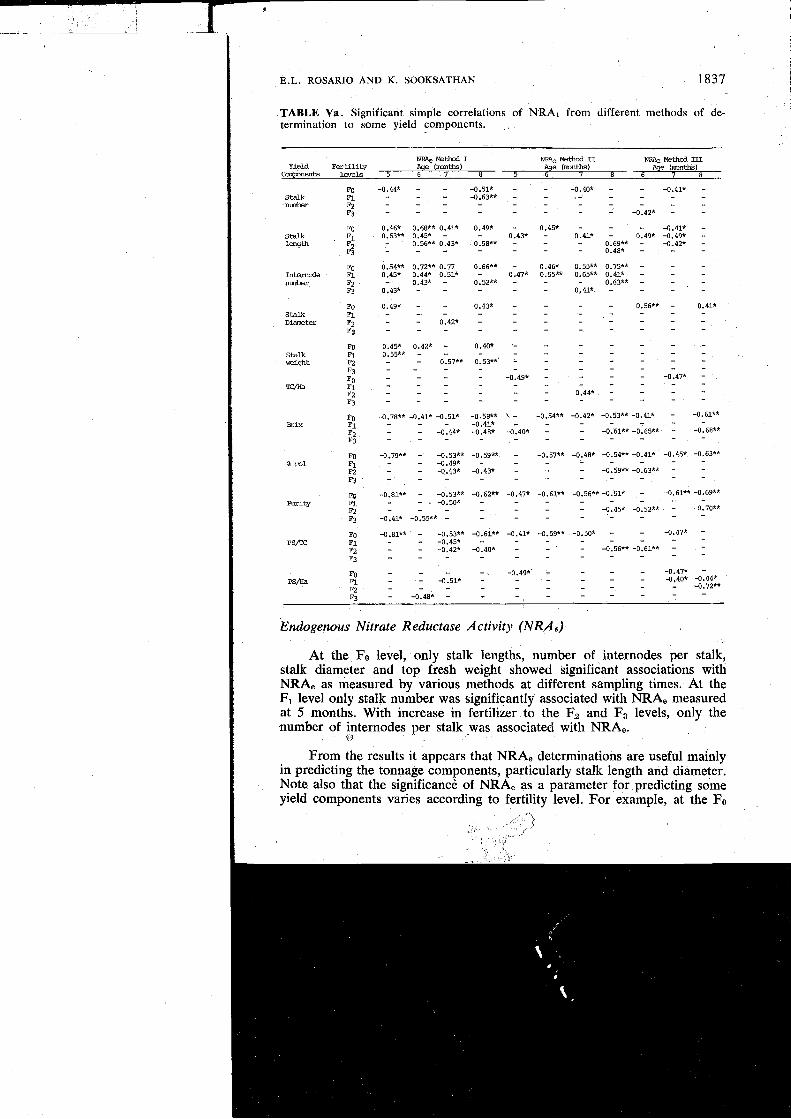
TABLE Va. Significant simple correlations of NRAi from different methods of de- termination to some yield components.
NF& M e W I McR, Methcd I1 NRpe Methad I11 Yield Fertility Age (nunths) Age (nunths) Age (mnths)
Ckx~qmnents levels 5 6 7 8 5 6 7 8 6 7 8
Fo -0.44* - - -0.51* - - -0.40* - - -0.41* - Stalk F1 - - -0.63** - . - nmker F2 - -
F3 - - - -0.42* - PO 0.46* 0.68** 0.41* 0.49* - 0.45* - - -0.41* -
Stalk 0.63** 0.45* - - 0.43* - 0.41* - 0.49* -0.49* - length E1 - 0.56**0.43* 0.58** - - - - 0.69" - -0.42* -
F: - - 0.48% -
stalk Diamzter
Stalk weight
Endogenous Nitrate Reductase Activity (NRA,)
At the Fo level, only stalk lengths, number of internodes per stalk, stalk diameter and top fresh weight showed significant associations with NRA, as measured by various methods at different sampling times. At the F, level only stalk number was significantly associated with NRA, measured at 5 months. With increase in fertilizer to the F, and Fa levels, only the number of internodes per stalk was associated with NRA,.
ti
From the results it appears that NRA, determinations are useful mainly in predicting the tonnage components, particularly stalk length and diameter. Note also that the significance of NRA, as a parameter for predicting some yield components varies according to fertility level. For example, at the FO
1 I
I I
1838 PLANT PHYSIOLOGY
level, NRA, is basically related to stalk length and diameter while at the F1 level, NRAe becomes related only to stalk number. At Fz and F3 levels, NRAe values can be,used as a parameter predicting numbers of in- ternodes per stalk.
Induced Nitrate Reductase Activity (NKAi)
At the FO level, stalk weight, tonnage corrected brix, % pol, apparent purity and PS/TC showed significant associations with NRAi. At the FI level, stalk length, number of internodes/stalk and apparent purity were shown to have significant association with NRAi as determined by various methods at different times. Increase of fertility to the F2 level showed no statistically significant yield related to any of the various bio- chemical parameters; while at the F3 level only stalk length was significant.
The significance of NRAi in cornparisoh with NRAe also varies with respect to the different yield parameters at various fertility levels. In con- trast to NRA,, NRAi appears to be a good indicator for predicting effects of fertilizer on sugar quality and its components.
NRA%/NRA, Ratio
Multiple regression analyses to determine the relevance of NRAi/NRA, ratio, as obtained by various methods at different times, in regard to the yield parameters show that at the FO level, stalk number and number of internodes are the yield components most significantly associated with tlie ratios. At the F1 level, only apparent purity shows statistical significance while at F2, no yield character shows any significant relationship with the ratio. At the F, level, only cane tonnage shows a statistically significant relationship to the ratio.
The trend is similar to that of NRA, and NRAi, as discussed earlier, where no specific yield character is particularly associated with this physiological parameter. There also appears to be a particular method as well as a sampling time suitable for a particular fertility level. This behavior needs further study to make NRA, or NRAj, or their ratio a reliable parameter for the prediction of yield and nutrient status of cane plants.
DISCUSSION
It has been established that the enzyme nitrate reductase in sugarcane, as in other plants, increases with increasing fertility levels, but the activity decreases with plant age. The highest activity was observed at 6 months after planting, or 2 months after the final N application. Marked increase in NRA was found with increased fertilizer up to the F2 level (400-200- 800 kg N-P205-KzO/ha), above which no significant increase was obtained.
E.L. ROSARIO AND K. SOOKSATHAN 1839
The measurable amount of the enzyme is dependent upon the amount of enzyme present in the tissue and on the assay procedure. Endogenous activity of NR (NRAe) was about 5 times lower than induced activity. NRA, obtained from tissue kept in the refrigerator was highest among the products of three procedures employed. Highest induced NRA (NRAi) was recorded with a split-leaf method of induction. For reliability Method 111 is recommended.
Rate of nitrate reductase induction may be used as a tool in the se- lection of sugarcane varieties for fertilizer response. Cut leaves dipped in 0.1 M KNO, solution showed a lag phase in induction of about 1 hour. Time of induction required for optimum activity was dependent upon the amount of Iertilization received by the plant. Regardless of variety, the maximum activity was recorded at 6, 5 and 3 hours from plants receiving the Fo, F, and Fz treatments, respectively. The activity from all varieties at all fertility levels decreased in the following order Phil 56226, Phil 62120, Co735, F156 and CAC 5711. The ranking was found to be the same for cane tonnage produced by these varieties, suggesting the use of this technique for selection of superior varieties with regard to fertilizer response.
Percentage total N in TVD leaves increased with increasing fertility levels, but it decreased with plant age.,Positive correlations between NRA, and leaf N have been established in this experiment.
SLW was found to increase with plant age and was influenced by fertility level. SLW increases with increased fertility levels up to a certain point beyond which its value decreases progressively. SLW was found to be related to sugar yield via its effect on sugar quality.
The ratio NRAJNRA,, which has been found useful in monitoring the N status of plants in other studies was unsuccessful here. Although the ratio decreased with increasing fertility level, the values obtained showed no correlation with tonnage or sugar yield. One of the possible reasons is underestimation of the enzyme values because of assay procedures. However, the values may be improved considerably by introducing the split-leaf (dip leaf) method of induction, and NRA, should be measured promptly after sampling.
The experiment demonstrated clearly that nitrate reductase activity positively affects cane yield by its positive effect on stalk length, number of internodes/stalk, stalk diameter and stalk weight. These observations agree with Bowerman and Goodman6 who obtained a significant positive correlation between NRA, and dry matter yield in sudangrass. Similar results were also obtained from studies with other plant species such as corn (Deckard et a17)-, sorghum (Eck et aZ8), and ryegrass (Bar-Akiva et at2) . On the other hand, it has a negative effect on stalk number. This is tandable because greater NRA means faster growth, particularly in weight, and such a situation restricts developmedt of late tillers into millable stalks.
1840 PLANT PHYSIOLOGY
NRA also effects negatively the sugar quality ratio. This particular effect is always associated with increased N application and implies that the greater utilization of N enables the plant to continue growing for a longer period at the sacrifice of sugar storage. This might be remedied by delaying harvest to allow time for development of sugar storage, or ior the cane plants to ripen. From the above observations two things may be deduced. Firstly, the normal variations in varietal response could be attributed to differences in the NRA of varieties. Secondly, there is a strong possibility of exploiting varietal differences in NRA to produce plants with high efficiency ol fer- tilizer utilization.
,
In further studies, NRAi and the NRAi/NRA, ratio should be examined in relation to the two important growth stages of the sugarcane plant, which are the vegetative and the ripening stages. It will be noticed that fertilizer requirements, particqlarly that of N, vary in these two stages and NRA should be studied in relaiibn to maximizing dry matter production during the vegetative phase and in relation to sugar quality and sugar yield during the ripening phase. The results obtained might lead to refinements in developing the procedure as a means of assessing the nutritional requirements of the sugarcane plant.
REFERENCES
1 . Bar-Akiva, A. (1965). Nitrate reduction in citrus tree leaves. Plant and Soil XXIII 1 : 141-144.
2 . - . J. Sagiv and J. Leshem. (1970). Nitrate reductase activity as an in- dicator for assessing the nitrogen requirement of grass crops. J. Sci. Fd. Agric. 21 :405-407.
3. - , and J. Sterhbaum. (1965). Possible use of the nitrate reductase activity of leaves as a measure on the nitrogen requirement of citrus trees. Plant and Cell Physiol. 6:575-577.
4 . Beevers, L. and R.H. Hageman. (1969). Nitrate reduction in higher plants. Ann. Rev. Plant Physiol. 20:495-518.
5 . - , and L.E. Schrader, D. Flesher and R.H. Hageman. (1965). The role of light and nitrate in the induction of nitrate reductase in radish cotyledons and maize seedlings. Plant Physiol. 40: 691-698.
6 . Bowerman, A. and P.J. Goodman. (1971). Variation in nitrate reductase activity in Lolium. Ann. Bot. 35:353-366.
7 . Deckard, E.L., R.J. Lambert and R.H. Hageman. (1973). Nitrate reductase activity in corn leaves as related to yields of grain and grain proteins. Crop Sci. 13:343-350.
8 . Eck, H.V.. G.C. Wilson and T. Martinez. (1975a). Nitrate reductase activitv of grain sorghum leaves as related to yields of grain, dry matter, and nitrogen. Crop Sci. 15:557-561.
,I ' 4 9 . Bageman, R.H. and D. Flesher. (1960): Nitrate reductase activity in corn
seedlings as affected by light and nitrate content of nutrient media. Plant Physiol. . 35:700-708.
10. - , E.R. Leng and T.W. Dudley. (1967). A biochemical approach to cokn breeding. Adv. Agron. 19:45-86.
11 . Jaworski, E.G. (1971 ) . Nitrate reductase assay in intact plant tissues. Biochem. Biophys. Res. Commun. 43 : 1274-1279.
12. Maretzki, A. and A. dela Cruz. (1968). Nitrate reductase-distribution and characterization. Ibid. p. 6-7.
13. -. (1969). Nitrate reductase in Lahaina and H 109. Ibid. p. 44.
E.L. ROSARIO AND K. SOOKSATHAN 1841
14. . (1972). Monitoring nitrogen with the leaf enzyme nitrate reductase, in a sugarcane crop. Ibid. p. 27-28.
15. Palis, R.K. and A.R. Bustrillos. (1974). Nitrate accumulation and nitrate reductase in some leafy vegetables. Paper presented in the 5th Ann. Conf. CSSP, Naga City.
16. Radin, J.W. (1973). In vivo assay of nitrate reductase in cotton leaf discs: Effect of oxygen and ammonium. Plant Physiol. 51:332-336.
17. Shen, T.C. (1969). The induction of nitrate reductase and the preferential assi- milation of ammonium in germinating rice seedlings. Plant Physiol. 44:1650-1655.
18. Warner, R.L., T.W. Dudley, R.J. Lambert and R.H. Hageman. (1969). Inheritance of nitrate reductase activity in Zcandys L. Proc. Natl. Acad. Sci. U.S. 62:785-792.
19. Zieserl, J.F. Jr. and R.H. Hageman. (1962). Effect of genetic composition on nitrate reductase activity in.maize. Crop Sci. 2:512-515.
INFLUENCIA DE LOS NIVELES DE FERTILIDAD SOBRE LA ACTIVIDAD DE LA NITRATO REDUCTASA Y SU SIGNIFICACION
EN LOS RENDIMIENTOS DE AZUCAR
I E.L. Rosario y K. Sooksathan
I RESUMEN
La actividad del nitrato reductasa (NRA) se ha incrementado con el aumento de 10s niveles de fertilidad y ha decrecido con el incre- mento de la edad de la planta. '
Esta actividad fue mayor a 10s 6 meses luego de la plantacidn o a 10s dos meses luego de la aplicacion final del fertilizante nitro- genado. Basado en la acci6n endogena del NRA a 10s 6 meses, se hizo un ranking relativo de variedades que resulto en este orden: Co 785 > Phil 56226 > Phil 62120 > F 156 > CAC 5711.
Se encontro que el ritmo de induccion esta influenciado por la cantidad de nutrientes recibidos por la planta. Con una fase larga de aproximadamente una hora, la maxima actividad fue registrada a las 6, 5 y 3 horas en plantas que recibieron 0, 200-100-400 y 400- 200-800 kg./ha de fertilizante respectivamente. Se ha establecido una correlacion positiva entre NRA con tn de caAa y rendimiento de azQ- car. NRA estuvo correlacionado negativamente con el peso del azljcar por tn de caAa (PSITC).
Fue observada una correlacion positiva y significativa entre NRA y nitrdgeno foliar en hoja TVD. Las variedades con mayor contenido de nitrogen0 foliar dieron valores mas elevados de NRA.
Se discute el posible uso de estas relaciones en la determinacibn de 10s reciuerimientos de fertilizantes Dara distintas variedades de