physiological equivalence of normobaric and hypobaric ... · methods. we exposed 20 subjects to...
TRANSCRIPT
David A. SelfJoseph MandellaO. Veronika PrinzoEstrella M. ForsterRobert M. Shaffstall
Civil Aerospace Medical InstituteFederal Aviation AdministrationOklahoma City, OK 73125
December 2010
Final Report
Physiological Equivalence of Normobaric and Hypobaric Exposures of Humans to 25,000 Feet
DOT/FAA/AM-10/20Office of Aerospace MedicineWashington, DC 20591
OK-11-0024-JAH
Federal AviationAdministration
NOTICE
This document is disseminated under the sponsorship of the U.S. Department of Transportation in the interest
of information exchange. The United States Government assumes no liability for the contents thereof.
___________
This publication and all Office of Aerospace Medicine technical reports are available in full-text from the Civil Aerospace Medical Institute’s publications
Web site: www.faa.gov/library/reports/medical/oamtechreports
i
Technical Report Documentation Page
1. Report No. 2. Government Accession No. 3. Recipient's Catalog No.
DOT/FAA/AM-10/20 4. Title and Subtitle 5. Report Date
December 2010 6. Performing Organization Code
Physiological Equivalence of Normobaric and Hypobaric Exposures of Humans to 25,000 Feet
7. Author(s) 8. Performing Organization Report No. Self DA, Mandella J, Prinzo OV, Forster EM, Shaffstall RM 9. Performing Organization Name and Address 10. Work Unit No. (TRAIS) FAA Civil Aerospace Medical Institute P.O. Box 25082 11. Contract or Grant No. Oklahoma City, OK 73125
12. Sponsoring Agency name and Address 13. Type of Report and Period Covered Office of Aerospace Medicine Federal Aviation Administration 800 Independence Ave., S.W. Washington, DC 20591
14. Sponsoring Agency Code
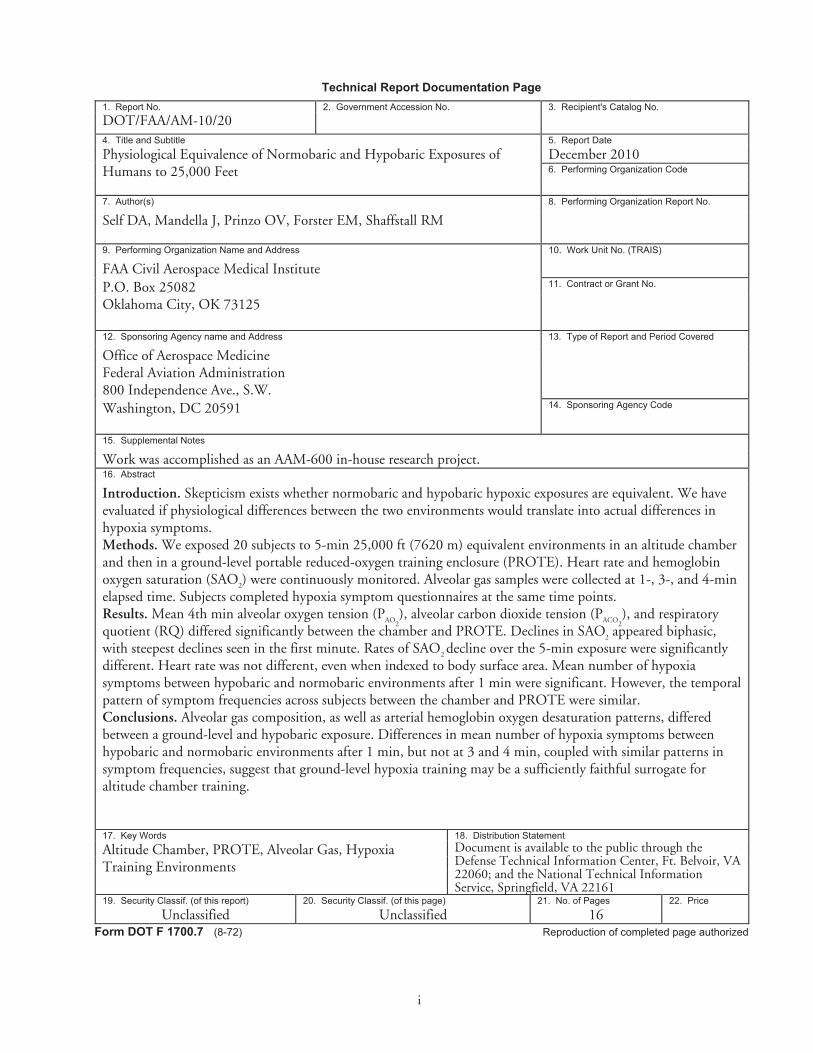
15. Supplemental Notes Work was accomplished as an AAM-600 in-house research project. 16. Abstract Introduction. Skepticism exists whether normobaric and hypobaric hypoxic exposures are equivalent. We have evaluated if physiological differences between the two environments would translate into actual differences in hypoxia symptoms. Methods. We exposed 20 subjects to 5-min 25,000 ft (7620 m) equivalent environments in an altitude chamber and then in a ground-level portable reduced-oxygen training enclosure (PROTE). Heart rate and hemoglobin oxygen saturation (SAO2) were continuously monitored. Alveolar gas samples were collected at 1-, 3-, and 4-min elapsed time. Subjects completed hypoxia symptom questionnaires at the same time points. Results. Mean 4th min alveolar oxygen tension (PAO2
), alveolar carbon dioxide tension (PACO2), and respiratory
quotient (RQ) differed significantly between the chamber and PROTE. Declines in SAO2 appeared biphasic, with steepest declines seen in the first minute. Rates of SAO2 decline over the 5-min exposure were significantly different. Heart rate was not different, even when indexed to body surface area. Mean number of hypoxia symptoms between hypobaric and normobaric environments after 1 min were significant. However, the temporal pattern of symptom frequencies across subjects between the chamber and PROTE were similar. Conclusions. Alveolar gas composition, as well as arterial hemoglobin oxygen desaturation patterns, differed between a ground-level and hypobaric exposure. Differences in mean number of hypoxia symptoms between hypobaric and normobaric environments after 1 min, but not at 3 and 4 min, coupled with similar patterns in symptom frequencies, suggest that ground-level hypoxia training may be a sufficiently faithful surrogate for altitude chamber training.
17. Key Words 18. Distribution Statement
Altitude Chamber, PROTE, Alveolar Gas, Hypoxia Training Environments
Document is available to the public through the Defense Technical Information Center, Ft. Belvoir, VA 22060; and the National Technical Information Service, Springfield, VA 22161
19. Security Classif. (of this report) 20. Security Classif. (of this page) 21. No. of Pages 22. Price Unclassified Unclassified 16
Form DOT F 1700.7 (8-72) Reproduction of completed page authorized

iii
ACKNOWLEDGMENTS
The authors wish to thank Junior R. Brown, Larry M. Boshers, Donald J. DeMuth, Rogers V. Shaw II, Eric Simson, and Roger A. Storey of the Civil Aerospace Medical Institute’s Airman Education Program for their enthusiasm and competence; and the students who volunteered to participate in this study.

v
CONTENTS
INTRODUCTION . . . . . . . . . . . . . . . . . . . . . . . . . . . . . . . . . . . . . . . . . . . . . . . . . . . . . . . . . . . . . . . 1
METHODS . . . . . . . . . . . . . . . . . . . . . . . . . . . . . . . . . . . . . . . . . . . . . . . . . . . . . . . . . . . . . . . . . . . . 1
Subjects . . . . . . . . . . . . . . . . . . . . . . . . . . . . . . . . . . . . . . . . . . . . . . . . . . . . . . . . . . . . . . . . . . . . 1
Training Devices . . . . . . . . . . . . . . . . . . . . . . . . . . . . . . . . . . . . . . . . . . . . . . . . . . . . . . . . . . . . . 1
Procedure . . . . . . . . . . . . . . . . . . . . . . . . . . . . . . . . . . . . . . . . . . . . . . . . . . . . . . . . . . . . . . . . . . 3
Analysis . . . . . . . . . . . . . . . . . . . . . . . . . . . . . . . . . . . . . . . . . . . . . . . . . . . . . . . . . . . . . . . . . . . . 4
RESULTS . . . . . . . . . . . . . . . . . . . . . . . . . . . . . . . . . . . . . . . . . . . . . . . . . . . . . . . . . . . . . . . . . . . . . . 4
Physiological Measures . . . . . . . . . . . . . . . . . . . . . . . . . . . . . . . . . . . . . . . . . . . . . . . . . . . . . . . . 4
Relatedness of Physiological Variables . . . . . . . . . . . . . . . . . . . . . . . . . . . . . . . . . . . . . . . . . . . . . 6
DISCUSSION . . . . . . . . . . . . . . . . . . . . . . . . . . . . . . . . . . . . . . . . . . . . . . . . . . . . . . . . . . . . . . . . . . . 9
CONCLUSIONS . . . . . . . . . . . . . . . . . . . . . . . . . . . . . . . . . . . . . . . . . . . . . . . . . . . . . . . . . . . . . . . 11
REfERENCES . . . . . . . . . . . . . . . . . . . . . . . . . . . . . . . . . . . . . . . . . . . . . . . . . . . . . . . . . . . . . . . . . 11


1
Physiological EquivalEncE of normobaric and hyPobaric ExPosurEs of humans to 25,000 fEEt
INTRODUCTION
Hypoxia awareness training is an accepted method of demonstrating to aircrew their individual hypoxia signature. The symptoms of hypoxia that airmen re-member following their hypoxia awareness training ap-pear to reflect accurately the symptoms they experience during acute hypoxia (20). Hypobaric (low barometric pressure) chamber training has been the traditional method of demonstrating hypoxia to aviators. Vari-ous training profiles are used by aeromedical training centers around the world to demonstrate hypoxia. The federal Aviation Administration (fAA) began altitude training for civilian pilots and crewmembers in 1962 and continues providing physiological training on a frequent schedule.
Advances in technology have yielded a new genera-tion of commercially available training devices capable of producing hypoxic environments at ground level (normobaric) by altering the fraction of ambient oxygen, thus avoiding some of the risk factors associated with altitude chamber training. Recently, the U.S. Navy (1) and Air force (2) physiological training programs have instituted ground-level hypoxia training.
Respiratory physiologists have been skeptical for decades that normobaric and hypobaric hypoxic environ-ments are equivalent (3, 5, 11, 14). These researchers argued that alveolar gas composition and respiratory quotients (RQ) under hypobaric and normobaric condi-tions will be quite different at the same level of ventilatory response to hypoxia. Additionally, the effectiveness of alveolar ventilation and the diffusivity of a gas vary in relation to the density of the gas breathed (3). In turn, this may differentially influence pulmonary blood flow distribution (6), resulting in higher hemoglobin de-saturation rates in hypobaric hypoxic exposures. Recent work by Wolff and Garner (19) and West (18) suggest that because of reduced diffusivity constants of oxygen at high altitude, alveolar and end-pulmonary-capillary oxygen tensions may not reach equilibrium, leading to less oxygen availability than would be seen at the cor-responding normobaric ambient oxygen tension.
The potential for an effect of barometric pressure, independent of lowered oxygen tension in hypobaric environments, has been addressed. Roach, Loeppky, and Icenoglea (13) found an increased severity of acute mountain sickness afflicting subjects in a controlled
hypobaric environment when compared to a normobaric environment with identical ambient PO
2. furthermore,
Savourey et al. (14) found greater hypoxemia, hypocap-nia, blood alkalosis, and lower SAO
2 in subjects under
hypobaric hypoxic conditions when compared to nor-mobaric ones. They suggested these differences could be accounted for by an increase in dead space ventilation resulting from lowered air density.
These findings provided a rationale for additional study on how hypobaric and ground-level-induced hypoxia may differ. We compared the responses of 20 subjects to 5-min hypobaric and normobaric exposures at a simulated altitude of 25,000 ft. Differences in alveolar gas composition, rates of hemoglobin desaturation, and heart rate responses were studied using a repeated mea-sures design. To see if physiological differences would translate into actual differences in hypoxia symptoms, we utilized a standardized hypoxia symptom question-naire (see Appendix A) to compare subjects monitoring of their own symptoms during both the normobaric and hyperbaric exposures.
METHODS
SubjectsA sample of 20 healthy subjects, 17 men and 3 women
[mean age, height, and weight: 42.0 yrs (± 10.8); 1.8m (±0.09); 85.2 kg (±18.3)], not acclimated to high al-titude, participated in the study. None of the subjects had previous altitude chamber experience. The study protocol was approved in advance by the Civil Aerospace Medical Institute (CAMI) Institutional Review Board for the Protection of Human Subjects.
Each subject provided written informed consent before participating and possessed a current Class II Airman Medical Certificate. All were students enrolled in the fAA physiological training course.
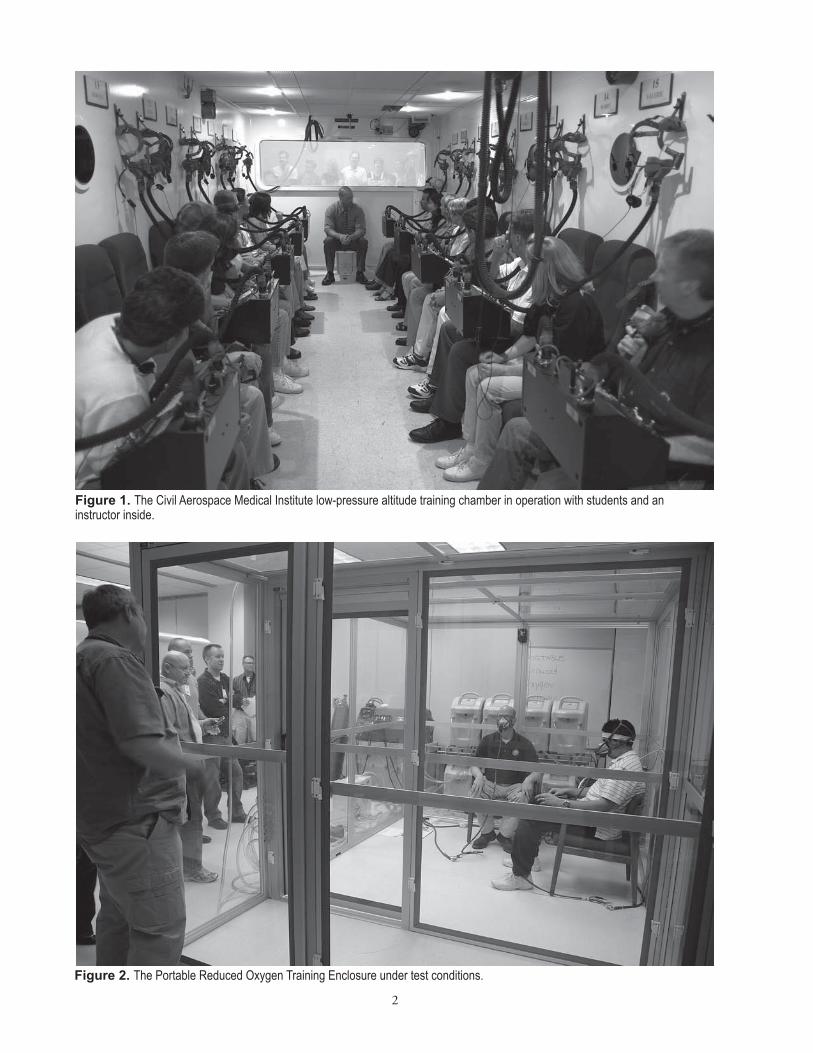
Training DevicesThe CAMI altitude training chamber (figure 1) is
a computer-controlled, man-rated, low-pressure (hypo-baric) chamber. It normally accommodates 20 subjects and two inside safety observers. The altitude chamber uses a vacuum pump to remove gas/pressure from the chamber. As the pressure is removed, it simulates the corresponding pressure of a particular altitude according to the U.S. 1976 Standard Atmosphere (9).
2
Figure 2. The Portable Reduced Oxygen Training Enclosure under test conditions.
Figure 1. The Civil Aerospace Medical Institute low-pressure altitude training chamber in operation with students and an instructor inside.

3
The Portable Reduced Oxygen Training Enclosure (PROTE, figure 2) is a commercially available portable altitude training system developed by Colorado Altitude Training; Louisville, CO. The system’s operational control is a microprocessor that monitors two oxygen sensors, a carbon dioxide sensor, and an atmospheric pressure sensor. It uses this information to calculate the simulated altitude and, in turn, to control nitrogen-concentrating air units, CO
2 scrubbers, and vents (as needed) to maintain
the enclosure at the desired simulated altitude setting. We monitored barometric pressure (P
b) in both the
chamber and PROTE with a NIST-traceable precision absolute manometer (model M2O2; Meriam Process Technologies; Cleveland, OH). We monitored chamber and PROTE oxygen percentage (fiO
2) with a mass spec-
trometer (PerkinElmer Life and Analytical Sciences, Inc; Waltham, MA). Accuracies were ±1% of full scale for O
2,
and ±2% of full scale for CO2. Two-point calibrations
were performed before each experiment using room air and a certified calibration gas with a different composi-tion. Real-time equivalent altitude was computed using a lookup table that converted calculated ambient PO
2
( Pb x fiO
2) to altitude using values in the U.S. 1976
Standard Altitude Tables (9).
ProcedureAll subjects were given their hypobaric exposure in the
morning and their normobaric exposure in the afternoon of the same day. Although there were multiple students on each chamber flight, only one subject was tested. There were always two inside observers on each chamber flight, and one inside observer in the PROTE. We did
not randomize the order of the tests because of concerns that, going from a high-nitrogen environment into a hypobaric, one would increase the risk of decompression sickness (12). We attempted to conduct the morning and afternoon tests with subjects in similar prandial states. The chamber flight profile depicted in figure 3 was utilized in this study and is the standard training profile flight used by the fAA during the physiological training course.
The chamber and PROTE were manually adjusted to the 25,000 ft equivalent, with real-time mass spectrometer and barometer measurements prior to subjects beginning the hypoxia demonstration. In practice, the chamber Pb was adjusted by either adding or removing ambient air from the chamber, while the PROTE O
2 concentration
was adjusted by altering the composition of the nitrogen-rich air inside the enclosure. In the PROTE exposure, the subjects simply walked into the enclosure, sat down, and then removed their oxygen masks. Subjects in both the chamber and PROTE breathed 100% oxygen via an aviator’s mask until the beginning of the 5-min exposure to 25,000 ft. In both the chamber and PROTE hypoxia exposures, the subjects gave alveolar air samples and filled out a new hypoxia symptoms questionnaire at 1, 3, and 4 min. All subjects went back on 100% oxygen at the 5-min point.
A questionnaire (Appendix A) listing the common symptoms of hypoxia was presented to the subjects in the chamber and PROTE. The subjects were given time to become familiar with the document prior to their hypoxia exposures. Immediately following the alveolar air sampling performed at 1, 3, and 4 min, they were asked to circle any symptoms and their severity on the sheets.
6,000 ft6,000 ft
8,000 ft8,000 ft
FL 180FL 180
FL 250FL 250
3K FEETPER MINUTE3K FEETPER MINUTE
RAPID RAPID DECOMPRESSIONDECOMPRESSION
HYPOXIA DEMONSTRATION
VISUAL ACUITY DEMONSTRATION
30 minDenitrogenation
Period Time (min) not to scale Figure 3. Altitude Chamber Flight Profile.
4
An inside observer collected the sheets after each time point and presented the subject with a new sheet just prior to the next time point. Subjects were given access to their questionnaires from previous hypoxia exposures once they completed both test conditions.
Alveolar gas samples were collected by having sub-jects exhale into flow-through ‘party blowouts’ that had sample collecting ports connected directly to a mass spectrometer (Model MGA-1100; PerkinElmer Life and Analytical Sciences, Inc. Waltham, MA). The inflated party blowouts provided a small positive pressure in the oropharynx sufficient to prevent air from being drawn in through the nose. Exhaled breaths were analyzed for percent composition of CO
2, O
2, and N
2 in real time.
Alveolar gas samples were collected at the end of the 1st, 3rd, and 4th minute of the hypoxia exposure by the in-side observers using the technique of Rahn (10). Briefly, subjects exhaled forcibly into the collection device just after a normal inspiratory volume. They were instructed to keep the party blowout extended for as long as pos-sible. fractions of respiratory gases were then obtained by averaging values from 4/5ths through the expiratory effort, to the end of the breath. Respiratory quotients (RQ) for each alveolar air sample were calculated using the equation developed by the Subcommittee on Oxygen and Anoxia (16):
RQ = fiN2 (P
ACO2)
fiO2 (P
b-47-P
ACO2)-P
AO2
Percent hemoglobin saturation (SAO2), expressed as
the ratio of oxyhemoglobin to reduced hemoglobin in arterial blood, was measured from a forehead sensor placed above the eyebrow that emitted light at 660 and 940 nm. Absorption ratios and heart rate were then computed by a pulse oximeter (Model RAD-87, Masimo Corp.; Irvine, CA) and displayed as percent saturation and beats per minute (bpm), respectively. The same sensor was used for both conditions in each subject. We attempted to reposi-tion the sensor for the PROTE exposure in exactly the same location as in the chamber exposure. To account for individual differences in baseline oxygen consumption, heart rate (HR) was indexed to body surface area (BSA) for each subject by using the Mostellar formula (8, 17).
Signals from the mass spectrometers, barometers, and pulse oximeters were digitized at 25 samples-sec-1 and recorded with a custom-built LabView data acquisition instrument (National Instruments Corp.; Austin, TX).
AnalysisThe analyses were conducted using a one-factor within
subjects design, with all subjects being exposed to both environments (chamber and PROTE). Significance was set a priori at alpha ≤ 0.05. All statistical analyses were performed using SPSS v. 17.0 software (SPSS, Inc.; Chicago, IL).
All physiological data were examined using a Student’s two-tailed t-test for paired samples. The probabilities of observing chance effects of the dependent variables are presented as exact p-values. The dependent variables were heart rate, SAO
2, P
AO2, P
ACO2, and heart rate/BSA at 4
min, rate of hemoglobin saturation decline during the 1st min, and over the entire exposure. All data are expressed as means ± standard deviations (SD). All appropriate pairs of dependent variables were examined for relatedness using Pearson correlations. The change from baseline SAO
2 with time during the 5-min chamber and PROTE
hypoxia exposures was described by a monoexponential curve-fitting routine using the method of least squares.
Alveolar gas samples were collected at the end of 1, 3, and 4 min. Samples collected at 5 min were not included in the dataset because hypoxic incapacitation at this point frequently prevented us from obtaining a satisfactory alveolar gas sample. Also, between-subjects variability for the 1- and 3-min samples was so great as to make comparisons difficult. However, this variability disappeared to a large extent by 4 min. Thus, the paired comparisons were limited to samples obtained at 4 min.
Mean number of hypoxia symptoms at 1, 3, and 4 min was the dependent variable. Differences in number of hypoxia symptoms reported by subjects between the chamber and PROTE exposures were tested for signifi-cance by a repeated measures two-way analysis of variance.
RESULTS
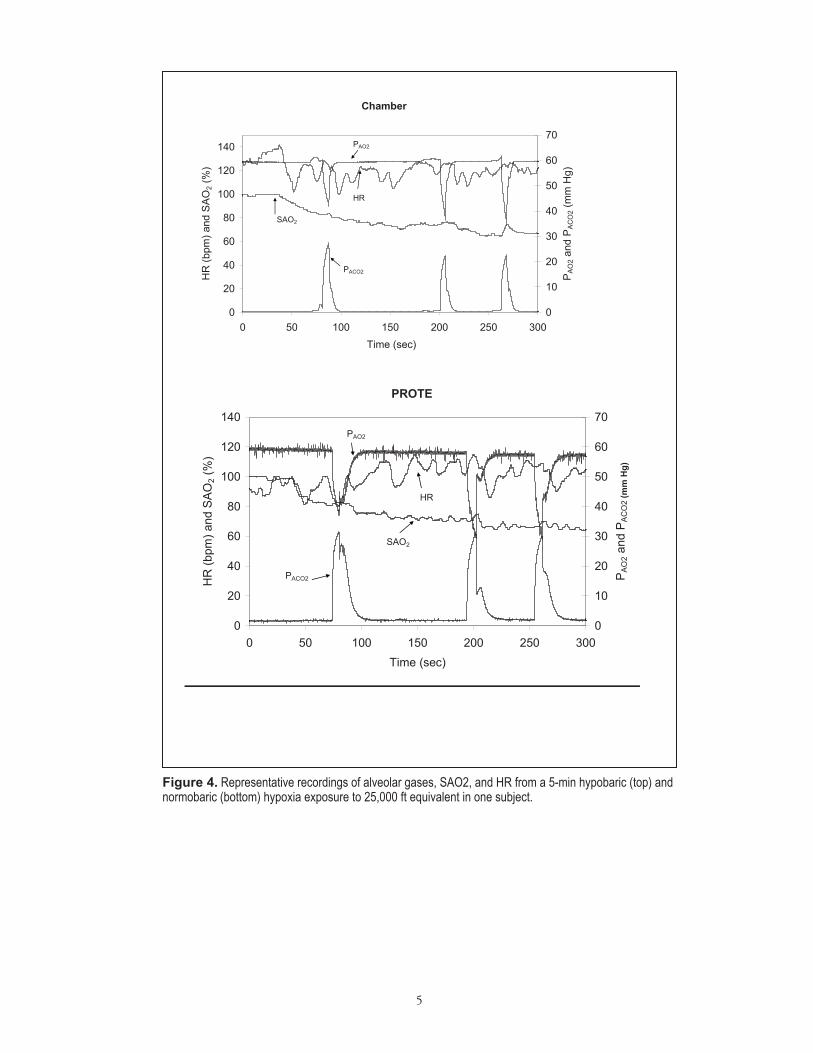
Physiological Measures Representative traces of HR, SAO
2, and alveolar gas
composition are shown in figure 4 for both the chamber (top) and PROTE (bottom) exposures for one subject.
Although the rate of alveolar gas composition change with time was highly variable between subjects, all showed the general trend of decreasing P
AO2 and P
ACO2 as the
ventilatory and cardiovascular responses to low ambi-ent oxygen tension developed. Table I presents mean physiological measures (± SD) taken during the hypoxia exposures for all 20 subjects.
5
Chamber
0
20
40
60
80
100
120
140
0 50 100 150 200 250 300Time (sec)
HR
(bpm
) and
SAO
2 (%
)
0
10
20
30
40
50
60
70
PA
O2 a
nd P
AC
O2 (
mm
Hg)
PAO2
HR
SAO2
PACO2
PROTE
0
20
40
60
80
100
120
140
0 50 100 150 200 250 300Time (sec)
HR
(bpm
) and
SAO
2 (%
)
0
10
20
30
40
50
60
70
PAO
2 and
PA
CO
2 (m
m H
g)
PAO2
HR
SAO2
PACO2
Figure 4. Representative recordings of alveolar gases, SAO2, and HR from a 5-min hypobaric (top) and normobaric (bottom) hypoxia exposure to 25,000 ft equivalent in one subject.
6
Alveolar Gas Composition and RQThe results of the paired comparisons show that
PAO2
, [t (19) = 3.30; p = 0.004], PACO2
, [t (19) = -8.56; p = ≤ 0.005], and RQ, [t (19) = 10.51; p ≤ 0.005] dif-fered significantly between the chamber and PROTE. Table I shows that P
AO2 was higher and P
ACO2 lower in
the chamber. This is reflected in the mean RQ values of 2.37 (± 0.53) and 1.41 (± 0.15) for the chamber and PROTE, respectively.
Hemoglobin Oxygen Saturationfigure 5 presents scatter plots of all 20 subjects’ SAO
2
recordings during the 5-min exposures in the chamber and PROTE, along with a mean value line overlay. Both cham-ber and PROTE lines were fit to monoexponential decay functions with R values of 0.934 and 0.889, respectively. Declines in SAO
2 were biphasic, with steepest declines
seen in the first minute. Mean initial rates of oxygen desaturation were not significantly different between the chamber and PROTE [t (19) = 1.17]. However, differ-ences in rate of decline of SAO
2 over the entire 5-min
exposure were significantly different [t (19) = 2.72; p = 0.013). Mean SAO
2 at 4 min also differed significantly
between the hypobaric and normobaric exposures [t (19) = -4.76; p ≤ 0.005].
Heart Rate ResponsesBeginning mean heart rate was 104.9 (±14.3) bpm
in the chamber and 96.6 (±14.6) bpm in the PROTE and differed significantly [t (19) = 2.37; p = 0.029;]. When HR was indexed to BSA, the significant difference persisted [t (19) = 2.83; p = 0.011]. These differences in HR [t (19) = 2.04] and HR/BSA [t (19) = 2.06] were not present at the 4-min point.
Relatedness of Physiological VariablesAll appropriate pairs of dependent variables were exam-
ined for relatedness using Pearson correlations. Significant pairs are presented in Table II along with their r values. As expected, Alveolar PO
2 and PCO
2 at 4 min were highly
related in both the chamber and the PROTE, showing a significant negative correlation. Interestingly, RQ at 4 min was significantly related to P
AO2 but not P
ACO2 in both
normobaric and hypobaric hypoxic exposures. Mean SAO2
at the 4 min point was significantly correlated with PAO2
and P
ACO2 in the chamber but not the PROTE. However,
the mean overall SAO2 rate of decline in the PROTE was
significantly correlated with the 4-min PAO2
.
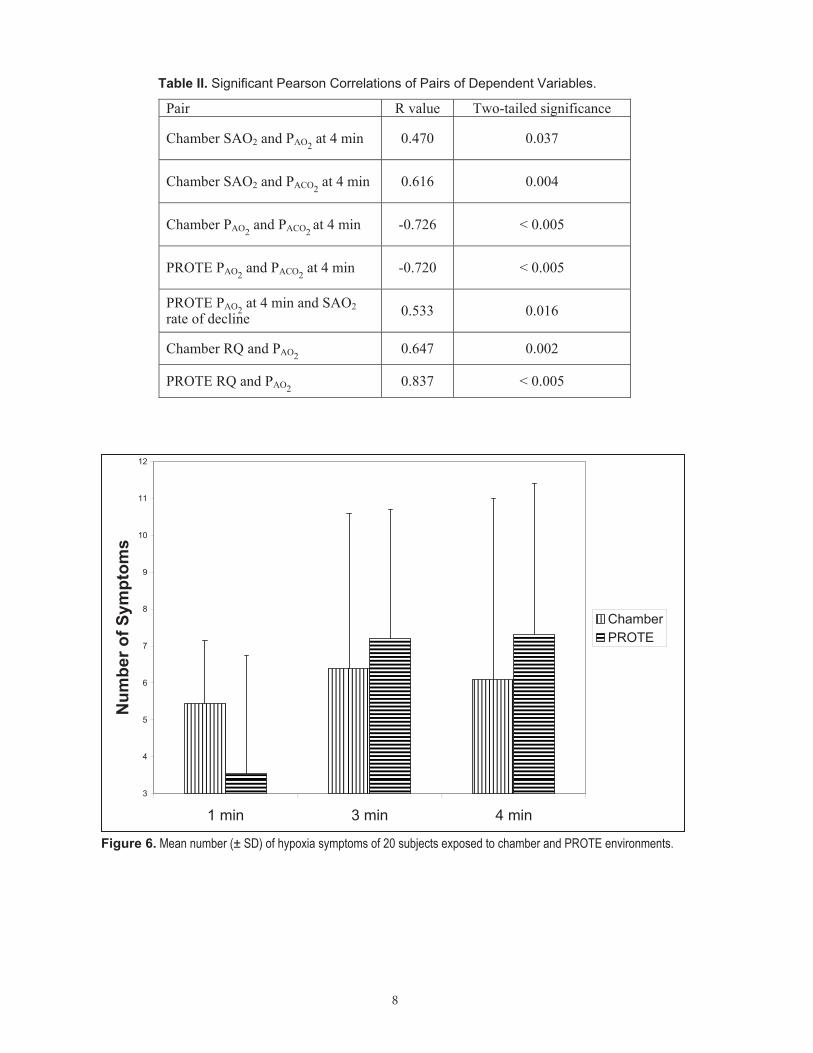
Subjective Hypoxia SymptomsA two-way repeated measures analysis of variance was
conducted on hypoxia environment (chamber, PROTE) and time of exposure (1 min, 3 min, and 4 min). The analysis revealed a statistically significant main effect of exposure time [f (2,38) = 8.99; p ≤ 0.001] but not hypoxia environment [f (1,19) = 0.003; p = 0.959]. However, there was a significant hypoxia environment • time of exposure interaction [f (2, 38) = 5.92; p = 0.006]. figure 6 pres-ents the average number (± SD) of symptoms identified by the subjects during their two hypoxia exposures. The subjects’ number of reported hypoxia symptoms differed between the chamber and PROTE exposure by an average of 2.36, 3.4, and 4.89 at 1, 3, and 4 min, respectively. The number of symptoms the subjects experienced in the PROTE went from being less than those during the chamber at 1 min to increasingly more at 3 and 4 min.
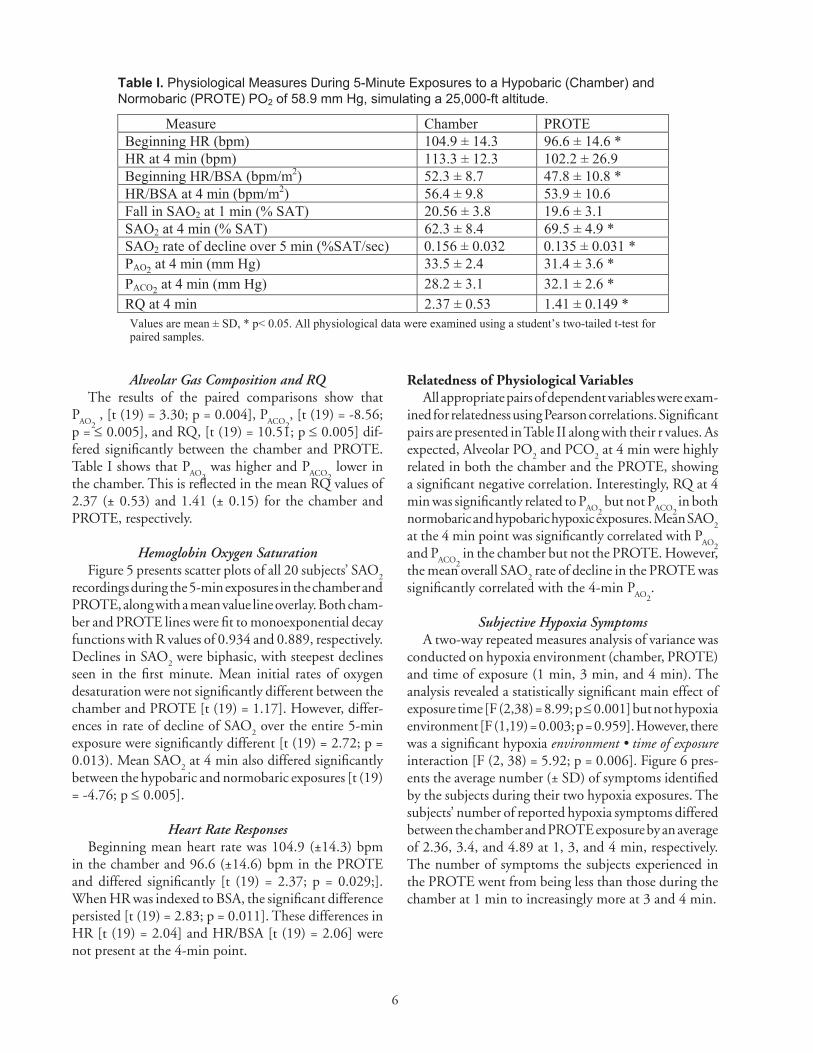
Table I. Physiological Measures During 5-Minute Exposures to a Hypobaric (Chamber) and Normobaric (PROTE) PO2 of 58.9 mm Hg, simulating a 25,000-ft altitude.
Measure Chamber PROTE Beginning HR (bpm) 104.9 ± 14.3 96.6 ± 14.6 * HR at 4 min (bpm) 113.3 ± 12.3 102.2 ± 26.9 Beginning HR/BSA (bpm/m2) 52.3 ± 8.7 47.8 ± 10.8 * HR/BSA at 4 min (bpm/m2) 56.4 ± 9.8 53.9 ± 10.6 Fall in SAO2 at 1 min (% SAT) 20.56 ± 3.8 19.6 ± 3.1 SAO2 at 4 min (% SAT) 62.3 ± 8.4 69.5 ± 4.9 * SAO2 rate of decline over 5 min (%SAT/sec) 0.156 ± 0.032 0.135 ± 0.031 * PAO2 at 4 min (mm Hg) 33.5 ± 2.4 31.4 ± 3.6 * PACO2 at 4 min (mm Hg) 28.2 ± 3.1 32.1 ± 2.6 * RQ at 4 min 2.37 ± 0.53 1.41 ± 0.149 * Values are mean ± SD, * p< 0.05. All physiological data were examined using a student’s two-tailed t-test for paired samples.

7
CHAMBER
0
20
40
60
80
100
120
0 50 100 150 200 250Time (sec)
Perc
ent S
atur
atio
n
PROTE
0
20
40
60
80
100
120
0 50 100 150 200 250Time (sec)
Perc
ent S
atur
atio
n
Figure 5. Scatter plots of percent hemoglobin saturation during a 5-min exposure to simulated 25,000 ft altitude. Shown are the raw traces with the mean at each time point (overlay).
8
Table II. Significant Pearson Correlations of Pairs of Dependent Variables.
Pair R value Two-tailed significance
Chamber SAO2 and PAO2 at 4 min 0.470 0.037
Chamber SAO2 and PACO2 at 4 min 0.616 0.004
Chamber PAO2 and PACO2 at 4 min -0.726 < 0.005
PROTE PAO2 and PACO2 at 4 min -0.720 < 0.005
PROTE PAO2 at 4 min and SAO2 rate of decline 0.533 0.016
Chamber RQ and PAO2 0.647 0.002
PROTE RQ and PAO2 0.837 < 0.005
3
4
5
6
7
8
9
10
11
12
1 min 3 min 4 min
Num
ber o
f Sym
ptom
s
ChamberPROTE
Figure 6. Mean number (± SD) of hypoxia symptoms of 20 subjects exposed to chamber and PROTE environments.
9
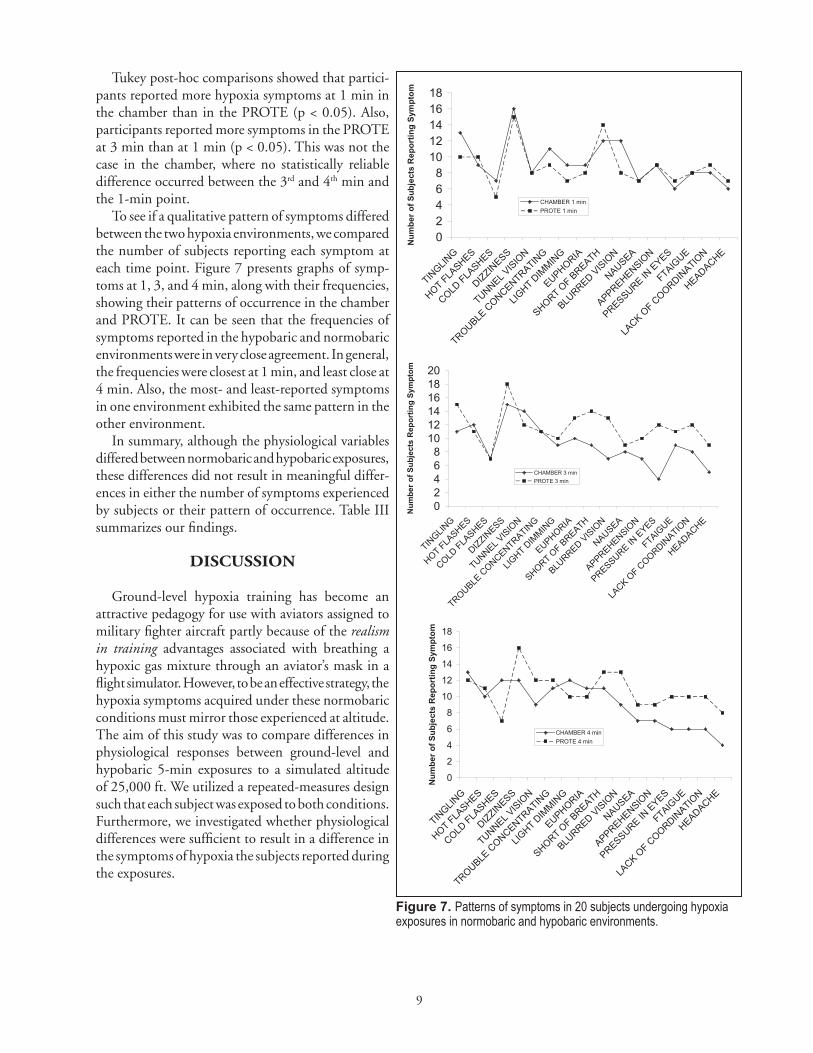
Tukey post-hoc comparisons showed that partici-pants reported more hypoxia symptoms at 1 min in the chamber than in the PROTE (p < 0.05). Also, participants reported more symptoms in the PROTE at 3 min than at 1 min (p < 0.05). This was not the case in the chamber, where no statistically reliable difference occurred between the 3rd and 4th min and the 1-min point.
To see if a qualitative pattern of symptoms differed between the two hypoxia environments, we compared the number of subjects reporting each symptom at each time point. figure 7 presents graphs of symp-toms at 1, 3, and 4 min, along with their frequencies, showing their patterns of occurrence in the chamber and PROTE. It can be seen that the frequencies of symptoms reported in the hypobaric and normobaric environments were in very close agreement. In general, the frequencies were closest at 1 min, and least close at 4 min. Also, the most- and least-reported symptoms in one environment exhibited the same pattern in the other environment.
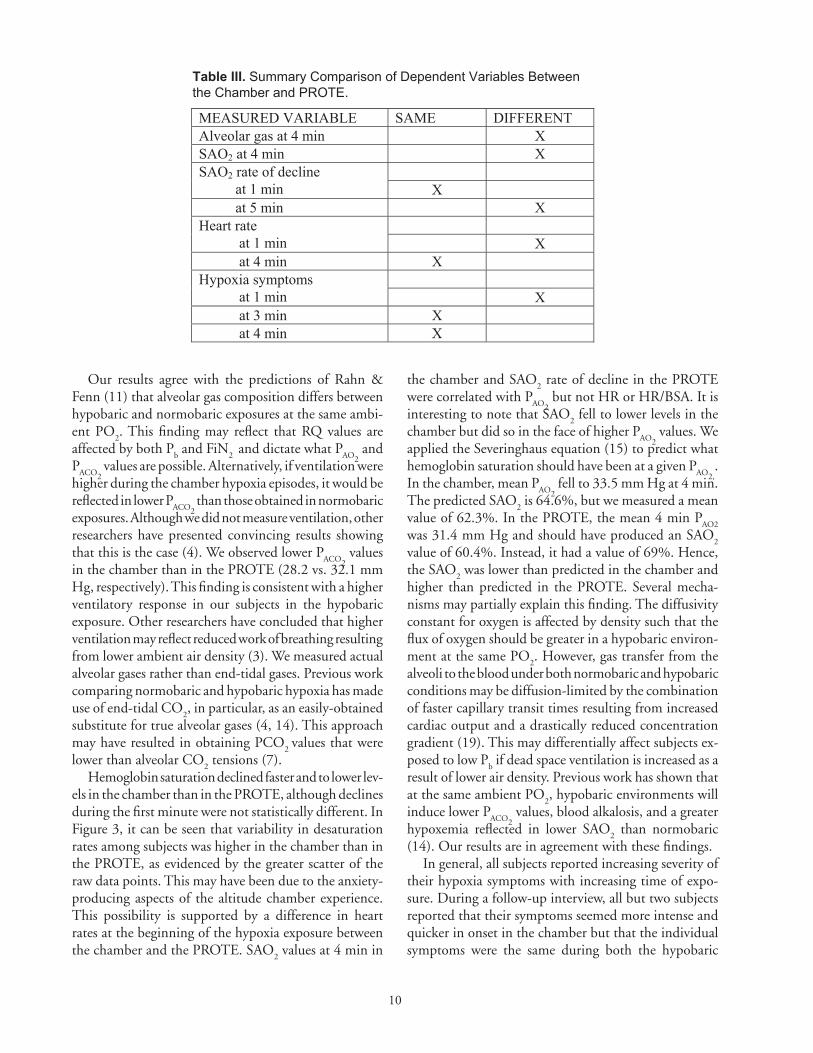
In summary, although the physiological variables differed between normobaric and hypobaric exposures, these differences did not result in meaningful differ-ences in either the number of symptoms experienced by subjects or their pattern of occurrence. Table III summarizes our findings.
DISCUSSION
Ground-level hypoxia training has become an attractive pedagogy for use with aviators assigned to military fighter aircraft partly because of the realism in training advantages associated with breathing a hypoxic gas mixture through an aviator’s mask in a flight simulator. However, to be an effective strategy, the hypoxia symptoms acquired under these normobaric conditions must mirror those experienced at altitude. The aim of this study was to compare differences in physiological responses between ground-level and hypobaric 5-min exposures to a simulated altitude of 25,000 ft. We utilized a repeated-measures design such that each subject was exposed to both conditions. furthermore, we investigated whether physiological differences were sufficient to result in a difference in the symptoms of hypoxia the subjects reported during the exposures.
02468
1012141618
TINGLIN
G
HOT FLASHES
COLD FLA
SHES
DIZZINESS
TUNNEL VIS
ION
TROUBLECONCENTRATIN
G
LIGHT D
IMMIN
G
EUPHORIA
SHORT OF B
REATH
BLURRED
VISIO
N
NAUSEA
APPREHENSION
PRESSURE IN EYES
FTAIGUE
LACK O
F COORDIN
ATION
HEADACHE
Num
ber o
f Sub
ject
s R
epor
ting
Sym
ptom
CHAMBER 1 minPROTE 1 min
02468
101214161820
TINGLIN
G
HOT FLASHES
COLD FLA
SHES
DIZZINESS
TUNNEL VIS
ION
TROUBLE C
ONCENTRATING
LIGHT DIM
MING
EUPHORIA
SHORT OF B
REATH
BLURRED VIS
ION
NAUSEA
APPREHENSION
PRESSURE IN E
YES
FTAIGUE
LACK O
F COORDIN
ATION
HEADACHE
Num
ber o
f Sub
ject
s R
epor
ting
Sym
ptom
CHAMBER 3 minPROTE 3 min
0
2
4
6
8
10
12
14
16
18
TINGLIN
G
HOT FLASHES
COLD FLA
SHES
DIZZINESS
TUNNEL VISIO
N
TROUBLE C
ONCENTRATING
LIGHT D
IMMIN
G
EUPHORIA
SHORT OF BREATH
BLURRED VIS
ION
NAUSEA
APPREHENSION
PRESSUREIN
EYES
FTAIGUE
LACK O
F COORDIN
ATION
HEADACHE
Num
ber o
f Sub
ject
s R
epor
ting
Sym
ptom
CHAMBER 4 minPROTE 4 min
Figure 7. Patterns of symptoms in 20 subjects undergoing hypoxia exposures in normobaric and hypobaric environments.
10
Our results agree with the predictions of Rahn & fenn (11) that alveolar gas composition differs between hypobaric and normobaric exposures at the same ambi-ent PO
2. This finding may reflect that RQ values are
affected by both Pb and fiN
2 and dictate what P
AO2 and
PACO2
values are possible. Alternatively, if ventilation were higher during the chamber hypoxia episodes, it would be reflected in lower P
ACO2 than those obtained in normobaric
exposures. Although we did not measure ventilation, other researchers have presented convincing results showing that this is the case (4). We observed lower P
ACO2 values
in the chamber than in the PROTE (28.2 vs. 32.1 mm Hg, respectively). This finding is consistent with a higher ventilatory response in our subjects in the hypobaric exposure. Other researchers have concluded that higher ventilation may reflect reduced work of breathing resulting from lower ambient air density (3). We measured actual alveolar gases rather than end-tidal gases. Previous work comparing normobaric and hypobaric hypoxia has made use of end-tidal CO
2, in particular, as an easily-obtained
substitute for true alveolar gases (4, 14). This approach may have resulted in obtaining PCO
2 values that were
lower than alveolar CO2 tensions (7).
Hemoglobin saturation declined faster and to lower lev-els in the chamber than in the PROTE, although declines during the first minute were not statistically different. In figure 3, it can be seen that variability in desaturation rates among subjects was higher in the chamber than in the PROTE, as evidenced by the greater scatter of the raw data points. This may have been due to the anxiety-producing aspects of the altitude chamber experience. This possibility is supported by a difference in heart rates at the beginning of the hypoxia exposure between the chamber and the PROTE. SAO
2 values at 4 min in
the chamber and SAO2 rate of decline in the PROTE
were correlated with PAO2
but not HR or HR/BSA. It is interesting to note that SAO
2 fell to lower levels in the
chamber but did so in the face of higher PAO2
values. We applied the Severinghaus equation (15) to predict what hemoglobin saturation should have been at a given P
AO2,.
In the chamber, mean PAO2
fell to 33.5 mm Hg at 4 min. The predicted SAO
2 is 64.6%, but we measured a mean
value of 62.3%. In the PROTE, the mean 4 min PAO2
was 31.4 mm Hg and should have produced an SAO
2
value of 60.4%. Instead, it had a value of 69%. Hence, the SAO
2 was lower than predicted in the chamber and
higher than predicted in the PROTE. Several mecha-nisms may partially explain this finding. The diffusivity constant for oxygen is affected by density such that the flux of oxygen should be greater in a hypobaric environ-ment at the same PO
2. However, gas transfer from the
alveoli to the blood under both normobaric and hypobaric conditions may be diffusion-limited by the combination of faster capillary transit times resulting from increased cardiac output and a drastically reduced concentration gradient (19). This may differentially affect subjects ex-posed to low P
b if dead space ventilation is increased as a
result of lower air density. Previous work has shown that at the same ambient PO
2, hypobaric environments will
induce lower PACO2
values, blood alkalosis, and a greater hypoxemia reflected in lower SAO
2 than normobaric
(14). Our results are in agreement with these findings.In general, all subjects reported increasing severity of
their hypoxia symptoms with increasing time of expo-sure. During a follow-up interview, all but two subjects reported that their symptoms seemed more intense and quicker in onset in the chamber but that the individual symptoms were the same during both the hypobaric
Table III. Summary Comparison of Dependent Variables Between the Chamber and PROTE.
MEASURED VARIABLE SAME DIFFERENT Alveolar gas at 4 min X SAO2 at 4 min X
SAO2 rate of decline at 1 min X at 5 min X
Heart rate at 1 min X at 4 min X
Hypoxia symptoms at 1 min X at 3 min X at 4 min X
11
and normobaric exposures. This latter statement was supported by an examination of the frequencies of each reported symptom at the same time point in the chamber and PROTE environments, where there was remarkable similarity in their patterns of occurrence. We did, however, observe a significant difference in the mean number of hypoxia symptoms identified by subjects after 1 min (but not after 3 and 4 min) between the chamber and PROTE hypoxia exposure, with the chamber producing a greater number of symptoms. This difference may reflect the subjects’ perception that their symptoms were slower in onset in the PROTE. Although we collected symptom severity data, we chose not to include it in this analysis because these data did little to clarify the answer to the basic experimental question of whether the two environ-ments were equivalent.
Possible weaknesses in our experimental design may have resulted from both clinical concerns regarding de-compression sickness and the necessity of using students enrolled in the fAA physiological training classes. Reli-ability of the subjects’ responses to the hypoxia symptom questionnaires may have been affected by an ordering effect resulting from a lack of randomization in presentation order and the inability to “blind” the subjects to experi-mental condition. However, the pattern of identifying a greater number of symptoms in the chamber than the PROTE, initially, followed by a reversal of this relationship as the time of exposure increased, was manifested across all subjects (figure 7). furthermore, the disparity between the post-hypoxia interview responses of the subjects and the questionnaire responses during the hypoxia exposure limits our certainty in using the subjective data as a basis to argue for or against environmental equivalence. Ac-cordingly, further investigation is warranted in which performance on a cognitive task is objectively measured.
CONCLUSIONS
The results of this study revealed that alveolar gas composition, as well as arterial hemoglobin oxygen desaturation patterns, differed between a ground-level and hypobaric exposure to a simulated altitude of 25,000 ft. Differences in mean number of hypoxia symptoms between hypobaric and normobaric environments after 1 min, but not at 3 and 4 min, coupled with similar pat-terns in symptom occurrence, suggest that ground-level hypoxia training may be a sufficiently faithful surrogate for altitude chamber training.
REfERENCES
1. Artino AR, folga, RV, Vacchiano, C. Normobaric hypoxia training: The effects of breathing-gas flow rate on symptoms. Aviat Space Environ Med 2009; 80: 547–52.
2. Chavana, J (2009). New equipment revolutionizes pilot hypoxia training in: Inside Joint Base Langley-Eustis. Retrieved on 30 June, 2010 from www.langley.af.mil/news/story.asp?id=123158773
3. Conkin J, Wessel JH III. Critique of the equivalent air altitude model. Aviat Space Environ Med 2008; 79: 975–82 .
4. Evetts G, Hartley A, Keane S, et al. A comparison of acute hypoxia induced by low concentrations of oxygen at ground level, 10,000 feet and by air at 25,000 feet. Implications for military aircrew train-ing. Proceedings from SAfE Europe 2005 Sym-posium. Retrieved on 10 June, 2010, from www.safeeurope.co.uk/media/3570/george_evetts.pdf
5. fenn WO, Rahn H, Otis AB. A theoretical study of the composition of the alveolar air at altitude. Am J Physiol 1946;146(5): 637–53.
6. Hopkins SR, Garg J, Bolar DS, et al. Pulmonary blood flow heterogeneity during hypoxia and high-altitude pulmonary edema. Am J Resp Crit Care Med 2005; 171: 83–7.
7. Koulouris, NG, Latsi, P, Dimitroulis, J, et al. Non-invasive measurement of mean alveolar carbon dioxide tension and Bohr’s dead space during tidal breathing. Europ Resp J 2001; 17:1167-74.
8. Mosteller RD. Simplified calculation of body surface area. New Engl J Med 1987; 317(17):1098.
9. National Oceanic and Atmospheric Administration (1976). U.S. Standard Atmosphere, NOAA, Wash-ington, DC.
10. Rahn H. The sampling of alveolar gas. In: W.M. Boothby, ed. Handbook of respiratory physiology. Randolph field: Air University Press, 1954: 29-37.
11. Rahn H, fenn WO. Alveolar gas composition at altitude in: A graphical analysis of the respiratory gas exchange. Washington, DC: The American Physiological Society, 1955:27-29
12
12. Rice GM, Vacchiano CA, Moore JL Jr, Anderson DW. Incidence of decompression sickness in hypoxia training with and without 30-min O
2 prebreathe.
Aviat Space Environ Med 2003; 74(1):56-61.
13. Roach RC, Loeppky JA, Icenoglea MV. Acute moun-tain sickness: increased severity during simulated altitude compared with normobaric hypoxia. J Appl Physiol 1996; 81(5):1908-10.
14. Savourey G, Launay J-C, Besnard Y, et al. Normo- and hypobaric hypoxia: Are there any physiological dif-ferences? European J Appl Physiol 2003; 89:122–6.
15. Severinghaus J W. Blood gas calculator. JAppl Physiol 1966; 21:1108-16.
16. Subcommittee on Oxygen and Anoxia of the Commit-tee on Aviation Medicine. Calculations relating to the composition of respiratory gases. In: Handbook of respiratory data in aviation. Washington, DC: Air University Press, 1944: 25-100.
17. Wagner JL, Ruskin KI. Pulse oximetry: Basic prin-ciples and applications in aerospace medicine. Aviat Space Environ Med 2007; 78: 973-8.
18. West JB, Schoene RB, Milledge JS (2007). Limit-ing factors at extreme altitude In: High altitude medicine and physiology, 4th ed. London: Hodder Arnold: 161-75.
19. Wolf MB, Garner RP. Disequilibrium between al-veolar and end-pulmonary-capillary O
2 tension in
altitude hypoxia and respiratory disease: an update of a mathematical model of human respiration at altitude. Ann Biomed Eng 2009; 37(9): 1818-26.
20. Yoneda I, Tomoda M, Tokumaru O, et al. Time of useful consciousness determination in aircrew members with reference to prior altitude chamber experience and age. Aviat Space Environ Med 2000; 71: 72-6.