physiological and molecular plant pathology - world cocoa foundation
TRANSCRIPT
at SciVerse ScienceDirect
Physiological and Molecular Plant Pathology 81 (2013) 84e96
Contents lists available
Physiological and Molecular Plant Pathology
journal homepage: www.elsevier .com/locate/pmpp
Dynamic changes in pod and fungal physiology associated with the shift frombiotrophy to necrotrophy during the infection of Theobroma cacao byMoniliophthora roreri
Bryan A. Bailey a,*, Jayne Crozier b, Richard C. Sicher c, Mary D. Strem a, Rachel Melnick a,Marcelo F. Carazzolle d, Gustavo G.L. Costa d, Gonçalo A.G. Pereira d, Dapeng Zhang a, Siela Maximova e,Mark Guiltinan e, Lyndel Meinhardt a
a Sustainable Perennial Crops Laboratory, Plant Sciences Institute, USDA/ARS, Beltsville Agricultural Research Center-West, Beltsville, MD 20705, USAbCABI Caribbean & Latin America e CATIE Office, Centro Agronómico Tropica de Investigación y Enseñanza (CATIE), 7170 Turrialba, Costa RicacCrop Systems and Global Change Laboratory, Animal and Natural Resources Institute, USDA/ARS, Beltsville Agricultural Research Center-West, Beltsville, MD 20705, USAd Laboratório de Genômica e Expressão, Departamento de Genética, Evolução e Bioagentes, Instituto de Biologia, U. Estadual de Campinas, CEP 13083-970, Campinas-SP, BrazileDepartment of Horticulture, The Pennsylvania State University, University Park, PA 16802, USA
a r t i c l e i n f o
Article history:Accepted 27 November 2012
Keywords:Frosty podCacaoMolecular plant microbe interactionsMetabolomicsHemibiotrophGlyoxylate cycle
Abbreviations: Mr, Moniliophthora roreri; Mp, Modays after inoculation; FPR, frosty pod rot.* Corresponding author. Tel.: þ1 301 504 7985; fax
E-mail address: [email protected] (B.A. Ba
0885-5765/$ e see front matter Published by Elseviehttp://dx.doi.org/10.1016/j.pmpp.2012.11.005
a b s t r a c t
Theobroma cacao pods were inoculated with meiospores of Moniliophthora roreri (Mr), a hemibiotrophicbasidiomycete causing frosty pod rot. Pods were malformed 30 days after inoculation (DAI) and spor-ulation was observed 60 DAI. Glucose and asparagine concentrations decreased and mannitol andmalonate increased in infected pods 30 DAI. By 60 DAI, most carbohydrates, amino acids, and organicacids were drastically reduced by infection. Mannitol and succinic acid levels increased 60 DAI and likelyoriginated from Mr. RT-qPCR analysis of cacao ESTs indicated a strong response to infection 30 DAI inmalformed pod. Evidence indicated that biotrophic hyphae colonized pods and a shift to necrotrophicgrowth occurred later (during the end stages of infection). Expression of cacao ESTs associated with planthormone biosynthesis and action was altered. Changes in the expression of Mr ESTs in response tonutrient deficiency in pure culture were small. Changes in Mr gene expression patterns and levels ofspecific metabolites in necrotic sporulating pods 60 DAI compared to malformed pods 30 DAI indicatedthat the glyoxylate cycle of Mr was up regulated during the shift from biotrophic to necrotrophic phasesof the disease cycle.
Published by Elsevier Ltd.
1. Introduction
Moniliophthora roreri H. C. Evans, Stalpers, Samson & Benny(sMr) is the causal agent of frosty pod rot [1,2] on Theobroma cacaoL. (cacao), the source of chocolate [3]. Frosty pod rot (FPR) occurs inall the major cacao producing areas in the Western Hemisphere,other than Brazil [1,2]. For many years Mr was considered ananamorphic form of an ascomycete [4]. Taxonomic [5] and molec-ular techniques [6] clarified the position of Mr as a basidiomyceteand demonstrated its close genetic relationship to the witches’broom pathogen (Moniliophthora perniciosa (Stahel) Aime &Phillips-Mora; formerly Crinipellis perniciosa (Stahel) Singer) [7].
niliophthora perniciosa; DAI,
: þ1 301 504 1998.iley).
r Ltd.
Cacao is often grown as a cash crop by small-scale farmers withlimited resources [8]. In areas where Mr is introduced, it quicklybecomes the disease of primary concern due to its devastatingeffects on yields and the limited measures available for its control[1,2]. Control measures include use of fungicides and standardcultural practices such as managing tree height, and persistentremoval of infected pods [2]. Control measures are often notemployed due to their cost and limited impact on disease. The use ofresistant germplasm offers hope for management of FPR but thisapproach has been slowed by several factors including limitedavailability of sources of resistance, the time required for breedingresistant cacao material, and problems with distributing what isbecoming a clonally propagated crop. Recently a programhas begunin Central America, centered at CATIE in Costa Rica, to distributenew cacao clones which show partial resistance to FPR [9]. Theresults of this effort will require years to validate.
M. roreri is a hemibiotroph. FPR development can be lengthy,progressing over the 6 months required for pod development and
B.A. Bailey et al. / Physiological and Molecular Plant Pathology 81 (2013) 84e96 85
ripening [1,2]. Little is known about the processes involved in thedevelopment of FPR, other than knowledge gained by basic fieldand microscopic observations [10]. The molecular interactionbetween Mr and cacao has not been studied in any detail. What isknown is that pods can become infected at an early developmentalstage [1,9]. During the biotrophic phase of disease the fruit maydevelop malformations and then progress to the necrotrophicphase where rot occurs, followed by sporulation on the pod surface[1,9,11]. The spores are the product of meiosis (meiospores)produced without the benefit of a basidiocarp [11] and provideinoculum for the next cycle of infection. The germ tubes frommeiospores are made up of haploid cells [11], a state thought to bemaintained during the biotrophic phase of disease. The formationof dikaryotic hyphae is thought to coincide with the necrotrophicphase of disease leading to sporulation and completion of the lifecycle [11].
In order to better understand the FPR disease process we havebegun a project to characterize the molecular interactions betweenMr and cacao. The first objective of this research is to characterizechanges in metabolite levels associated with frosty pod rot devel-opment. The second objective is to identify a molecular signaturefor the response of cacao to infection including changes in theexpression of plant defense genes, and plant genes associatedwith hormone biosynthesis, regulation, and action. The thirdobjective is the characterization of changes in fungal gene expres-sion associated with the shift between the biotrophic andnecrotrophic phases of disease. By understanding the Mr interac-tion with cacao we hope to identify sites for intervention usingnovel (transgenic) or traditional (plant breeding, crop manage-ment, or fungicides) techniques.
2. Materials and methods
2.1. Microscopic observations
In order to verify previous descriptions of the biotrophic andnecrotrophic phases of the frosty pod rot disease process [10],microscopic observations were conducted on freeze dried pods ofcacao clone Matina �1 collected from La Lola, Costa Rica. TheMatina-1 pods were either showing no symptoms, malformed, ornecrotic and sporulating. Pods were aseptically dissected intoreceptacle, the middle of the pod, and the bottom of pod. Eachsectionwas cut in half. Small sections (0.5 cm3) were removed fromthe freshly cut surface of each half and were further dissected intothe pulp immediately in the middle of the seed cavity, the pulp/husk interface, and husk tissue immediately below the pod surface.Sections were placed into 1.7 ml tubes and stained with lactophe-nol cotton blue for 1 h. Sections were squash mounted onto slidesand observed at 20� and 100� under a light microscope. Thepresence of hyphae, whether hyphae were septate, the thickness ofhyphae, and notes on the appearance of the sections were recordedfor the three areas of each of the sections dissected from threeinfected and three healthy control pods. Additionally, photographswere taken during observations.
2.2. Plant materials and inoculations with M. roreri
Two essentially identical experiments were carried out duringseparate growing seasons (2008, 2009). The cacao trees werelocated in a plot at the CATIE field station, La Lola, near Siquirres,Costa Rica. The trees were progeny from crosses between clonesPA16 � SIC433 and PA16 � EEG29 and were known to be highlysusceptible toM. roreri (Mr) [12]. For both experiments we selected20 trees and hand pollinated 10 flowers on each tree. Once podswere 2 months old (6e8 cm long) they were artificially inoculated
and labeled, 30 pods in Experiment 1 and 40 pods in Experiment 2.Thirty and 40 pods were kept as uninoculated (control pods) inexperiment 1 and experiment 2, respectively. Attempts were madeto include equal numbers of treated and untreated pods on eachtree. Mr meiospores were collected from infected pods in theplot where the experiment was carried out. A single mixture ofmeiospores was used to inoculate pods in each experiment. Inoc-ulations were made by soaking a pad (2 cm in diameter) of absor-bent cotton-wool in a 0.05% Tween 20 plus spore suspension(1 �108 spores ml�1). The cottonwool pads were secured centrallyaround the pod. All inoculated pods, including controls treatedwith0.05% Tween 20 in water only, were enclosed in clear plastic bags(30 � 20 cm) which were fastened to the peduncle with a plant tie,in order to maintain humidity and prevent contamination duringthe growth andmaturation period. The corners were removed fromthe bags to let excess moisture drain away from the pods. Sixinoculated pods and six uninoculated control pods were harvestedat intervals of 7, 30, and 60 days after inoculation (DAI) in bothexperiments. Pods were harvested irrespective of symptomologysince it was not clear which symptoms would be most represen-tative at each time point. At each harvest, the pods were rated usinga descriptive measure of normal, malformed green, and necroticand sporulating. Pods were collected in the late afternoon beforebeing transported back to the lab in a cool box. Each pod wasphotographed. Pods harvested 7 and 30 DAI were place whole inliquid nitrogen for 10 min. Larger pods, harvested 60 DAI, were cutin half before being frozen in liquid nitrogen. The frozen pods werelyophilized and vacuum sealed in plastic before shipping to theUSDA/ARS/SPCL research facility in Beltsville, Maryland. Based onthe observed sequence of symptom development over time in Mrinoculated pods during the two field experiments (see results),asymptomatic pods at 7 DAI, malformed pods at 30 DAI, andnecrotic sporulating pods at 60 DAI were considered for furtheranalysis. Asymptomatic pods were selected among the control podsat each time point. In Expt 1 three podswere analyzed for each timepoint (DAI) and inoculation (control or Mr inoculated) treatmentcombination and in Expt 2 four pods were analyzed for eachtreatment combination.
2.3. Fungal biomass
Mycelia from eight day old cultures ofM. roreri isolate Co8 wereinoculated into 100 ml of potato dextrose broth (PDB, BD, FranklinLakes, NJ) in 250 ml flasks. The flasks were incubated at roomtemperature (w24 �C) on a rotary shaker at 125 rpm for 14 days.After two weeks, the PDB was aseptically removed from the flasks.To six of the flasks,100ml of fresh PDBwas added. To the remainingsix flasks, 100 ml of MIN salt broth was added [13]. The flasks wereincubated on a rotary shaker for 14 days as before. To harvestmycelium, cultures were vacuum filtered followed by two rinseswith sterile distilled water. Mycelia were flash frozen in liquid N2and stored at �80 �C.
2.4. RNA extraction
Pods were broken up and coarsely ground under liquid nitrogenand approximately 1 cm3 of sample was used for processing. Thepod material was ground finely and transferred to a disposable50 ml centrifuge tube containing 15 ml of 65 �C extraction buffer[14]. Additional extraction methods were conducted as in Melnicket al. [13]. An image of total RNA separated by electrophoresis ispresented in Fig. 1. The cDNA was synthesized using the Invitrogen(Carlsbad, CA) Superscript VILO kit, following the manufacturer’sdirections. The RNA extraction methods for fungal mycelia wereidentical to those for extraction of pod RNA [13] with the following

Fig. 1. Total RNA isolated from fresh pods from the greenhouse as compared to totalRNA isolated from lyophilized pods from Costa Rica. Control (C) and Mr inoculated (I)pods were collected from the field 7, 30, and 60 days after inoculation (DAI) and werefrozen in liquid nitrogen before being lyophilized, and vacuum sealed in plastic. Sealedpods were shipped to the USDA/ARS/SPCL research facility in Beltsville, Maryland priorto RNA isolation. Greenhouse grown pods were harvested and frozen in liquid nitrogenprior to RNA isolation. Five micrograms of total RNA was loaded per lane. Represen-tative RNA samples are presented.
B.A. Bailey et al. / Physiological and Molecular Plant Pathology 81 (2013) 84e9686
exceptions. Freeze-dried mycelia were ground in a mortar andpestle in liquid nitrogen and extracted with one 15 ml aliquot ofextraction buffer after which the material was transferred to anOak-Ridge tube and the tube held in a 65 �C water bath for 15 minbefore centrifugation, chloroform extraction and precipitation withlithium chloride.
2.5. Expression analysis using RT-qPCR
Procedures for RT-qPCR and analysis were as described by Baileyet al. [15]. The sequence information of the primer sets used and theassociated plant ESTs is given in Supplementary File S1. Themajority of the plant stress related ESTs studied were derived frompreviously published manuscripts [14e21]. Additional cacao ESTswere chosen from the cacao genome [17] based on their relatednessto known genes associated with hormone biosynthesis or action.Forty-five Mr ESTs were chosen for monitoring Mr activity ininfected pods (Supplemental File S2) based on their relatedness toexpressed ESTs in the related fungus M. perniciosa (Mp) [13] ortheir identification by Solexa sequencing of RNA from a 60 DAInecrotic sporulating pod (unpublished data). The sequences wereverified by comparison to the M. roreri genome (M. roreri GenomeSequencing Consortium, http://bioinfo03.ibi.unicamp.br/roreri/).To obtain the relative transcript levels, the threshold cycle (CT)values for all genes of interest (CT�GOI) were normalized to the CTvalues of ACTIN (CT�ACT) for each replication [DCT ¼ (CT�ACT)e(CT�GOI)]. Relative transcript levels for cacao ESTs and Mr ACTIN(MrAct) were calculated with respect to cacao ACTIN transcriptlevels (% of TcAct) and the relative transcript levels forMr ESTs werecalculated with respect to Mr ACTIN transcript levels (% of MrAct).The expression levels for each EST in each sample were calculatedas % ACTIN ¼ 100*[(E) DCT] where E equals the primer efficiency.
2.6. Metabolite analysis
Metabolite concentrations were measured for healthy anddiseased pods at 30 and 60 DAI (3 pods for each treatment by DAIcombination) and for Mr mycelia grown in PDB and MIN-G(4 samples for each growth condition). Extractions were con-ducted following the methodology in Melnick et al. [13]. Freeze-dried tissue was ground to a fine powder in liquid nitrogen. Thepulverized tissue (50 mg dry weight) was extracted at 4 �C with1.4 ml methanol in a ground glass tissue homogenizer. A mixtureof 45 ml of internal standards containing 62.5 nmol of a-
aminobutyric acid and 26 mmol of ribitol was injected prior tohomogenization. The homogenates were collected, incubated at70 �C in a H2O bath for 15 min, and diluted with an equal volumeof deionized H2O. The aqueous-methanol extracts were centri-fuged for 15 min at 5800 � g. Supernatants were transferred tofresh tubes and stored for up to 2 weeks at �20 �C. As described byMelnick et al. [13], amino acid analysis was carried out using ultraperformance liquid chromatography, and organic acids and solublecarbohydrates were measured by gas chromatography coupled tomass spectrometry.
2.7. Statistical analysis
Relative expression data (EST expression as % ACTIN) was LOG-transformed to linearize the data following the protocol set forRT-qPCR in Rieu and Power [22]. Relative cacao expression datawas analyzed for significance using a three-way factorial design(experiment, DAI, and treatment) using PROC MIXED in SAS 9.3(SAS Institute Inc., Raleigh, NC, USA) with a ¼ 0.05. All meansseparations associated with this study were carried out usingTukey testing with a ¼ 0.05. There were two experiments (Expt 1,Expt 2), three DAIs (7, 30, and 60 DAI), and two treatments(control and inoculated with Mr). Expt 1 and 2 had 3 and 4replicates per treatment by DAI combination, respectively. Rela-tive Mr expression data was analyzed for significance using a two-way factorial design (experiment and DAI) using PROC MIXED.There were two experiments (Expt 1, Expt 2) and two DAIs (30and 60 DAI). Note for Mr expression data, as expected, Mr primersdid not consistently amplify in uninoculated pods or 7 DAI podswhich were not included in analysis (see description in results).Expt 1 and 2 had 3 and 4 replicates at each DAI, respectively. Datafor gene expression was not presented when there was a signifi-cant experiment*treatment or experiment*treatment*DAI inter-action in the 3-way ANOVA. Metabolite data was also LOG-transformed to linearize the data. Pod metabolite data wasanalyzed by two-way factorial (DAI and treatment) using PROCMIXED. For pod metabolite data, there are three replicates pertreatment (control and inoculated) by DAI (30 and 60 DAI)combination. Mr pure culture metabolite data and Mr expressiondata was analyzed by using PROC MIXED. For Mr liquid culturemetabolite data and expression data, there are four replicates pergrowth medium (PDB and MIN-glucose).
3. Results
3.1. Clone Matina-1 pod colonization by M. roreri
Clone Matina-1 pods exposed to natural field inoculum showingno symptoms, malformation, or necrosis and sporulation wereharvested. The freeze dried pods were examined for the type ofhyphae present. Hyphae were not observed in tissues fromasymptomatic pods. The surface of malformed pods was generallydevoid of hyphae. The hyphae inside malformed pods were thick,convoluted and sparsely spread (Fig. 2AeC). Hyphae were found inthe receptacle in only 1 of three malformed pods dissected. Hyphaewere observed in 2 of 6 husk sections, 5 of 6 outer pulp sections and5 of 6 seed sections in malformed pods. Limited amounts of thinmyceliumwas noted in 1 of 6 outer pulp sections but otherwisewasnot observed in malformed pods. Thick convoluted hyphae couldstill be found in tissue sections of necrotic sporulating pods. Profuseamounts of thin hyphae were also observed in all sections (2D, and2E) of necrotic sporulating pods. The thin hyphae in necrotic podtissue sections tended to tuft out from the disrupted tissue (Fig. 2D).The surface of necrotic pods was covered with sporophores andnumerous meiospores (Fig. 2F).

Fig. 2. M. roreri hyphae in infected pods at different stages of disease. (A) Hyphae from malformed pods inside husk section and (B) pod receptacle. Hyphae in these locations were2.6e5.8 mm in diameter and convoluted, typical of the haploid phase. (C) Pulp and (D and E) seed sections showed profuse amounts of thin, elongated hyphae (1.2e2.6 mm)throughout necrotic sporulating pods. (F) Sporophore from surface of necrotic sporulating pod. Bars are 20 mm in length for all panels except for panel D, in which the bar is 100 mm.
B.A. Bailey et al. / Physiological and Molecular Plant Pathology 81 (2013) 84e96 87
3.2. Disease progression after artificial inoculation and detection ofM. roreri in infect pods
A total of 30 two month old pods were inoculated with Mr inexperiment 1 (Expt 1) and 40 two month old pods were inoculatedin experiment 2 (Expt 2). A similar number of uninoculated pods(controls) were kept for each experiment. Since we harvested sixinoculated and control pods at 7, 30, and 60 DAI, the number ofavailable pods to sample decreased by six per treatment with eachsampling period. No symptoms were observed on inoculated podsin either experiment 7 DAI. In Expt 1 at 30 DAI when the 24remaining inoculated pods were considered, 14 were asymptom-atic, 8 were malformed, and 2 were necrotic and sporulating. SixtyDAI, 18 inoculated pods remained in the field. Five of the pods weresporulating, two pods were malformed, and 11 pods remainedasymptomatic. Four of the 5 sporulating pods observed 60 DAI weremalformed at 30 DAI. Among the uninoculated pods (control) inExpt 1 no symptoms were apparent until 60 DAI when 3 of 18 podswere malformed. Not counting the 7 DAI samples, in Expt 2 all theinoculated pods eventually showed symptoms. At 30 DAI, 29 of 34inoculated pods were malformed and 1 pod was sporulating, withthe remaining 4 pods being asymptomatic. By 60 DAI in Expt 2, 25of 28 remaining inoculated pods were necrotic and sporulating
with the remainder being malformed. Among the control pods inExpt 2, no symptoms were apparent until 60 DAI when 1 of 28 podswas malformed and 7 of 28 pods were sporulating. Consideringresults from both experiments, there were no symptoms of infec-tion 7 DAI while the most common symptoms of infection 30 and60 DAI were malformation (Fig. 3C) and necrosis with sporulation(Fig. 3D), respectively.
3.3. Changes in cacao pod metabolites in response to infection byM. roreri
Metabolite analysis (Table 1) was carried out on malformedpods 30 DAI (Fig. 3C) and on necrotic sporulating pods 60 DAI(Fig. 3D), in addition to asymptomatic control pods at bothtime points (Fig. 3A and B). There was an increase in malonic acid(3-fold) and an increase in mannitol (28.2-fold) in infected podscompared to healthy control pods across both time points. A 1.7-fold reduction in glucose, a 2.0-fold reduction in asparagine, anda 1.6-fold reduction in phenylalanine were observed in malformedpods 30 DAI. By 60 DAI the glucose level in necrotic sporulatingpods was reducedmore than 40.7-fold compared to healthy pods atthe same time point. At 60 DAI there was a large decrease in mostmetabolites in response to infection. For example, concentrations of
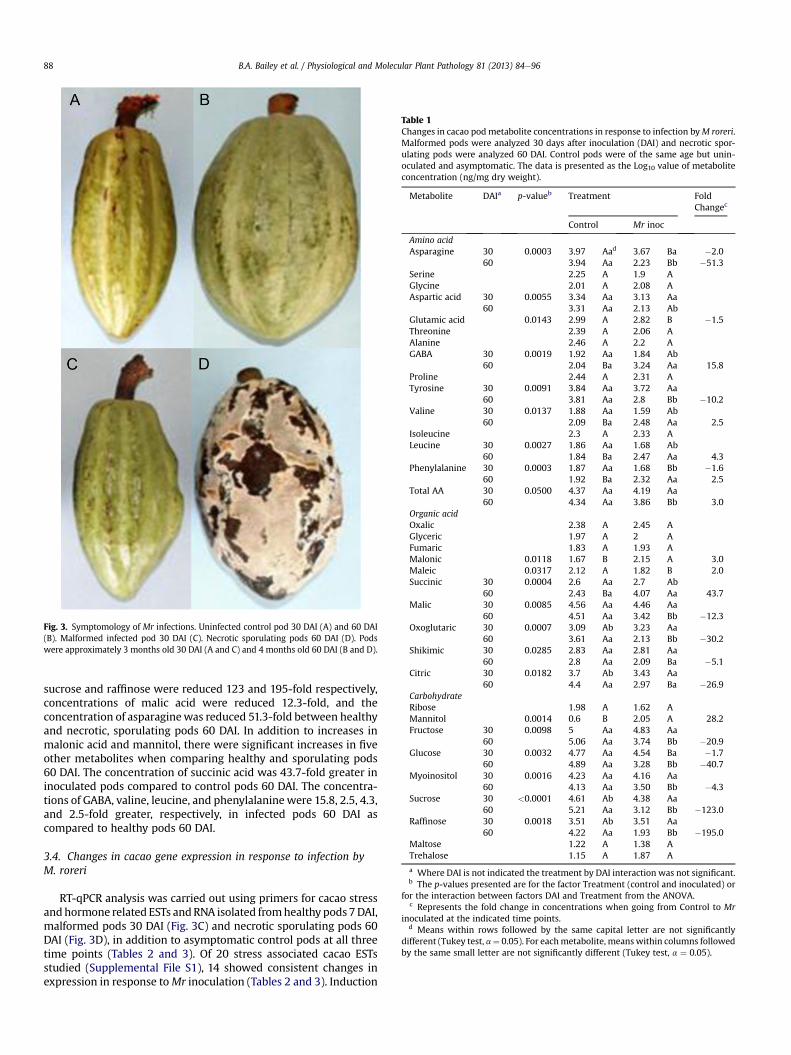
Table 1Changes in cacao podmetabolite concentrations in response to infection byM roreri.Malformed pods were analyzed 30 days after inoculation (DAI) and necrotic spor-ulating pods were analyzed 60 DAI. Control pods were of the same age but unin-oculated and asymptomatic. The data is presented as the Log10 value of metaboliteconcentration (ng/mg dry weight).
Metabolite DAIa p-valueb Treatment FoldChangec
Control Mr inoc
Amino acidAsparagine 30 0.0003 3.97 Aad 3.67 Ba �2.0
60 3.94 Aa 2.23 Bb �51.3Serine 2.25 A 1.9 AGlycine 2.01 A 2.08 AAspartic acid 30 0.0055 3.34 Aa 3.13 Aa
60 3.31 Aa 2.13 AbGlutamic acid 0.0143 2.99 A 2.82 B �1.5Threonine 2.39 A 2.06 AAlanine 2.46 A 2.2 AGABA 30 0.0019 1.92 Aa 1.84 Ab
60 2.04 Ba 3.24 Aa 15.8Proline 2.44 A 2.31 ATyrosine 30 0.0091 3.84 Aa 3.72 Aa
60 3.81 Aa 2.8 Bb �10.2Valine 30 0.0137 1.88 Aa 1.59 Ab
60 2.09 Ba 2.48 Aa 2.5Isoleucine 2.3 A 2.33 ALeucine 30 0.0027 1.86 Aa 1.68 Ab
60 1.84 Ba 2.47 Aa 4.3Phenylalanine 30 0.0003 1.87 Aa 1.68 Bb �1.6
60 1.92 Ba 2.32 Aa 2.5Total AA 30 0.0500 4.37 Aa 4.19 Aa
60 4.34 Aa 3.86 Bb 3.0Organic acidOxalic 2.38 A 2.45 AGlyceric 1.97 A 2 AFumaric 1.83 A 1.93 AMalonic 0.0118 1.67 B 2.15 A 3.0Maleic 0.0317 2.12 A 1.82 B 2.0Succinic 30 0.0004 2.6 Aa 2.7 Ab
60 2.43 Ba 4.07 Aa 43.7Malic 30 0.0085 4.56 Aa 4.46 Aa
60 4.51 Aa 3.42 Bb �12.3Oxoglutaric 30 0.0007 3.09 Ab 3.23 Aa
60 3.61 Aa 2.13 Bb �30.2Shikimic 30 0.0285 2.83 Aa 2.81 Aa
60 2.8 Aa 2.09 Ba �5.1Citric 30 0.0182 3.7 Ab 3.43 Aa
60 4.4 Aa 2.97 Ba �26.9CarbohydrateRibose 1.98 A 1.62 AMannitol 0.0014 0.6 B 2.05 A 28.2Fructose 30 0.0098 5 Aa 4.83 Aa
60 5.06 Aa 3.74 Bb �20.9Glucose 30 0.0032 4.77 Aa 4.54 Ba �1.7
60 4.89 Aa 3.28 Bb �40.7Myoinositol 30 0.0016 4.23 Aa 4.16 Aa
60 4.13 Aa 3.50 Bb �4.3Sucrose 30 <0.0001 4.61 Ab 4.38 Aa
60 5.21 Aa 3.12 Bb �123.0Raffinose 30 0.0018 3.51 Ab 3.51 Aa
60 4.22 Aa 1.93 Bb �195.0Maltose 1.22 A 1.38 ATrehalose 1.15 A 1.87 A
a Where DAI is not indicated the treatment by DAI interaction was not significant.b The p-values presented are for the factor Treatment (control and inoculated) or
for the interaction between factors DAI and Treatment from the ANOVA.c Represents the fold change in concentrations when going from Control to Mr
inoculated at the indicated time points.d Means within rows followed by the same capital letter are not significantly
different (Tukey test, a¼ 0.05). For eachmetabolite, meanswithin columns followedby the same small letter are not significantly different (Tukey test, a ¼ 0.05).
Fig. 3. Symptomology of Mr infections. Uninfected control pod 30 DAI (A) and 60 DAI(B). Malformed infected pod 30 DAI (C). Necrotic sporulating pods 60 DAI (D). Podswere approximately 3 months old 30 DAI (A and C) and 4 months old 60 DAI (B and D).
B.A. Bailey et al. / Physiological and Molecular Plant Pathology 81 (2013) 84e9688
sucrose and raffinose were reduced 123 and 195-fold respectively,concentrations of malic acid were reduced 12.3-fold, and theconcentration of asparaginewas reduced 51.3-fold between healthyand necrotic, sporulating pods 60 DAI. In addition to increases inmalonic acid and mannitol, there were significant increases in fiveother metabolites when comparing healthy and sporulating pods60 DAI. The concentration of succinic acid was 43.7-fold greater ininoculated pods compared to control pods 60 DAI. The concentra-tions of GABA, valine, leucine, and phenylalanine were 15.8, 2.5, 4.3,and 2.5-fold greater, respectively, in infected pods 60 DAI ascompared to healthy pods 60 DAI.
3.4. Changes in cacao gene expression in response to infection byM. roreri
RT-qPCR analysis was carried out using primers for cacao stressandhormone related ESTs andRNA isolated fromhealthy pods7DAI,malformed pods 30 DAI (Fig. 3C) and necrotic sporulating pods 60DAI (Fig. 3D), in addition to asymptomatic control pods at all threetime points (Tables 2 and 3). Of 20 stress associated cacao ESTsstudied (Supplemental File S1), 14 showed consistent changes inexpression in response toMr inoculation (Tables 2 and 3). Induction
Table 2Changes in T. cacao EST expression in response to inoculation with M. roreri wherethe interaction with days after inoculation (DAI) was not significant. Inoculated(Inoc) and non-inoculated pods (Cont) were harvested 7 (all asymptomatic pods), 30(malformed inoculated pods), and 60 (necrotic and sporulating inoculated pods)DAI. Data is presented as the Log10 value of the gene of interest’s expression asa percent of T. cacao actin expression. The fold change in T. cacao gene expression inresponse to inoculation is presented as repression (negative numbers) and induction(positive numbers) along with the ESTs’ putative identities.
ESTs p-valuea Cont Inoc Foldchangeb
Putative ID
Stress relatedTcUSP-CAB 0.0065 0.38 Bc 0.77 A 2.5 Universal stress proteinTcNAM-ICS 0.0052 0.74 B 1.01 A 1.9 No apical meristemTcPR10C 0.0019 �0.48 B �0.13 A 2.2 Pathogenesis-related
protein 10cTcPER1 0.0051 1.3 B 1.56 A 1.8 Apoplastic quiacol
peroxidase-likeTcNPR1 0.0472 �0.13 B 0.05 A 1.5 NPR1-likeTcGHMPK <0.0001 0.43 B 0.67 A 1.7 Phosphomevalonate
kinaseJasmonic acidTcMAPKK3 0.0287 0.57 B 0.89 A 2.1 Map kinase kinase 3EthyleneTcACS <0.0001 �0.81 B �0.52 A 1.9 ACC synthaseTcERF-ICS 0.0002 1.61 B 1.93 A 2.1 Ethylene responsive
factorCytokininTcCKeN-GT1 <0.0001 �0.18 A �0.47 B �1.9 Cytokinin-N-
glucosyltransferase 1TcCrtXb 0.0004 �1.74 B �1.18 A 3.6 Zeatin
O-glucosyltransferaseABATcPYL8 0.0032 0.73 B 0.93 A 1.6 Abscisic acid receptorTcPYL9 0.0003 0.87 B 1.09 A 1.7 Abscisic acid receptor
a The p-values presented are for the factor Treatment (control and inoculated)from the ANOVA.
b The change in expression for each EST was determined by taking the inverseLog10 of the Log10 values for control in inoculated and dividing the control values bythe inoculated values where potential repression occurred and dividing the inocu-lated values by the control values where induction occurred.
c Means within rows followed by the same letter are not different (Tukey test,a ¼ 0.05).
B.A. Bailey et al. / Physiological and Molecular Plant Pathology 81 (2013) 84e96 89
of six ESTs (TcUSP-CAB, TcNAM-ICS, TcPR10C, TcPER-1, TcNPR1, andTcGHMPK) was not affected by DAI (Table 2). For these six ESTs, thelevels of induction varied from 1.5 to 2.5-fold. Five stress relatedcacao ESTs had altered expression starting 30DAI and the expressionof three ESTs was altered at 60 DAI only (Table 3). Stress related ESTsTcODC, TcABC-T, P59, TcChi4, and TcPR5were induced by infection 4.8,10.5, 257, 8.7, and 16.2-fold at 30 DAI, respectively. TcCaff-CAB wasrepressed by infection 72-fold 60 DAI. TcEFwas induced by infection6.3 and TcLT was repressed 6-fold, 60 DAI.
Among the 51 plant hormone associated ESTs studied, expres-sion of seven ESTs was altered in response to infection regardless ofDAI (Table 2). TcCKeN-GT1was 1.9-fold repressed while TcMAPKK3,TcACS, TcERF-ICS, TcCrtXb, TcPYL8, and TcPYL9 were induced byinfection 2.1, 1.9, 2.1, 1.3, 3.6, 1.6, and 1.7-fold, respectively. Theexpression of 6 hormone associated ESTs was altered in response toinfection beginning 30 DAI (Table 3). TcLOX1, TcORP2, TcACC8,TcGH3.1, TcCKeO-GT2, and TcNCED1, were induced by infection 4.6,41.7, 5.8, 2.9, 6.5, and 4.2-fold 30 DAI. Eight plant hormone asso-ciated ESTs had altered expression only at 60 DAI. ESTs TcLOX3,TcSAMDCb, TcMK, and TcAREB5.6were induced 11.0, 3.5, 2.1, and 6.9-fold, respectively 60 DAI. ESTs TcJMT3, TcAIL1, TcGA20OX1B, andTcKAOa were repressed 30.2, 89.1, 9.5, and 15.8-fold 60 DAI.
3.5. Changes in M. roreri gene expression between 30 and 60 DAI
RT-qPCR analysis was carried out using primers for Mr ESTs andRNA isolated from malformed pods 30 DAI (Fig. 3C) and necrotic
sporulating pods 60 DAI (Fig. 3D). The dissociation curves for theMrESTs presented single peaks that were consistent between inocu-lated pods and pure Mr cultures. For the Mr ESTs studied, expres-sion in control pods was below or approached the lower limits ofdetection in most samples. Some background amplification wasobserved in control pods but was not repeatable for the samesample or among different control samples at the same time points.When detected in control pods, Mr EST expression was more than1000 fold (10 cycles) lower than expression observed in inoculatedpods. MrAct expression averaged 1.4% of TcAct (Log10 mean equal0.13) at 30 DAI in malformed pods and 18.3% of TcAct (Log10 meanequal 1.26) at 60 DAI in necrotic and sporulating pods, an increaseof 13.5-fold.
TheMr ESTs (Supplemental File S2) studied were selected basedon 3 approaches: 1) Orthologues to 21 ESTs studied in the sisterpathogen M. perniciosa [13,23,24], 2) ESTs identified through deepsequencing of RNA from a single 60 DAI Mr infected pod (18 ESTs),and 3) ESTs with homology to specific genes of interest (six ESTs).Thirty nine Mr EST studied showed significant changes in expres-sion between 30 and 60 DAI infected pods relative to MrActexpression levels (Table 4). Eleven Mr ESTs, including MrIDH asso-ciated with the glyoxylate pathway, were repressed in necroticpods 60 DAI when compared to expression levels in malformedpods 30 DAI in both experiments. Five Mr ESTs were repressedbetween 1.7 and 2.8-fold (note MrIDH at bottom of table), five MrESTs were repressed between 3.1 and 6.0-fold, and ESTMrTEFBwasrepressed 9.5-fold. Twenty eight Mr ESTs were induced in necroticpods 60 DAI when compared to expression levels in malformedpods 30 DAI. Five Mr ESTs were induced between 2.0 and 2.8-fold,11 Mr ESTs were induced between 3.0 and 8.7-fold and 12 Mr ESTswere induced greater than 10-fold. The maximum inductionbetween 30 and 60 DAI was 347-fold for EST MrGMCOR.
3.6. Changes in M. roreri metabolite concentrations due to shift toMIN media minus glucose
Metabolite analysis also was carried out on mycelia grown inPDB for 2 weeks and either replenished with fresh PDB or MINmedia minus glucose (MIN-G). There was a significant shift inspecific amino acid concentrations due to the shift from PDB toMIN minus glucose although total amino acid concentrations didnot change (Table 5). Aspartic acid, glutamic acid, and tyrosineincreased in concentration along with GABA. Amino acidsmethionine, isoleucine, leucine, and phenylalanine decreased inconcentration. Among the organic acids detected, fumaric acidand malic acid concentrations increased. High concentrations ofoxalic acid and succinic acid were detected without regard toculture conditions. Among the carbohydrates, high concentra-tions of mannitol were detected without regard to cultureconditions. Concentrations of fructose, glucose, maltose, andtrehalose decreased in response to the shift to MIN-G. Notably,glucose concentrations decreased 389-fold.
3.7. Changes in M. roreri EST expression due to the shift to MIN-G
RT-qPCR analysis was carried out (Table 6) using primers for MrESTs andRNA isolated frommycelia grown in PDB for twoweeks andeither replenished with fresh PDB or MIN media minus glucose(MIN-G). Among the 45 Mr ESTs studied, the expression of 29 MrESTSwas altered in response to the shift to MINeG (Table 6). TwelveMrESTSwere repressed between1.4 and2.7-fold andfifteenMr ESTswere repressed between 3.0 and 9.1-fold in response to the shift toMIN-G. Only two Mr ESTs, MrPEP, and MrOXRED, were induced inresponse to the shift to MIN-G, 1.8, and 8.7-fold, respectively.
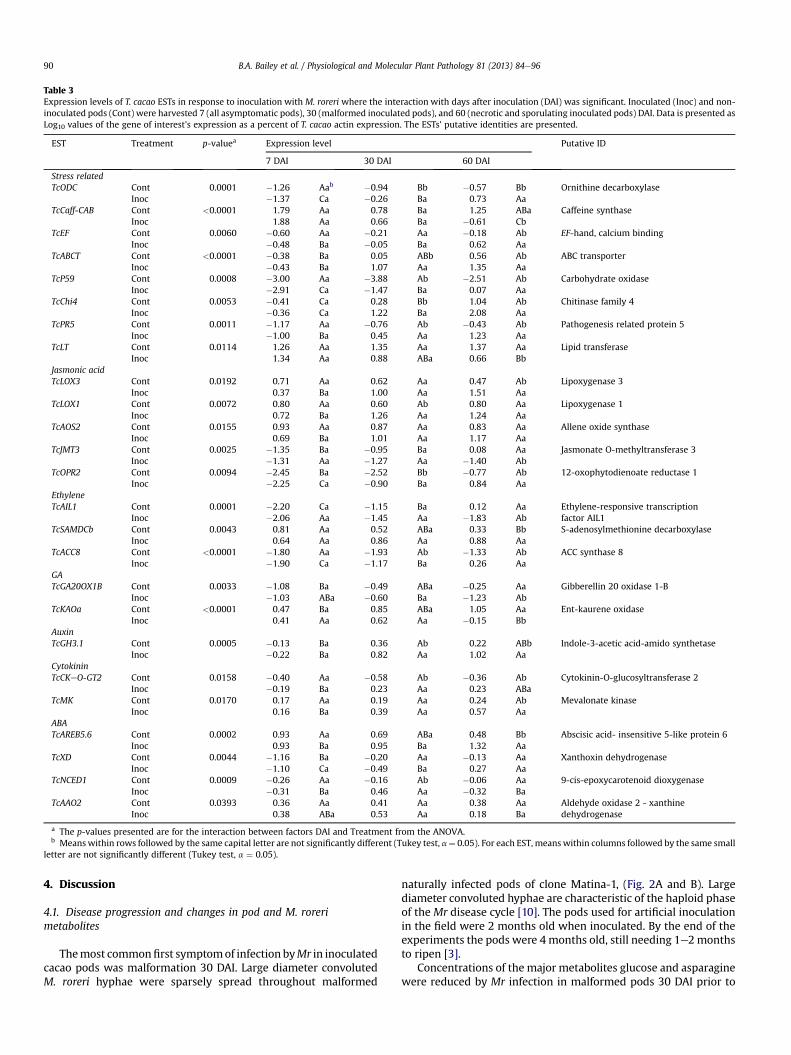
Table 3Expression levels of T. cacao ESTs in response to inoculation with M. roreri where the interaction with days after inoculation (DAI) was significant. Inoculated (Inoc) and non-inoculated pods (Cont) were harvested 7 (all asymptomatic pods), 30 (malformed inoculated pods), and 60 (necrotic and sporulating inoculated pods) DAI. Data is presented asLog10 values of the gene of interest’s expression as a percent of T. cacao actin expression. The ESTs’ putative identities are presented.
EST Treatment p-valuea Expression level Putative ID
7 DAI 30 DAI 60 DAI
Stress relatedTcODC Cont 0.0001 �1.26 Aab �0.94 Bb �0.57 Bb Ornithine decarboxylase
Inoc �1.37 Ca �0.26 Ba 0.73 AaTcCaff-CAB Cont <0.0001 1.79 Aa 0.78 Ba 1.25 ABa Caffeine synthase
Inoc 1.88 Aa 0.66 Ba �0.61 CbTcEF Cont 0.0060 �0.60 Aa �0.21 Aa �0.18 Ab EF-hand, calcium binding
Inoc �0.48 Ba �0.05 Ba 0.62 AaTcABCT Cont <0.0001 �0.38 Ba 0.05 ABb 0.56 Ab ABC transporter
Inoc �0.43 Ba 1.07 Aa 1.35 AaTcP59 Cont 0.0008 �3.00 Aa �3.88 Ab �2.51 Ab Carbohydrate oxidase
Inoc �2.91 Ca �1.47 Ba 0.07 AaTcChi4 Cont 0.0053 �0.41 Ca 0.28 Bb 1.04 Ab Chitinase family 4
Inoc �0.36 Ca 1.22 Ba 2.08 AaTcPR5 Cont 0.0011 �1.17 Aa �0.76 Ab �0.43 Ab Pathogenesis related protein 5
Inoc �1.00 Ba 0.45 Aa 1.23 AaTcLT Cont 0.0114 1.26 Aa 1.35 Aa 1.37 Aa Lipid transferase
Inoc 1.34 Aa 0.88 ABa 0.66 BbJasmonic acidTcLOX3 Cont 0.0192 0.71 Aa 0.62 Aa 0.47 Ab Lipoxygenase 3
Inoc 0.37 Ba 1.00 Aa 1.51 AaTcLOX1 Cont 0.0072 0.80 Aa 0.60 Ab 0.80 Aa Lipoxygenase 1
Inoc 0.72 Ba 1.26 Aa 1.24 AaTcAOS2 Cont 0.0155 0.93 Aa 0.87 Aa 0.83 Aa Allene oxide synthase
Inoc 0.69 Ba 1.01 Aa 1.17 AaTcJMT3 Cont 0.0025 �1.35 Ba �0.95 Ba 0.08 Aa Jasmonate O-methyltransferase 3
Inoc �1.31 Aa �1.27 Aa �1.40 AbTcOPR2 Cont 0.0094 �2.45 Ba �2.52 Bb �0.77 Ab 12-oxophytodienoate reductase 1
Inoc �2.25 Ca �0.90 Ba 0.84 AaEthyleneTcAIL1 Cont 0.0001 �2.20 Ca �1.15 Ba 0.12 Aa Ethylene-responsive transcription
factor AIL1Inoc �2.06 Aa �1.45 Aa �1.83 AbTcSAMDCb Cont 0.0043 0.81 Aa 0.52 ABa 0.33 Bb S-adenosylmethionine decarboxylase
Inoc 0.64 Aa 0.86 Aa 0.88 AaTcACC8 Cont <0.0001 �1.80 Aa �1.93 Ab �1.33 Ab ACC synthase 8
Inoc �1.90 Ca �1.17 Ba 0.26 AaGATcGA20OX1B Cont 0.0033 �1.08 Ba �0.49 ABa �0.25 Aa Gibberellin 20 oxidase 1-B
Inoc �1.03 ABa �0.60 Ba �1.23 AbTcKAOa Cont <0.0001 0.47 Ba 0.85 ABa 1.05 Aa Ent-kaurene oxidase
Inoc 0.41 Aa 0.62 Aa �0.15 BbAuxinTcGH3.1 Cont 0.0005 �0.13 Ba 0.36 Ab 0.22 ABb Indole-3-acetic acid-amido synthetase
Inoc �0.22 Ba 0.82 Aa 1.02 AaCytokininTcCKeO-GT2 Cont 0.0158 �0.40 Aa �0.58 Ab �0.36 Ab Cytokinin-O-glucosyltransferase 2
Inoc �0.19 Ba 0.23 Aa 0.23 ABaTcMK Cont 0.0170 0.17 Aa 0.19 Aa 0.24 Ab Mevalonate kinase
Inoc 0.16 Ba 0.39 Aa 0.57 AaABATcAREB5.6 Cont 0.0002 0.93 Aa 0.69 ABa 0.48 Bb Abscisic acid- insensitive 5-like protein 6
Inoc 0.93 Ba 0.95 Ba 1.32 AaTcXD Cont 0.0044 �1.16 Ba �0.20 Aa �0.13 Aa Xanthoxin dehydrogenase
Inoc �1.10 Ca �0.49 Ba 0.27 AaTcNCED1 Cont 0.0009 �0.26 Aa �0.16 Ab �0.06 Aa 9-cis-epoxycarotenoid dioxygenase
Inoc �0.31 Ba 0.46 Aa �0.32 BaTcAAO2 Cont 0.0393 0.36 Aa 0.41 Aa 0.38 Aa Aldehyde oxidase 2 - xanthine
dehydrogenaseInoc 0.38 ABa 0.53 Aa 0.18 Ba
a The p-values presented are for the interaction between factors DAI and Treatment from the ANOVA.b Meanswithin rows followed by the same capital letter are not significantly different (Tukey test, a¼ 0.05). For each EST, meanswithin columns followed by the same small
letter are not significantly different (Tukey test, a ¼ 0.05).
B.A. Bailey et al. / Physiological and Molecular Plant Pathology 81 (2013) 84e9690
4. Discussion
4.1. Disease progression and changes in pod and M. rorerimetabolites
Themost commonfirst symptomof infection byMr in inoculatedcacao pods was malformation 30 DAI. Large diameter convolutedM. roreri hyphae were sparsely spread throughout malformed
naturally infected pods of clone Matina-1, (Fig. 2A and B). Largediameter convoluted hyphae are characteristic of the haploid phaseof the Mr disease cycle [10]. The pods used for artificial inoculationin the field were 2 months old when inoculated. By the end of theexperiments the pods were 4 months old, still needing 1e2monthsto ripen [3].
Concentrations of the major metabolites glucose and asparaginewere reduced by Mr infection in malformed pods 30 DAI prior to
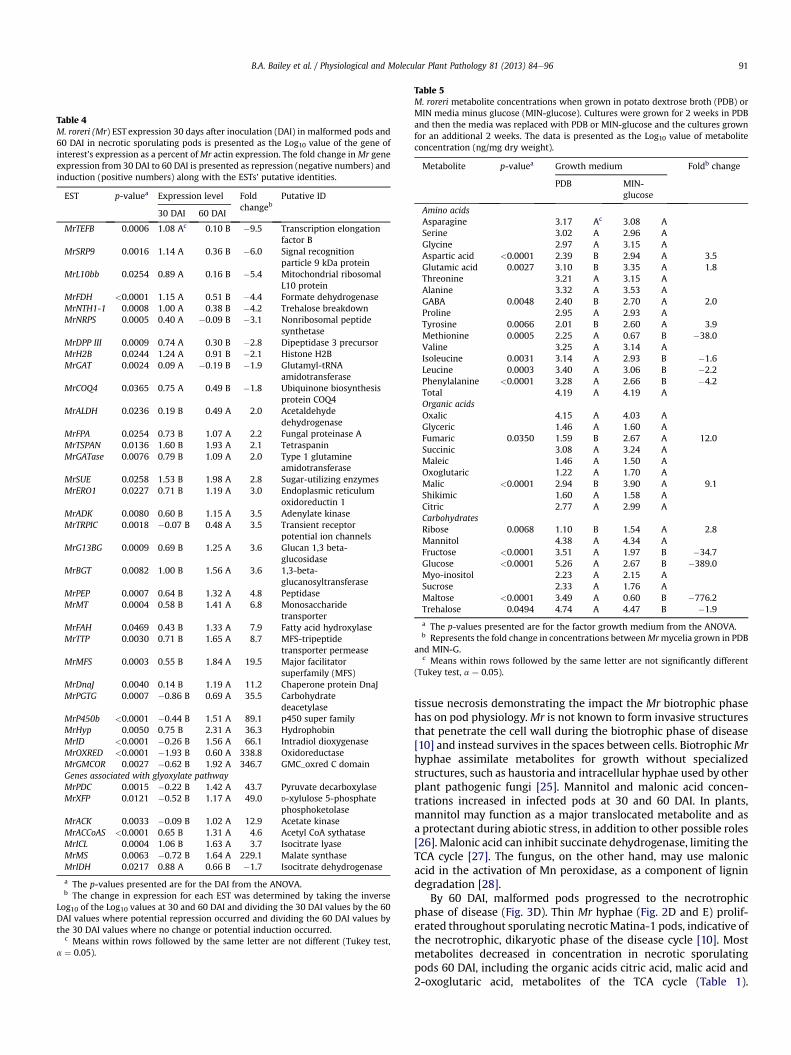
Table 4M. roreri (Mr) EST expression 30 days after inoculation (DAI) in malformed pods and60 DAI in necrotic sporulating pods is presented as the Log10 value of the gene ofinterest’s expression as a percent ofMr actin expression. The fold change inMr geneexpression from 30 DAI to 60 DAI is presented as repression (negative numbers) andinduction (positive numbers) along with the ESTs’ putative identities.
EST p-valuea Expression level Foldchangeb
Putative ID
30 DAI 60 DAI
MrTEFB 0.0006 1.08 Ac 0.10 B �9.5 Transcription elongationfactor B
MrSRP9 0.0016 1.14 A 0.36 B �6.0 Signal recognitionparticle 9 kDa protein
MrL10bb 0.0254 0.89 A 0.16 B �5.4 Mitochondrial ribosomalL10 protein
MrFDH <0.0001 1.15 A 0.51 B �4.4 Formate dehydrogenaseMrNTH1-1 0.0008 1.00 A 0.38 B �4.2 Trehalose breakdownMrNRPS 0.0005 0.40 A �0.09 B �3.1 Nonribosomal peptide
synthetaseMrDPP III 0.0009 0.74 A 0.30 B �2.8 Dipeptidase 3 precursorMrH2B 0.0244 1.24 A 0.91 B �2.1 Histone H2BMrGAT 0.0024 0.09 A �0.19 B �1.9 Glutamyl-tRNA
amidotransferaseMrCOQ4 0.0365 0.75 A 0.49 B �1.8 Ubiquinone biosynthesis
protein COQ4MrALDH 0.0236 0.19 B 0.49 A 2.0 Acetaldehyde
dehydrogenaseMrFPA 0.0254 0.73 B 1.07 A 2.2 Fungal proteinase AMrTSPAN 0.0136 1.60 B 1.93 A 2.1 TetraspaninMrGATase 0.0076 0.79 B 1.09 A 2.0 Type 1 glutamine
amidotransferaseMrSUE 0.0258 1.53 B 1.98 A 2.8 Sugar-utilizing enzymesMrERO1 0.0227 0.71 B 1.19 A 3.0 Endoplasmic reticulum
oxidoreductin 1MrADK 0.0080 0.60 B 1.15 A 3.5 Adenylate kinaseMrTRPIC 0.0018 �0.07 B 0.48 A 3.5 Transient receptor
potential ion channelsMrG13BG 0.0009 0.69 B 1.25 A 3.6 Glucan 1,3 beta-
glucosidaseMrBGT 0.0082 1.00 B 1.56 A 3.6 1,3-beta-
glucanosyltransferaseMrPEP 0.0007 0.64 B 1.32 A 4.8 PeptidaseMrMT 0.0004 0.58 B 1.41 A 6.8 Monosaccharide
transporterMrFAH 0.0469 0.43 B 1.33 A 7.9 Fatty acid hydroxylaseMrTTP 0.0030 0.71 B 1.65 A 8.7 MFS-tripeptide
transporter permeaseMrMFS 0.0003 0.55 B 1.84 A 19.5 Major facilitator
superfamily (MFS)MrDnaJ 0.0040 0.14 B 1.19 A 11.2 Chaperone protein DnaJMrPGTG 0.0007 �0.86 B 0.69 A 35.5 Carbohydrate
deacetylaseMrP450b <0.0001 �0.44 B 1.51 A 89.1 p450 super familyMrHyp 0.0050 0.75 B 2.31 A 36.3 HydrophobinMrID <0.0001 �0.26 B 1.56 A 66.1 Intradiol dioxygenaseMrOXRED <0.0001 �1.93 B 0.60 A 338.8 OxidoreductaseMrGMCOR 0.0027 �0.62 B 1.92 A 346.7 GMC_oxred C domainGenes associated with glyoxylate pathwayMrPDC 0.0015 �0.22 B 1.42 A 43.7 Pyruvate decarboxylaseMrXFP 0.0121 �0.52 B 1.17 A 49.0 D-xylulose 5-phosphate
phosphoketolaseMrACK 0.0033 �0.09 B 1.02 A 12.9 Acetate kinaseMrACCoAS <0.0001 0.65 B 1.31 A 4.6 Acetyl CoA sythataseMrICL 0.0004 1.06 B 1.63 A 3.7 Isocitrate lyaseMrMS 0.0063 �0.72 B 1.64 A 229.1 Malate synthaseMrIDH 0.0217 0.88 A 0.66 B �1.7 Isocitrate dehydrogenase
a The p-values presented are for the DAI from the ANOVA.b The change in expression for each EST was determined by taking the inverse
Log10 of the Log10 values at 30 and 60 DAI and dividing the 30 DAI values by the 60DAI values where potential repression occurred and dividing the 60 DAI values bythe 30 DAI values where no change or potential induction occurred.
c Means within rows followed by the same letter are not different (Tukey test,a ¼ 0.05).
Table 5M. roreri metabolite concentrations when grown in potato dextrose broth (PDB) orMIN media minus glucose (MIN-glucose). Cultures were grown for 2 weeks in PDBand then the media was replaced with PDB or MIN-glucose and the cultures grownfor an additional 2 weeks. The data is presented as the Log10 value of metaboliteconcentration (ng/mg dry weight).
Metabolite p-valuea Growth medium Foldb change
PDB MIN-glucose
Amino acidsAsparagine 3.17 Ac 3.08 ASerine 3.02 A 2.96 AGlycine 2.97 A 3.15 AAspartic acid <0.0001 2.39 B 2.94 A 3.5Glutamic acid 0.0027 3.10 B 3.35 A 1.8Threonine 3.21 A 3.15 AAlanine 3.32 A 3.53 AGABA 0.0048 2.40 B 2.70 A 2.0Proline 2.95 A 2.93 ATyrosine 0.0066 2.01 B 2.60 A 3.9Methionine 0.0005 2.25 A 0.67 B �38.0Valine 3.25 A 3.14 AIsoleucine 0.0031 3.14 A 2.93 B �1.6Leucine 0.0003 3.40 A 3.06 B �2.2Phenylalanine <0.0001 3.28 A 2.66 B �4.2Total 4.19 A 4.19 AOrganic acidsOxalic 4.15 A 4.03 AGlyceric 1.46 A 1.60 AFumaric 0.0350 1.59 B 2.67 A 12.0Succinic 3.08 A 3.24 AMaleic 1.46 A 1.50 AOxoglutaric 1.22 A 1.70 AMalic <0.0001 2.94 B 3.90 A 9.1Shikimic 1.60 A 1.58 ACitric 2.77 A 2.99 ACarbohydratesRibose 0.0068 1.10 B 1.54 A 2.8Mannitol 4.38 A 4.34 AFructose <0.0001 3.51 A 1.97 B �34.7Glucose <0.0001 5.26 A 2.67 B �389.0Myo-inositol 2.23 A 2.15 ASucrose 2.33 A 1.76 AMaltose <0.0001 3.49 A 0.60 B �776.2Trehalose 0.0494 4.74 A 4.47 B �1.9
a The p-values presented are for the factor growth medium from the ANOVA.b Represents the fold change in concentrations betweenMrmycelia grown in PDB
and MIN-G.c Means within rows followed by the same letter are not significantly different
(Tukey test, a ¼ 0.05).
B.A. Bailey et al. / Physiological and Molecular Plant Pathology 81 (2013) 84e96 91
tissue necrosis demonstrating the impact the Mr biotrophic phasehas on pod physiology.Mr is not known to form invasive structuresthat penetrate the cell wall during the biotrophic phase of disease[10] and instead survives in the spaces between cells. BiotrophicMrhyphae assimilate metabolites for growth without specializedstructures, such as haustoria and intracellular hyphae used by otherplant pathogenic fungi [25]. Mannitol and malonic acid concen-trations increased in infected pods at 30 and 60 DAI. In plants,mannitol may function as a major translocated metabolite and asa protectant during abiotic stress, in addition to other possible roles[26]. Malonic acid can inhibit succinate dehydrogenase, limiting theTCA cycle [27]. The fungus, on the other hand, may use malonicacid in the activation of Mn peroxidase, as a component of lignindegradation [28].
By 60 DAI, malformed pods progressed to the necrotrophicphase of disease (Fig. 3D). Thin Mr hyphae (Fig. 2D and E) prolif-erated throughout sporulating necroticMatina-1 pods, indicative ofthe necrotrophic, dikaryotic phase of the disease cycle [10]. Mostmetabolites decreased in concentration in necrotic sporulatingpods 60 DAI, including the organic acids citric acid, malic acid and2-oxoglutaric acid, metabolites of the TCA cycle (Table 1).
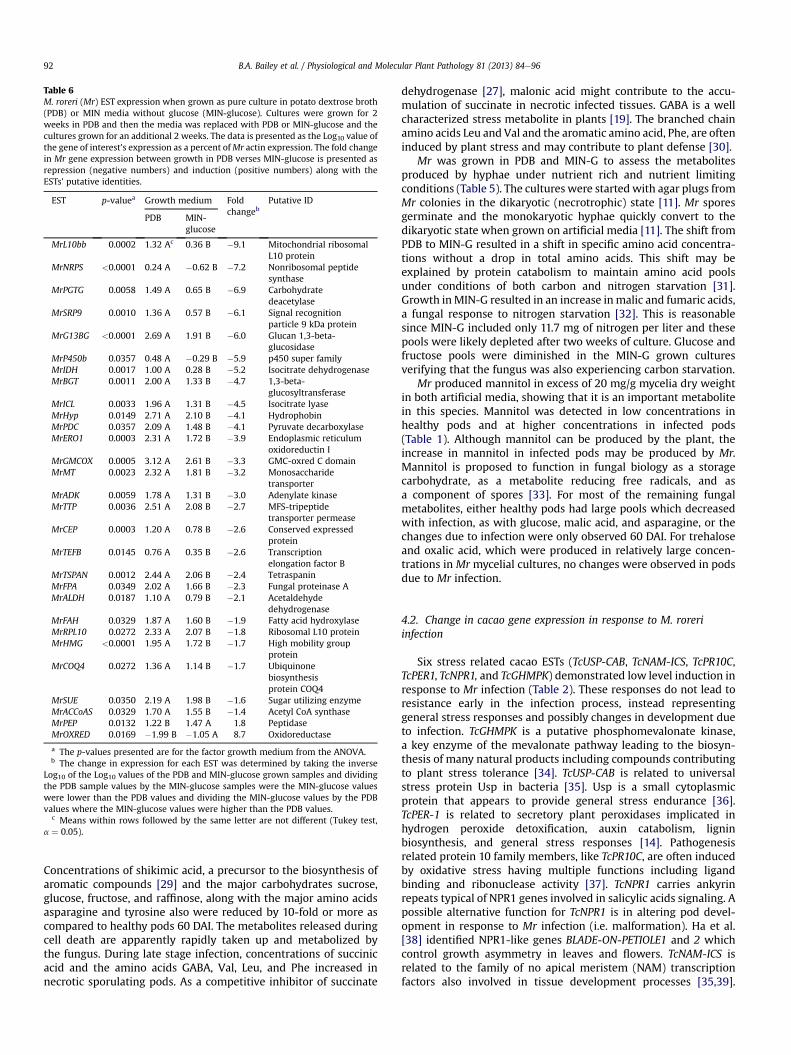
Table 6M. roreri (Mr) EST expression when grown as pure culture in potato dextrose broth(PDB) or MIN media without glucose (MIN-glucose). Cultures were grown for 2weeks in PDB and then the media was replaced with PDB or MIN-glucose and thecultures grown for an additional 2 weeks. The data is presented as the Log10 value ofthe gene of interest’s expression as a percent ofMr actin expression. The fold changein Mr gene expression between growth in PDB verses MIN-glucose is presented asrepression (negative numbers) and induction (positive numbers) along with theESTs’ putative identities.
EST p-valuea Growth medium Foldchangeb
Putative ID
PDB MIN-glucose
MrL10bb 0.0002 1.32 Ac 0.36 B �9.1 Mitochondrial ribosomalL10 protein
MrNRPS <0.0001 0.24 A �0.62 B �7.2 Nonribosomal peptidesynthase
MrPGTG 0.0058 1.49 A 0.65 B �6.9 Carbohydratedeacetylase
MrSRP9 0.0010 1.36 A 0.57 B �6.1 Signal recognitionparticle 9 kDa protein
MrG13BG <0.0001 2.69 A 1.91 B �6.0 Glucan 1,3-beta-glucosidase
MrP450b 0.0357 0.48 A �0.29 B �5.9 p450 super familyMrIDH 0.0017 1.00 A 0.28 B �5.2 Isocitrate dehydrogenaseMrBGT 0.0011 2.00 A 1.33 B �4.7 1,3-beta-
glucosyltransferaseMrICL 0.0033 1.96 A 1.31 B �4.5 Isocitrate lyaseMrHyp 0.0149 2.71 A 2.10 B �4.1 HydrophobinMrPDC 0.0357 2.09 A 1.48 B �4.1 Pyruvate decarboxylaseMrERO1 0.0003 2.31 A 1.72 B �3.9 Endoplasmic reticulum
oxidoreductin IMrGMCOX 0.0005 3.12 A 2.61 B �3.3 GMC-oxred C domainMrMT 0.0023 2.32 A 1.81 B �3.2 Monosaccharide
transporterMrADK 0.0059 1.78 A 1.31 B �3.0 Adenylate kinaseMrTTP 0.0036 2.51 A 2.08 B �2.7 MFS-tripeptide
transporter permeaseMrCEP 0.0003 1.20 A 0.78 B �2.6 Conserved expressed
proteinMrTEFB 0.0145 0.76 A 0.35 B �2.6 Transcription
elongation factor BMrTSPAN 0.0012 2.44 A 2.06 B �2.4 TetraspaninMrFPA 0.0349 2.02 A 1.66 B �2.3 Fungal proteinase AMrALDH 0.0187 1.10 A 0.79 B �2.1 Acetaldehyde
dehydrogenaseMrFAH 0.0329 1.87 A 1.60 B �1.9 Fatty acid hydroxylaseMrRPL10 0.0272 2.33 A 2.07 B �1.8 Ribosomal L10 proteinMrHMG <0.0001 1.95 A 1.72 B �1.7 High mobility group
proteinMrCOQ4 0.0272 1.36 A 1.14 B �1.7 Ubiquinone
biosynthesisprotein COQ4
MrSUE 0.0350 2.19 A 1.98 B �1.6 Sugar utilizing enzymeMrACCoAS 0.0329 1.70 A 1.55 B �1.4 Acetyl CoA synthaseMrPEP 0.0132 1.22 B 1.47 A 1.8 PeptidaseMrOXRED 0.0169 �1.99 B �1.05 A 8.7 Oxidoreductase
a The p-values presented are for the factor growth medium from the ANOVA.b The change in expression for each EST was determined by taking the inverse
Log10 of the Log10 values of the PDB and MIN-glucose grown samples and dividingthe PDB sample values by the MIN-glucose samples were the MIN-glucose valueswere lower than the PDB values and dividing the MIN-glucose values by the PDBvalues where the MIN-glucose values were higher than the PDB values.
c Means within rows followed by the same letter are not different (Tukey test,a ¼ 0.05).
B.A. Bailey et al. / Physiological and Molecular Plant Pathology 81 (2013) 84e9692
Concentrations of shikimic acid, a precursor to the biosynthesis ofaromatic compounds [29] and the major carbohydrates sucrose,glucose, fructose, and raffinose, along with the major amino acidsasparagine and tyrosine also were reduced by 10-fold or more ascompared to healthy pods 60 DAI. The metabolites released duringcell death are apparently rapidly taken up and metabolized bythe fungus. During late stage infection, concentrations of succinicacid and the amino acids GABA, Val, Leu, and Phe increased innecrotic sporulating pods. As a competitive inhibitor of succinate
dehydrogenase [27], malonic acid might contribute to the accu-mulation of succinate in necrotic infected tissues. GABA is a wellcharacterized stress metabolite in plants [19]. The branched chainamino acids Leu and Val and the aromatic amino acid, Phe, are ofteninduced by plant stress and may contribute to plant defense [30].
Mr was grown in PDB and MIN-G to assess the metabolitesproduced by hyphae under nutrient rich and nutrient limitingconditions (Table 5). The cultures were startedwith agar plugs fromMr colonies in the dikaryotic (necrotrophic) state [11]. Mr sporesgerminate and the monokaryotic hyphae quickly convert to thedikaryotic state when grown on artificial media [11]. The shift fromPDB to MIN-G resulted in a shift in specific amino acid concentra-tions without a drop in total amino acids. This shift may beexplained by protein catabolism to maintain amino acid poolsunder conditions of both carbon and nitrogen starvation [31].Growth inMIN-G resulted in an increase inmalic and fumaric acids,a fungal response to nitrogen starvation [32]. This is reasonablesince MIN-G included only 11.7 mg of nitrogen per liter and thesepools were likely depleted after two weeks of culture. Glucose andfructose pools were diminished in the MIN-G grown culturesverifying that the fungus was also experiencing carbon starvation.
Mr produced mannitol in excess of 20 mg/g mycelia dry weightin both artificial media, showing that it is an important metabolitein this species. Mannitol was detected in low concentrations inhealthy pods and at higher concentrations in infected pods(Table 1). Although mannitol can be produced by the plant, theincrease in mannitol in infected pods may be produced by Mr.Mannitol is proposed to function in fungal biology as a storagecarbohydrate, as a metabolite reducing free radicals, and asa component of spores [33]. For most of the remaining fungalmetabolites, either healthy pods had large pools which decreasedwith infection, as with glucose, malic acid, and asparagine, or thechanges due to infection were only observed 60 DAI. For trehaloseand oxalic acid, which were produced in relatively large concen-trations in Mr mycelial cultures, no changes were observed in podsdue to Mr infection.
4.2. Change in cacao gene expression in response to M. roreriinfection
Six stress related cacao ESTs (TcUSP-CAB, TcNAM-ICS, TcPR10C,TcPER1, TcNPR1, and TcGHMPK) demonstrated low level induction inresponse to Mr infection (Table 2). These responses do not lead toresistance early in the infection process, instead representinggeneral stress responses and possibly changes in development dueto infection. TcGHMPK is a putative phosphomevalonate kinase,a key enzyme of the mevalonate pathway leading to the biosyn-thesis of many natural products including compounds contributingto plant stress tolerance [34]. TcUSP-CAB is related to universalstress protein Usp in bacteria [35]. Usp is a small cytoplasmicprotein that appears to provide general stress endurance [36].TcPER-1 is related to secretory plant peroxidases implicated inhydrogen peroxide detoxification, auxin catabolism, ligninbiosynthesis, and general stress responses [14]. Pathogenesisrelated protein 10 family members, like TcPR10C, are often inducedby oxidative stress having multiple functions including ligandbinding and ribonuclease activity [37]. TcNPR1 carries ankyrinrepeats typical of NPR1 genes involved in salicylic acids signaling. Apossible alternative function for TcNPR1 is in altering pod devel-opment in response to Mr infection (i.e. malformation). Ha et al.[38] identified NPR1-like genes BLADE-ON-PETIOLE1 and 2 whichcontrol growth asymmetry in leaves and flowers. TcNAM-ICS isrelated to the family of no apical meristem (NAM) transcriptionfactors also involved in tissue development processes [35,39].
B.A. Bailey et al. / Physiological and Molecular Plant Pathology 81 (2013) 84e96 93
TcUSP-CAB and TcNAM-ICS were originally identified as beinginduced by Mp infection in cacao shoots [35].
Stress response related ESTs were induced 30 DAI (Table 3).TcODC is a putative ornithine decarboxylase which participates inpolyamine biosynthesis [18]. Polyamines are plant stress metabo-lites produced in response to abiotic and biotic stresses. TcABC-T isa putative ABC transporter which functions in the movement ofmolecules across membranes [40]. TcP59 shares homology toa family of carbohydrate oxidase encoding genes in plants thatproduce hydrogen peroxide and are important in plant defense[41]. TcPR5 encodes an osmotin-like protein associated with plantdefense and tolerance to osmotic stress [42]. TcChi4 is putativelya Class IV chitinase. Class IV chitinases are commonly induced bypathogen attack and are also associated with plant development[43]. Some of these ESTs can be considered general responses tostress since they are responsive to multiple stresses includingendophytic colonization by Trichoderma spp., as with TcP59 andTcODC [15], and drought, as with TcODC, TcABC-T, TcPR5 [18,19] Thechanges in cacao gene expression at 30 DAI are indicative of thelater stages of the biotrophic phase of the disease cycle whenhyphae are spread throughout the pods but significant resistancehas yet to be induced. Additional stress related cacao ESTs (TcCaff-CAB, TcEF, and TcLT) demonstrated differential expression at 60 DAIpossibly serving as markers for the necrotrophic phase of thedisease cycle.
Cacao ESTs associated with jasmonate, ethylene, cytokinin,and ABA biosynthesis, homeostasis, or action demonstrated lowlevel changes in expression (1.9-fold repressed to 3.6-fold induced)in response to infection by Mr. (Table 2) TcMAPKK3, an induced ESTrelated to a MAP kinase kinase, is potentially important in thejasmonate signal transduction pathway [44]. TcACS, a putative 1-aminocyclopropane-1-carboxylate synthase and potential regula-tory control point for ethylene production and TcERF-ICS, a putativeregulator of transcription [45], were both induced. TcCKeN-GT1,a putative cytokinin-N-glucosyltransferase 1, was repressed inresponse to infection while TcCrtXb, a putative zeatin O-glucosyl-transferase, was induced. Cytokinin-N-glucosyltransferase partici-pates in the irreversible inactivation of cytokinins [46]. Zeatin O-glucosyltransferase carries out glycosylation of zeatin in a reversibleprocess thought to protect zeatin from inactivation by zeatinoxidases [46]. TcPYL8 and TcPYL9, induced genes, are putative PYR1-PYL/RCAR family proteins and may function as ABA sensors [47].
By 30 DAI, induction of additional hormone associated cacaoESTs was observed in response to Mr infection (Table 3). TcOPR2 isrelated to 12-oxophytodienoate reductase 3 [48] but the functionsof the OPR1 and 2 isozymes are unknown. TcLOX1 is a putativelipoxygenase 1 that initiates the first step in JA biosynthesis, theoxygenation of a-linolenic acid to (13)-hydroperoxylinolenic acid[48]. Like TcACS, TcACC8 is a putative ACC synthase, an enzymeserving multiple functions in plant developmental and stressresponse processes [45]. TcGH3.1 putatively encodes an indole-3-acetic acid-amido synthetase which conjugates amino acids toauxin serving as a negative regulator of auxin activity [49]. TcCKeO-GT2 putatively encodes a second cytokinin-O-glucosyltransferaseas described above [46]. TcNCED1 was only induced at 30 DAI andputatively encodes a 9-cis-epoxycarotenoid dioxygenase thatparticipates in ABA biosynthesis by cleavage of epoxycarotenoids toproduce xanthoxin [50].
60 DAI additional hormone related ESTs show differentialexpression in necrotic pods (Table 3). For some of the hormones,the changes occurred in expression of genes potentially involved intheir biosynthesis or action. Examples include TcACS and TcACC8(ACC synthase) for ethylene biosynthesis, TcLOX1 and TcLOX3 (lip-oxygenase) for jasmonic acid biosynthesis, and TcPYR8 and TcPYR9(the PYR1-PYL/RCAR family proteins) for ABA action. Elevated
ethylene levels were observed in the later stages of green broomformation in response to infection by Mp [20]. M. perniciosa canproduce the plant hormones ABA, IAA, JA, and salicylic acid inculture [51]. Hormone production by Mr has not been studied.Fungal production of hormones might upset hormone balances andresult in some of the changes observed in gene expression associ-ated with maintaining hormone homeostasis as with TcCrtXb andTcCKeO-GT2 (cytokinin O-glucosyltransferase) and cytokinins andTcGH3.1 (indole-3-acetic acid-amido synthetase) with auxin.
4.3. Changes in M. roreri EST expression
A shift in fungal gene expression occurred between the mono-karyotic biotrophic phase (30 DAI) and the dikaryotic necrotrophicphases (60 DAI) of the disease cycle (Table 4). Several ESTs repressedmore than 3-fold during the shift from biotroph to necrotroph areassociated with the transcriptional and translational processes(MrTEFB, MrSRP9, MrL10bb) or associated with metabolite modifi-cation or nutrient status (MrFDH, MrNTH1, MrNRPS). Mr ESTs asso-ciated with transcriptional and translational processes are ofparticular interest since they may participate in the regulation ofother genes and gene cascades. For example, MrTEFB may bea transcriptional repressor [52] and its down regulation wouldpresumably result in the enhanced expression of genes it regulates.MrSRP9 putatively encodes a SRP9-like protein, a component of thesignal recognition particle responsible for targeting proteins to theER membrane [53]. MrL10bb is related to Mrp10, a nuclear encodedgene required for normal mitochondrial translation [54]. MrFDH isa putative formate dehydrogenase [55]. Kuan and Tien [55]proposed formate could be formed by the peroxidative oxidationof glyoxylate in the white-rot fungus Ceriporiopsis subvermispora.Formate dehydrogenase participates in the catabolism of oxalateduring the vegetative growth of C. subvermispora [56]. MrNTH1 isputatively a neutral trehalase that participates in the breakdown oftrehalose [57]. MrNRPS is a putative nonribosomal peptide synthe-tase, some of which can be virulence factors [58].
Among the Mr ESTs induced more than 3-fold by the shift frombiotroph to necrotroph (Table 4), four groups of genes based onproposed protein functions will be discussed, the first group beingsubstrate and/or toxin breakdown (MrPEP, MrID, MrOXRED,MrGMCOR, and MrP450b). The altered expression of these ESTscoincides with the release of metabolites and accelerated fungalgrowth that occurs along with tissue necrosis. Tissue necrosis likelyalso releases toxic compounds held within the cell, some beingproduced by the action of reactive oxygen species associated withcell death [59]. MrPEP is related to secreted proteinase K-likepeptidases [60]. Intradiol dioxygenases (MrID) function in the [60]breakdown of ring structures and may participate in the break-down of lignin, toxins, or other compounds [61].MrOXRED is relatedto Baeyer-Villiger monooxygenases [62], enzymes that also have thepotential for breaking down complex ring structures. Glucose-methanol-choline oxidoreductases (MrGMCOR) carry out reactionsimportant in the breakdown of simple carbohydrates, alcohols, andlignin. Some family members are involved in hydrogen peroxideproduction while others are involved in reducing toxic compounds[63]. Cytochrome p450 (MrP450b) enzymes carry out reactionscritical to the modification or degradation of complex compoundsincluding toxins [64]. As a group, these genes show some of thehighest induction levels.
ESTs MrMT, MrTTP, and MrMFS putatively encode proteinsimportant to movement of metabolites across membranes and areinduced during the shift from biotroph to necrotroph. Mono-saccharide transporters (MrMT) facilitate uptake of simple sugars[65] and can be critical to establishment of plant/microbe rela-tionships [66]. MrTTP is closely related to Hebeloma cylindrosporum
Bio
trop
hic
Phas
e (n
)
Nec
rotr
ophi
cPh
ase
(n+
n)
Reduces pod glucose and asparagine
Induces pod stress genes late
Pod hormone
homeostasisperturbed
Pod cells die
Fungal metabolitesaccumulate
Sparsethick
Intracellular mycelia
Fungal glyoxylate
cycle repressed
Theobroma cacao /Moniliophthora roreri interaction
Intensifiedpod stressresponse
Most pod metabolites
depleted
Fungal metabolitesaccumulate
Fungal glyoxylate
cycle induced
Profusedisruptive
thin mycelia
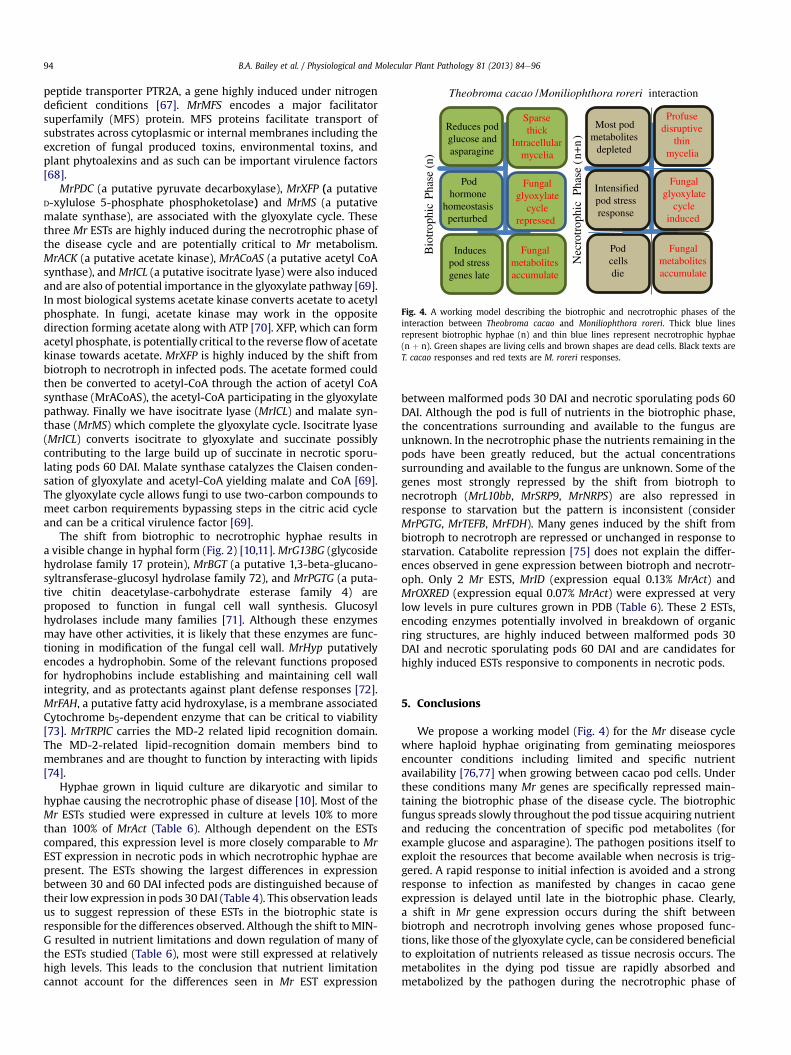
Fig. 4. A working model describing the biotrophic and necrotrophic phases of theinteraction between Theobroma cacao and Moniliophthora roreri. Thick blue linesrepresent biotrophic hyphae (n) and thin blue lines represent necrotrophic hyphae(n þ n). Green shapes are living cells and brown shapes are dead cells. Black texts areT. cacao responses and red texts are M. roreri responses.
B.A. Bailey et al. / Physiological and Molecular Plant Pathology 81 (2013) 84e9694
peptide transporter PTR2A, a gene highly induced under nitrogendeficient conditions [67]. MrMFS encodes a major facilitatorsuperfamily (MFS) protein. MFS proteins facilitate transport ofsubstrates across cytoplasmic or internal membranes including theexcretion of fungal produced toxins, environmental toxins, andplant phytoalexins and as such can be important virulence factors[68].
MrPDC (a putative pyruvate decarboxylase), MrXFP (a putativeD-xylulose 5-phosphate phosphoketolase) and MrMS (a putativemalate synthase), are associated with the glyoxylate cycle. Thesethree Mr ESTs are highly induced during the necrotrophic phase ofthe disease cycle and are potentially critical to Mr metabolism.MrACK (a putative acetate kinase), MrACoAS (a putative acetyl CoAsynthase), andMrICL (a putative isocitrate lyase) were also inducedand are also of potential importance in the glyoxylate pathway [69].In most biological systems acetate kinase converts acetate to acetylphosphate. In fungi, acetate kinase may work in the oppositedirection forming acetate along with ATP [70]. XFP, which can formacetyl phosphate, is potentially critical to the reverse flow of acetatekinase towards acetate. MrXFP is highly induced by the shift frombiotroph to necrotroph in infected pods. The acetate formed couldthen be converted to acetyl-CoA through the action of acetyl CoAsynthase (MrACoAS), the acetyl-CoA participating in the glyoxylatepathway. Finally we have isocitrate lyase (MrICL) and malate syn-thase (MrMS) which complete the glyoxylate cycle. Isocitrate lyase(MrICL) converts isocitrate to glyoxylate and succinate possiblycontributing to the large build up of succinate in necrotic sporu-lating pods 60 DAI. Malate synthase catalyzes the Claisen conden-sation of glyoxylate and acetyl-CoA yielding malate and CoA [69].The glyoxylate cycle allows fungi to use two-carbon compounds tomeet carbon requirements bypassing steps in the citric acid cycleand can be a critical virulence factor [69].
The shift from biotrophic to necrotrophic hyphae results ina visible change in hyphal form (Fig. 2) [10,11]. MrG13BG (glycosidehydrolase family 17 protein), MrBGT (a putative 1,3-beta-glucano-syltransferase-glucosyl hydrolase family 72), and MrPGTG (a puta-tive chitin deacetylase-carbohydrate esterase family 4) areproposed to function in fungal cell wall synthesis. Glucosylhydrolases include many families [71]. Although these enzymesmay have other activities, it is likely that these enzymes are func-tioning in modification of the fungal cell wall. MrHyp putativelyencodes a hydrophobin. Some of the relevant functions proposedfor hydrophobins include establishing and maintaining cell wallintegrity, and as protectants against plant defense responses [72].MrFAH, a putative fatty acid hydroxylase, is a membrane associatedCytochrome b5-dependent enzyme that can be critical to viability[73]. MrTRPIC carries the MD-2 related lipid recognition domain.The MD-2-related lipid-recognition domain members bind tomembranes and are thought to function by interacting with lipids[74].
Hyphae grown in liquid culture are dikaryotic and similar tohyphae causing the necrotrophic phase of disease [10]. Most of theMr ESTs studied were expressed in culture at levels 10% to morethan 100% of MrAct (Table 6). Although dependent on the ESTscompared, this expression level is more closely comparable to MrEST expression in necrotic pods in which necrotrophic hyphae arepresent. The ESTs showing the largest differences in expressionbetween 30 and 60 DAI infected pods are distinguished because oftheir low expression in pods 30 DAI (Table 4). This observation leadsus to suggest repression of these ESTs in the biotrophic state isresponsible for the differences observed. Although the shift toMIN-G resulted in nutrient limitations and down regulation of many ofthe ESTs studied (Table 6), most were still expressed at relativelyhigh levels. This leads to the conclusion that nutrient limitationcannot account for the differences seen in Mr EST expression
between malformed pods 30 DAI and necrotic sporulating pods 60DAI. Although the pod is full of nutrients in the biotrophic phase,the concentrations surrounding and available to the fungus areunknown. In the necrotrophic phase the nutrients remaining in thepods have been greatly reduced, but the actual concentrationssurrounding and available to the fungus are unknown. Some of thegenes most strongly repressed by the shift from biotroph tonecrotroph (MrL10bb, MrSRP9, MrNRPS) are also repressed inresponse to starvation but the pattern is inconsistent (considerMrPGTG, MrTEFB, MrFDH). Many genes induced by the shift frombiotroph to necrotroph are repressed or unchanged in response tostarvation. Catabolite repression [75] does not explain the differ-ences observed in gene expression between biotroph and necrotr-oph. Only 2 Mr ESTS, MrID (expression equal 0.13% MrAct) andMrOXRED (expression equal 0.07% MrAct) were expressed at verylow levels in pure cultures grown in PDB (Table 6). These 2 ESTs,encoding enzymes potentially involved in breakdown of organicring structures, are highly induced between malformed pods 30DAI and necrotic sporulating pods 60 DAI and are candidates forhighly induced ESTs responsive to components in necrotic pods.
5. Conclusions
We propose a working model (Fig. 4) for the Mr disease cyclewhere haploid hyphae originating from geminating meiosporesencounter conditions including limited and specific nutrientavailability [76,77] when growing between cacao pod cells. Underthese conditions many Mr genes are specifically repressed main-taining the biotrophic phase of the disease cycle. The biotrophicfungus spreads slowly throughout the pod tissue acquiring nutrientand reducing the concentration of specific pod metabolites (forexample glucose and asparagine). The pathogen positions itself toexploit the resources that become available when necrosis is trig-gered. A rapid response to initial infection is avoided and a strongresponse to infection as manifested by changes in cacao geneexpression is delayed until late in the biotrophic phase. Clearly,a shift in Mr gene expression occurs during the shift betweenbiotroph and necrotroph involving genes whose proposed func-tions, like those of the glyoxylate cycle, can be considered beneficialto exploitation of nutrients released as tissue necrosis occurs. Themetabolites in the dying pod tissue are rapidly absorbed andmetabolized by the pathogen during the necrotrophic phase of
B.A. Bailey et al. / Physiological and Molecular Plant Pathology 81 (2013) 84e96 95
the disease cycle and sporulation proceeds without delay. Onlya limited subset of the ESTs we studied are regulated by specific podfactors with most of the changes observed in pods being associatedwith the shift from biotroph to necrotroph. The trigger determiningthe shift between biotroph and necrotroph is unknown but, thecandidates include developmental signals from the pod or quorumsensing by the fungus [78]. It is also unknown if the change innuclear state is a response to nutrient availability or if the shift innuclear state and resulting change in gene expression is responsiblefor the necrosis resulting in a change in nutrient availability.
Acknowledgments
This work was funded by USDA ARS. References to a companyand/or product by the USDA are only for the purposes of informa-tion and do not imply approval or recommendation of the productto the exclusion of others that may also be suitable. The U.S.Department of Agriculture (USDA) prohibits discrimination in all itsprograms and activities on the basis of race, color, national origin,age, disability, and where applicable, sex, marital status, familialstatus, parental status, religion, sexual orientation, genetic infor-mation, political beliefs, reprisal, or because all or part of an indi-vidual’s income is derived from any public assistance program. (Notall prohibited bases apply to all programs.) Persons with disabilitieswho require alternative means for communication of programinformation (Braille, large print, audiotape, etc.) should contactUSDA’s TARGET Center at (202) 720-2600 (voice and TDD). To filea complaint of discrimination, write to USDA, Director, Office ofCivil Rights, 1400 Independence Avenue, S.W., Washington, D.C.20250-9410, or call (800) 795-3272 (voice) or (202) 720-6382(TDD). USDA is an equal opportunity provider and employer.
Appendix A. Supplementary data
Supplementary data related to this article can be found athttp://dx.doi.org/10.1016/j.pmpp.2012.11.005.
References
[1] Evans HC. Cacao diseasesdthe trilogy revisited. Phytopathology 2007;97:1640e3.
[2] Phillips-Mora W, Aime MC, Wilkinson MJ. Biodiversity and biogeography ofthe cacao (Theobroma cacao) pathogen Moniliophthora roreri in tropicalAmerica. Plant Pathol 2007;56:911e22.
[3] Wood G, Lass R. Cocoa. Oxford, UK: Blackwell Science Ltd.; 2001.[4] Evans HC, Stalpers JA, Samson RA, Benny GL. On the taxonomy of Monilia
roreri, an important pathogen of Theobroma cacao in South America. Can J Bot1978;56:2528e32.
[5] Evans HC, Holmes KA, Reid AP. Phylogeny of the frosty pod rot pathogen ofcocoa. Plant Pathol 2003;52:476e85.
[6] Aime MC, Phillips-Mora W. The causal agents of witches’ broom and frostypod rot of cacao (chocolate, Theobroma cacao) form a new lineage of Mar-asmiaceae. Mycologia 2005;97:1012e22.
[7] Meinhardt L, Rincones J, Bailey B, Aime M, Griffith G, Zhang D, et al. Mon-iliophthora perniciosa, the causal agent of witches’ broom disease of cacao:what’s new from this old foe? Mol Plant Pathol 2008;9:577e88.
[8] Rice RA, Greenberg R. Cacao cultivation and the conservation of biologicaldiversity. AMBIO 2000;29:167e73.
[9] Phillipps-Mora W. The cacao breeding program at CATIE, Costa Rica. The 18thplant and animal genome conference. San Diego, California; 2010. p. 115.
[10] Evans HC. Pod rot of cacao caused by Moniliophthora (Monilia) roreri.Phytopathological Papers. Kew: Commonwealth Mycological Institute;1981. p. 1e44.
[11] Evans HC, Holmes KA, Phillips W, Wilkinson MJ. What’s in a name: Crinipellis,the final resting place for the frosty pod rot pathogen of cocoa? Mycologist2002;16:148e52.
[12] Krauss U, Hidalgo E, Bateman R, Adonijah V, Arroyo C, García J, et al.Improving the formulation and timing of application of endophytic biocontroland chemical agents against frosty pod rot (Moniliophthora roreri) in cocoa(Theobroma cacao). Biol Control 2010;54:230e40.
[13] Melnick R, Marelli J-P, Sicher R, Strem M, Bailey B. The interaction of Theo-broma cacao and Moniliophthora perniciosa, the causal agent of witches’broom disease, during parthenocarpy. Tree Genet Genomes 2012:1e19.
[14] Bailey B, Strem M, Bae H, de Mayolo G, Guiltinan M. Gene expression in leavesof Theobroma cacao in response to mechanical wounding, ethylene, and/ormethyl jasmonate. Plant Sci 2005;168:1247e58.
[15] Bailey BA, Bae H, StremMD, Roberts DP, Thomas SE, Crozier J, et al. Fungal andplant gene expression during the colonization of cacao seedlings by endo-phytic isolates of four Trichoderma species. Planta 2006;224:1449e64.
[16] Argout X, Fouet O, Wincker P, Gramacho K, Legavre T, Sabau X, et al. Towardsthe understanding of the cocoa transcriptome: production and analysis of anexhaustive dataset of ESTs of Theobroma cacao L. generated from varioustissues and under various conditions. BMC Genomics 2008;9:512.
[17] Argout X, Salse J, Aury J-M, Guiltinan MJ, Droc G, Gouzy J, et al. The genome ofTheobroma cacao. Nat Genet 2011;43:101e8.
[18] Bae H, Kim S-H, Kim MS, Sicher RC, Lary D, Strem MD, et al. The droughtresponse of Theobroma cacao (cacao) and the regulation of genes involved inpolyamine biosynthesis by drought and other stresses. Plant Physiol Biochem2008;46:174e88.
[19] Bae H, Sicher RC, Kim MS, Kim S-H, Strem MD, Melnick RL, et al. The beneficialendophyte Trichoderma hamatum isolate DIS 219b promotes growth anddelays the onset of the drought response in Theobroma cacao. J Exp Bot 2009;60:3279e95.
[20] Scarpari LM, Meinhardt LW, Mazzafera P, Pomella AWV, Schiavinato MA,Cascardo JCM, et al. Biochemical changes during the development of witches’broom: the most important disease of cocoa in Brazil caused by Crinipellisperniciosa. J Exp Bot 2005;56:865e77.
[21] Verica JA, Maximova SN, Strem MD, Carlson JE, Bailey BA, Guiltinan MJ.Isolation of ESTs from cacao (Theobroma cacao L.) leaves treated with inducersof the defense response. Plant Cell Rep 2004;23:404e13.
[22] Rieu I, Powers SJ. Real-time quantitative RT-PCR: design, calculations, andstatistics. Plant Cell 2009;21:1031e3.
[23] Leal GA, Gomes LH, Albuquerque PSB, Tavares FCA, Figueira A. Searching forMoniliophthora perniciosa pathogenicity genes. Fungal Biol 2010;114:842e54.
[24] Rincones J, Scarpari L, Carazzolle M, Mondego J, Formighieri E, Barau J, et al.Differential gene expression between the biotrophic-like and saprotrophicmycelia of the witches’ broom pathogen Moniliophthora perniciosa. Mol PlantMicrobe Interact 2008;21:891e908.
[25] Perfect SE, Green JR. Infection structures of biotrophic and hemibiotrophicfungal plant pathogens. Mol Plant Pathol 2001;2:101e8.
[26] Stoop JMH, Williamson JD, Pharr Mason D. Mannitol metabolism in plants:a method for coping with stress. Trends Plant Sci 1996;1:139e44.
[27] Dervartanian DV, Veeger C. Studies on succinate dehydrogenase: I. Spectralproperties of the purified enzyme and formation of enzyme-competitiveinhibitor complexes. Biochim Biophys Acta 1964;92:233e47.
[28] Singh D, Chen S. The white-rot fungus Phanerochaete chrysosporium: condi-tions for the production of lignin-degrading enzymes. Appl Microbiol Bio-technol 2008;81:399e417.
[29] Higuchi T. Lignin biochemistry: biosynthesis and biodegradation. Wood SciTechnol 1990;24:23e63.
[30] Iriti M, Rossoni M, Borgo M, Ferrara L, Faoro F. Induction of resistance to graymold with benzothiadiazole modifies amino acid profile and increasesproanthocyanidins in grape: primary versus secondary metabolism. J AgricFood Chem 2005;53:9133e9.
[31] Yang Z, Huang J, Geng J, Nair U, Klionsky DJ. Atg22 recycles amino acidstolLink the degradative and recycling functions of autophagy. Mol Biol Cell2006;17:5094e104.
[32] Goldberg I, Rokem JS, Pines O. Organic acids: old metabolites, new themes.J ChemTechnol Biotechnol 2006;81:1601e11.
[33] Solomon PS, Waters ODC, Oliver RP. Decoding the mannitol enigma in fila-mentous fungi. Trends Microbiol 2007;15:257e62.
[34] Simkin A, Guirimand G, Papon N, Courdavault V, Thabet I, Ginis O, et al.Peroxisomal localisation of the final steps of the mevalonic acid pathway inplanta. Planta 2011;234:903e14.
[35] Leal GA, Albuquerque PSB, Figueira A. Genes differentially expressed in The-obroma cacao associated with resistance to witches’ broom disease caused byCrinipellis perniciosa. Mol Plant Pathol 2007;8:279e92.
[36] Nachin L, Nannmark U, Nyström T. Differential roles of the universal stressproteins of Escherichia coli in oxidative stress resistance, adhesion, andmotility. J Bacteriol 2005;187:6265e72.
[37] Liu J-J, Ekramoddoullah AKM. The family 10 of plant pathogenesis-relatedproteins: their structure, regulation, and function in response to biotic andabiotic stresses. Physiol Mol Plant Pathol 2006;68:3e13.
[38] Ha CM, Jun JH, Nam HG, Fletcher JC. BLADE-ON-PETIOLE1 and 2 control Ara-bidopsis lateral organ fate through regulation of LOB domain and adaxial-abaxial polarity genes. Plant Cell 2007;19:1809e25.
[39] Yamaguchi M, Ohtani M, Mitsuda N, Kubo M, Ohme-Takagi M, Fukuda H, et al.VND-INTERACTING2, a NAC domain transcription factor, negatively regulatesxylem vessel formation in Arabidopsis. Plant Cell 2010;22:1249e63.
[40] Jasinski M, Ducos E, Martinoia E, Boutry M. The ATP-binding cassette trans-porters: structure, function, and gene family comparison between rice andArabidopsis. Plant Physiol 2003;131:1169e77.
[41] Carter CJ, Thornburg RW. Tobacco nectarin V is a flavin-containing berberinebridge enzyme-like protein with glucose oxidase activity. Plant Physiol 2004;134:460e9.
[42] D’Angeli S, Altamura M. Osmotin induces cold protection in olive trees byaffecting programmed cell death and cytoskeleton organization. Planta 2007;225:1147e63.
B.A. Bailey et al. / Physiological and Molecular Plant Pathology 81 (2013) 84e9696
[43] de A Gerhardt LB, Sachetto-Martins G, Contarini MG, Sandroni M, de P.Ferreira R, de Lima VM, et al. Arabidopsis thaliana class IV chitinase is earlyinduced during the interaction with Xanthomonas campestris. FEBS Lett 1997;419:69e75.
[44] Takahashi F, Yoshida R, Ichimura K, Mizoguchi T, Seo S, Yonezawa M, et al. Themitogen-activated protein kinase cascade MKK3-MPK6 is an important part ofthe jasmonate signal transduction pathway in Arabidopsis. Plant Cell 2007;19:805e18.
[45] Lin Z, Zhong S, Grierson D. Recent advances in ethylene research. J Exp Bot2009;60:3311e36.
[46] Wang J, Ma X-M, Kojima M, Sakakibara H, Hou B- K. N-GlucosyltransferaseUGT76C2 is involved in cytokinin homeostasis and cytokinin response inArabidopsis thaliana. Plant Cell Physiol 2011;52:2200e13.
[47] Guo J, Yang X, Weston DJ, Chen J- G. Abscisic acid receptors: past, present andfuture. J Int Plant Biol 2011;53:469e79.
[48] Wasternack C. Jasmonates: an update on biosynthesis, signal transduction andaction in plant stress response, growth and development. Ann Bot 2007;100:681e97.
[49] Böttcher C, Keyzers RA, Boss PK, Davies C. Sequestration of auxin by theindole-3-acetic acid-amido synthetase GH3-1 in grape berry (Vitis vinifera L.)and the proposed role of auxin conjugation during ripening. J Exp Bot 2010;61:3615e25.
[50] Taylor IB, Burbidge A, Thompson AJ. Control of abscisic acid synthesis. J ExpBot 2000;51:1563e74.
[51] Kilaru A, Bailey BA, Hasenstein KH. Moniliophthora perniciosa produceshormones and alters endogenous auxin and salicylic acid in infected cocoaleaves. FEMS Microbiol Lett 2007;274:238e44.
[52] Perez-Torrado R, Yamada D, Defossez P- A. Born to bind: the BTB proteineprotein interaction domain. BioEssays 2006;28:1194e202.
[53] Rosenblad M, Zwieb C, Samuelsson T. Identification and comparative analysisof components from the signal recognition particle in protozoa and fungi.BMC Genomics 2004;5:5.
[54] JinC,MyersAM, Tzagoloff A. Cloning and characterization ofMRP10, a yeast genecoding for a mitochondrial ribosomal protein. Curr Genet 1997;31:228e34.
[55] Kuan IC, Tien M. Glyoxylate-supported reactions catalyzed by Mn peroxidaseof Phanerochaete chrysosporium: activity in the absence of added hydrogenperoxide. Arch Biochem Biophys 1993;302:447e54.
[56] Watanabe T, Hattori T, Tengku S, Shimada M. Purification and characterizationof NAD-dependent formate dehydrogenase from the white-rot fungus Cer-iporiopsis subvermispora and a possible role of the enzyme in oxalatemetabolism. Enzyme Microb Techn 2005;37:68e75.
[57] Foster AJ, Jenkinson JM, Talbot NJ. Trehalose synthesis and metabolism arerequired at different stages of plant infection by Magnaporthe grisea. EMBO J2003;22:225e35.
[58] Lee B-N, Kroken S, Chou DYT, Robbertse B, Yoder OC, Turgeon BG. Functionalanalysis of all nonribosomal peptide synthetases in Cochliobolus hetero-strophus reveals a factor, NPS6, involved in virulence and resistance tooxidative stress. Eukaryot Cell 2005;4:545e55.
[59] Van Breusegem F, Dat JF. Reactive oxygen species in plant cell death. PlantPhysiol 2006;141:384e90.
[60] Siezen RJ, Leunissen JAM. Subtilases: the superfamily of subtilisin-like serineproteases. Protein Sci 1997;6:501e23.
[61] Michalowicz J, Duda W. Phenols transformations in the environment andliving organisms. Curr Top Biophys 2007;30:24e36.
[62] Kamerbeek NM, Janssen DB, van Berkel WJH, Fraaije MW. BaeyereVilligerMonooxygenases, an emerging family of flavin-dependent biocatalysts. AdvSynth Catal 2003;345:667e78.
[63] Cavener DR. GMC oxidoreductases: a newly defined family of homologousproteins with diverse catalytic activities. J Mol Biol 1992;223:811e4.
[64] �Cre�snar B, Petri�c �S. Cytochrome P450 enzymes in the fungal kingdom. BiochimBiophys Acta 2011;1814:29e35.
[65] Nehls U, Wiese J, Guttenberger M, Hampp R. Carbon allocation in ectomy-corrhizas: identification and expression analysis of an Amanita muscariamonosaccharide transporter. Mol Plant Microbe Interact 1998;11:167e76.
[66] Helber N, Wippel K, Sauer N, Schaarschmidt S, Hause B, Requena N. A versatilemonosaccharide transporter that operates in the arbuscular mycorrhizalfungus Glomus sp. is crucial for the symbiotic relationship with plants. PlantCell 2011;23:3812e23.
[67] Müller T, Avolio M, Olivi M, Benjdia M, Rikirsch E, Kasaras A, et al. Nitrogentransport in the ectomycorrhiza association: the Hebeloma cylindrosporume
Pinus pinaster model. Phytochem 2007;68:41e51.[68] Stergiopoulos I, Zwiers L-H, De Waard MA. Secretion of natural and synthetic
toxic compounds from filamentous fungi by membrane transporters of theATP-binding cassette and major facilitator superfamily. Eur J Plant Pathol2002;108:719e34.
[69] Dunn MF, Ramírez-Trujillo JA, Hernández-Lucas I. Major roles of isocitratelyase and malate synthase in bacterial and fungal pathogenesis. Microbiol2009;155:3166e75.
[70] Ingram-Smith C, Martin SR, Smith KS. Acetate kinase: not just a bacterialenzyme. Trends Microbiol 2006;14:249e53.
[71] Mouyna I, Monod M, Fontaine T, Henrissat B, Léchenne B, Latgé JP. Identifi-cation of the catalytic residues of the first family of beta(1-3)glucanosyltransferases identified in fungi. Biochem J 2000;347:741e7.
[72] Mankel A, Krause K, Kothe E. Identification of a hydrophobin gene that isdevelopmentally regulated in the ectomycorrhizal fungus Trichoderma ter-reum. Appl Environ Microbiol 2002;68:1408e13.
[73] Ternes P, Wobbe T, Schwarz M, Albrecht S, Feussner K, Riezman I, et al. Twopathways of sphingolipid biosynthesis are separated in the yeast Pichia pas-toris. J Biol Chem 2011;286:11401e14.
[74] Inohara N, Nuñez G. ML e a conserved domain involved in innate immunityand lipid metabolism. Trends Biochem Sci 2002;27:219e21.
[75] Portnoy T, Margeot A, Linke R, Atanasova L, Fekete E, Sandor E, et al. The CRE1carbon catabolite repressor of the fungus Trichoderma reesei: a master regu-lator of carbon assimilation. BMC Genomics 2011;12:269.
[76] Meinhardt LW, Bellato CM, Rincones J, Azevedo RA, Cascardo JCM,Pereira GAG. In vitro production of biotrophic-like cultures of Crinipellis per-niciosa, the casual agent of witches’ broom disease of Theobroma cacao. CurrMicrobiol 2006;52:191e6.
[77] Mondego J, Carazzolle M, Costa G, Formighieri E, Parizzi L, Rincones J, et al.A genome survey of Moniliophthora perniciosa gives new insights intoWitches’ Broom Disease of cacao. BMC Genomics 2008;9:548.
[78] Newton AC, Fitt BDL, Atkins SD, Walters DR, Daniell TJ. Pathogenesis, para-sitism and mutualism in the trophic space of microbeeplant interactions.Trends Microbiol 2010;18:365e73.