physics impacts to plasma wave thruster design
TRANSCRIPT

Physics Impacts to Plasma Wave Thruster Design
James Gilland
Ohio Aerospace Ins4tute
MIPSE Seminar, Univ. Of Michigan
November 3, 2021

RF thruster advantages• Electrodeless
– Potential for long life– Multiple propellants (if coupled to
electrons)– Quasineutral plasma – no neutralizer
• Rf thruster concepts– Phase Four – Inductive (www.phasefour.io/maxwell/)
– ThrustMe – Capacitive (gridded) www.thrustme.fr/products/npt300
– Universidad Carlos III de Madrid – “Helicon” (ep2.uc3m.es/#projects)
– ONERA – ECR –Minotor (www.minotor-project.eu/overview/ecra-technology-3)
– Momentus – Microwave thermal(cr. Momentus Ardoride)
– VASIMR – Helicon/Ion cyclotron (www.adastrarocket.com/home/)

ASPECTS OF RF WAVE THRUSTERS• Helicon wave source example
• Wave coupling– Dispersion and antennae
• Ioniza4on– Collisionless vs. collisions– Density limits
• Thruster Impacts from wave coupling– Thruster size vs. wave coupling– ”Double layers”

Plasma waves in thrusters• A ”zoo” of possible waves can propagate under the
right condi;ons• Not every rf thruster is a plasma wave thruster• Let’s consider the helicon wave as an example:
– Propagation in applied magnetic field– Same regime as whistler waves:
• Wi << WLH << w << We
• Waves couple to electrons– Species independent
– For w > We/2, the helicon wave becomes the “electron cyclotron wave”
”Typical” Helicon Source(Univ. of Wisconsin Phaedrus source)

11/3/21 6
The Phaedrus helicon experiment
1 kW rf supply2 kW rf supply
140 GHz interferometer
Langmuir probe
PUMp
Pressure tube
BFieldCoils

11/3/21 7
Helicon source operating conditions
• Steady state operation to allow pressure equilibration• 5-30 mtorr base pressure• 300 - 800 W continuous rf Power at 13.56 MHz• 1-3 kW pulsed (50 ms) rf power, variable frequency (13.56 MHz
currently)• Uniform Axial Field
– 500 - 1250 Gauss• Argon Plasma• 4 Antenna Options• Diagnostics
– Langmuir Probe - plasma profiles– Magnetic Field Probe to measure helicon wave B fields – Capacitive Manometer located at end of 1m Pyrex (9mm ID) pressure
sampling tube– 140 GHz Microwave Interferometer to remotely measure line-averaged
density
L

11/3/21 8
Steady state helicon plasma profiles
0
2
4
6
8
10
12
14
-5 -4 -3 -2 -1 0 1 2 3 4 5
Radius (cm)
UncuspedCuspedUncuspedCusped
0
1
2
3
4
5
6
7
-5 -4 -3 -2 -1 0 1 2 3 4 5
T e(e
V)
Radius (cm)
UncuspedCuspedUncusped
n e10
18m
-3
T eeV

11/3/21 9
Peak steady state helicon plasma density
0
0.5
1
1.5
2
2.5
3
0 100 200 300 400 500 600 700 800 900 1000
RF Power (Watts)
n e10
19m-3

11/3/21 10
Ionization reduces neutral pressure to ~10% of initial value
00.20.40.60.8
1
0 20 40 60 80 100 120Rela
tive P
ressu
re
z(cm)
600 W400 W

Observations from helicon sources
• Density does not con4nue to increase with power
• Some antennae work beQer than others (observed in mul4ple sources)
• Strong decrease in neutral pressure during plasma opera4on
• How do these effects impact source/thruster design?
Plasma Wave Dispersion

Impact of the dispersion on plasma parameters
• Dispersion rela-on defines wavelengths in plasma– kz, k⟂ are related through w, density (wpe or ne), applied magnetic
field (Wce or B)– Cold plasma dispersion relation (! = !!$̂ ̂)– Neglects ion motion (w>>Wci )
! = 1 − %!"#%# − Ω$"#
' = − %!"# Ω$"%(%# − Ω$"# )
* = 1 − %!"#
%#
! − +%# −,' +%+&,' ! − +# 0+%+& 0 * − +&#
+ = %. /%!"# = ' (!
)" *#Ω$"# =( +)"
. = 212

Dispersion and plasma characteristics
• Frequency, density contours with wavelength
• Calculated from dispersion for a fixed k⟂
1020 m-3
Narrow Source, high k⟂
1017 m-3
3 = %Ω$"

Antenna coupling to plasma wave
• Antenna spectra has to match plasma wavelength for the desired density and B field
• At high density, kz is high (length is short)
0
2
4
6
8
10
12
14
16
18
5 15 25 35 45 55 65 75 85 95
Elec
tric
Fiel
d (V
/m)
kz (m-1)
L=18 cmL=5 cm
kz foroptimum
ionization;also
ne~ 1.2 x 10¹⁹ m-3
kz for ne~ 5x 10¹⁹ m-3
L

Plasma Generation/Ionization

Wave ionization processes! Several possible mechanisms for wave absorp;on
have been proposed:!Coulomb Collisions
! at 3 eV, 1013 cm-3, nei ~ 30 MHz!Collisionless
!Landau damping (F.F. Chen)! w = k v! (w/k)2 ~ maximum energy for electron-neutral cross-section (~ 80
eV)! k determined by antenna length (l=2L)
! Peak damping at z ~ 1!Near field effects (Ellingboe, Borg)
! Acceleration of electrons in phase with near fields! Helicon phase velocity couples to electrons at peak in ionization
cross section
νLD = 2 πωζ3 e−ζ2; ζ=
ω
k& '
( )
m2Te

Compare Ionization, Depletion, and Dispersion Effects
• Dispersion rela4on indicates:– Increasing density requires decreasing
wavelength• Ioniza4on processes indicates:
– Wavelength dependence for collisionlessheating
– Limit based on neutral depletion• Examine these effects experimentally and
theore4cally

Experiment
• Helicon source with two antennae:– Longer antenna for initial plasma
generation– Shorter antenna for higher density
coupling• Higher power to short antenna to
address par;cle and power balance• Two antennae operated 1 MHz apart
to differen;ate waves
117
0.05 0.1 0.15 0.2t !s"
1
2
3
4
5
ForwardPower!W"
Figure 52. Total forward power input for maximum pulsed power experimentaloperating conditions.
Results
Equations 37-39 were solved simultaneously starting with initial conditions of the
pre-discharge neutral pressure, a low “seed” electron density of 105 m-3 (the solution is
not sensitive to the initial conditions), and an initial electron temperature of .025 eV.
Solutions were obtained over a range of initial fill pressures from 5 to 50 mTorr and
pulsed power levels from 0 to 3 kW. The power level was changed by changing the
magnitude of the forward power pulse waveform while maintaining the shape. The
solutions were solved numerically using Mathematica v. 4.2. The results of the
calculations are shown in Figure 53 and Figure 54. Figure 53 shows the change in the
discharge for a fixed initial fill pressure of 50 mTorr, a long(.2 millisecond) 1 kW rf pulse
and varying secondary rf pulses of 0 to 3 kW. Figure 54 shows the effect of changing the
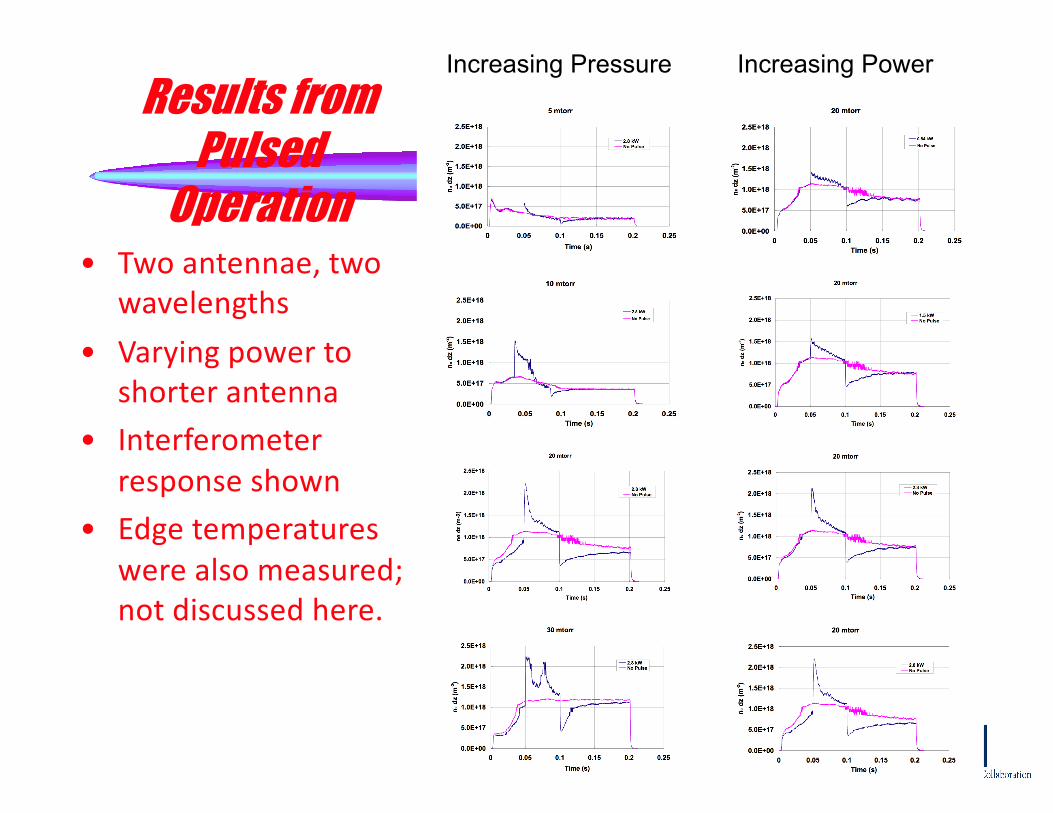
Results fromPulsed
Operation• Two antennae, two
wavelengths
• Varying power to shorter antenna
• Interferometer response shown
• Edge temperatures were also measured; not discussed here.
Figure 5. Line-averaged
density behavior for
increasing pressure.
Figure 6. Line averaged
density for increasing pulsed
power.
Increasing Pressure Increasing Power

Trends of pulsed power• Note that the shorter antenna was unable
to start a high density plasma by itself (also seen by other researchers)
• Higher power pulses (at fixed pressure) do result in increased density but peak density decays
• High neutral pressure allows for density increases – relaxa4on oscilla4ons occur at highest pressures

11/3/21 22
Transient Neutral Pumping Model Developed for Helicon Source
• Coupled electron, neutral, and energy balance equa;ons– 0 space dimensions– rf power input taken from measured forward power– Ionization terms
• First ionization from electron impact• Second ionization of neutral• Second ionization of ion
– Includes helicon near-field ionization term from Degeling et al. – trapped electrons

11/3/21 23
Inputs used in model
– s01 = first ionization – s12 = first - second ionization– s02 = neutral - second ionization
• Forward power measured at 3 kW forward power
• Pulse shape used with varying magnitude for different input power values
• Zero-D Plasma, electron, and power balance
• Coupling:– Non-linear trapped electrons related
to phase velocity – at low density– Collisional ionization at high
densities

11/3/21 24
Model Results
1. Increasing Power
2. Increasing Pressure

11/3/21 25
Power
Increasing
50 mTorr
0.3 kW
1 kW
2 kW
3 kW

11/3/21 26
Pressure
Increasing
3 kW
5 mTorr
10 mTorr
20 mTorr
30 mTorr

Extension of Model to Double Layers
• Double layer:– High energy beam of one species
(electrons)– Conservation of charge leads to potential
accelerating of second species (ions)– Examine trends for potential formation,
degree of trapped electron beam with magnetic field, density

Low pressure/Low Field• 0.015 T, 10 mTorr
• Induced Poten4al ~ 90 V
• Density < 1018 m-3
• Trapped Current, total current – Trapped dominated

Low Pressure/High Field• 0.1 T, 10 mTorr
• Induced Potential ~ 0.3 V
• Density ~ 4x 10¹⁸ m-3
• Trapped Current, total current – Bohm dominated

High Pressure/Low Field• 0.015 T, 80 mTorr
• Induced Poten4al ~ 25 V
• Density ~ 2 x 10¹⁸ m-3
• Trapped Current, total current – Trapped dominated

High Pressure/High Field• 0.1 T, 80 mTorr
• Induced Poten4al ~ 0.0 V
• Density ~ 6 x 10¹⁸ m-3
• Trapped Current, total current – Bohm dominated

Predicted conditions for Ambipolar Acceleration
• Ambipolar accelera4on (independent of magne4c field expansion) may be possible in an helicon source under certain condi4ons– Low field– Low density– Drives collisionless wave coupling, which is
also more sensitive to wavelength

Implications for Wave Based Sources
• Plasma generation and possible acceleration mechanisms are interconnected– Density is limited most strongly by neutral
depletion– Wavelength, collisionality drive coupling,
ambipolarity– Collisionless vs. Collisional operation will
drive source propulsive capabilities

Questions