plasma wave receivers for scientific satellites
TRANSCRIPT

An Introduction to Space Instrumentation,Edited by K. Oyama and C. Z. Cheng, 227–237.
Plasma wave receivers for scientific satellites
H. Kojima
Research Institute for Sustainable Humanosphere, Kyoto University, Gokasho, Uji, Kyoto 611-0011, Japan
The design of plasma wave receivers for use onboard scientific satellites is introduced. Since space plasmasare collisionless, kinetic energy is transferred via plasma waves. The role of plasma wave receivers is to revealwave-particle interactions in space plasma. Conventional plasma wave receivers are classified into three types:multichannel analyzers, sweep frequency analyzers, and waveform capture. Each one has their own advantagesand disadvantages and thus they complement each other. The present paper provides guidelines for designingplasma wave receivers by referring to examples from representative science missions. Furthermore, the prospectsof using plasma wave receivers in future missions are discussed. The mass and size requirements for onboardinstruments can be satisfied by developing small receivers. Extremely small plasma wave receivers can beachieved using analog application-specific integrated circuit(ASIC) technology. We also introduce our recentprogress in developing a chip that implements the necessary analog components of plasma wave receivers.Key words: Plasma wave, collisionless plasma, plasma wave receiver, analog ASIC.
1. IntroductionSince space plasmas are collisionless, their kinetic ener-
gies are exchanged and transferred via plasma waves. It isthus essential to perform measurements on plasma waves tounderstand the physical processes that occur in space plas-mas. Consequently, many scientific satellites carry plasmawave receivers.
Figure 1 shows a typical frequency-time spectrogram ofplasma waves observed by the plasma wave receiver on-board the Geotail spacecraft in the geomagnetic tail region.The upper and lower panels respectively show the elec-tric and magnetic field components of the observed plasmawaves. The color scale indicates the spectral intensity. Rep-resentative spectra are labeled in this figure, namely Broad-band Electrostatic Noise (BEN), Auroral Kilometric Radi-ation (AKR), and Magnetic Noise Burst (MNB). Discus-sion of the detailed features of the plasma waves in Fig. 1and their generation mechanisms is beyond the scope of thepresent paper. Matsumoto et al. (1998) have reviewed theplasma waves observed by the Geotail spacecraft.
Historically, the first plasma wave observations fromsatellites were conducted by Vanguard 3 (Cain et al., 1961),Lofti 1 (Leiphart, 1962) and Alouette 1 (Barrington andBelrose, 1963). Since these satellites focused on character-izing so-called ‘whistlers’, they employed coil or loop an-tennas as plasma wave sensors. Plasma wave observationswere initiated just after the successful launch of Sputnik 1in 1958. This means that the importance of plasma wavemeasurements was generally understood from the dawn ofspace physics.
Gurnett and O’Brien (1964) pointed out that satelliteplasma wave observations have several advantages overground-based observations in the view point of observingwhistler waves. We additionally describe several objectivesand several advantages of satellite-based plasma wave ob-
Copyright c© TERRAPUB, 2013.
servations as follows:
1) In situ observations of plasma waves reveal localwave-particle interactions. In particular, in situ ob-servations are crucial since electrostatic waves do notpropagate.
2) Plasma waves are sensitive to changes in the plasmaenvironment. A specific wave-particle interactioncorresponds to the excitation of a particular mode;this permits physical processes to be identified fromplasma wave signatures.
3) Plasma wave receivers generally have higher time res-olutions than other instruments, permitting transientphenomena to be detected.
A plasma wave receiver is a sophisticated radio detec-tor that can be used to observe electrostatic/electromagneticwaves excited in space plasmas with high sensitivity. Thewave receiver employs electric and magnetic field sensorswith low-noise preamplifiers. It is critical to use both elec-tric and magnetic sensors for the following reasons. Sincethe refractive index (i.e., the ratio of the electric and mag-netic field strengths) depends on plasma dispersions, infor-mation about the refractive index is critical for identifyingplasma wave modes. Moreover, electrostatic waves, whichcannot exist in vacuum, can be confirmed by the fact that theelectric field sensor detects waves without any fluctuationsin the magnetic field sensor.
Unique features of plasma waves are mainly observed atfrequencies below the electron plasma frequency or the up-per hybrid frequency in the case that the electron plasmafrequency ( fpe) is larger than the electron cyclotron fre-quency ( fce) (in the case of fce > fpe, features of plasmawaves are shown clearly below fce). In situ wave phenom-ena occur at frequencies below these frequencies, which aredetermined by the local plasma.
Space plasmas are not uniform; their density varies indifferent regions. Electromagnetic waves can propagate far
227

228 H. KOJIMA: PLASMA WAVE RECEIVER
Fig. 1. Frequency-time spectrogram of plasma waves observed in the geomagnetic tail region.
from their sources. Therefore, even when a satellite is ina region of low-density plasmas, the onboard plasma wavereceiver must cover frequencies higher than local electronplasma frequencies, because propagating electromagneticplasma waves generated in high-density regions can be ob-served in such a low density region. For example, the elec-tron plasma frequency in the solar wind at a distance of1 AU from the sun is typically of the order of a few tensof kilohertz. However, a plasma wave receiver onboard asatellite in the solar wind should cover frequencies up to afew megahertz because waves are radiated from the sun andterrestrial polar regions, which have much higher plasmadensities than that of the local solar wind. Therefore, thefrequency coverage of plasma wave receivers is determinednot only by local plasma densities but also by those of thetarget regions for remote sensing.
On the other hand, the lowest frequency covered by atypical plasma wave receiver is a few hertz. This lowercutoff frequency is determined by considering the satura-tion effects of the sensitive receiver due to large DC elec-
tric or magnetic fields. In particular, for a spin-stabilizedsatellite, DC fields can be observed as waves with thefrequency corresponding to the satellite spin frequency.Very low frequency waves and DC fields can also be ob-served by instruments other than plasma wave receivers (seeIshisaka (2012) for electric-field detectors and Matsuoka etal. (2012) for magnetic-field detectors in the current issue).
The sensor preamplifier outputs are fed to the receivercomponents. Plasma wave receivers are classified as spec-trum or waveform capture receivers. The present paper de-scribes these two types of receivers as well as their onboardcalibration.
2. Plasma Wave Observation SystemA plasma wave observation system consists of sensors,
different types of plasma wave receivers, and a digital pro-cessing unit. Figure 2 shows a block diagram of the PlasmaWave Instrument (PWI) onboard the Geotail spacecraft,which was launched in 1992 (Matsumoto et al., 1994a). TheGeotail PWI is a typical plasma wave observation system.

H. KOJIMA: PLASMA WAVE RECEIVER 229
Fig. 2. Block diagram of the PWI onboard the Geotail spacecraft.
The Geotail PWI makes use of two different types of elec-tric field sensors for observing the electric field componentsof plasma waves. They are tip-to-tip lengths of 100 m andare addressed as WANT and PANT (abbreviations for Wire-ANTenna and Probe-ANTenna, respectively). The WANTis essentially a wire-dipole antenna. It has the advantageof being able to observe plasma waves. On the other hand,the PANT is suitable for observing very low frequencies orDC electric fields. The detailed structure and frequency re-sponse of these sensors have been described by Matsumotoet al. (1994a). The magnetic field component is detected bya triaxial search coil magnetometer mounted at the top ofthe mast. As shown in Fig. 2, the Geotail is not equippedwith a sensor for the component of the electric field alongthe spin axis because deployment along the spin axis ismore difficult than deployment in the spin plane. However,a spin-axis electric field sensor has usually been installedin recent terrestrial magnetosphere missions based on thetechnological advance.
The signals picked up by these electric and magnetic fieldsensors are fed to the plasma wave receiver. The GeotailPWI has three different types of receivers:
1) Sweep Frequency Analyzer (SFA),2) Multichannel Analyzer (MCA), and3) WaveForm Capture receiver (WFC).
The first two types of receivers measure wave spectra,whereas the last one is designed to simultaneously capturewaveforms of two electric and three magnetic field com-ponents. Detailed descriptions of each type of receiver aregiven in the following sections.
3. SensorsFigure 3 shows an artist’s sketch of the Geotail space-
craft. It has two sets of electric field sensors and one set ofmagnetic field sensors for plasma wave measurements. Adipole antenna is used for electric field measurements. Twopairs of dipole antennas are deployed in the spacecraft withtheir spin planes perpendicular to the spacecraft spin axis(see Fig. 3).
Search-coil magnetometers and loop antennas are usedfor measuring the magnetic field components of plasmawaves. Typically, the search-coil magnetometers are usedfor low-frequency waves below 100 kHz and the loop an-tennas are used at frequencies above a few tens of kilohertz.To avoid interference from the electronics inside the space-craft, the magnetic field sensors are often installed awayfrom the main body. For example, the triaxial search coilmagnetometer of the Geotail is mounted at the end of a 6-m-long mast (see Fig. 3).
The principles and designs of the electric and magneticsensors are described in detail by Gurnett (1998). Suffice itto say here that the design of the electric field sensor is crit-ical. The interaction with the surrounding plasma should beconsidered when designing the sensor. The sensor is usedfor both plasma wave and static electric field measurements.In terms of observing the electric fields of plasma waves, along dipole antenna in space can be regarded as a short an-tenna, because the wavelengths of the plasma waves are inmuch longer than the antennas. The antenna impedance invacuum is capacitive under this condition. Consequently, itis important to estimate the capacitance of the electric fieldantenna in vacuum when designing a plasma wave receiver.

230 H. KOJIMA: PLASMA WAVE RECEIVER
Fig. 3. Artist’s sketch of the Geotail spacecraft.
In practice, the impedance depends on plasma conditionssuch as electron temperatures, densities, and the presenceof photoelectrons. It also depends on the type of electricfield antenna. Many theoretical and numerical studies haveestimated the antenna impedance and the effective antennalength in plasmas (e.g., Meyer-Vernet and Perche, 1989;Miyake et al., 2008). Detailed analysis of electric fieldwave observations requires a precise determination of theantenna impedance. However, the capacitive impedanceof the antenna in vacuum is generally used in the designphase. Furthermore, since plasmas are dispersive media,the antenna impedance varies with frequency, which makesit impossible to maintain impedance matching at the inputof the preamplifier. Consequently, the preamplifier is de-signed with an impedance of over 100 M�, which is muchlarger than the expected antenna impedance.
4. Plasma Wave ReceiverWhile a spectrum receiver provides information on wave
amplitude and frequency, a waveform receiver measures thephase as well.
A spectrum receiver has the following advantages anddisadvantages.
Advantages:
1) Narrowband spectra can be detected with a highsignal-to-noise ratio.
2) The observed frequency range is divided into sev-eral bands that are covered by independent receivers.Therefore, we can optimize the dynamic range of a re-ceiver by assigning a different gain to each receiverconsidering the expected intensities of plasma wavesin each frequency band.
3) The total amount of data can be made much smallerthan that of a waveform receiver by optimizing thetime and frequency resolutions.
4) Continuous data collection is possible.
Disadvantages:
1) Its electronic circuit is more complex than that of awaveform receiver and it thus requires more resourcesfrom the mass and power budgets.
2) The receiver is not able to detect instantaneous phe-nomena.
In contrast, waveform receivers have the following ad-vantages and disadvantages:
Advantages:
1) Waveform receivers can detect phase. This meansthey can measure all wave properties except wavenum-ber. The information on the phase of a plasma waveis important for studying nonlinear phenomena, espe-cially since waveforms are not always sinusoidal. Geo-tail plasma wave observations revealed ElectrostaticSolitary Waves (ESW) in the BEN (Matsumotoet al.,1994b). The discovery of the ESW is a representativeachievement of the waveform receiver.
2) Waveform receivers can observe instantaneous phe-nomena.
3) Their electronic circuits have simple structures.
Disadvantages:
1) Since waveform receivers cover a wide frequencyrange, the gain must be reduced for the most intensewaves in the whole observable frequency range.
H. KOJIMA: PLASMA WAVE RECEIVER 231
2) To avoid aliasing, high-frequency sampling is neces-sary at the A/D converter. Such sampling leads to anincrease in the power consumption.
3) Waveform receivers generate a huge amount of data,which means that not all observational data can betransferred to the ground by telemetry. Therefore, onlyintermittent observations can be performed. Waveformreceivers need to stop measuring during transmissionof data to the ground.
Spectrum and waveform receivers complement eachother. However, since space missions have limited re-sources, some missions do not carry spectrum receivers.Instead, an onboard digital processing unit with a CPU ordigital signal processor (DSP) is used to generate spectrafrom the observed waveforms by taking the Fast FourierTransform(FFT). However, note that this type of spectrumreceiver suffers from the same disadvantages as waveformreceivers.4.1 Spectrum analyzers
There are two typical types of spectrum receivers: MCAsand SFAs.
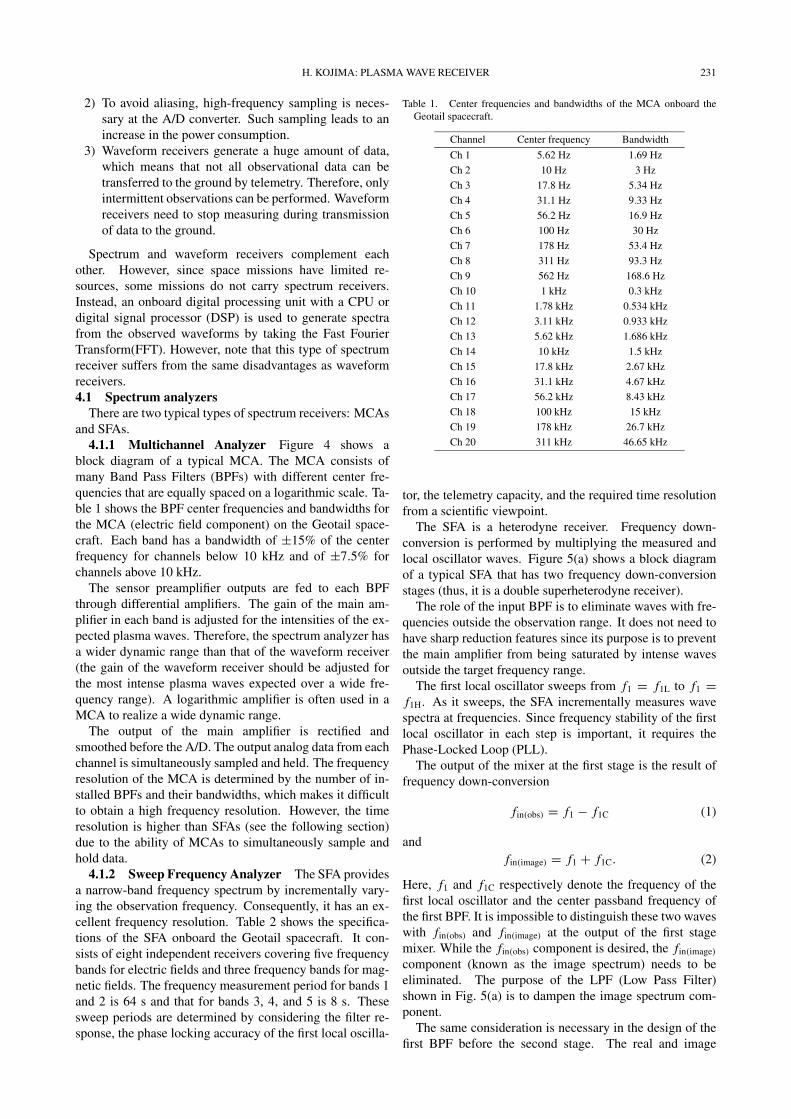
4.1.1 Multichannel Analyzer Figure 4 shows ablock diagram of a typical MCA. The MCA consists ofmany Band Pass Filters (BPFs) with different center fre-quencies that are equally spaced on a logarithmic scale. Ta-ble 1 shows the BPF center frequencies and bandwidths forthe MCA (electric field component) on the Geotail space-craft. Each band has a bandwidth of ±15% of the centerfrequency for channels below 10 kHz and of ±7.5% forchannels above 10 kHz.
The sensor preamplifier outputs are fed to each BPFthrough differential amplifiers. The gain of the main am-plifier in each band is adjusted for the intensities of the ex-pected plasma waves. Therefore, the spectrum analyzer hasa wider dynamic range than that of the waveform receiver(the gain of the waveform receiver should be adjusted forthe most intense plasma waves expected over a wide fre-quency range). A logarithmic amplifier is often used in aMCA to realize a wide dynamic range.
The output of the main amplifier is rectified andsmoothed before the A/D. The output analog data from eachchannel is simultaneously sampled and held. The frequencyresolution of the MCA is determined by the number of in-stalled BPFs and their bandwidths, which makes it difficultto obtain a high frequency resolution. However, the timeresolution is higher than SFAs (see the following section)due to the ability of MCAs to simultaneously sample andhold data.
4.1.2 Sweep Frequency Analyzer The SFA providesa narrow-band frequency spectrum by incrementally vary-ing the observation frequency. Consequently, it has an ex-cellent frequency resolution. Table 2 shows the specifica-tions of the SFA onboard the Geotail spacecraft. It con-sists of eight independent receivers covering five frequencybands for electric fields and three frequency bands for mag-netic fields. The frequency measurement period for bands 1and 2 is 64 s and that for bands 3, 4, and 5 is 8 s. Thesesweep periods are determined by considering the filter re-sponse, the phase locking accuracy of the first local oscilla-
Table 1. Center frequencies and bandwidths of the MCA onboard theGeotail spacecraft.
Channel Center frequency Bandwidth
Ch 1 5.62 Hz 1.69 Hz
Ch 2 10 Hz 3 Hz
Ch 3 17.8 Hz 5.34 Hz
Ch 4 31.1 Hz 9.33 Hz
Ch 5 56.2 Hz 16.9 Hz
Ch 6 100 Hz 30 Hz
Ch 7 178 Hz 53.4 Hz
Ch 8 311 Hz 93.3 Hz
Ch 9 562 Hz 168.6 Hz
Ch 10 1 kHz 0.3 kHz
Ch 11 1.78 kHz 0.534 kHz
Ch 12 3.11 kHz 0.933 kHz
Ch 13 5.62 kHz 1.686 kHz
Ch 14 10 kHz 1.5 kHz
Ch 15 17.8 kHz 2.67 kHz
Ch 16 31.1 kHz 4.67 kHz
Ch 17 56.2 kHz 8.43 kHz
Ch 18 100 kHz 15 kHz
Ch 19 178 kHz 26.7 kHz
Ch 20 311 kHz 46.65 kHz
tor, the telemetry capacity, and the required time resolutionfrom a scientific viewpoint.
The SFA is a heterodyne receiver. Frequency down-conversion is performed by multiplying the measured andlocal oscillator waves. Figure 5(a) shows a block diagramof a typical SFA that has two frequency down-conversionstages (thus, it is a double superheterodyne receiver).
The role of the input BPF is to eliminate waves with fre-quencies outside the observation range. It does not need tohave sharp reduction features since its purpose is to preventthe main amplifier from being saturated by intense wavesoutside the target frequency range.
The first local oscillator sweeps from f1 = f1L to f1 =f1H. As it sweeps, the SFA incrementally measures wavespectra at frequencies. Since frequency stability of the firstlocal oscillator in each step is important, it requires thePhase-Locked Loop (PLL).
The output of the mixer at the first stage is the result offrequency down-conversion
fin(obs) = f1 − f1C (1)
andfin(image) = f1 + f1C. (2)
Here, f1 and f1C respectively denote the frequency of thefirst local oscillator and the center passband frequency ofthe first BPF. It is impossible to distinguish these two waveswith fin(obs) and fin(image) at the output of the first stagemixer. While the fin(obs) component is desired, the fin(image)
component (known as the image spectrum) needs to beeliminated. The purpose of the LPF (Low Pass Filter)shown in Fig. 5(a) is to dampen the image spectrum com-ponent.
The same consideration is necessary in the design of thefirst BPF before the second stage. The real and image

232 H. KOJIMA: PLASMA WAVE RECEIVER
Fig. 4. Typical block diagram of a MCA (for one component of sensors).
Fig. 5. (a): Block diagram of a typical SFA (for one frequency band), (b) and (c): Concept of the image spectrum and design of LPFs.
spectra, f1−out(obs) and f1−out(image), are
f1−out(obs) = f2 − f2C (3)
andf1−out(image) = f2 + f2C. (4)
Here, f2 and f2C respectively denote the frequency of thesecond local oscillator and the center frequency of the sec-ond BPF.
Figures 5(b) and (c) depict the concepts used to eliminatethe image frequency component. The characteristics of theLPF and first BPF are crucial in the design of the SFA be-cause insufficient reduction by these filters can lead to mis-interpretation of the measured data due to the observationof the image spectrum. They require sharp reduction fea-tures to eliminate the image frequency spectra. Therefore,
high-order filtering is necessary. The maximum reductionlevel should match the dynamic range of the receiver.
After the second down-conversion, the output of themixer is fed to the second BPF. The second BPF limits thefrequency bandwidth of each frequency sweep step. A log-arithmic amplifier is located after the second BPF to real-ize a wide dynamic range. Figure 6 plots the characteris-tics of the quasi-logarithmic amplifier of the SFA onboardthe Geotail spacecraft. Table 3 shows the characteristic fre-quencies of the SFA onboard Geotail.4.2 Waveform capture
The waveforms picked up by the sensors are directlysampled in the waveform receiver, so-called ‘WaveFormCapture (WFC).’ The most important advantage of wave-form capture is that it provides phase information; spectrum

H. KOJIMA: PLASMA WAVE RECEIVER 233
Table 2. Specifications of the SFA onboard the Geotail spacecraft.
Band Frequency range Freq. step Bandwidth Source Sweep period
1 24–200 Hz 1.3 Hz 2.6 Hz B and E 64 s
2 200–1600 Hz 10.7 Hz 10 Hz B and E 64 s
3 1.6–12.5 kHz 85.4 Hz 85 Hz B and E 8 s
4 12.5–100 kHz 683 Hz 680 Hz E only 8 s
5 100–800 kHz 5.47 kHz 5.4 kHz E only 8 s
Table 3. Characteristic frequencies of the SFA onboard the Geotail spacecraft.
Band LPF First local First IF Second local Second IF
1 250 Hz 415.2–584.8 Hz 390.6 Hz — —
2 1.875 kHz 3.322–4.678 kHz 3.125 kHz 2.84 kHz 289 Hz
3 12.8 kHz 26.57–37.43 kHz 25 kHz 20 kHz 5 kHz
4 110 kHz 212.6–299.4 kHz 200 kHz 210 kHz 10 kHz
5 880 kHz 1.701–2.395 MHz 1.6 MHz 1.61 MHz 10 kHz
receivers such as MCA and SFA do not observe phase. Dig-ital waveform capture was used in the Geotail spacecraft,which led to the discovery of ESWs in the plasma sheetboundary layer as causing the BEN. The Geotail waveformcapture revealed that the broadband spectrum is generatedby a series of isolated pulses, which may have broadbandspectra.
Figure 7(a) shows a block diagram of a typical WFC.The role of the first LPF is to limit the observed frequencyrange. Since there is a wide frequency range below the cut-off frequency of the first LPF, the main amplifier must beadjusted to the dynamic range of the received signals overthe entire observational frequency range determined by thefirst LPF. Plasma waves at lower frequencies are generallymore intense than those at higher frequencies. Therefore,the gain needs to be adjusted to low-frequency waves ingeneral. In addition, a logarithmic amplifier cannot be usedfor the WFC since it distorts the waveforms. It is thus diffi-cult to design a high-sensitivity receiver for the WFC. Theseare the reasons why the WFC frequently has an automaticgain control (AGC) or a gain control system adjustable bytelemetry commands.
The second LPF is an anti-aliasing filter. The inputsignals are sampled at a sampling frequency of fs. Ac-cording to sampling theory, waves can be measured up tothe Nyquist frequency fN, which is half the sampling fre-quency. Aliasing occurs for signals with frequencies abovefN. Figure 7(b) shows the relationship between the aliasingsignal fa and fN. A signal with a frequency � f higher thanthe Nyquist frequency appears as an aliased signal at a fre-quency � f lower than the Nyquist frequency. If this signallies in the observed frequency range, it can be mistaken fora real signal. The purpose of the second LPF is to reducealiased signals in the observation band.
The dotted lines in Fig. 7 indicate the required frequencyresponses of the second LPF for two different cases, A andB. Here, f1 denotes the cutoff frequency of the second LPF.To analyze waveforms at frequencies above f1, it is neces-sary to sufficiently reduce fN. The reduction should matchthe dynamic range of the A/D converter (response A). Onthe other hand, if wave phenomena above f1 are completely
Fig. 6. Characteristics of the quasi-logarithmic amplifier of the SFAonboard the Geotail spacecraft (Matsumoto et al., 1994a).
ignored in data analysis, frequency response B can be se-lected. In this case, the reduction feature of the secondLPF is more relaxed so that a reduction equivalent to theA/D dynamic range should be ensured at a frequency off2 = 2 fN − f1.
To relax the design of the second LPF, a sampling fre-quency fs was used that is more than three times higherthan f1. However, since oversampling increases the powerconsumption of the A/D, we meet the limit of an oversam-pling. Therefore, a high-order Chebyshev filter or ellipticalfilter is often used for the second LPF.
Figure 8 shows a plot of the frequency response (withoutsensors and preamplifiers) of the WFC onboard the Geotail.Figures 8(a) and (b) represent the characteristics of the gainand phase for frequencies up to 4 kHz in the WFC low gainmode, respectively. Both the phase and the gain need to becalibrated during ground tests.
5. Digital ProcessingRcent progress in digital technology has enabled sophis-
ticated lightweight receivers to be developed. In partic-ular, high-speed CPUs, digital signal processors (DSPs),and field-programmable gate arrays (FPGAs) are useful.

234 H. KOJIMA: PLASMA WAVE RECEIVER
Fig. 7. (a) Block diagram of a typical WFC. (b) Concept of aliasing effect and design of the anti-aliasing filter.
They permit onboard signal processing such as FFT andwavelet analysis. Combining onboard signal processingwith a waveform receiver leads to the realization of a spec-trum receiver. Waveform data digitized by an A/D are fedto a digital unit that generates FFT spectra. Such a spectrumreceiver is both simple and flexible. Its time and frequencyresolutions can be controlled by software. However, it hasseveral disadvantages. For example, a high-speed A/D is re-quired for high-frequency bands, which increases the powerconsumption. Furthermore, the dynamic range of the re-ceiver has to be adjusted to the frequency band in which themost intense plasma waves are expected.
6. Onboard CalibrationAn onboard calibration system is used in both pre-flight
tests and in flight. The output from an onboard oscillator isfed to the input of the preamplifier of the electric-field an-tennas and the calibration coil attached to the magnetic-fieldsensor. For a waveform receiver, the onboard calibrationsystem needs to provide both phase and gain informationabout the circuit. For this purpose, a synchronous detectionmethod will be employed on the BepiColombo MercuryMagnetospheric Orbiter, which will be launched in 2014(Kasaba et al., 2008).
Figure 9 shows a block diagram of the onboard cali-bration system for the electric-field sensors using the syn-chronous detection method. It includes a calibration signalsource, whose output has undergone digital–analog conver-sion from waveform data stored in memory.
A local signal is input to the preamplifier through the lowresistance R1. When R1 is small relative to the antenna
impedance |ZA|, the impedance does not affect the outputwaveforms from the WFC. The waveforms of the calibra-tion source are directly sampled at the A/D after the receivercircuit. The digitized waveforms are then processed accord-ing to synchronous detection theory. The multiplier in thedigital processor calculates the product of a digitized wave-form with the signal source and with one shifted in phaseby π/2, producing the signals
V (t) · S(t) = |GWFC(ω)| V 2
2{cos(2ωt + θ) + cos θ} , (5)
and
V (t)·S π2(t) = |GWFC(ω)| V 2
2{sin(2ωt + θ) − sin θ} . (6)
Here, S(t), S π2(t), and V (t) represent the waveforms of the
signal, π/2 shifted signal, and receiver output, respectively;GWFC(ω) denotes the transfer function from the front endof the preamplifier to the analog output of the receiver; andθ is the phase shift in the circuit,
θ = � GWFC(ω). (7)
By averaging the results, we obtain
V (t) · S(t) = |GWFC(ω)| V 2
2cos θ, (8)
and
V (t) · S π2(t) = −|GWFC(ω)| V 2
2sin θ. (9)

H. KOJIMA: PLASMA WAVE RECEIVER 235
Fig. 8. Frequency responses of (a) gain and (b) phase in the low gain modeof the WFC onboard the Geotail spacecraft (Matsumoto et al., 1994a).
This gives the absolute value and phase of GWFC(ω).Using this method, the frequency response (gain and
phase) of the entire receiver circuit can be determined, in-cluding the preamplifier. Furthermore, this system can beused to determine the antenna impedance of the electric-field sensors, which strongly depends on the density andtemperature of the surrounding plasma. In the systemshown in Fig. 9, the input resistance R2 is comparable tothe antenna impedance |ZA|, so that the WFC output in-cludes the effect of that impedance. Thus, gain and phaseinformation of G i(ω) · GWFC can be obtained using theabove-mentioned synchronous detection method. Here, G i
denotes the transfer function of the electric-field sensorthat includes the effect of the antenna impedance. SinceGWFC(ω) is obtained in the low resistance mode of R1 in-dependently, we can calculate the G i from the G i(ω)·GWFC.
7. Summary and Perspectives on Plasma WaveReceivers for Future Missions
The present paper reviewed the properties of conven-tional plasma wave receivers. They are based on maturetechnologies that have advanced since the earliest days ofsatellite observations. Plasma wave receivers do not con-tain mechanically engineered parts except for the deploy-ment mechanism of the sensors. Instead, they contain manyelectronic components.
In recent space missions such as formation flights andplanetary missions, the mass and size budgets for onboard
instruments have been severely restricted because of the in-creasing number of research goals of these missions. Minia-turization of onboard instruments is thus important in devel-oping new instruments for future space missions. A reduc-tion in the size of electronic components immediately leadsto miniaturization of plasma wave receivers.
Recent progress in FPGAs has led to high-performanceonboard digital processing. For example, a spectrum re-ceiver can be realized based on a waveform capture receiverusing a FPGA or DSP. Another digital type of plasma wavereceiver has been used in the sounding rocket SS-520-2 andKaguya spacecraft for a lunar mission. A programmabledown-converter (PDC) has been installed in these receivers(Hashimoto et al., 2003; Kasahara et al., 2008). In that dig-ital device, wideband waveforms sampled at a high rate aredown-converted into waveforms with a narrow band. Tak-ing the FFT of the output waveforms results in frequencyspectra in a limited spectral range. The converted frequencyrange is controllable by onboard software. Thus, “digital”sweep frequency analyzer can be realized by combining aPDC and its control software. Such a digital sweep ana-lyzer has a much smaller mass than an analog type sweepfrequency analyzer because it does not require mixers or alocal sweep oscillator with the PLL.
A plasma wave receiver cannot completely eliminate theuse of analog electrical circuits since analog circuits occupya large portion of the electrical board in the form of var-ious amplifiers and filters. However, their size can be re-duced by using analog Application Specific Integrated Cir-cuit (ASIC) technology. ASIC could be implemented bychips that are a few square millimeters in size. Kojima etal. (2010) and Fukuhara et al. (2011) have developed sucha chip that stores essential analog components such as fil-ters and amplifiers. Figure 10 shows a prototype chip de-veloped by our group. It contains several types of low-passfilters and amplifiers. Such work is expected to lead to ex-treme miniaturization of plasma wave receivers. Kojima etal. (2010) and Fukuhara et al. (2011) demonstrated the fea-sibility of a waveform receiver that is the size of a businesscard and that can observe six components of waveforms.
A single small package should eventually contain bothwaveform and spectrum receivers, in contrast to recent mis-sions in which only a waveform receiver is used becausethe required resources for the analog spectrum receiver aremuch larger. In those missions, the wave spectrum was ob-tained directly or after digital down-conversion by the on-board FFT calculation from the observed waveforms. How-ever, this technique contains the disadvantages of a wave-form receiver. It requires a high-speed A/D in observingwave spectra at high frequencies. Furthermore, the gainof the receiver has to be adjusted to the frequency rangein which the most intense waves are expected to be ob-served. Therefore, the digital spectrum receiver does not de-tect weak plasma waves in other frequency ranges. In con-trast, using an analog spectrum receiver (such as a sweepfrequency receiver), the spectrum can be divided into sev-eral bands with individual frequency ranges such as thoselisted in Table 2 and the gain of each band can be variedindependently. The analogue spectrum analyzer requiresmuch more resources such as weight and size than those

236 H. KOJIMA: PLASMA WAVE RECEIVER
Fig. 9. Onboard calibration system of the BepiColombo spacecraft.
Fig. 10. Analog chip for a plasma wave receiver: the package is shown on the left and the bare chip is shown on the right.
of the digital one. However, the weight and size can begreatly reduced by using an analog ASIC. Consequently,plasma wave receivers in future missions will ideally con-tain both waveform and spectrum receivers that are installedon a small chip. The design of an analogue chip needs pro-ficiency especially in developing a low noise circuit. How-ever, the attempt to develop small plasma wave receivers isessential for future space missions.
Acknowledgments. The author thanks S. Yagitani, Y. Kasahara,and M. Ozaki of Kanazawa University, Japan for the discussionin writing the present paper. The author thanks H. Fukuharaand S. Okada of Kyoto University, Japan for their hard works
in developing the small plasma wave receiver using ASIC. Thestudy on the miniaturization of the plasma wave receiver wassupported by Grant-in-Aids for Scientific Research (A) 19204048and 23244097.
ReferencesBarrington, R. E. and J. S. Belrose, Preliminary results from the VLF re-
ceiver aboard Canada’s Alouette satellite, Goddard Space Flight CenterPubl. X-615-63-36, 1963.
Cain, J. C., I. R. Shapiro, J. D. Stolarik, and J. P. Heppner, A note onwhistlers observed above the ionosphere, J. Geophys. Res., 66, 2677–2680, 1961.
Fukuhara, H., H. Kojima, S. Okada, H. Ikeda, and H. Yamakawa, Wave-form receiver on-a chip dedicated to plasma wave instrument onboardscientific spacecraft, IEEE AC paper #1139, 2011 IEEE Aerospace Con-

H. KOJIMA: PLASMA WAVE RECEIVER 237
ference Proceedings, 2011.Gurnett, D. A., Principles of space plasma wave instrument design, Mea-
surement Techniques in Space Plasmas: Fields, Geophysical Mono-graph, 103, 121–136, 1998.
Gurnett, D. A. and B. J. O’Brien, High-latitude geophysical studies withsatellite Injun 3, J. Geophys. Res., 69, 65–89, 1964.
Hashimoto, K., H. Iwai, Y. Ueda, H. Kojima, and H. Matsumoto, Softwarewave receiver for SS-520-2 rocket experiment, IEEE Trans. on Geosci.and Remote Sens., 41, 2368, 2647, 2003.
Ishisaka, K., Electric field instrument onboard Japanese sounding rockets,in An Introduction to Space Instrumentation, this book, ed. by K. Oyamaand C. Z. Cheng, p. 155-163, TERRAPUB, Tokyo, 2012.
Kasaba, Y., J.-L. Bougeret, L. G. Blomberg, H. Kojima, S. Yagitani, M.Moncuquet, J.-G. Trotignon, G. Chanteur, A. Kumamoto, Y. Kasahara,J. Lichtenberger, Y. Omura, K. Ishisaka, and H. Matsumoto, The PlasmaWave Investigation (PWI) onboard the BepiColombo MMO: First mea-surement of electric fields, electromagnetic waves, and radio wavesaround Mercury, Planetary Space Science, 58, 238–278, 2008.
Kasahara, Y., Y. Goto, K. Hashimoto, T. Imachi, A. Kumamoto, T. Ono,and H. Matsumoto, Plasma wave observation using waveform capturein the Lunar radar sounder on board the SELENE spacecraft, Earth,Planets and Space, 60, 341–351, 2008.
Kojima, H., H. Fukuhara, Y. Mizuochi, S. Yagitani, H. Ikeda, Y. Miyake,H. Usui, H. Iwai, Y. Takizawa, Y. Ueda, and H. Yamakawa, Miniaturiza-tion of plasma wave receivers onboard scientific satellites and its appli-cation to the sensor network system for monitoring the electromagneticenvironments in space, Advances in Geosciences, 21, 461–481, 2010.
Leiphart, J. P., Penetration of the ionosphere by very-low-frequency radio
signals-interim results of the Lofti 1 experiment, Proc. IRE, 50, 6, 1962.Matsumoto, H., I. Nagano, R. R. Anderson, H. Kojima, K. Hashimoto,
M. Tsutsui, T. Okada, I. Kimura, Y. Omura, and M. Okada, Plasma waveobservations with Geotail spacecraft, J. Geomag. Geoelectr., 46, 59–95,1994a.
Matsumoto, H., H. Kojima, T. Miyatake, Y. Omura, M. Okada, I. Nagano,and M. Tsutsui, Electrostatic Solitary Waves (ESW) in the Magnetotail:BEN Wave forms observed by GEOTAIL, Geophys. Res. Lett., 21,2915–2918, 1994b.
Matsumoto, H., H. Kojima, Y. Omura, and I. Nagano, Plasma waves inGeospace: GEOTAIL Observation, in New Perspectives on the Earth’sMagnetotail, ed. by N. Nishida, D. N. Baker, and W. H. Cowley, Geo-physical Monograph by the American Geophysical Union, 105, 259–319, 1998.
Matsuoka, A., M. Shinohara, Y. Tanaka, A. Fujimoto, and K. Iguchi, De-velopment of fluxgate magnetometers and applications to the space sci-ence missions, in An Introduction to Space Instrumentation, this book,ed. by K. Oyama and C. Z. Cheng, p. 217-225, TERRAPUB, Tokyo,2012.
Meyer-Vernet and C. Perche, Tool kit for antennae and thermal noise nearplasma frequency, J. Geophys. Res., 94, 2405–2415, 1989.
Miyake, Y., H. Usui, H. Kojima, Y. Omura, and H. Matsumoto,Electromagnetic Particle-In-Cell simulation on the impedance of adipole antenna surrounded by an ion sheath, Radio Science, 43,doi:10.1029/2007RS003707, 2008.
H. Kojima (e-mail: [email protected])