physical review x 8, 011016 (2018) - np.phy.cam.ac.uk · 3faculty of physics, university of warsaw,...
TRANSCRIPT

Pulsed Molecular Optomechanics in Plasmonic Nanocavities:From Nonlinear Vibrational Instabilities to Bond-Breaking
Anna Lombardi,1 Mikołaj K. Schmidt,2,3,4 Lee Weller,1 William M. Deacon,1
Felix Benz,1 Bart de Nijs,1 Javier Aizpurua,2 and Jeremy J. Baumberg1,*1NanoPhotonics Centre, Cavendish Laboratory,
University of Cambridge, Cambridge CB3 0HE, United Kingdom2Materials Physics Center CSIC-UPV/EHU and Donostia International Physics Center DIPC,
Paseo Manuel de Lardizabal, 20018 Donostia-San Sebastián, Spain3Faculty of Physics, University of Warsaw, Pasteura 5, 02-093 Warsaw, Poland
4Macquarie University Research Centre in Quantum Science and Technology (QSciTech),Department of Physics and Astronomy, Macquarie University NSW 2109, Australia
(Received 2 February 2017; revised manuscript received 6 October 2017; published 2 February 2018)
Small numbers of surface-bound molecules are shown to behave as would be expected for opto-mechanical oscillators placed inside plasmonic nanocavities that support extreme confinement of opticalfields. Pulsed Raman scattering reveals superlinear Stokes emission above a threshold, arising from thestimulated vibrational pumping of molecular bonds under pulsed excitation shorter than the phonon decaytime, and agreeing with pulsed optomechanical quantum theory. Reaching the parametric instability(equivalent to a phonon laser or “phaser” regime) is, however, hindered by the motion of gold atoms andmolecular reconfiguration at phonon occupations approaching unity. We show how this irreversible bondbreaking can ultimately limit the exploitation of molecules as quantum-mechanical oscillators, but accessesoptically driven chemistry.
DOI: 10.1103/PhysRevX.8.011016 Subject Areas: Chemical Physics, Nanophysics,Plasmonics
I. INTRODUCTION
The vibrational properties of molecules have longbeen exploited for analytic chemical techniques, suchas infrared [1,2] and Raman spectroscopies [3–6], as wellas for coherent light emission frommasers [7]. The nature ofchemical bonds as quantum vibrational oscillators can nowbe very effectively manipulated by trapping light tightlyenough around molecules [8]. Analogous optomechanicalsystems use macroscopic vibrational modes such as canti-levers [9,10], beams [11], or pillars [12–15] coupled to high-finesse optical cavities in order to demonstrate a variety ofeffects such as cooling to the quantum vibrational groundstate [16], parametric oscillation [17], and supercontinuumcomb generation [18]. Recent theory [19,20] and experi-ments [8,21] have shown that this same optomechanicalHamiltonian describes vibrating molecular bonds in nano-cavities, but with single-photon coupling coefficients
ℏg0 ∼ 10–100 meV, a millionfold larger than for macro-scopic resonators. Here, we explore how this coupling can beused to elicit stimulated phonon scattering within vibratingbonds, leading toward phonon lasing or “phasing,” observedpreviously in microfabricated mechanical oscillators[22–24], and we suggest how such mechanical resonancescan lead to chemical reactions [Fig. 1(a)].Raman scattering that creates (Stokes) or annihilates
(anti-Stokes) phonons can directly probe the phononpopulations. Using an optomechanical model, it is possibleto extract the photon-phonon coupling [8,20]. When thenanocavities are formed by ultrathin gaps between plas-monic metal nanostructures that trap the optical field, thisstrongly amplified process is termed surface-enhancedRaman spectroscopy (SERS) of the molecules in thegap. This process has been widely exploited for vibrationalspectroscopy by enabling tagless detection of ultrasmallconcentrations of chemical analytes [3,25–28]. Our under-standing that molecular optomechanics and SERS corre-spond to the same process opens up the exploration ofnonlinear Raman scattering, particularly since the well-defined plasmonic nanocavities required have now becomeavailable through self-assembly [29], lithography [30], andscanning tip microscopies [21]. We note that previousstudies have been hampered by irreproducibility in theplasmonic constructs such as micropatterned substrates
*Corresponding [email protected]
Published by the American Physical Society under the terms ofthe Creative Commons Attribution 4.0 International license.Further distribution of this work must maintain attribution tothe author(s) and the published article’s title, journal citation,and DOI.
PHYSICAL REVIEW X 8, 011016 (2018)
2160-3308=18=8(1)=011016(17) 011016-1 Published by the American Physical Society
[31], colloidal aggregates [32], and micron-sized particles[33]. Moreover, because phonon lifetimes in molecules areon the order of ps, building up the significant vibrationalstate populations needed for nonlinear Raman favorsintense short-pulse excitation, which has not typically beenused for SERS, nor has the theory for this regime beenderived. More recently, pioneering coherent-anti-StokesRaman scattering (CARS) has been applied to singleplasmonic dimers [34], highlighting weak signals and rapiddamage as noted below, which make power-dependentmeasurements to probe optomechanical models challeng-ing. Here, we study intensity-dependent SERS from singlegold nanoparticles under pulsed and continuous wave(CW) illumination.
II. EXPERIMENTAL SETUP AND RESULTS
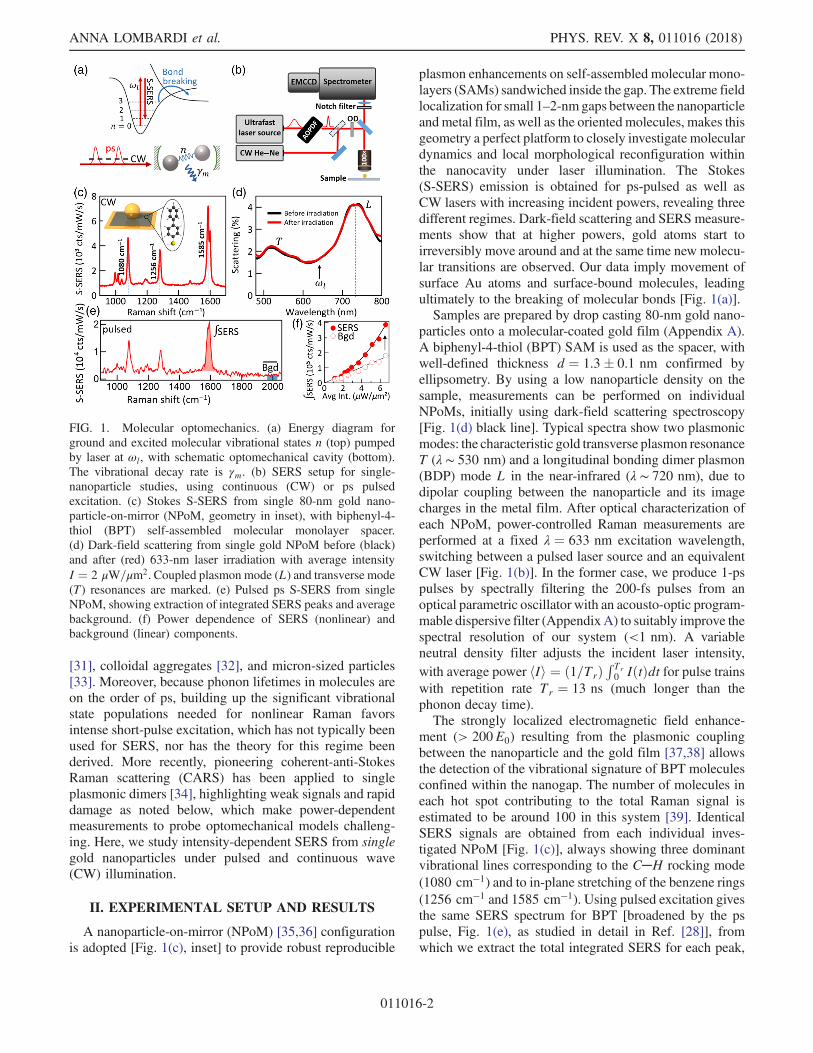
A nanoparticle-on-mirror (NPoM) [35,36] configurationis adopted [Fig. 1(c), inset] to provide robust reproducible
plasmon enhancements on self-assembled molecular mono-layers (SAMs) sandwiched inside the gap. The extreme fieldlocalization for small 1–2-nmgaps between the nanoparticleandmetal film, as well as the orientedmolecules, makes thisgeometry a perfect platform to closely investigate moleculardynamics and local morphological reconfiguration withinthe nanocavity under laser illumination. The Stokes(S-SERS) emission is obtained for ps-pulsed as well asCW lasers with increasing incident powers, revealing threedifferent regimes. Dark-field scattering and SERS measure-ments show that at higher powers, gold atoms start toirreversibly move around and at the same time new molecu-lar transitions are observed. Our data imply movement ofsurface Au atoms and surface-bound molecules, leadingultimately to the breaking of molecular bonds [Fig. 1(a)].Samples are prepared by drop casting 80-nm gold nano-
particles onto a molecular-coated gold film (Appendix A).A biphenyl-4-thiol (BPT) SAM is used as the spacer, withwell-defined thickness d ¼ 1.3� 0.1 nm confirmed byellipsometry. By using a low nanoparticle density on thesample, measurements can be performed on individualNPoMs, initially using dark-field scattering spectroscopy[Fig. 1(d) black line]. Typical spectra show two plasmonicmodes: the characteristic gold transverse plasmon resonanceT (λ ∼ 530 nm) and a longitudinal bonding dimer plasmon(BDP) mode L in the near-infrared (λ ∼ 720 nm), due todipolar coupling between the nanoparticle and its imagecharges in the metal film. After optical characterization ofeach NPoM, power-controlled Raman measurements areperformed at a fixed λ ¼ 633 nm excitation wavelength,switching between a pulsed laser source and an equivalentCW laser [Fig. 1(b)]. In the former case, we produce 1-pspulses by spectrally filtering the 200-fs pulses from anoptical parametric oscillator with an acousto-optic program-mable dispersive filter (AppendixA) to suitably improve thespectral resolution of our system (<1 nm). A variableneutral density filter adjusts the incident laser intensity,with average power hIi ¼ ð1=TrÞ
R Tr0 IðtÞdt for pulse trains
with repetition rate Tr ¼ 13 ns (much longer than thephonon decay time).The strongly localized electromagnetic field enhance-
ment (> 200E0) resulting from the plasmonic couplingbetween the nanoparticle and the gold film [37,38] allowsthe detection of the vibrational signature of BPT moleculesconfined within the nanogap. The number of molecules ineach hot spot contributing to the total Raman signal isestimated to be around 100 in this system [39]. IdenticalSERS signals are obtained from each individual inves-tigated NPoM [Fig. 1(c)], always showing three dominantvibrational lines corresponding to the C─H rocking mode(1080 cm−1) and to in-plane stretching of the benzene rings(1256 cm−1 and 1585 cm−1). Using pulsed excitation givesthe same SERS spectrum for BPT [broadened by the pspulse, Fig. 1(e), as studied in detail in Ref. [28]], fromwhich we extract the total integrated SERS for each peak,
FIG. 1. Molecular optomechanics. (a) Energy diagram forground and excited molecular vibrational states n (top) pumpedby laser at ωl, with schematic optomechanical cavity (bottom).The vibrational decay rate is γm. (b) SERS setup for single-nanoparticle studies, using continuous (CW) or ps pulsedexcitation. (c) Stokes S-SERS from single 80-nm gold nano-particle-on-mirror (NPoM, geometry in inset), with biphenyl-4-thiol (BPT) self-assembled molecular monolayer spacer.(d) Dark-field scattering from single gold NPoM before (black)and after (red) 633-nm laser irradiation with average intensityI ¼ 2 μW=μm2. Coupled plasmon mode (L) and transverse mode(T) resonances are marked. (e) Pulsed ps S-SERS from singleNPoM, showing extraction of integrated SERS peaks and averagebackground. (f) Power dependence of SERS (nonlinear) andbackground (linear) components.
ANNA LOMBARDI et al. PHYS. REV. X 8, 011016 (2018)
011016-2

as well as the SERS background (around 2000 cm−1),which arises from the inelastic scattering of electrons in themetal. The power dependence of these two components[Fig. 1(f)] shows that the molecular Raman is nonlinearwhile the electronic Raman is linear. Explaining thisobservation is the main focus of this paper.
III. MODEL AND DISCUSSION
A nonlinear evolution of the Stokes Raman signal forspecific pump detuning is a strong indication that opto-mechanical interactions between the plasmons of the cavityand the vibrations of the molecules are occurring in oursystem [19,20,40]. We describe the theoretical basis forunderstanding Raman signals within pulsed molecularoptomechanics in the following. The coupling betweenconfined plasmons at cavity frequency ωc (with bosonicannihilation and creation operators a, a†) and phonons offrequency ωm (operators b, b†), driven by an external laserat ωl of field strength AðtÞ, is governed by the nonlinearoptomechanical Hamiltonian [19,20]
H ¼ ℏωca†aþ iℏAðtÞða†e−iωlt − aeiωltÞþ ℏωmb
†b − ℏg0a†aðbþ b†Þ ð1Þ
This description is completed by the inclusion of thespontaneous decay of phonons with rate γm and plasmonswith decay rate κ (see Appendix I for details). In the weaksingle-photon coupling regime (when g0 ≪ ωm, κ) theabove Hamiltonian can be linearized, and the optical degreeof freedom can be traced out [19,20,40]. As a result, aconvenient description of the dynamics of the vibrationaldegree of freedom can be formulated, in which the rate ofcreation and annihilation of phonons is modified by thepresence of the cavity, acting now as a reservoir ofexcitations for the vibrations. Throughout this process,the cavity is assumed to be in a coherent state, and thephonons are in a thermal state, with negligible coherentamplitude and dominant incoherent population (seeAppendix I for details).We consider the response of the plasmonic cavity to
either CW or pulsed illumination. In the former case, thecavity is assumed to be in a steady coherent state, definedby the optical amplitude α ¼ A=½iðωc − ωlÞ þ κ=2�. Onthe other hand, the temporal length of the incident pulseused in this study falls in between the characteristicevolution times of the cavity plasmons (few fs) andphonons (few ps). The amplitude of the coherent stateof plasmons αðtÞ thus follows the temporal shape ofincident pulse IðtÞ ∝ jAðtÞj2 almost instantaneously.Indeed, we verify through numerical integration of themaster equation that when illuminated by a 1-ps Gaussianpulse, the cavity behaves as if illuminated by a CWsource with instantaneous pumping rate AðtÞ, and after
approximately 20 fs, it settles into a coherent state withamplitude αðtÞ ¼ AðtÞ=½iðωc − ωlÞ þ κ=2�.A similar analysis suggests that we cannot assume that the
vibrations reach a steady state when the system is illumi-nated by a 1-ps pulse. The solution to the optomechanicalsystem dynamics adopted here is thus formulated in terms ofthe dynamics of the mechanical degree of freedom, assistedby the optical cavity, which has settled into a steady state. Inparticular, the dynamics of the population of phonons isdescribed by the rate equation [40,41]:
ddtnphon ¼−nphonðγmþΓ−Þþðnphonþ1ÞΓþþ γmnth: ð2Þ
Here nth is the thermal population of phonons due to thefinite temperature of the environment T ¼ 300 K, varyingfrom nth ¼ 10−4 to 0.03 for the typical vibrational frequen-cies of the BPT molecule we observe. The role of the cavityis captured by the Stokes (Γþ) and anti-Stokes (Γ−) cavity-assisted transitions rates. As each Stokes transition adds aphonon to the molecule and each anti-Stokes transitionremoves one, the optomechanical damping defined asΓopt ¼ Γ− − Γþ describes how a plasmonic cavity caneither enhance (for positive Γopt) or suppress (for negativeΓopt) the effective decay rate Γeff ¼ γm þ Γopt of phonons.While this behavior is reminiscent of a harmonic oscillatorresonantly coupled to a structured bath of excitations, herethe transition rates Γ� exhibit a linear dependence on theplasmon population npl ¼ jαðtÞj2, and consequently, on thepulse temporal evolution.Considering first the situation of CW illumination, where
the Stokes and anti-Stokes transition rates Γþ and Γ− aretime independent, the steady-state phonon population isfound to be
nphon ¼γm
γm þ Γoptnth þ
Γþγm þ Γopt
ð3Þ
For negative optomechanical damping Γopt, this solutionexhibits a threshold behavior when the cavity amplitudebecomes large enough for the effective phonon dampingΓeff to vanish. We demonstrate this behavior in Fig. 2(a),where we plot the phonon population and effective opto-mechanical damping as a function of the intensity of theCW illumination I ∝ jAj2, with solid and dashed blacklines, respectively. These plots are calculated for the1585 cm−1 vibrational mode, with system parameters fittedto the experimental results (see below). For the lowest laserpowers, the thermal population of phonons nth ≈ 5 × 10⁻⁴dominates. Since in this unpumped regime the optome-chanical damping Γopt ∝ I is negligible, the population ofphonons in Fig. 2(a) remains constant. For larger laserpowers between 101 and 103 μW=μm2, the optomechanicalpumping remains very small (−Γopt ≪ γm) so that thenormalized effective decay rate Γeff=γm ¼ ðΓopt þ γmÞ=γm
PULSED MOLECULAR OPTOMECHANICS IN PLASMONIC … PHYS. REV. X 8, 011016 (2018)
011016-3

remains unity [black dashed line, Fig. 2(a)]. However, thevibrational pumping mechanism starts to dominate over thethermal population, yielding a phonon population linearlydependent on I. Finally, near the threshold, the magnitudeof optomechanical damping Γopt becomes comparable toγm; consequently, the effective phonon damping decreasesrapidly and the phonon population reaches a regime ofnonlinear, asymptotic growth. We note that in SERS, therapid increase of the phonon population might then besuppressed by the onset of anharmonicity of the electronicpotential of the molecule.For pulsed illumination (with I redefined as the illumi-
nation peak intensity), the intensity dependence of thephonon population is somewhat different. As shown inFig. 2(a) (red line), the vibrational pumping of phononsbecomes less efficient than under CW illumination, and thesystem does not exhibit such a clear threshold behavior.
Instead, the phonon population becomes superlinearlydependent on I for significantly larger peak laser powers(around 105 μW=μm2), and asymptotically converges to anexponential growth determined by the parameters ofillumination.While the dynamics of vibrations is very different for
CW and pulsed illumination, in both cases the Stokes andanti-Stokes emission intensities are determined by theproduct of the laser intensity and phonon population as
SS ∝ Ið1þ nphonÞ; SAS ∝ Inphon ð4Þ
This emission is integrated over the duty cycle. InFig. 2(b), with solid lines, we plot the Stokes and anti-Stokes intensities for pulsed illumination, as a function ofthe peak laser intensity. In the thermal regime (below102 μW=μm2), emission from both the Stokes and anti-Stokes is linearly proportional to I. In the vibrationalpumping regime (between 102 and 104 μW=μm2),nphon ∝ I, and the anti-Stokes emission has a quadraticdependence on I. Finally, a region of significant non-linearity of Stokes emission, for laser intensities over104 μW=μm2, is magnified in the inset (dashed line showslinear dependence). We note that these dependencies ofStokes and anti-Stokes emission in Eq. (3) can also bederived from a purely classical theory, by solving the rateequation for the phonon population [40,41].Such predicted behaviors are seen in the experiment.
Exciting single NPoMs with average intensities below10 μW=μm2 (∼1013 photons=s or, given the plasmoncavity lifetime of 20 fs and small cross section, far lessthan one plasmon excited at any time), the dark-fieldscattering spectrum remains unmodified [Fig. 1(d), redline] and the SERS intensity increases linearly with laseraverage intensity [regime RL in Fig. 2(c), black squares].This is characteristic of both the thermal and vibrationalpumping regimes. Similar linear behavior is seen for pulsedexcitation with peak intensities below 104 μW=μm2 and iswell reproduced by the low-power limit optomechanicaltheory of SERS [left-hand side of Fig. 2(b)]. In this regime,as expected, absolute S-SERS intensities are similar forCW and pulsed excitation of the same average power(Appendix B).A complete change is seen for pulsed peak powers
>104 μW=μm2 [Fig. 2(c)], with the Stokes SERS intensitynow showing a clear superlinear increase [Fig. 2(c), super-linear regime RS] before saturation sets in. This nonlinearbehavior matches the molecular optomechanical modeladapted to pulsed excitation, depicted with the red line (usingphonon decay rates ℏγm ¼ 0.07 meV and single-photoncoupling parameter ℏgfit0 ¼ 6 meV, consistent with the dataobtained from dark-field spectroscopy of the cavity andRaman spectroscopy of the molecules). Previously weshowed that anti-Stokes emission (AS-SERS) is indeednonlinear in the vibrational pumping regime for small
FIG. 2. Runaway molecular vibrations. (a) Comparison of thenonlinear buildup of incoherent phonon population (solid lines)for CW (black line) or pulsed (red line) illumination. In the lattercase with 1-ps Gaussian pulses, the peak laser intensity andphonon population are used. Only for CW illumination does aclear threshold arise from the vanishing effective phonon decayrate (dashed line, normalized to the free-space phonon decayrate), interpreted as the phonon lasing (phasing) or instabilityregime. (b) Stokes (orange line) and anti-Stokes (blue line)dependence on the peak intensity of the pulsed illumination.Zoomed region (inset) highlights the superlinear predicted time-integrated Stokes emission (linear shown dashed). (c) Stokes-SERS intensity of 1585 cm−1 mode for a single NPoM vs peaklaser intensity for (red circles) ps-pulsed and (black squares) CWexcitation. Pulsed measurements on two additional particles arealso shown (red triangles, squares). Linear (RL), superlinear (RS),and driven-chemical (RC) regimes are highlighted in blue,orange, and red. The black dashed lines show a linear response;the red line shows Stokes emission calculated from the modelin (b).
ANNA LOMBARDI et al. PHYS. REV. X 8, 011016 (2018)
011016-4

populations [8], consistent with the established characteristicof the vibrational pumping regime, but with only a linear S-SERS signal. Here we show that at much larger peak laserpowers, the Stokes signal also becomes superlinear as thephonon populations become nonlinear. This is a clearsignature of the amplification of the phonon population inmolecules due to optomechanical backaction coupling to theplasmonic mode, revealing the stimulated precursor to theparametric instability (Appendix I). This latter regime is,however, not accessible with stronger CW pumping, as wediscuss later.The evolution of SERS intensity in single NPoMs with
increasing laser powers is tracked for the three fundamentalRaman peaks of BPT in the case of ps-pulse excitation(Fig. 3). It is evident that the three modes share a similarnonlinear power dependence, with higher power onsets ofnonlinear emission for lower frequency modes, but similarpower thresholds for saturation (results on different NPoMsgive thresholds that vary �50%).Since many molecules (Nm ∼ 100) are present in the
NPoM cavity, it is important to consider how this ensemblecouples to the plasmonic mode. The two extreme cases are(a) that all molecules vibrate collectively or (b) that eachmolecule is coupled individually to the plasmonic modeand no coherence arises between the vibrations of mole-cules. In the latter case, the coupling strength is simplygiven by the single-molecule coupling g0, with all phononslocalized to a specific molecule. On the other hand, for thecollective vibrations of case (a), the overall couplingstrength is expected to be gN ¼ g0
ffiffiffiffiffiffiffiNm
p, with the phonons
delocalized across all molecules. In more realistic systems,however, the molecules will be dispersed inside the cavityand exhibit a distribution of single-plasmon, single-molecule coupling parameters g0.
The different coupling strengths in cases (a) and (b) cor-respond to different onsets of the nonlinear Stokes emission[19,20]. From the optomechanical parameters here (givenin Appendix I), we estimate the single-plasmon optome-chanical coupling as ℏg0 ∼ 0.38 meV, and henceℏgN¼100 ∼ 4 meV. The theoretical fit to the experimentalresults shown in Fig. 2(c) was calculated usingℏgN ¼ 6 meV ¼ ℏgfit0 , which suggests that a strong col-lective behavior is indeed observed for the first time. ForCW illumination, the nonlinear threshold is determineddirectly by the ratio ðg0Þ2=γm; however, under pulsedillumination, this onset of superlinear Stokes emissionbecomes largely independent of the free-space phonondecay rate γm for typical values of this parameter. This isbecause the phonon population does not reach equilibriumduring the pulsed illumination, and its buildup is thusgoverned predominantly by the coupling parameter andillumination intensity, instead of the decay of the phononpopulation. We discuss this effect in more detail inAppendix J. We emphasize that in this power regime allchanges in experimental SERS spectra are still completelyreversible, and neither spectral shifts of the main Ramanmodes nor any relative change in their intensities areobserved. A similar dependence is seen for all NPoMs.In comparison to our previous experiments [8], in
which we used cryogenic temperatures to stabilize“picocavities” based around single Au atom projectionswithin the facets of the nanogap, here we remain in thenanocavity limit at room temperature, with optical fieldsdelocalized laterally ∼5 nm and probing many moleculessimultaneously. This is because we work at room temper-ature, and we avoid such high powers that move the Auatoms around (which is checked by dark-field scatteringbefore and after each experiment). At room temperature,any picocavities are typically highly unstable, existing formuch shorter times than the integration times here. Thisis confirmed from successively taken SERS spectra thatshow no fluctuations in vibrational peak positions, asexpected for the 100 molecules probed, rather than thefluctuating energies seen for single molecules in pico-cavities [8]. It is very evident whenever a picocavityappears, showing sharp additional Raman lines thatexhibit Stokes:anti-Stokes ratios close to unity, and wethus avoid these [42]. Given the inverse scaling of theoptomechanical coupling g0 on the plasmon cavityvolume, we thus expect its hundredfold decrease fromthe picocavity to nanocavity regimes, as is indeedobserved above (from 40 meV in picocavities to ℏg0 ∼0.4 meV in these nanocavities).To access the parametric instability the power is further
increased, but for peak laser intensities >106 μW=μm2
(equivalent to average powers >10 μW=μm2), thesignal decreases irreversibly. As we discuss below, thisis likely a result of chemical changes of the moleculesattached to the gold and reconfiguration of the nanoparticle
FIG. 3. Regimes for different molecular vibrations. SERSintensity of the 1585 cm−1, 1250 cm−1, and 1080 cm−1 modesfor BPT molecules forming the plasmonic spacer, as a function ofthe incident pulsed laser power: linear (RL), superlinear (RS), anddriven chemical (RC) regimes are highlighted in blue, orange, andred, respectively. Lines show linear fits to the RL regime; arrowsshow thresholds.
PULSED MOLECULAR OPTOMECHANICS IN PLASMONIC … PHYS. REV. X 8, 011016 (2018)
011016-5

shape [Fig. 2(c), chemical regime RC] [8]. We also stressthat the ever-present SERS backgrounds (here comparablein strength to the SERS peaks, Appendix F) remain alwaysin the linear regime, for both pulsed and CW excitation,confirming their separate origin to the molecular vibra-tional peaks [43].To isolate the effects of pulsed excitation, we also take
power dependence data on the same samples with CWexcitation at the same wavelength. As observed in previouswork [44,45], at higher intensities irreversible behaviorsappear (see Appendix E). The first effect is the appearanceof sharp extra lines alongside the three main vibrationalmodes of BPT. Unlike the reversible pulsed nonlinear RSregime, these new modes, which are not found in thesolution Raman spectra, are instead both spectrally andtemporally unstable, appearing and evolving very rapidly(<1 s). This indicates more dramatic conformation changesinvolving dynamic bending, flexing, or partial bond break-ing of the molecules (see Appendix H). Comparablechanges are also seen in TERS [46], though driven bycurrent instead of light.Simultaneously with these changes in the vibrational
spectra, the scattering spectra are observed to evolve,with >50 nm redshifts [Fig. 4(a), black points] anddecreasing amplitude of the plasmonic coupled mode.These spectral changes have been previously identifiedwith movement of the metal atoms around the nanoparticle,
increasing the width of the bottom facet in contact with themolecules [37,47]. Diffusion of Au atoms was also sug-gested in [44], though the mechanism suggested therecannot apply here as our NPoM geometry constrains themolecular layer. Recent experiments show that thiol-SAM/gold interfaces typically reconstruct via S─Au─S staplesthat pull atoms from the surface [48,49], thus mixingmolecular and metal atom dynamics. Similar effects forboth pulsed and CW excitation are seen in the Raman andscattering, except that their threshold IC is at 100-foldlower average power for the pulsed case compared to theCW case [Fig. 4(b)]. This suggests that instantaneousphonon occupations (which are larger when pulsed exci-tation is faster than phonon decay than for CW excitation)are more important than any equilibrium heating of thesystem. In situ measurements of the temperatures of metaland molecules show mild > 10 °C temperature rises abovethe same threshold at IC (Appendix K), but these temper-ature rises are not capable of producing the Stokes non-linearity seen above (Appendix L). We note that broadbandCW photocatalysis of ethylene epoxidation for largeensembles of plasmonic gaps also shows superlinear non-linearities in its efficiency at high powers >105 μW=μm2
[50], tentatively assigned to multiexcitation that increasesoccupation of higher vibrational states, and which alignswell with the mechanism outlined here.Our measurements thus show passage from linear to
chemical-transformation regimes under both pulsed andCWexcitation of SERS, but with clear superlinear pumpingof the phonons in the former case starting at dramaticallylower average powers than in CW pumping. It thus appearsthat there may be a link between optomechanical inter-actions and molecule-cavity reconfiguration. We suggestthat this can arise from cooperative movement of goldatoms and molecules seen as chemical changes in thefluctuating vibrational spectra, but verifying this is cur-rently challenging. A number of other mechanisms caninduce bond breaking, such as hot-electron injection[51–54]. Indeed, the threshold for this is expected to belower for pulsed compared to CW excitation, and perhapsone way to discriminate between optomechanical vs hot-electron-driven chemistry is through detailed dependenceon the pumping wavelength.Further progress toward phonon lasing (beyond the
nonlinear precursor observed here) is prevented by suchchemical changes. Vibrationally pumping the molecules toapproach phonon lasing will start to excite high-lyingvibrational states. Phonon populations with n ¼ 0.4(reached here for the modeled data in Fig. 2) have a 1%chance of occupying the n ¼ 3 vibrational state. Since thisis closer in energy to the potential barrier for bond break-ing, the process can be switched on [Fig. 1(a)]. It thusappears that specially designed robust molecules arerequired for optomechanically driven phonon lasing, whichmight survive the vibrational cascade.
FIG. 4. Driven photochemical bond breaking. (a)–(b) Stokes-SERS intensities (left axis) for persistent sharp 1585 cm−1 mode(red points) and new SERS peaks (integrated, blue points) from asingle NPoM for increasing average laser intensity I, with (a) CWand (b) pulsed excitation. The right axis (black points) shows thecorresponding shifts of the coupled plasmon mode in simulta-neous dark-field scattering spectra. Lines are guides for the eye.
ANNA LOMBARDI et al. PHYS. REV. X 8, 011016 (2018)
011016-6

IV. CONCLUSIONS
In summary, we show that ultratight confinement oflight in plasmonic cavities allows access to reversibleoptomechanical driving, which shows the distinct super-linear power dependence of the phonon population that isthe precursor to the molecular parametric instability.Picosecond pulses that excite phonons faster than theydecay are needed to pump the vibrational populationsufficiently to observe this. We derive the optomechanicaltheory for this interaction, and we show that it hasdifferent behaviors in CW and picosecond pumpingregimes. We find that our model can account for thenonlinear dependence of the SERS emission, and that itsuggests that ∼100 molecules act together optomechani-cally in their interaction with the tightly confined plas-mons. At larger pumping rates, however, permanentmolecule changes are induced that terminate this phononamplification process. We emphasize that very similareffects are also observed when we use silver nanostruc-tures, nanoparticles of different sizes, or different thiolmolecules. Our study highlights an intimate connectionbetween the optomechanical and chemical processes insuch highly confined plasmonic cavities. Our resultssuggest new approaches for understanding the dynamicsof optomechanics in nanoscale systems, for making robustSERS architectures for sensing (particularly at highintensities in order to study fast dynamics) as well asstimulating new studies of fundamental molecule-surfaceinteractions, for instance, in catalysis. This work alsosuggests that new reaction chemistries might be accessedby driving specific phonons optomechanically when con-fining light tightly with molecules.
ACKNOWLEDGMENTS
We acknowledge financial support from EPSRC GrantsNo. EP/G060649/1, No. EP/K028510/1, No. EP/L027151/1, No. EP/G037221/1, No. EPSRCNanoDTCEP/L015978/1, and ERC Grant No. LINASS 320503. M. K. S. and J. A.acknowledge support fromMINECO Project No. FIS2016-80174-P and the COST Action MP1403 “NanoscaleQuantum Optics” supported by COST (European Co-operation in Science and Technology). M. S. acknowledgessupport from the Australian Research Council (ARC)Discovery Project No. DP160101691. F. B. acknowledgessupport from the Winton Programme for the Physics ofSustainability. We thank Dr. Guolei Xiang (University ofCambridge, Chemistry Department) for support with theTGA measurements.
APPENDIX A: EXPERIMENTAL METHODS
1. Sample preparation
Gold substrates are prepared by evaporating 100-nm gold(Kurt J. Lesker Company, PVD 200) on a silicon (100) wafer
(Si-Mat, Germany) at a rate of 1 Å=s. To obtain atomicallysmooth films, a standard template-stripping method is used:silicon substrates are glued to the freshly evaporated goldusing an epoxy glue (EpoTek 377) [55] and the resultinggold-epoxy-silicon sandwich is peeled off the silicon wafer.Self-assembled monolayers of biphenyl-4-thiols (Sigma-Aldrich, 97%) are formed by submerging the freshlytemplate-stripped substrates into a 1-mM solution inwater-free ethanol (Sigma-Aldrich, reagent grade, anhy-drous) for 24 h (for the other SAM layers, see Ref. [39]).The samples are subsequently thoroughly rinsedwith ethanoland blown dry. 80-nm gold nanoparticles (BBI solutions,UK) are deposited by drop casting from the as-receivedsolution. Thedeposition time is adjusted in order to obtain thedesired nanoparticle coverage. The samples are rinsed withmilliQ water in order to remove any salt residues.
2. Dark-field spectroscopy
Dark-field images are measured on a custom OlympusGX51 inverted microscope. A focused halogen lamp isused for illumination. The scattered light is collectedthrough a 100 × dark-field objective (LMPLFLN-BD,NA ¼ 0.8) and analyzed with a fiber-coupled (50-μmoptical fiber) Ocean Optics QE65000 cooled spectrometer.A standard diffuser is used as a reference to normalize thewhite light scattering.
3. Power-dependent SERS measurements
SERS experiments are performed on the same modifiedOlympus GX51 inverted microscope used for dark-field spectroscopy. The laser beam is focused downto approximately a 1-μm spot size on the sample using a100 × objective (NA ¼ 0.8). Raman scattering is collectedthrough the same objective and analyzed with a ShamrockSR-303i fully automated spectrometer coupled with anEMCCD camera cooled to −85°C. For the current experi-ments, we use a 600-lines/mm 650-nm-blazed grating.Rayleigh scattering is filtered out with a replaceable setof three long pass (for Stokes measurements) or short pass(for anti-Stokes measurements) linear variable filters(DELTA). This spectral filtering system allows the detectionof a minimum Raman shift of 400 cm−1 over the studiedspectral range. The system is calibrated using a siliconsubstrate as a reference. We use a He-Ne 633-nm laser and atunable ultrafast optical parametric oscillator (SpectraPhysics Inspire) tuned to 633 nm for continuous and pulsedexcitation, respectively. The parametric oscillator is pumpedby a 200-fs Ti:sapphire oscillator (Spectra Physics MaiTaidelivering 200-fs pulses, FWHM 10 nm, at an 80-MHzrepetition rate). The monochromaticity of the output beamis reduced below 1-nm spectral bandwidth using an aco-usto-optic programmable dispersive broadband filter(AOPDF, Dazzler, Fastlite [56]). This filter uses interactionsbetween polychromatic acoustic and optical waves within a
PULSED MOLECULAR OPTOMECHANICS IN PLASMONIC … PHYS. REV. X 8, 011016 (2018)
011016-7
birefringent crystal, is fully automated, and provides averageoutput powers of several mW for the ps pulses.
4. SERS time series
SERS time series (integration time 1 s) are recordedusing a modified Olympus BX51 microscope equippedwith a long-working-distance 100× (NA ¼ 0.8) objective.Nanoparticles are identified by dark-field microscopy. Torecord the SERS spectra, a fully motorized homebuiltRaman spectrometer is coupled to the microscope. Aspectrally filtered 632.8-nm He-Ne laser (maximum output21 mW) is used as the excitation source. The elasticallyscattered laser light is filtered with two Semrock 633-nmStopLine single-notch filters. The signal is coupled into anAndor Shamrock i303 spectrograph and Newton EMCCD.The laser is focused to a diffraction-limited spot on thesample, and the laser intensity is adjusted through amotorized ND filter wheel.
APPENDIX B: LASER-POWER-DEPENDENTRAMAN STUDY OF SILICON
The Raman signal from a silicon sample is measuredfor increasing laser powers. We use a continuous-wave633-nm He─Ne laser and repeat with a pulsed tunableoptical parametric oscillator tuned to the same wavelength(Fig. 5). In both cases, the Raman signal increaseslinearly with laser power, and identical signal amplitudesare obtained. This linear dependence is preserved also inthe “nonlinear” and “chemically driven” regions observedin the NPoM geometry at the same powers. This differ-ence cannot be explained by any simply classical theoryof heating (according to which a nonlinear increaseshould be observed for increasing laser powers in allcases), but only by considering the absence of a plas-monic cavity and strong optomechanical coupling in thebulk silicon case.
APPENDIX C: LASER-POWER-DEPENDENTRAMAN STUDY OF BULK
BIPHENYL-4-THIOLS
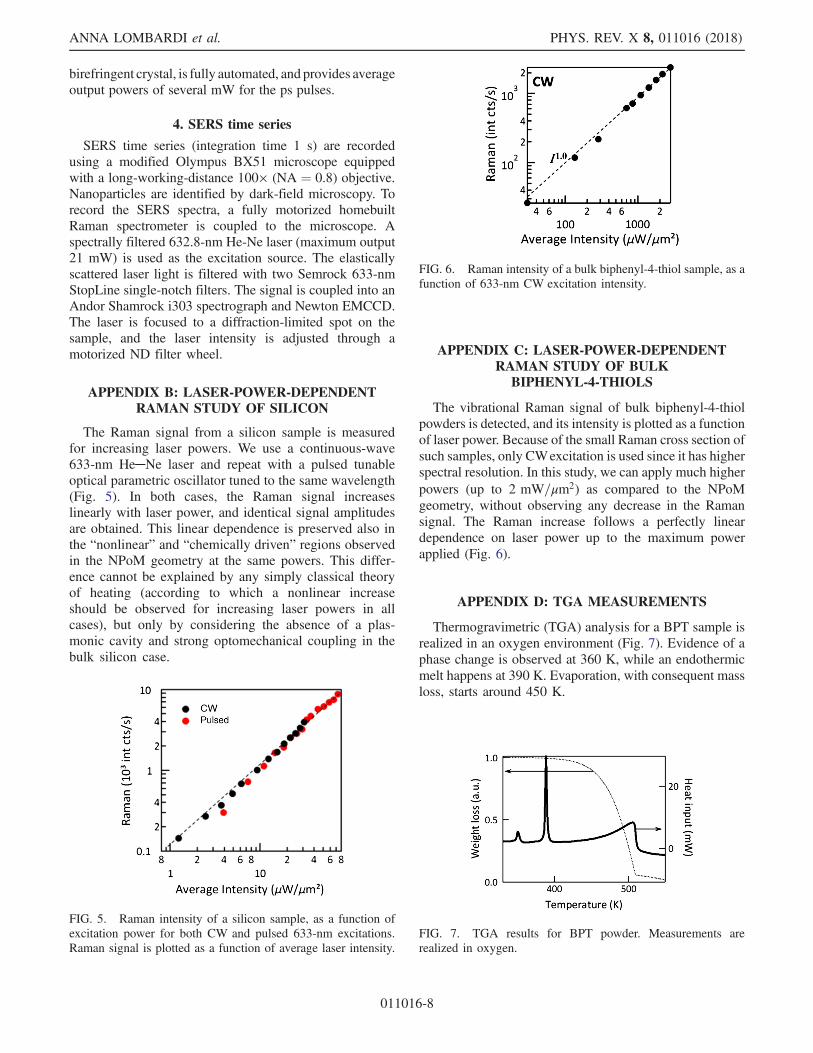
The vibrational Raman signal of bulk biphenyl-4-thiolpowders is detected, and its intensity is plotted as a functionof laser power. Because of the small Raman cross section ofsuch samples, only CWexcitation is used since it has higherspectral resolution. In this study, we can apply much higherpowers (up to 2 mW=μm2) as compared to the NPoMgeometry, without observing any decrease in the Ramansignal. The Raman increase follows a perfectly lineardependence on laser power up to the maximum powerapplied (Fig. 6).
APPENDIX D: TGA MEASUREMENTS
Thermogravimetric (TGA) analysis for a BPT sample isrealized in an oxygen environment (Fig. 7). Evidence of aphase change is observed at 360 K, while an endothermicmelt happens at 390 K. Evaporation, with consequent massloss, starts around 450 K.
FIG. 5. Raman intensity of a silicon sample, as a function ofexcitation power for both CW and pulsed 633-nm excitations.Raman signal is plotted as a function of average laser intensity.
FIG. 6. Raman intensity of a bulk biphenyl-4-thiol sample, as afunction of 633-nm CW excitation intensity.
FIG. 7. TGA results for BPT powder. Measurements arerealized in oxygen.
ANNA LOMBARDI et al. PHYS. REV. X 8, 011016 (2018)
011016-8

APPENDIX E: CW SERS TIME SERIES IN AIRAND VACUUM CONDITIONS
The chemical transformation regime observed for pulsedexcitation is seen also for CW pumping >200 μW=μm2.We track the time evolution of S-SERS for individual goldNPoMs with BPT spacers in the CW case, identifying hownew Raman lines appear sequentially [Fig. 8(a), red arrowson grey spectra]. Such behaviors have been seen previouslyin tightly confined plasmonic geometries [44,45]. Thelinear increase of the Raman transition signals with incidentpower already discussed at low intensities [Fig. 2(c)] ispreserved up to 130 μW=μm2 [Fig. 8(b)]. For higherintensities, the first effect is the appearance of sharp extralines alongside the three main vibrational modes of BPT[Figs. 8(a),(c)–(e)]. The reversible pulsed nonlinear RSregime for pulsed excitation does not apply to these newmodes, which are instead both spectrally and temporallyunstable. They appear and evolve very rapidly, often lastingonly a few seconds [Figs. 8(a) and 8(d), vertical arrows].
These new vibrational frequencies are not found in solutionRaman spectra and indicate more dramatic conformationchanges involving dynamic bending, flexing, or partialbond breaking of the molecules [57].Despite their intensity and spectral position changing
dramatically for subsequent acquisitions (on the sameparticle), the intensity threshold for the chemical regimeat which these lines start is very consistent (IC ≈300 μW=μm2) for different nanoparticles.Repeating these measurements under vacuum gives iden-
tical results with identical rates. The SERS time series arerealized on single NPoMs at low-pressure (<1 mbar) con-ditions,with increasingCWlaserpowers (Fig.9).Despite thestrong reduction of oxygen from the system (althoughsurface bound oxygen might still be present), strong addi-tional Raman lines rise at the same power threshold asrecorded in ambient conditions, and at the same rate. Thisexperiment suggests that the observed extra lines in theRaman spectrum are unlikely to be due to chemical productsfrom oxidation reactions within the plasmonic nanogap.The extra Raman lines arise at the same IC if a
conducting BPDT molecular spacer is used, suggestingthat the precise nature of the spacer has little influence onthe final activation of the chemical regime. Gradually withfurther dosage, the extra lines start to fill the entire windowbetween the initial Raman peaks, giving rise to a smoothbackground that must arise from the different configura-tions and chemical states of the 100 or so molecules in theplasmonic gap [Fig. 8(e)]. No such Raman effects are seenif bulk BPT powder is irradiated (Appendix C), indicatingthe importance of the plasmonic nanocavity in reaching thechemical regime. Previous work [44] has suggested theemergence of repeatable and correlated peaks, implicating aspecific chemical reaction, in contrast to the appearance oflines in each case at different vibrational energies that weobserve here.
FIG. 8. Appearance of new Stokes-SERS lines in drivenchemical regime. (a) S-SERS spectra at increasing times (3 sapart) from a single 80-nm gold nanoparticle-on-mirror showingevolution of new Raman modes (red arrows) for I ¼600 μW=μm2 CW 633-nm excitation alongside main BPTRaman modes. S-SERS time series for the same NPoM forincreasing intensities (in μW=μm2): (b) 130, (c) 260, (d) 600,(e) 1200. The box in (d) shows spectra selected in (a).
FIG. 9. SERS time series from a single 80-nm gold nanoparticleon mirror for 300 μW=μm2 CW 633-nm laser excitation. Strongadditional Raman lines (vertical arrows) arise and disappear intime, existing alongside the constant main BPT Raman modes.
PULSED MOLECULAR OPTOMECHANICS IN PLASMONIC … PHYS. REV. X 8, 011016 (2018)
011016-9

As new Raman lines appear, filling in the gaps betweenthevibrational resonances of the pristinemolecular layer, theoriginal SERS lines drop in intensity (red points in Fig. 4). Itappears that the ordered molecules in the gap are thusgradually transformed into new species, with the delocalizedπ-orbitals successively being saturated. However, the SERSspectrum of every molecule is different, indicating theirheterogeneous environments and bonding. This creates afinal Raman continuum that resembles that of amorphouscarbon (Fig. 10). In Appendix H, we provide densityfunctional theory (DFT) calculations that show how differ-ent torsions, reconfigurations, and reactions can producenewRamanmodes that sit in the spectral regions observed inthe data (Figs. 8 and 9). Most surprising is the fact that thetotal integrated Raman emission increases through thisprocess (see the blue points in Fig. 4), which suggests thatthe Raman cross sections of the molecules grow as theirbonds reconfigure. These results thus suggest the manyways that permanent molecular changes give rise to the newmodes observed.
APPENDIX F: SERS POWER SERIESON DIFFERENT PARTICLES
(CW EXCITATION)
The relative intensities of the 1580-cm−1 Raman modedetected from several isolated nanoparticles on the mirrorare extracted and plotted as a function of increasing averagelaser power for CW excitation (Fig. 11, left axis). Allparticles show a similar decrease in Raman intensity abovea specific power threshold. The SERS background, on theother hand, always shows a linear increase with laser power(Fig. 11, right axis).
APPENDIX G: SINGLE-PARTICLESEM-OPTICAL MEASUREMENT
CORRELATIONS
The scattering spectrum of each measured gold nano-particle is characterized through dark-field spectroscopy. Atypical optical image of the sample is shown in Fig. 12(a).Each spot corresponds to an isolated particle on the goldsubstrate. The isolated nature of each particle is verifiedthrough scanning electron microscopy (SEM) measure-ments [Fig. 12(b)].
APPENDIX H: DFT CALCULATIONS
DFT calculations were performed to understand howmodified molecules in the SAM can give rise to newvibrational lines in the regions observed. Structures wereoptimized and vibrational spectra were calculated using theGaussian implementation of the B3LYP hybrid functional,augmentedwith a damped empirical dispersion term (GD3),using the LANL2DZ basis set (Fig. 13). The polarizablecontinuum model (CPCM) source field for water was usedas a solvation model to simulate the possible presence ofwater in the system. The torsion range in the geometry wasrealized by fixing the dihedral angle between the two phenylrings during geometry optimization. The proposed cross-linked structures are in part based on the cross-linking ofBPT, forming carbon nanomembranes, known from liter-ature [58].
FIG. 10. SERS spectra from a single 80-nm gold nanoparticle-on-mirror for a CW 633-nm low-power I ¼ 260 μW=μm2 (blackcurve) and high-power I ¼ 1200 μW=μm2 (red filled curve)excitation. Raman of a 1-nm-thick amorphous carbon layer ongold is also shown (blue line) as a comparison.
FIG. 11. Extracted relative intensity of the 1580-cm−1 Ramanmode detected from five individual NPoM (solid dots, left axis)and SERS background extracted at 2000 cm−1 (open dots, rightaxis), as a function of increasing CW laser power. Points ofdifferent color correspond to different nanoparticles.
FIG. 12. (a) Dark-field optical image of a gold film with 80-nmgold nanoparticles deposited on top. (b) SEM image of the singleparticle highlighted in (a).
ANNA LOMBARDI et al. PHYS. REV. X 8, 011016 (2018)
011016-10

APPENDIX I: MOLECULAR OPTOMECHANICS:THEORETICAL FRAMEWORK
Recently, Roelli et al. [19], Schmidt et al. [20], and Benzet al. [8] suggested that the SERS process can be describedin terms of a mechanical oscillator coupled to a cavity. Inbrief, Schmidt et al. considered the full optomechanicalHamiltonian given in Eq. (1) and provided a straightfor-ward analytical solution in the case that the couplingstrength of the oscillator to the cavity g0 is much smallerthan both the energy of the molecular vibration ωm and thespectral width of the cavity κ (which is the case in oursystem) [8,20,40]. We show here the equations required toreproduce Fig. 2 (main text) for CW as well as for pulsedillumination.
Within the theoretical framework of molecular optome-chanics, the Stokes and anti-Stokes intensities SS and SASare given by
SS ∝ ðωl − ωmÞ4Γþðnphon þ 1Þ ðI1Þ
SAS ∝ ðωl þ ωmÞ4Γ−nphon; ðI2Þ
where nphon is an incoherent phonon population(see discussion below), and parameters Γ� ¼g20nplκ½ðωc−ωl�ωmÞ2þðκ=2Þ2�−1 describe the rates ofStokes and anti-Stokes transitions mediated by the plasmonin a single-cavity mode limit. The parameter npl describes
FIG. 13. Simulated 3D molecular structures for different BPT configurations and their corresponding Raman activity (below).(a)–(g) Molecular torsion (0–90°) around central carbon linker for a single molecule. (h) Effect of the addition of an extra gold atom.(i)–(l) Possible cross-linked structures between neighboring BPT molecules after irradiation: (i) C8-C9 dimerization, (j) C1-C8dimerization, (k) C8-C11 dimerization, and (l) C1-C8-C9 with ring-opening dimerization.
PULSED MOLECULAR OPTOMECHANICS IN PLASMONIC … PHYS. REV. X 8, 011016 (2018)
011016-11

the plasmon population in the nanocavity. To goodapproximation, if the coherent pumping A is approximatelyconstant on the time scale of the plasmon lifetime (i.e., forCW illumination or for 1-ps Gaussian pulses incident on atypical plasmonic cavity), this population is given by [40]
nplðtÞ ¼ jαðtÞj2 ¼ jAðtÞj2Δ2 þ ðκ=2Þ2 ðI3Þ
with the laser detuning from the plasmonic cavity Δ ¼ωc − ωl (with ωc cavity resonance frequency and ωl laserfrequency), the spectral width of the cavity κ, so that thecoherent pumping AðtÞ drives the cavity into a coherentstate with amplitude αðtÞ. In the case of pulsed illumina-tion, the Stokes and anti-Stokes transition rates Γ� aretherefore implicitly time dependent through the evolutionof nplðtÞ, and follow closely the temporal shape of thepulse. We illustrate the effect of such a pulsed illuminationon the dynamics of phonons in Appendix J.The coherent pumping amplitude AðtÞ can be calculated
using the effective mode volume of the plasmonic cavityVeff , the permittivity of the molecular layer ϵg, themaximum near-field enhancement of the electric field inthe plasmonic cavity K, and the laser power density I [59]:
A ¼ κ
2
ffiffiffiffiffiffiffiffiffiffiffiffiffiffiffiffiϵgϵ0Veff
2ℏωc
sK
ffiffiffiffiffiffiffiffiffi2Iϵ0c
:
sðI4Þ
Here we use the following parameters for our exper-imental setup: laser wavelength 633 nm, cavity resonancewavelength 720 nm (bonding-dimer plasmon mode),ℏκ ¼ 0.2 eV, permittivity of ϵg ¼ 2.10, Veff ¼ 153 nm3,and K ¼ 206 (determined carefully from finite differencetime-domain (FDTD) simulations at this wavelength).Because of the spontaneous nature of the Stokes and
anti-Stokes emission (albeit initiated by the absorption of areal cavity plasmon), the vibrations will be in a displacedthermal state, with a negligible coherent amplitude β and athermal-like incoherent population nphon evolving in timeaccording to the rate equation given in Eq. (2) (note thatjβj2≪nphon; see [40] for a detailed discussion). The con-tribution to population due to the finite temperature of theenvironment is given by nth ¼ ½expðℏωm=ðkBTÞÞ − 1�−1(with kB the Boltzmann constant, and T the absolutetemperature). Under CW illumination, Eq. (2) can besolved to yield the steady-state phonon population givenin Eq. (3), with the second term often expressed as
Γopt
γm þ Γoptnrad; where nrad ¼
ðΔ − ωmÞ2 þ ðκ=2Þ24Δωm
:
1. Calculation of the coupling strength
The coupling strength g0 is determined both by theproperties of the molecules and the properties of the cavity.
Assuming that the molecule is optimally positioned andoriented in the cavity, the maximum coupling parameter isdefined as
g0 ¼1
2
ffiffiffiffiffiffiffiffiffiℏRk
2ωm
sωc
ϵ0ϵgVeffðI5Þ
with Raman activity Rk, and the vacuum permittivity ϵ0[20]. From DFT simulations, we find that the Ramanactivity of the mode used here (1585 cm−1) isRk ¼ 5085 Å4=amu. We note that this formula includesan additional factor of ½ absent in previous formulations[8,19,20] as we did not account there for the fact that theRaman dipole is not a permanent dipole, but is ratherinduced by the electric field of the plasmonic cavity. Thiscalculation yields the single-plasmon optomechanical cou-pling ℏg0 ¼ 0.38 meV.
2. Effects of collective coupling
For a distribution of Nm molecules coupled to the cavity,one can expect the formation of a superradiant phononicsystem with effective coupling given by g0
ffiffiffiffiffiffiffiNm
p[19].
Furthermore, the Raman emission linewidths should thenbecome γm þ Nγopt. For Nm ¼ 100 molecules, we wouldthen have a coupling strength of ℏg0
ffiffiffiffiffiffiffiNm
p ¼ 3.8 meV. Thiscoupling is much smaller than both the spectral width of thecavity (200 meV) and the vibrational energy of themolecular vibration considered here (197 meV); therefore,for such small values of collective coupling, we can apply alinearization procedure and obtain the corresponding laserpower thresholds for superlinear behavior. Such an esti-mation, however, provides threshold values for the criticallaser intensity that are Nm times smaller than thosecorresponding to the single-molecule coupling. The exper-imental threshold found in our NPoMs under pulsedillumination [Fig. 2(c) of the main text] matches theestimated collective single-photon coupling g0 withNm ≈ 220, supporting our previous assertion that thecoherent coupling between molecular vibrations in distinctmolecules is observed. The overestimate in g0 (by around50%) is likely due to the dependence on the estimatedRaman activity, which is notoriously difficult to calculatefor molecules positioned near metallic interfaces.Inaccuracies in g0 can also arise from the estimate of themode volume used.
APPENDIX J: OPTOMECHANICALDYNAMICS UNDER PULSED
ILLUMINATION
In this section, we discuss the relationship between thecharacteristics of the SERS system observed under CWandpulsed illumination. The length of the optical pulses(approximately 1 ps) falls in between the temporal char-acteristics of the evolution of plasmons and phonons. In
ANNA LOMBARDI et al. PHYS. REV. X 8, 011016 (2018)
011016-12

Fig. 14, we show the evolution of plasmon and phononpopulations as the system (which remains in thermody-namic equilibrium with the environment) is illuminated bya coherent 1-ps Gaussian pulse. The populations ofphonons are calculated by solving the relevant rate equa-tions derived from the linearized master equation given inthe main text. On the other hand, the population ofplasmons npl is calculated by a rate equation accountingonly for the coherent pumping and cavity decay:
ddt
αðtÞ ¼ ð−iΔ − κ=2ÞαðtÞ þ AðtÞ. ðJ1Þ
This description is correct for the weakly coupled opto-mechanical system with the hierarchy of lifetimes as inmolecular optomechanics.From the results in Fig. 14, it is clear that the vibrations
of the molecule will not be able to reach a steady state whenilluminated by a 1-ps pulse, irrespective of its temporalshape. However, the effect of reducing the decay rate ofphonons, which leads to the nonlinearities observed in theS-SERS experiments, does not require the vibrations toreach the steady state. In fact, as we discuss elsewhere indetail [40], this effect arises from the modification of theStokes and anti-Stokes transition rates due to the couplingof the molecule to the plasmonic cavity. A convenientdescription of this modification of the phonon transitionrates, expressed through Γeff , requires only that the plas-monic cavity remains in a coherent state.We note that the largest peak intensities yielding the
peak optomechanical damping −ΓoptðtÞ=γm > 1 describe asituation in which phonons are generated faster than they
decay. In consequence, in the CW case, the system reachesinstability. However, for pulsed illumination, this effectsimply accelerates the phonon buildup, but the systemremains stable [Fig. 2(b)]. In this case, the free-spacephonon decay rate γm does not govern the onset of thenonlinearity, as the buildup of the phonon populationover the pulse length is determined by the effectivepumping g0AðtÞ, rather than the steady-state expressionΓopt=ðΓopt þ γmÞ [see Eq. (2)]. We illustrate this effect bycomparing the phonon populations for the largest peaklaser intensity in Fig. 14(b) calculated for the free-spacephonon decay rate ℏγm ¼ 0.07 meV (red solid line), ℏγm ¼0.14 meV (red dotted line), and ℏγm ¼ 0.045 meV (reddashed line). The lines diverge only after the pulse begins todecay, and therefore, they have little effect on the overallintensity of the Raman emission. This observation suggestsinteresting probes more generally of optomechanical sys-tems under pulsed illumination.
APPENDIX K: ESTIMATION OF LOCALTEMPERATURE WITHIN THE PLASMONIC
NANOGAP
To understand fully the thermal state of the system,local temperature changes are extracted from anti-Stokes spectra measured at room temperature on singleNPoMs [Fig. 15(a)]. The gold electron temperature (pre-sumed equilibrated to the lattice) is estimated by fittingthe anti-Stokes background to IbgdAS ðΔωÞ ∝ ½expðℏΔω=kBTÞ − 1�−1 for a frequency difference Δω from the pumpωl. The power regime where SERS increases linearly
FIG. 14. Evolution of the optomechanical SERS system excited by a 1-ps Gaussian pulse. (a) Evolution of plasmon population for fivepeak intensities of the incident laser, logarithmically increasing from 6 × 10² μW=μm2 (yellow line) to 2.5 × 10⁴ μW=μm2 (red line).The shaded area shows normalized optomechanical damping −ΓoptðtÞ=γm, proportional to the instantaneous intensity of the incidentpulse. ΓoptðtÞ is negative, indicating that the system operates in the amplification regime. The plasmonic cavity reacts almostinstantaneously to the coherent pump, with the plasmon population closely following the shape of the incident pulse. (b) Phononpopulation calculated in the same setup, obtained by solving the phonon rate equations. For the largest incident laser intensity, weconsider three values of the free-space phonon decay rate: ℏγm ¼ 0.07 meV is used for all the solid lines, while ℏγm ¼ 0.14 meV(dotted) and ℏγm ¼ 0.045 meV (dashed) are also plotted. In all the cases, the buildup of phonons is much slower than that of plasmons,as the vibrations do not reach a steady state during the duration of the pulse. All the remaining parameters are as discussed in the text.
PULSED MOLECULAR OPTOMECHANICS IN PLASMONIC … PHYS. REV. X 8, 011016 (2018)
011016-13

[Fig. 15(b) blue region RL] shows a negligible temperatureincrease for both CW (white circles) and pulsed (redsquares) excitation. By contrast, in the nonlinear RNLregime [Fig. 15(b) orange region], a linear temperatureincrease is observed, reaching 380 K (CW) and420 K (pulsed) for 300 μW=μm2 excitation. A different“molecular temperature” within the plasmonic nanogap isextracted from the anti-Stokes/Stokes ratio of the strongestline (Fig. 15 arrows), using [8,20,40]
IASIS
¼�ωl þ Δωωl − Δω
�4
× exp
�− ℏΔωkBTeff
�
for the CW case (Fig. 15, black points), which yields theclearest emission peaks. Teff is the effective temperature ofthe vibrational modes and can differ from the actual sampletemperature T. This marked temperature increase for>150 μW=μm2 laser intensities is consistent with previousliterature [60–63] and thought to be from local heating ofthe substrate and analyte due to light absorption in themetal [64]. This thermal heating is unable to account for thenonlinear increase in pulsed Stokes emission (seeAppendix L).The anti-Stokes molecular signals for the phonon occu-
pations here are predicted to be >100-fold weaker than theStokes emission, making them difficult to see in the pulsedregime except for very long integration times, which canlead to degradation of the NPoM structure.Such data in Fig. 16 show that the ratio of Stokes to
anti-Stokes is approximately 160 near the highest powersof the superlinear regime. Comparing to Fig. 2(b) showsthis is in line with that expected from the optomechan-ical model.
APPENDIX L: ESTIMATION OF HEATINGCONTRIBUTIONS TO S-SERS
We will explore an alternative explanation to molecularoptomechanics for the superlinear dependence of theStokes intensity on the peak laser power, in which thenonlinearity is instead due to the strong localized heating ofthe molecule by the laser, leading to the onset of phonon-stimulated Stokes emission, rather than the vanishing ofthe effective decay rate. In that case, the deviation of thepower dependence of the Stokes emission followsSS ∝ Ið1þ nthÞ. Notably, we neglect any contribution fromthe vibrational pumping, as well as the change in theeffective phonon damping rate. Consequently, by inves-tigating the superlinear growth of the Stokes emission, wecan estimate the effective molecular temperature. For thepoints marked in Fig. 2(c) with red circles, the extractedtemperatures are given in Fig. 17. As the derived temper-atures would need to be in excess of 4000 K, we conclude
FIG. 15. (a) SERS intensities from a single NPoM at100 μW=μm2 (blue curve) and 300 μW=μm2 (red curve)633-nm CW excitation, normalized to a 475-cm−1 AS peak.Stokes and corresponding anti-Stokes peaks used in calculationsare highlighted with arrows; anti-Stokes background fits aredashed lines. (b) Local temperature increase vs laser intensity forboth CW (lower axis, circles) and pulsed (upper axis, squares)excitation. Temperature is extracted from the Stokes to anti-Stokes ratio (CW-black circles) or from the anti-Stokes back-ground (white circles for CW, red squares for pulsed). Referencetemperatures from the bulk silicon are shown in grey. Shadingshows linear (blue) and nonlinear (orange) Stokes regimes in thepulsed excitation case.
FIG. 16. Comparison of pulsed SERS from single BPT NPoM for anti-Stokes and Stokes contributions in the nonlinear regime.
ANNA LOMBARDI et al. PHYS. REV. X 8, 011016 (2018)
011016-14

that the superlinear Stokes signal cannot be explained as anemission stimulated by the incoherent population of ther-mal phonons.
[1] F. M. Hoffmann, Infrared Reflection-Absorption Spectros-copy of Adsorbed Molecules, Surf. Sci. Rep. 3, 107 (1983).
[2] D. J. Nesbitt, High-Resolution Infrared Spectroscopy ofWeakly Bound Molecular Complexes, Chem. Rev. 88,843 (1988).
[3] S. Nie and S. R. Emory, Probing Single Molecules andSingle Nanoparticles by Surface-Enhanced Raman Scatter-ing, Science 275, 1102 (1997).
[4] K. Kneipp, H. Kneipp, I. Itzkan, R. R. Dasari, and M. S.Feld, Ultrasensitive Chemical Analysis by Raman Spectros-copy, Chem. Rev. 99, 2957 (1999).
[5] X. Zhang, Q. H. Tan, J. B. Wu, W. Shi, and P. H. Tan,Review on the Raman Spectroscopy of Different Types ofLayered Materials, Nanoscale 8, 6435 (2016).
[6] K. Kneipp, Y. Wang, H. Kneipp, L. T. Perelman, I. Itzkan,R. R. Dasari, and M. S. Feld, Single Molecule DetectionUsing Surface-Enhanced Raman Scattering (SERS), Phys.Rev. Lett. 78, 1667 (1997).
[7] J. P. Gordon, H. J. Zeiger, and C. H. Townes, The Maser—New Type of Microwave Amplifier, Frequency Standard,and Spectrometer, Phys. Rev. 99, 1264 (1955).
[8] F. Benz, M. K. Schmidt, A. Dreismann, R. Chikkaraddy, Y.Zhang, A. Demetriadou, C. Carnegie, H. Ohadi, B. de Nijs,R. Esteban, J. Aizpurua, and J. J. Baumberg, Single-Molecule Optomechanics in “Picocavities”, Science 354,726 (2016).
[9] H. Okamoto, T. Watanabe, R. Ohta, K. Onomitsu, H. Gotoh,T. Sogawa, and H. Yamaguchi, Cavity-Less On-ChipOptomechanics Using Excitonic Transitions in Semicon-ductor Heterostructures, Nat. Commun. 6, 8478 (2015).
[10] A. Schmidsfeld and M. Reichling, Controlling the Opto-Mechanics of a Cantilever in an Interferometer via CavityLoss, Appl. Phys. Lett. 107, 123111 (2015).
[11] K. E. Grutter, M. I. Davanco, and K. Srinivasan, Slot-ModeOptomechanical Crystals: A Versatile Platform for Multi-mode Optomechanics, Optica 2, 994 (2015).
[12] A. Schliesser, R. Riviere, G. Anetsberger, O. Arcizet, andT. J. Kippenberg, Resolved-Sideband Cooling of a Micro-mechanical Oscillator, Nat. Phys. 4, 415 (2008).
[13] S. Weis, R. Riviere, S. Deleglise, E. Gavartin, E. Arcizet, A.Schliesser, and T. J. Kippenberg,Optomechanically InducedTransparency, Science 330, 1520 (2010).
[14] O. Graydon, Optomechanics: Enhanced Cavities, Nat.Photonics 7, 167 (2013).
[15] A. G. Kuhn, M. Bahriz, O. Ducloux, C. Chartier, O. LeTraon, T. Briant, P. F. Cohadon, A. Heidmann, C. Michel, L.Pinard, and R. A. Flaminio, Micropillar for Cavity Opto-mechanics, Appl. Phys. Lett. 99, 121103 (2011).
[16] J. Chan, T. P. Mayer Alegre, A. H. Safavi-Naeini,J. T. Hill, A. Krause, S. Groblacher, M. Aspelmeyer, andO. Painter, Laser Cooling of a Nanomechanical Oscillatorinto its Quantum Ground State, Nature (London) 478, 89(2011).
[17] J. Zheng, Y. Li, M. S. Aras, A. Stein, K. L. Shepard, andC.W. Wong, Parametric Optomechanical Oscillations inTwo-Dimensional Slot-Type High-Q Photonic CrystalCavities, Appl. Phys. Lett. 100, 211908 (2012).
[18] A. Butsch, R. Koehler, R. E. Noskov, and P. S. J. Russel,CW-Pumped Single-Pass Frequency Comb Generation byResonant Optomechanical Nonlinearity in Dual-NanowebFiber, Optica 1, 158 (2014).
[19] P. Roelli, C. Galland, N. Piro, and T. J. Kippenberg,Molecular Cavity Optomechanics as a Theory ofPlasmon-Enhanced Raman Scattering, Nat. Nanotechnol.11, 164 (2016).
[20] M. K. Schmidt, R. Esteban, A. Gonzalez-Tudela, G. Giedke,and J. Aizpurua, Quantum Mechanical Description ofRaman Scattering from Molecules in Plasmonic Cavities,ACS Nano 10, 6291 (2016).
[21] R. Zhang, Y. Zhang, Z. Dong, S. Jiang, C. Zhang, L. Chen,L. Zhang, Y. Liao, J. Aizpurua, Y. Luo, J. Yang, and J. Hou,Chemical Mapping of a Single Molecule by Plasmon-Enhanced Raman Scattering, Nature (London) 498, 82(2013).
[22] T. J. Kippenberg, H. Rokhsari, T. Carmon, A. Scherer, andK. J. Vahala, Analysis of Radiation-Pressure InducedMechanical Oscillation of an Optical Microcavity, Phys.Rev. Lett. 95, 033901 (2005).
[23] T. Carmon, H. Rokhsari, L. Yang, T. J. Kippenberg, andK. J. Vahala, Temporal Behavior of Radiation Pressure-Induced Vibrations of an Optical Microcavity PhononMode, Phys. Rev. Lett. 94, 223902 (2005).
[24] F. Marquardt, J. G. E. Harris, and S. M. Girvin, DynamicalMultistability Induced by Radiation Pressure in High-Finesse Micromechanical Optical Cavities, Phys. Rev. Lett.96, 103901 (2006).
[25] K. Kneipp, Y. Wang, H. Kneipp, L. T. Perelman, I. Itzkan,R. R. Dasari, and M. S. Feld, Single Molecule DetectionUsing Surface-Enhanced Raman Scattering (SERS), Phys.Rev. Lett. 78, 1667 (1997).
FIG. 17. Estimation of the effective temperature from theStokes intensity under pulsed illumination for the data shownwith red circles in Fig. 2(c), when optomechanical interactionsare not accounted for. Unrealistically high temperatures areobtained in such a case.
PULSED MOLECULAR OPTOMECHANICS IN PLASMONIC … PHYS. REV. X 8, 011016 (2018)
011016-15

[26] H. Xu, E. J. Bjerneld, M. Kall, and L. Borjesson, Spectros-copy of Single Haemoglobin Molecules by SurfaceEnhanced Raman Scattering, Phys. Rev. Lett. 83, 4357(1999).
[27] P. L. Stiles, J. A. Dieringer, N. C. Shah, and R. P. VanDuyne, Surface-Enhanced Raman Spectroscopy, Annu.Rev. Anal. Chem. 1, 601 (2008).
[28] A. Lombardi, A. Demetriadou, L. Weller, P. Andrae, F.Benz, R. Chikkaraddy, J. Aizpurua, and J. J. Baumberg,Anomalous Spectral Shift of Near- and Far-Field PlasmonicResonances in Nanogaps, ACS Photonics 3, 471 (2016).
[29] J. C. Love, L. A. Estroff, J. K. Kriebel, R. G. Nuzzo, andG.M. Whitesides, Self-Assembled Monolayers of Thiolateson Metals as a Form of Nanotechnology, Chem. Rev. 105,1103 (2005).
[30] W. Zhu and K. B. Crozier, Quantum Mechanical Limit toPlasmonic Enhancement as Observed by Surface-EnhancedRaman Scattering, Nat. Commun. 5, 5228 (2014).
[31] X. S. Zheng, P. Hu, J. H. Zhong, C. Zong, X.Wang, B. J. Liu,and B. Ren, Laser Power Dependent Surface-EnhancedRaman Spectroscopic Study of 4-Mercaptopyridine onUniform Gold Nanoparticle-Assembled Substrates, J. Phys.Chem. C 118, 3750 (2014).
[32] Y. Kitahama, Y. Tanaka, T. Itoh, and Y. Ozaki, Power-LawAnalysis of Surface-Plasmon-Enhanced ElectromagneticField Dependence of Blinking SERS of Thiacyanine orThiacarbocyanine Adsorbed on Single Silver Nanoaggre-gates, Phys. Chem. Chem. Phys. 13, 7439 (2011).
[33] L. Kang, P. Xu, B. Zhang, H. Tsai, X. Han, and H. L. Wang,Laser Wavelength- and Power-Dependent Plasmon-DrivenChemical Reactions Monitored Using Single ParticleSurface Enhanced Raman Spectroscopy, Chem. Commun.(Cambridge) 49, 3389 (2013).
[34] K. T. Crampton, A. Zeytunyan, A. S. Fast, F. T. Ladani, A.Alfonso-Garcia, M. Banik, S. Yampolsky, D. A. Fishman,E. O. Potma, and V. Ara Apkarian, Ultrafast CoherentRaman Scattering at Plasmonic Nanojunctions, J. Phys.Chem. C 120, 20943 (2016).
[35] J. K. Daniels and G. Chumanov, Nanoparticle-MirrorSandwich Substrates for Surface-Enhanced Raman Scatter-ing, J. Phys. Chem. B 109, 17936 (2005).
[36] S. Mubeen, S. Zhang, N. Kim, S. Lee, S. Kramer, H. Xu,and M. Moskovits, Plasmonic Properties of Gold Nano-particles Separated from a Gold Mirror by an UltrathinOxide, Nano Lett. 12, 2088 (2012).
[37] C. Tserkezis, R. Esteban, D. O. Sigle, J. Mertens, L. O.Herrmann, J. J. Baumberg, and J. Aizpurua, Hybridizationof Plasmonic Antenna and Cavity Modes: Extreme Optics ofNanoparticle-on-Mirror Nanogaps, Phys. Rev. A 92,053811 (2015).
[38] R. Chikkaraddy, B. de Nijs, F. Benz, S. J. Barrow, O. A.Scherman, E. Rosta, A. Demetriadou, P. Fox, O. Hess, andJ. J. Baumberg, Single-Molecule Strong Coupling at RoomTemperature in Plasmonic Nanocavities, Nature (London)535, 127 (2016).
[39] F. Benz, C. Tserkezis, L. O. Herrmann, B. De Nijs, A.Sanders, D. O. Sigle, L. Pukenas, S. D. Evans, J. Aizpurua,and J. J. Baumberg, Nanooptics of Molecular-ShuntedPlasmonic Nanojunction, Nano Lett. 15, 669 (2015).
[40] M. K. Schmidt, R. Esteban, F. Benz, J. J. Baumberg, and J.Aizpurua, Linking Classical and Molecular OptomechanicsDescriptions of SERS, Faraday Discuss. 205, 31 (2017).
[41] M. Kamandar Dezfouli and S. Hughes, QuantumOptics Model of Surface-Enhanced Raman Spectroscopyfor Arbitrarily Shaped Plasmonic Resonators, ACSPhotonics 4, 1245 (2017).
[42] H.-H. Shin, G. Jin Yeon, H.-K. Choi, S.-M. Park, K. SupLee, and Z. Hwan Kim, Frequency-Domain Proof of theExistence of Atomic-Scale SERS Hot-Spots, Nano Lett.(2017).
[43] J. T. Hugall and J. J. Baumberg, Demonstrating Photo-luminescence from Au Is Electronic Inelastic Light Scatter-ing of a Plasmonic Metal: The Origin of SERS Background,Nano Lett. 15, 2600 (2015).
[44] G. Smith, J.-S. Girardon, J.-F. Paul, and E. Berrier, Dyna-mics of a Plasmon-Activated p-Mercaptobenzoic Acid LayerDeposited over Au Nanoparticles Using Time-ResolvedSERS, Phys. Chem. Chem. Phys. 18, 19567 (2016).
[45] J. Long, H. Yi, H. Li, Z. Lei, and T. Yang, ReproducibleUltrahigh SERS Enhancement in Single DeterministicHotspots Using Nanosphere-Plane Antennas Under Radi-ally Polarized Excitation, Sci. Rep. 6, 33218 (2016).
[46] K.-D. Park, E. A. Muller, V. Kravtsov, P. M. Sass, J. Dreyer,J. M. Atkin, and M. B. Raschke, Variable-TemperatureTip-Enhanced Raman Spectroscopy of Single-MoleculeFluctuations and Dynamics, Nano Lett. 16, 479 (2016).
[47] D. O. Sigle, J. Mertens, L. O. Herrmann, R. W. Bowman, S.Ithurria, B. Dubertret, Y. Shi, H. Y. Yang, C. Tserkezis, J.Aizpurua, and J. J. Baumberg, Monitoring MorphologicalChanges in 2D Monolayer Semiconductors Using Atom-Thick Plasmonic Nanocavities, ACS Nano 9, 825 (2015).
[48] H. Häkkinen, The Gold Sulfur Interface at the Nanoscale,Nat. Chem. 4, 443 (2012).
[49] T. Bürgi, Properties of the Gold-Sulphur Interface: FromSelf-Assembled Monolayers to Clusters, Nanoscale 7, 15553(2015).
[50] P. Christopher, H. Xin, A. Marimuthu, and S. Linic,Singular Characteristics and Unique Chemical BondActivation Mechanisms of Photocatalytic Reactions onPlasmonic Nanostructures, Nat. Mater. 11, 1044 (2012).
[51] D. B. Ingram and S. Linic, Water Splitting on CompositePlasmonic-Metal/Semiconductor Photoelectrodes: Evi-dence for Selective Plasmon-Induced Formation of ChargeCarriers near the Semiconductor Surface, J. Am. Chem.Soc. 133, 5202 (2011).
[52] M. L. Brongersma, N. J. Halas, and P. Nordlander, Plasmon-Induced Hot Carrier Science and Technology, Nat. Nano-technol. 10, 25 (2015).
[53] E. M. van Schrojenstein Lantman, T.Deckert-Gaudig, A. J. G.Mank, V. Deckert, and B.M. Weckhuysen, Catalytic Proc-esses Monitored at the Nanoscale with Tip-Enhanced RamanSpectroscopy, Nat. Nanotechnol. 7, 583 (2012).
[54] M. Kornbluth, A. Nitzan, and T. Seideman, Light-InducedElectronic Non-Equilibrium in Plasmonic Particles, J.Chem. Phys. 138, 174707 (2013).
[55] M. Hegner, P. Wagner, and G. Semenza, Ultrafast Atomi-cally Flat Template-Stripped Au Surfaces for ScanningProbe Microscopy, Surf. Sci. 291, 39 (1993).
ANNA LOMBARDI et al. PHYS. REV. X 8, 011016 (2018)
011016-16

[56] F. Verluise, V. Laude, Z. Cheng, C. Spielmann, and P.Tournois, Amplitude and Phase Control of Ultrashort Pulsesby Use of an Acousto-Optic Programmable Dispersive Filter:Pulse Compression and Shaping, Opt. Lett. 25, 575 (2000).
[57] R. W. Taylor, F. Benz, D. O. Sigle, R. W. Bowman, P. Bao,J. S. Roth, G. R. Heath, S. D. Evans, and J. J. Baumberg,Watching Individual Molecules Flex within Lipid Mem-branes Using SERS, Sci. Rep. 4, 5490 (2014).
[58] W. Geyer, V. Stadler, W. Eck, M. Zharnikov, A. Gölzhäuser,and M. Grunze, Electron-Induced Crosslinking of AromaticSelf-Assembled Monolayers: negative Resists for Nano-lithography, Appl. Phys. Lett. 75, 2401 (1999).
[59] R. Esteban, J. Aizpurua, and G.W. Bryant, Strong Couplingof Single Emitters Interacting with Phononic InfraredAntennae, New J. Phys. 16, 013052 (2014).
[60] R. R. Letfullin, T. F. George, G. C. Duree, and B. M.Bollinger, Ultrashort Laser Pulse Heating of Nanopar-
ticles: Comparison of Theoretical Approaches, Adv. Opt.Technol. 2008, 251718 (2008).
[61] Z. Qin and J. C. Bischof, Thermophysical and BiologicalResponses of Gold Nanoparticle Laser Heating, Chem. Soc.Rev. 41, 1191 (2012).
[62] R. C. Maher, L. F. Cohen, J. C. Gallop, E. C. Le Ru, andP. G. Etchegoin, Temperature-Dependent Anti-Stokes/Stokes Ratios under Surface-Enhanced Raman ScatteringConditions, J. Phys. Chem. B 110, 6797 (2006).
[63] E. A. Pozzi, A. B. Zrimsek, C. M. Lethiec, G. C. Schatz,M. C. Hersam, and R. P. Van Duyne, Evaluating Single-Molecule Stokes and Anti-Stokes SERS for NanoscaleThermometry, J. Phys. Chem. C 119, 21116 (2015).
[64] A. O. Govorov and H. H. Richardson, Generating Heat withMetal Nanoparticles, Nano Today 2, 30 (2007).
PULSED MOLECULAR OPTOMECHANICS IN PLASMONIC … PHYS. REV. X 8, 011016 (2018)
011016-17