physical methods for cultural heritages introduction to vibrational spettroscopy g. valentini
TRANSCRIPT

Physical Methods for Cultural Heritages
Introduction to Vibrational Spettroscopy G. Valentini

Gianluca Valentini
Vibrational spectroscopy
• Vibrational spectroscopy gives information on chemical bounds that are present in a compound
It provides analytical info because the measurement results can be compared with reference spectra and with “spectral signatures” that are collected in large databases
• Vibrational spectroscopy can be divided in:
Infrared Absorption Spectroscopy, also called FTIR (Fourier Transform Infrared) Spectroscopy
Ramam Spectroscopy
• Raman spectroscopy and absorption spectroscopy are complementary investigation techniques
Some molecular vibrations are Raman “active” and FTIR “inactive” and vice versa
G. Valentini 2

Gianluca Valentini
Infrared Absorption Spectroscopy
• It is based on interactions of the electromagnetic radiation with chemical bounds
• The main field of application is the analysis of organic molecules with high molecular weight (polymers)
• IR spectrum provides information about the presence of functional groups (sulphate, carbonate, carbonyl, hydroxyl, amine, etc.)
• In the medium-IR band it is possible to identify both organic and inorganic compounds
• Minimal quantity of the sample are required for the analysis (mg)
4000 3000 2000 1500 1000 400cm-1
16.0
20.0
25.0
30.0
35.0
41.3
%T
Q
Q
C
C
C
Vy
Vy
VyVy
CQ
FT-IR spectrum of a sample of plaster taken from fresco staccati dell’Oratorio Visconteo di Albizzate , XIV secolo (micro-pastiglia di NaCl)
G. Valentini 3

Gianluca Valentini
Simple model of the infrared absorption
• In molecules, the chemical bound exertsan elastic force between atoms
• If the barycentre of the positive charge + doesnot match that of the negative charge – the molecule can absorb IR radiation and vibrate
• Absorption takes place only for discrete frequencies that correspond to the energy separation of vibrational levels
• In the same way the rotation of a moleculecan be triggered by the absorption ofinfrared radiation (this effect mainly takesplace in gases)
• Homonuclear molecules do not show anycharge separation +/- and do not absorbinfrared radiation
G. Valentini 4

Gianluca Valentini
Molecular vibrations
• Molecular vibrations can be divided in two basic types Streatching Bending
• For a molecule made of two atoms havingmasses m1 e m2
• The energetic separation between 2 vibrationalslevels is:
• In terms of wave numbers
• The strenght constant k depends on the bond type (simple, double,..)
• Equation (#) allows one to estimate the spectral band for the IR absorption by a great number of molecular structures
• Beyond the “fundamental band” other absorption bands corresponding to higher harmonics (2, 3) are present with lower intensities
21
21
mmmmk
21
khE
c1
kc2
1(#)
G. Valentini 5

Gianluca Valentini
Measurement devices for IR absorption
• A FTIR spectrometer is made of a radiation source a dispersive element (e.g. diffraction grating) a detection subsystem
• Source usually a blackbody emitter with temperature between 1500 and 2200 K
• tungsten lamp for normal measurements (NIR and MID-IR)• special lamps for far infrared measurements
• Dispersive element It can be based on a diffraction grating like it is in UV/VIS spectrometers
• Usually the double beam configuration is used to compensate for water vapour and e CO2 absorption
Inteferometric method based on the Fourier transform (FTIR)
• Detectors Thermal detectors
• thermocouple, bolometer, pyroelectric detectors Photoconductive detectors
• Thin slabs of semiconductor materials: PbS, PbSe, HgCdTe (77 K)
G. Valentini 6

Gianluca Valentini
The FTIR Spectrometer
• When a monocromatic radiations enters aMichelson interferometer having a mirror thatmoves at speed v, the radiation is modulatedat frequency f:
• Every wavenumber is “encoded” by a frequency f in the range of some kHz
• If the radiation is not monocromatic the oscillations sum up
• The oscillatory components can be recovered by the Fourier Transform
v2v2
f
v = costante < 0.1 m/s
G. Valentini 7

Gianluca Valentini
The FTIR Spectrometer
• One mirror of the Michelson interferometer is moved with great precision
• The laser in the figure emits redradiation to be used for reference
• The sample (2-5 mg) is finely grinded and snterized in a tabletof alkaline halide (KBr)
• The typical measurement range of medium class FTIR is:
Top class instruments:
Resolution
Measurement time
1-1- cm 350 cm 7800 m 29 m 3.1
1-1- cm 10 cm 00502 m 1000 mn 400
1-1- cm 0.01 cm 8
minutes some sec1t
1-1-tipica cm 0.1 cm 1
G. Valentini 8

Gianluca Valentini
FTIR spectra interpretation
• Region of the group frequencies Belongs to the band 3600 cm-1 1250 cm-1 (2.5-8 m) Included absorption peaks of bondings: C=O, C=C, C–H, CC, O–H Allows one to detect the presence of the most important functional
groups of organic molecules Seldom allows the complete identification of a compound
• Region of fingerprints Belongs to the band 1200 cm-1 700 cm-1 (8-14 m) Contains information about the fine structure “fine” of a molecule Sometimes allows the complete identification of a compound
• The identification of a specific material can be performed through pattern matching within suitable digital libreries
G. Valentini 9

Gianluca Valentini
Raman Scattering
• The Raman effect has been discovered by Indian physicists Raman and Krishnan and is caused by the interaction of e.m. radiation with vibrations The spontaneous Raman scattering is a very faint effect that gives rise to
a frequency shift of the scattered radiation In a typical Raman scattering experiment the fraction of the intensity that
undergoes the effect is 10-6-10-7
G. Valentini 10
CCl4Hg lamp

Gianluca Valentini
Spontaneous Raman vs. stimulated Raman
• When the radiation excites molecular vibrations “Stokes” lines appear
• When the radiation interacts with molecules in vibrational excited state “Anti-Stokes” lines appear
• In spontaneous Raman scattering the radiation is scattered in all the directions by independent molecular emitters (no phase relations) The linewidth corresponds to that of the vibrational level
• In stimulated Raman scattering the radiation is scattered in a cone with define aperture and has good coherence properties The molecules emit with phase relations The linewidth depends on the Raman gain and the peak frequency
correspond to the maximum spectral gain
• The linewidth is lower than that of spontaneous Raman scattering
The efficiency of the process can be very high (e.g. 30 %) and the Raman intensity can be comparable with that of the incident laser radiation
G. Valentini 11
Gianluca Valentini
Classical model for Raman scattering
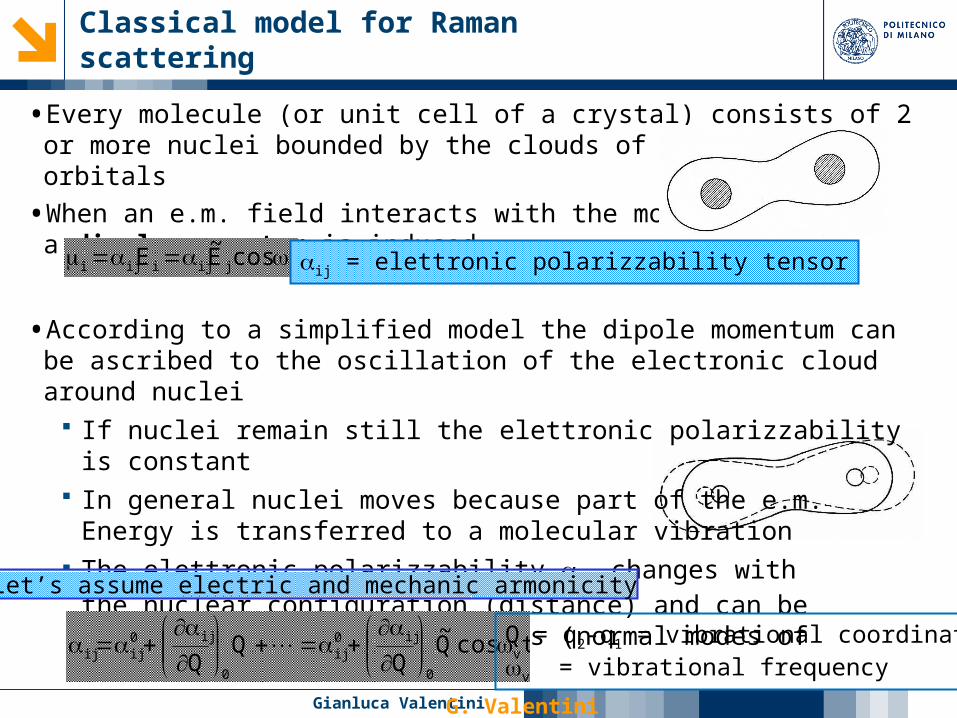
• Every molecule (or unit cell of a crystal) consists of 2 or more nuclei bounded by the clouds of electronic orbitals
• When an e.m. field interacts with the molecule a dipole momentum is induced
• According to a simplified model the dipole momentum can be ascribed to the oscillation of the electronic cloud around nuclei If nuclei remain still the elettronic polarizzability is constant In general nuclei moves because part of the e.m. Energy is transferred
to a molecular vibration The elettronic polarizzability ij changes with
the nuclear configuration (distance) and can beexpressed as a series of terms (normal modes of vibration)
G. Valentini 12
tcosE~E jijiiji ij = elettronic polarizzability tensor
tcosQ~Q
QQ v
0
ij0ij
0
ij0ijij
Q = q2-q1 = vibrational coordinatesv = vibrational frequency
Let’s assume electric and mechanic armonicity

Gianluca Valentini
Q
• The dipole momentum induced according to this approximation is:
• The polarization of the medium emits diffused radiation at frequency equal (Raleigh) lower (Stokes) and higher (anti-Stokes) that that of the incidentfield
• The Raman effect is proportional to If the la polarizzability changes with the vibrazional
coordinate (case I) the Raman effect takes place If the la polarizzability does not change (caso II) the
Raman effect is not present (first order) In general the presence or the absence of the
Raman effect depends on the symmetry group of the molecule or crystal
• The strength of the effect is greater for covalent bonds than with ionic ones
G. Valentini 13
tcostcosE~Q~Q2
1tcosE~P vivij
0
ijj
0ijij
Stokes Anti-StokesRayleigh
0
ij
Q

Gianluca Valentini
Biatomic omonuclear molecules
• A molecular bond is infrared active if the derivative of at least a component of the dipole momentum with respect to Q is different from zero
• The biatomic omonuclear molecules do not show any dipole momentum at rest
• Even following symmetric stretching the dipole momentum is zero
They are NOT infrared active
• The molecular polarizability can be represented by means of a rotation ellipsoid with an axis oriented as the bond ( and )
• Let’s define for a given internuclear distance:
• To understand the properties of and of let’s consider the hydrogen molecule H2
• When the internuclear distance goes to zero the polarizability become similar to that of a helium atom
• When the internuclear distance goes to the polarizability become similar to that of 2 hydrogen atoms
G. Valentini 14
||
Average polarizability = 231 || Anisotropy = ||
0|| Q 0Q

Gianluca Valentini
Hydrogen molecule
• Since the polarizability of 2 hydrogen atoms H is greater that that of 1 He atom the polarizability has positive derivative at the equilibrium distance
• In case of H2
and have different derivativewith respect to Q
• and
• H2 is Raman active
G. Valentini 15
Atom H → ≠ 0 = 0
Molecole H2 → ≠ 0 ≠ 0
0Q0|| 0Q 0

Gianluca Valentini
Biatomic and linear triatomic molecules
G. Valentini 16

Gianluca Valentini
NON linear triatomic molecoles and more complex molecoles
• In general, in molecules with low symmetry all the vibrations are both Raman and infrared active
• Molecules with high symmetry can have vibrations inattive either Raman or infrared
• According to a realistic scenario where the armonicity hypothesis does not hold, overtones and combinatory frequencies can be observed In case of Raman scattering
these lines have negligible amplitude
In case of IR absorption thay can give contributes to the spectrum
G. Valentini 17

Gianluca Valentini
Comparison of Raman and FTIR spectra
• The Stokes Raman shift coincides with IR absorption lines
• Some lines are Raman active, other are only IR active The two spectroscopy methods are somehow complementary
G. Valentini 18

Gianluca Valentini
Instrumentation for Raman spectroscopy
• Excitation source The Raman scattering intensity increases with the forth power of the
laser radiation frequency An NIR laser (typically a Nd:YAG @1064 nm) is preferred to avoid
the fluorescence phenomenon
• The analysis of the Raman lines can be performed with a grating uno spectrometer or with a FTIR spectrometer
• Usually only the Stokes lines are considered since they are more intense
• Raman digital libraries greatly simplify the identification of compounds
• To increase the S/N ratio in Raman spectroscopy more complex methods that guarantee greater sensitivity can be used Resonant Raman (the laser frequency is close to the electronic
assertion band) Stimulated Raman scattering and Coherent Raman Anti-Stokes
(CARS) Surface enhanced Raman scattering (SERS)
• The above mentioned methods are seldom used in Cultural Heritages
G. Valentini 19