physical environment and employee …pjitm.com/doc/jan-july2017/paper10.pdfbehavior significantly...
TRANSCRIPT
141
PHYSICAL ENVIRONMENT AND EMPLOYEE BEHAVIOR
SHAPE CONSUMER PERCEPTION IN RESTAURANTS
Dr. S. S. Bhakar
Director, Prestige Institute of Management, Gwalior
Dr. Shailja Bhakar
Assistant Professor, Prestige Institute of Management, Gwalior
ABSTRACT
Consumers develop their perception about the quality of services provided by restaurants based on the facilities
the restaurant has and the behavior of their employees with consumers. The study was aimed at evaluating the
causal effect of physical facilities and the behavior of employees of a restaurant. The data for the study was
collected from the consumers immediately after they had enjoyed the services of restaurants located at Gwalior
through survey using separate structured questionnaire on each variable. The physical environment of a
restaurant has positive significant effect on both the employee behavior and consumer perception. Employee
behavior significantly effects consumer perception. Therefore, the ambience (majorly contributed by physical
environment) of the restaurant contributes significantly to the employee behavior and perception, consumers
form about the restaurant.
Key Words: Physical Environment, Employee Behavior, Consumer Perception,
INTRODUCTION
Customer retention is the most important goal of service organizations. Therefore researchers now
days are interested in the area of relationship marketing (Colgate and Danaher, 2000). Customer
retention is not only beneficial for the organizations it is also beneficial for the customers as it provides
economical, social and psychological benefits to the customers (Gwinner et al., 1998). If service
organizations want to compete with other organizations then they have to understand the customer’s
perspective better then the competitors (De Wulf et al., 2001; Gwinner et al., 1998).
Customer’s perception can be defined as the matchup between customer’s expectation and reality.
According to Ittelson et al. (1974), “perception is an information processing system”. That means
customer collects lot of cues from the environment and converts these cues into meaningful
information. Ittelson et al. (1974) said that there is a strong relationship between perception and
behavior. A person’s behavior is dependent on his perception if customer form positive perceptions
about a product or service after processing information that he has gathered then it can be said that it
will be reflected in his behavior. Positive consumer perception about a service organization could lead
to positive behaviors.
Prestige International Journal of Management & IT-Sanchayan, Vol. 6(1), 2017, pp. 141-160, ISSN: 2277-1689 (Print), 2278 - 8441 (Online)
142
The major question that arises is how to generate positive customer’s perceptions? In past few years
lot is research work is done in the area of strategic marketing (Bolton, Grewal and Levy, 2007)
specifically the last decade has marked significant attention of researchers in the area of international
service industry (Brady et al., 2005; Keillor, Hult and Kandemir, 2004). The output of these researches
is crucial knowledge that has been gained in the area of service quality evaluation (Cronin and Taylor,
1992; Parasuraman, Zeithaml and Berry, 1988).
Service quality can be defined as the overall superiority and excellence of services perceived by the
consumers (Clow, Kurtz, Ozment, & Ong, 1997; Zeithaml, 1988). Services are evaluated on two bases
the tangible part and the intangible part. The physical environment such as the ambience, the design
and décor of the building, equipments etc. of a service helps customers to judge a service tangible part
on the other hand the intangible part includes the employee behavior that customers encounter during
service delivery process. Employees' behaviors are defined as “various sequences of actions carried
out by employees within the organization” (Hanna et al., 2004).
With this in mind, recent work into services marketing has highlighted two particular constructs of
interest to consumer research that is physical environment and employee behavior. These two
variables are hypothesized to play an important role in determining the customer’s perceptions about
a service (Brady and Cronin, 2001; Yoon, Choi and Park, 2007). Till date lot of research has been done
in this area but the combined effect of both physical environment and employee behavior on
consumer perception has got little attention from researchers (see, e.g., Brady and Cronin, 2001).
This research seeks to remove this gap, by developing and testing a comprehensive model of
consumer perception, with additional investigation of the antecedent role that physical environment
and employee behavior in this process.
LITERATURE REVIEW
Physical Environment
It is true that physical environment in which services are delivered affects human behavior. Till 1960’s
there were very few researchers who worked in this area but after that lot of psychologists and
researchers have evaluated effect of physical environment on human behavior (Russell and Ward
1982; Darley and Gilbert 1985; Holahan 1986; Stokols and Altman 1987). Physical environment affects
both the service providers that is, the employees as well as the service receivers that is customers.
According to Elsbach & Pratt 2007 “Physical environment entails all the material objects and stimuli
(e.g., buildings, furnishings, equipment, and ambient conditions such as lighting and air quality) as
well as the arrangement of those objects and stimuli (e.g., open space office plans and flexible team
work spaces) that people encounter and interact with in organizational life.” Previous empirical
research has shown that physical environment is closely related to the employees’ performance,
morale, commitment, satisfaction, performance, productivity, engagement etc. (e.g., Brewer et. al.
2007, Huisman et.al. 2012, Janakiraman et. al. 2011, Srivastava 2008, Chandrasekar 2011, Weerarathna
Assessing The Moderating Relationship For Mobile Learning Apps: A Study Of Students In College Context
143
& Geeganage 2014) or it can be said physical environment effects overall behaviors of employees.
Therefore it can be hypothesized as:
H01: Physical Environment of restaurants affects Employee Behavior significantly.
In service organization physical environment act as a tangible cue for customers for making judgments
(Jang and Namkung, 2009). Lot of researchers has indicated that customers respond emotionally to
physical environment such as design, ambient factors etc (e.g. Bitner, 1992; Baker et al., 1994; Sherman
et al., 1997; Wakefield and Baker, 1998). According to Kotler (1973) Physical environment (atmosphere)
is an effort to provide such an environment, including vision, audition, tactile and olfaction sense, to
customers that increases purchase intentions and generates specific effects of purchase in them. Davis
(1984) defined physical environment as the physical structure, physical stimuli, symbolic artifacts etc.
of and organization. He further explained physical structure as the architectural design that influences
and controls social interactions and the placement of furniture. Antony et. al. (2004) said physical
environment includes physical facilities, equipments, furniture, employee appearance and their
uniform.
Since 1970’s many researchers were interested in studying the relationship between physical
environment and individual customers but still there is dearth of researches in this area. Especially
there has been little research to know the effect of physical environment in consumption process
(Bitner, 1992). Physical environment is also called servicescapes where services are delivered (Bitner,
1992) and these servicescapes are controlled by the organizations to increase or limit customer’s
actions.
Physical environment is the only tangible element that helps customers to create an image of the
service in their mind (Bitner, 1992). It helps them make perceptions about the service and evaluate it.
Physical environment along with generating emotional responses (such as satisfaction, pleasure,
excitement etc) (Han & Ryu, 2009; Ryu & Jang, 2007), should also help customers to make cognitive
evaluations of a service (Kim & Moon, 2009) and help them in making decision about further action or
behaviors (Berry & Wall, 2007; Jang & Namkung, 2009). According to Gardner and Siomkos (1986)
customers take informational cues from the physical environment of a service. In line with this
Olshavsky (1985) argued physical environment has significant impact on customer’s perception.
Customers come across a number of physical facilities in service environment and that helps them in
forming perceptions about a service. Based upon this, we hypothesize the following:
H02: Physical Environment of restaurants affects Customer Perception about restaurants significantly.
Employee Behavior
Gatignon and Xuered, (1997) defined employee behavior in service organization as “the activities that
employees undertake such as identifying, evaluating, understanding and responding to customer
needs”. Lot of studies have indicated friendly behavior of employees with customers leads to
improved service outcomes as well as long term relationship with them (Sparks, 1994). Pugh (2001)
indicated in his study that when service employees show gratitude, have smile on their face while
Prestige International Journal of Management & IT-Sanchayan, Vol. 6(1), 2017, pp. 141-160, ISSN: 2277-1689 (Print), 2278 - 8441 (Online)
144
service delivery, make eye contact, greet customers it all leads to positive emotions in customers. Tsai
and Huang (2002) also supported this finding and indicated that sales people affective service delivery
would lead to positive customer’s emotions.
Success of service organizations is based on the people who deliver service therefore service oriented
employee behavior is the major contributor towards service organizations success (Anderson and
Sullivan, 1993; Brady and Cronin, 2001). Customer orientation is necessary for customers to have
positive perceptions about a service. Dubinsky and Staples (1981) suggest that employees should be
involved into identifying customers need, focus on the benefits, attempt to provide and maximize
satisfaction. According to Deshpande et al. (1993) keeping customer’s interest first is what makes and
organization customer oriented.
Literature review indicates number of studies that have focused on the relationship between employee
behavior and customer perception about service. Andreassen (1994) found that customer centric
service delivery by employees significantly effects the quality perception by customers towards the
service as well as the service oriented employee behavior. Similarly, Krepapa et al. (2003) also
indicated that employee behavior significantly effects customer’s perception about a service Boles et al.
(2001) advocated that service organizations with very positive attitude towards service oriented
employee behavior continuously strive for culture with highest priority to customers need.
If employees of an organization are service oriented it can have positive influence on perception of
service quality (Hogan and Busch, 1984; Yoon, Choi and Park, 2007). This is because, employees who
are service oriented are more cautious and try to provide best possible service experiences to
customers (Gwinner et al., 2005; Saura et al., 2005). This would lead to customers positive perception
towards every service encounter they go through and would finally lead to positive customer
perceptions towards overall service quality (Schneider, Parkington and Buxton, 1980). Service
orientation can include competence of employees, courtesy (Schneider and Bowen, 1985), customer’s
quality perception (Schneider, Parkington and Buxton, 1980) and behavioral intention (Beatson, Lings
and Gudergan, 2008), and overall business performance (Yoon, Choi and Park, 2007). Based upon this,
we hypothesize the following:
H03: Employee Behavior affects Customer Perception about restaurants significantly.
OBJECTIVE OF THE STUDY
The main objective of the study was to evaluate the relationship between physical environment and
employee behavior as independent variables and Consumer Perception as dependent variable.
1. To evaluate cause and effect relationship between physical environment and employee behavior as independent variables and consumer perception about service quality as dependent variable.
2. To evaluate the relationship between physical environment and perceived service quality.
3. To evaluate the relationship between employee behavior as independent variable and perceived service quality as dependent variable.

Assessing The Moderating Relationship For Mobile Learning Apps: A Study Of Students In College Context
145
4. To test the structural Model
RESEARCH METHODOLOGY
The study was causal in nature where survey method was used to conduct the study. Individual
customers of restaurants in Gwalior region were the sample element. The respondents in the age
category of above the age of 18+ were included in the study. Both male and female respondents were
included. Totals sample size was 300 respondents and the sample was selected using non probability
purposive sampling technique. Proportionate representation from all the demographic groups was
ensured to minimize sampling error.
The data was collected by the researchers themselves after developing rapport with the respondents.
Although standardized measures were available to evaluate physical environment, employee
behavior, and consumer perception in western context, the same had not been tested in the Indian
context. Majority of the research using these variables had been conducted in developed countries.
The experiences and perception of Indian consumers with respect to restaurant service might be
different and therefore self designed questionnaires were used to measure these variables. Separate
measures were prepared to evaluate each variable. The data was collected on the scale of 1-7 where 1
indicated minimum agreement with the statement and 7 indicated maximum agreement.
The measures were tested for internal consistency reliability and validity after completion of data
collection phase. Reliability of all four measures was established separately. Cronbach’s Alpha
reliability coefficient was calculated using PASW 18 separately for all the measures. Reliability of
factors identified through factor analysis was also evaluated through calculation of construct
reliability coefficients. Principle axis factoring was carried out with Oblimin rotation and Kaiser
Normalization. The measure was checked for sample adequacy and Sphericity using KMO and
Bartlett test. The factors extracted through PAF were named and described. The cause and effect
relationship between physical environment and employee behavior as independent variables and
consumer perception on service quality as dependent was tested using Structural Equaton Modelling.
RESULTS
Reliability Measure
The internal consistency reliability of the three variables of the study, Physical Environment,
Employee Behavior and Customer Perception were established through computation of Cronbach’s
Alpha separately for each variable. The Cronbach’s Alpha results are posited in the table below:
Table1: showing Reliability statistics for physical environment
Variable Cronbach’s Alpha
Physical Environment 0.834
Employee Behavior 0.921

Prestige International Journal of Management & IT-Sanchayan, Vol. 6(1), 2017, pp. 141-160, ISSN: 2277-1689 (Print), 2278 - 8441 (Online)
146
Customer Perception 0.973
The reliability of all the three variables is high as the Cronbach’s Alpha coefficient values are all above
0.7.
Table 2: Showing KMO Bartlett test applied on – Physical Environment
KMO and Bartlett's Test
Kaiser-Meyer-Olkin Measure of Sampling Adequacy. .855
Bartlett's Test of Sphericity Approx. Chi-Square 817.748
df 55
Sig. .000
The data collected on Physical Environment variable was checked for its suitability to carry out
exploratory factor analysis (EFA). The data was evaluated for sample size adequacy using KMA and
the value of KMO was found to be 0.855 The minimum KMO value required for EFA is 0.5; the
calculated value of KMO is far higher than the required minimum for Exploratory factor analysis. The
second requirement is that the item-to-item correlation matrix should not be an identity matrix. The
difference between the item-to-item correlation matrix and identity matrix was evaluated using
Bartlett’s test of Sphericity. The difference was evaluated using chi square test and the value of chi
square was 817.748 significant at 0.00 % level of significance. Therefore the item-to-item correlation
matrix is not an identity matrix and therefore the data is suitable for EFA.
Principle component Analysis was applied as a method of convergence and Varimax method was
used for rotating the factors. The process converged after 7 iterations on two factors. The factor
loading of all the variables is displayed below in table 3.
Table 3: Sowing the Results of Exploratory Factor Analysis Applied on Physical Environment
Factor name Eigen Values
% of Var.
Items Converged Factor Loads
Differentiating 2.458 24.583 9. Comfortable temperature is maintained .771
11. The table tops/table covers are clean. .715
7. Noise disturbance is low. .645
12. Soft and soothing music is played .618
8. Sufficient parking space .516
Essential 2.404 24.043 2 Proper sitting arrangement is available .758
1 Proper lighting facility is available .720
6 Warm friendly atmosphere inside the restaurant.
.653
10. The utensils used for the food are clean .532
4 The interior design of the premises is good .520
Every restaurant must have the minimum physical environment to attract customers. The physical
environment variables that converged on this factor are listed above under factor essential. Adhering
to minimum requirement of physical environment may attract few customers first time and some
customers as repeat customers, but long term success of the restaurant depends on the performance of

Assessing The Moderating Relationship For Mobile Learning Apps: A Study Of Students In College Context
147
restaurant on variable converged on differentiating factor. The variables that converged on
differentiating factor are listed above under this factor.
Table 4: Showing Results of Confirmatory Factor Analysis Applied on Physical Environment
Indicator Chi Square
P CMin/df GFA AGFA IFI CFI TLI RMSEA RMR
Critical Value >0.05 < 2.0 >0.9 >0.9 >0.9 >0.9 >0.9 <0.05 Least
Default Value 14.905 0.313 1.141 .986 .970 .995 .995 .992 .022 0.06
Fig 1: Showing the CFA Diagram of Physical Environment Variable
The CFA model of Physical environment was tested for goodness of fit of the model. The global
goodness of fit was tested using CMin (Chi Square) test. The Chi Square test is applied between the
original covariance matrix and covariance matrix computed using the factor structure. The difference
between the covariance matrices should not be significant therefore, the p-value for the Chi Square test
must be greater than 0.05. The value for the current model is 0.313 far higher than 0.05, indicating that
the model is good fit to the data. The Cmin/df value should be smaller than 2 to consider the model
good fit to the data. The value of Cmin/df for the physical environment model is 1.141, again
indicating that the model is good fit to the data. The values of GFA (Goodness of Fit) Index, AGFA
(Adjusted goodness of Fit) Index, IFI (Incremental Goodness of Fit) Index, CFI (Comparative
Goodness of Fit) Index, and TLI (Tucker Lewis) Index should all be greater than ) 0.9. All these indexes
have values greater than 0.9, indicating good fit of the model to data. The badness of fit indexes
RMSEA should have a value less than 0.05 and the RMR value should be lowest. The value of RMSEA
is 0.022 and the value of RMR is 0.06 for the model, indicating good fit of the model.
Table 5: KMO and Bartlett’s Test Results for Employee Behavior
KMO and Bartlett's Test

Prestige International Journal of Management & IT-Sanchayan, Vol. 6(1), 2017, pp. 141-160, ISSN: 2277-1689 (Print), 2278 - 8441 (Online)
148
Kaiser-Meyer-Olkin Measure of Sampling Adequacy. .854
Bartlett's Test of Sphericity Approx. Chi-Square 665.400
df 45
Sig. .000
The data collected on Employee Behavior variable was checked for its suitability to carry out
exploratory factor analysis (EFA). The data was evaluated for sample size adequacy using KMA and
the value of KMO was found to be 0.854 The minimum KMO value required for EFA is 0.5; the
calculated value of KMO is far higher than the required minimum for Exploratory factor analysis. The
second requirement is that the item-to-item correlation matrix should not be an identity matrix. The
difference between the item-to-item correlation matrix and identity matrix was evaluated using
Bartlett’s test of Sphericity. The difference was evaluated using chi square test and the value of chi
square was 665.400 significant at 0.00 % level of significance. Therefore the item-to-item correlation
matrix is not an identity matrix and therefore the data is suitable for EFA.
The raw scores of 14 items that were subjected to exploratory factor analysis using principle
component analysis as the convergence method and Varimax rotation as the method of rotation
converged on two factors after three iterations.
Table 6: Exploratory Factor Analysis Results for Employee Behavior
Rotated Component Matrix
Factor Eigen Value
Var. Component
1 2
Customer Orientation
2.655 26.547 14. Special care of the vehicles in the parking area.
.753
12. Problem solving behavior. .697
3. When they promise to do something, it will be done so.
.633
11. Treat customers courteously on the telephone.
.628
13. Able to handle customer complaints. .623
4. Performing service right at the first time. .518
Competence 2.183 21.827 1. Individual attention. .748
5. Error free sales transactions and records.. .660
2. Helping customers which they require .658
7. The behavior is instills confidence in customers.
.613
Extraction Method: Principal Component Analysis. Rotation Method: Varimax with Kaiser Normalization.
a. Rotation converged in 3 iterations.
Employees in service organizations are responsible to contribute major part of the service bundle.
Competence of the employees therefore, is essential to provide right quality services to the customers.
The employees need to customer orientation in addition to having right level of competence to deliver
quality services to the customers. Therefore, the two factors of employee behavior jointly ensure right
quality service delivery to the customers. Since the operations in restaurants require involvement of

Assessing The Moderating Relationship For Mobile Learning Apps: A Study Of Students In College Context
149
customers in delivery of service, employee behavior becomes absolutely important in developing
perception of good quality service delivery.
Table 7: Showing Results of Confirmatory Factor Analysis Applied on Physical Environment
Indicator Chi Square
P CMin/df GFA AGFA IFI CFI TLI RMSEA RMR
Critical Value >0.05 < 2.0 >0.9 >0.9 >0.9 >0.9 >0.9 <0.05 Least
Default Value 28.752 0.274 1.150 . .980 ..965 . .993 .993 .990 .022 0.067
Fig 2: Showing the CFA Diagram of Employee Behavior
The CFA model of Employee Behavior was tested for goodness of fit of the model. The global
goodness of fit was tested using CMin (Chi Square) test. The Chi Square test is applied between the
original covariance matrix and covariance matrix computed using the factor structure. The difference
between the covariance matrices should not be significant therefore, the p-value for the Chi Square test
must be greater than 0.05. The value for the current model is 0.274 far higher than 0.05, indicating that
the model is good fit to the data. The Cmin/df value should be smaller than 2 to consider the model
good fit to the data. The value of Cmin/df for the physical environment model is 1.150, again
indicating that the model is good fit to the data. The values of GFA (Goodness of Fit) Index, AGFA
(Adjusted goodness of Fit) Index, IFI (Incremental Goodness of Fit) Index, CFI (Comparative
Goodness of Fit) Index, and TLI (Tucker Lewis) Index should all be greater than ) 0.9. All these indexes
have values greater than 0.9, indicating good fit of the model to data. The badness of fit indexes
RMSEA should have a value less than 0.05 and the RMR value should be lowest. The value of RMSEA
is 0.022 and the value of RMR is 0.067 for the model, indicating good fit of the model.
Table 8: KMO and Bartlett’s test Results for Consumer Perception
Prestige International Journal of Management & IT-Sanchayan, Vol. 6(1), 2017, pp. 141-160, ISSN: 2277-1689 (Print), 2278 - 8441 (Online)
150
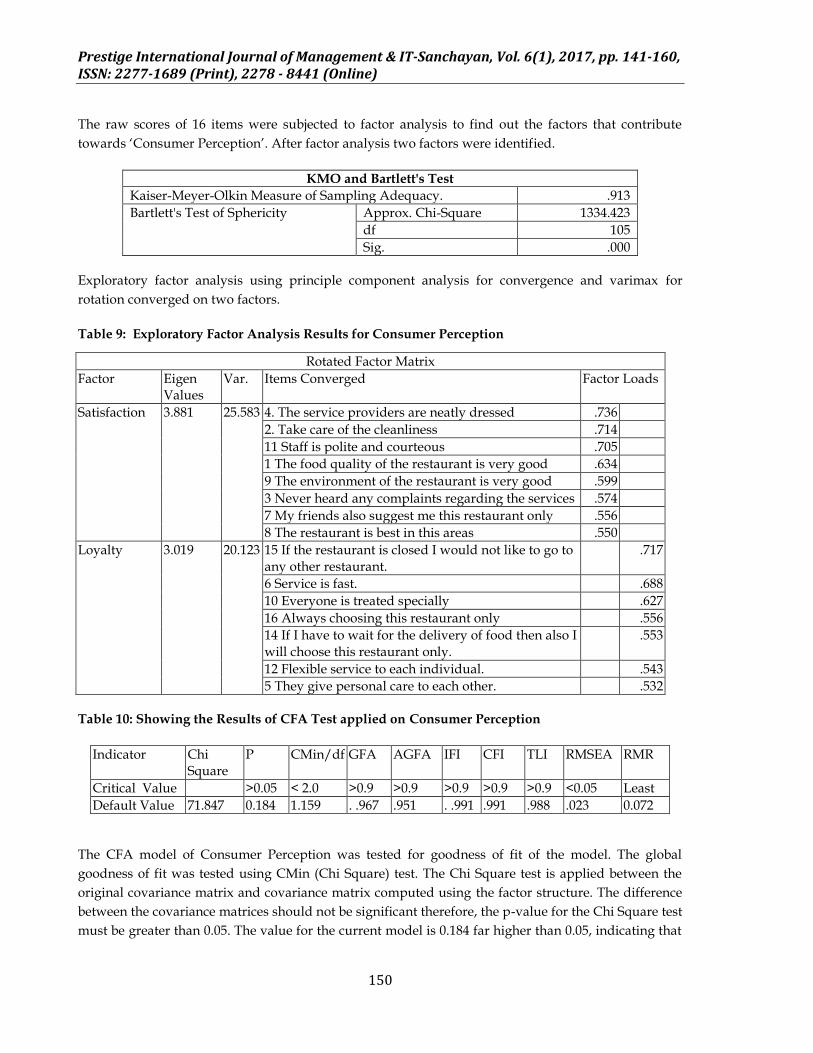
The raw scores of 16 items were subjected to factor analysis to find out the factors that contribute
towards ‘Consumer Perception’. After factor analysis two factors were identified.
KMO and Bartlett's Test
Kaiser-Meyer-Olkin Measure of Sampling Adequacy. .913
Bartlett's Test of Sphericity Approx. Chi-Square 1334.423
df 105
Sig. .000
Exploratory factor analysis using principle component analysis for convergence and varimax for
rotation converged on two factors.
Table 9: Exploratory Factor Analysis Results for Consumer Perception
Rotated Factor Matrix
Factor Eigen Values
Var. Items Converged Factor Loads
Satisfaction 3.881 25.583 4. The service providers are neatly dressed .736
2. Take care of the cleanliness .714
11 Staff is polite and courteous .705
1 The food quality of the restaurant is very good .634
9 The environment of the restaurant is very good .599
3 Never heard any complaints regarding the services .574
7 My friends also suggest me this restaurant only .556
8 The restaurant is best in this areas .550
Loyalty 3.019 20.123 15 If the restaurant is closed I would not like to go to any other restaurant.
.717
6 Service is fast. .688
10 Everyone is treated specially .627
16 Always choosing this restaurant only .556
14 If I have to wait for the delivery of food then also I will choose this restaurant only.
.553
12 Flexible service to each individual. .543
5 They give personal care to each other. .532
Table 10: Showing the Results of CFA Test applied on Consumer Perception
Indicator Chi Square
P CMin/df GFA AGFA IFI CFI TLI RMSEA RMR
Critical Value >0.05 < 2.0 >0.9 >0.9 >0.9 >0.9 >0.9 <0.05 Least
Default Value 71.847 0.184 1.159 . .967 .951 . .991 .991 .988 .023 0.072
The CFA model of Consumer Perception was tested for goodness of fit of the model. The global
goodness of fit was tested using CMin (Chi Square) test. The Chi Square test is applied between the
original covariance matrix and covariance matrix computed using the factor structure. The difference
between the covariance matrices should not be significant therefore, the p-value for the Chi Square test
must be greater than 0.05. The value for the current model is 0.184 far higher than 0.05, indicating that

Assessing The Moderating Relationship For Mobile Learning Apps: A Study Of Students In College Context
151
the model is good fit to the data. The Cmin/df value should be smaller than 2 to consider the model
good fit to the data. The value of Cmin/df for the physical environment model is 1.159, again
indicating that the model is good fit to the data. The values of GFA (Goodness of Fit) Index, AGFA
(Adjusted goodness of Fit) Index, IFI (Incremental Goodness of Fit) Index, CFI (Comparative
Goodness of Fit) Index, and TLI (Tucker Lewis) Index should all be greater than ) 0.9. All these indexes
have values greater than 0.9, indicating good fit of the model to data. The badness of fit indexes
RMSEA should have a value less than 0.05 and the RMR value should be lowest. The value of RMSEA
is 0.023 and the value of RMR is 0.072 for the model, indicating good fit of the model.
Fig 3: Showing the CFA Diagram of Consumer Perception
Structural Model
Since exploratory factor analysis has identified two factors for each of the two independent variables
Physical Environment & Employee Behavior and the dependent variable Consumer Perception;
structural equation model cannot be tested using factor structure as indicator variables (minimum
requirement is three indicator variables for each variable). Therefore, the model for Structural
Equation modeling was developed using original indicator variables for all the three variables.
Structural model shown in Fig.1 above was tested using AMOS. The displayed good fit to the data.
The goodness of fit indices are displayed in annexure under table 1.
Structural Model: Antecedents of Consumer Perception
Structural Equation Models are evaluated in two stages. In first stage the model is tested for goodness
of fit and in second stage the results of hypothesis are evaluated.

Prestige International Journal of Management & IT-Sanchayan, Vol. 6(1), 2017, pp. 141-160, ISSN: 2277-1689 (Print), 2278 - 8441 (Online)
152
Fig 4: Structural Diagram of the antecedents of Consumer Perception
Table 11: Showing the Results of SEM Applied on Antecedents of Consumer Perception
Indicator Chi Square
P CMin/df GFA AGFA IFI CFI TLI RMSEA RMR
Critical Value >0.05 < 2.0 >0.9 >0.9 >0.9 >0.9 >0.9 <0.05 Least
Default Value 151.631 0.076 1.185 0.947 0.929 0.982 .982 .978 .025 0.085
The global goodness of fit index Chi Square value was 151.631 was significant at 0.076 level indicating
good fit. Because chi square is restrictive in nature it is always good to evaluate models using other
indices (Kenny and McCoach, 2003). The weakness of chi square test based on sample size can be
taken care of by using CMIN/DF (Wheaton et al, 1977). The value of CMIN/DF is 1.185 for the default
model above; the index value is lower than the required minimum i.e. < 2.
The Goodness Fit Index (GFI = 0.947) and Adjusted Goodness of Fit Index (AGFI = 0.929) values are
both higher than the required 0.9. GFI is inflated by higher sample size (Bollen, 1990; Miles and
Shevlin, 1998) and is also sensitive to number of parameters and degree of freedom (Sharma et al,
2005). AGFI is adjusted for degree of freedom (Tabachnick and Fidell, 2007) but is sensitive to sample
size. Though both the indices indicate good fit of the default model to data, they need to be supported
using other goodness fit indices.
The incremental fit indices are also called comparative or relative fit indices (Miles and Shevlin, 2007;
McDonald and Ho, 2002) do not use chi square in its raw form and compare chi square of default

Assessing The Moderating Relationship For Mobile Learning Apps: A Study Of Students In College Context
153
model with base line model. The three incremental fit indices Incremental Fit Index (IFI = 0.982),
Tucker Lewis Fit Index (TLI = 0.978) and Comparative Fit Index (CFI = 0.982) are higher than 0.9,
indicating that the structural model has good fit to the data. Comparative fit index is considered one of
the best indicators of goodness of fit as it is least sensitive to sample size (Fan et al, 1999).
Two parsimony fit indices were developed by (Mulaik et al, 1989). The two parsimony fit indices;
Normed Parsimony Fit Index (NPFI = 0.749) and Parsimony Comparative Fit Index (PCFI = 0.821) are
both higher than 0.5. Parsimony fit indices are adjusted for complexity of models and therefore the
values of parsimony fit indices are nearer 0.5 for smaller models and go up as the complexity of the
model increases.
Root Mean Square Residuals (RMR) are square root of differences between sample covariance matrix
and hypothesized models. Values of RMR that are smaller than .05 indicate good fit of the model to
data (Byrne, 1998; Diamantopoulos and Siguaw, 2000), however values up to .1 are acceptable (Hu
and Bentler, 1999). The computed value of RMR for the default model under test is 0.085.
The RMSEA indicates the level of fit the population covariance matrix with optimally chosen
parameter estimates (Byrne, 1998). The RMSEA values up to 0.06 are acceptable (Hu and Bentler,
1999). The computed value of Root Mean Squared Error Approximation for the default model is 0.025.
RESULTS OF HYPOTHESIS TESTING
Table 12: Regression Weights: Antecedents of Consumer Perception Default model
Estimate Std. Reg. S.E. C.R. P
EmpBeh <--- PhyEnv .641 .641 .097 6.075 ***
CustPer <--- PhyEnv .191 .210 .084 2.258 .024
CustPer <--- EmpBeh .727 .735 .118 6.163 ***
H01: Physical Environment of restaurants affects Employee Behavior significantly.
The standardized regression weight computed between physical environment as independent variable
and Employee behavior as dependent variable is 0.641, significant at 0.000 level of significance. The
hypothesis is supported. Finding of this research find support in Ariffin and Aziz (2012) where in they
found that environment and its innovativeness effect employee behavior.
H02: Physical Environment of restaurants affects Customer Perception about restaurants significantly.
The standardized regression weight computed between physical environment as independent variable
and Customer Perception as dependent variable is 0.210, significant at 0.024 level of significance. The
hypothesis is supported.
H03: Employee Behavior affects Customer Perception about restaurants significantly.

Prestige International Journal of Management & IT-Sanchayan, Vol. 6(1), 2017, pp. 141-160, ISSN: 2277-1689 (Print), 2278 - 8441 (Online)
154
The standardized regression weight computed between Employee Behavior as independent variable
and Customer Perception as dependent variable is 0.735, significant at 0.000 level of significance. The
hypothesis is supported.
IMPLICATIONS OF THE STUDY
1. Restaurants
The results of our study have strong implications for the restaurants, as the results indicate that physical environment and employee behavior have strong positive effect on consumer perception about the services provided by the restaurant. The restaurant owners need to pay more attention to the ambience of the restaurants, which is directly affected by the physical environment. Also, the restaurants need to ensure that there employee are trained on all aspects of service that they are involved in, as the employee behavior also has strong positive relationship with the consumer perception about the services offered by the restaurant.
2. Students
Students can use the results of this study for supporting the results of their studies in similar areas.
Students can use the literature review for support literature review of their studies in similar areas.
Students can use the reference for understanding the topic in detail and for doing further studies in this area.
Students can use the standardized questionnaire for physical environment, employee behavior and consumer perception developed in the study for doing studies in similar areas.
SUGGESTIONS OF THE STUDY
The study has been done by taking only a sample of 300 respondents therefore it is suggested to take bigger sample size in order to obtain more accurate results.
The study has been done in Gwalior region only so it is suggested to take larger area or other region so that more appropriate results can be obtained.
The study resulted in the fact that there are some other factor also other than physical environment and employee behavior, which are affecting consumer perception. So similar kind of study can be done to evaluate the effect of other variables on consumer perception.
The study resulted in the fact that physical environment and employee behavior has impact on consumer perception similarly effect of physical environment and employee behavior can be evaluated on other variables.
CONCLUSION

Assessing The Moderating Relationship For Mobile Learning Apps: A Study Of Students In College Context
155
The study has resulted in standardized and reliable measures of physical environment, employee
behavior and consumer perception with the respect to restaurant services. All the three measures are
reliable as indicating by their reliability measure which is higher than 0.7.
Cause and effect relationship has been established between physical environment as individual
independent variable and consumer perception as dependent variable using simple linear regression
equation. Physical environment has significantly high positive relationship with consumer perception.
Cause and effect relationship has been established between employee behavior as individual
independent variable and consumer perception as dependent variable using simple linear regression
equation. Employee behavior has significantly high positive relationship with consumer perception.
Cause and effect relationship has been established using multiple regression equation between
physical environment, employee behavior as independent variable and consumer perception as
dependent variable. Physical environment and employee behavior both have significant relationship
with consumer perception.
REFERENCES
Anderson, E. and Sullivan, M. (1993). The antecedents and consequences of customer satisfaction for
firms. Management Science, 12(2), 125-143.
Andreassen, T.W. (1994). Satisfaction, loyalty, and reputation as indicators of customer orientation in the
public sector. International Journal of Public Sector Management, 7(2), 16-34.
Antony, J. Antony, F.J. and Ghosh, S. (2004). Evaluating Service Quality in a UK Hotel Chain: A Case
Study. International Journal of Contemporary Hospitality Management, 16(6), 380-384.
Baker, J. Grewal, D. and Parasuraman, A. (1994). The influence of store environment on quality
inferences and store image. Journal of the Academy of Marketing Science, 22(4), 328-339.
Beatson, A., Lings, I. and Gudergan, S. (2008). Employee behavior and relationship quality: impact on
customers. Service Industries Journal, 28(2), pp. 211-23.
Berry, L. L., & Wall, E. A. (2007). The combined effects of the physical environment and employee
behavior on customer perception of restaurant service quality. Cornell Hotel and Restaurant Administration
Quarterly, 48(1), 59-69.
Bitner, M.J. (1992). Servicescapes: the impact of physical surroundings on customers and employees. The
Journal of Marketing, 56(2), 57-71.
Boles, J.S., Babin, B.J., Brashear, T.G. and Brooks, C. (2001). An examination of the relationships between
retail work environments, salesperson selling orientation customer orientation and job performance.
Journal of Marketing Theory and Practice, 9(3), 1-13.
Bolton, Ruth N., Dhruv Grewal & Michael Levy (2007). Six Strategies for Competing through Service: An
Agenda for Future Research. Journal of Retailing, 83(1), 1-4.
Brady, M. K. & Cronin, J. J. (2001). Customer orientation: effects on customer service perceptions and
outcome behaviors. Journal of Service Research, 3(3), pp. 241-51.
Brady, M. K., Knight, G.A., Cronin, J. J., Hult, G.T.M. & Keillor, B.D. (2005). Removing the contextual
lens: a multinational, multi-setting comparison of service evaluation models. Journal of Retailing, 81(3),
215-30
Brewer, P., Carnes, L., & Garner, S. J. (2007). The potential impact of the physical work environment on
business teachers’ productivity and job satisfaction. Business Education Digest, 16(May), 29-46.

Prestige International Journal of Management & IT-Sanchayan, Vol. 6(1), 2017, pp. 141-160, ISSN: 2277-1689 (Print), 2278 - 8441 (Online)
156
Chandrasekar, K. (2011). Workplace environment and its impact on Organizational performance in
public sector Organizations. International Journal of Enterprise Computing and Business Systems, 1(1).
Clow, K. E., Kurtz D, L., Ozment, J., & Ong, B. S. (1997). The antecedents of customer expectations of
services: an empirical study across four industries. The Journal of Services Marketing, 11(4), 230-248.
Colgate, M. & Danaher, P. (2000). Implementing a customer relationship strategy: the asymmetric impact
of poor versus excellent execution. Journal of the Academy of Marketing Science, 28(3), 375-87.
Cronin, J. & Taylor, S. (1992). Measuring service quality: a re-examination and extension. Journal of
Marketing, 56 (July), 55-68.
Darley, John M. & Daniel T. Gilbert (1985). Social Psychological Aspects of Environmental Psychology. in
Handbook of Social Psychology, 3rd ed., Vol. II, Gardner Lindzey and Elliot Aronson, eds. New York:
Random House, Inc., 949-91.
Davis, T.R. (1984). The influence of the physical environment in offices. Academy of management review,
9(2), 271-283.De Wulf et al., 2001
Deshpande, R., Farley, J. & Webster, F.E. (1993). Corporate culture, customer orientation, and
innovativeness in Japanese firms: a quadrad analysis. Journal of Marketing, 57(1), 23-37.
Dubinsky, A. & Staples, W. (1981). Are industrial salespeople buyer oriented? Journal of Purchasing
Materials Management, 37(8), pp. 12-19.
Elsbach, K. D., & Pratt, M. G., (2007). The physical environment in organizations. The Academy of
Management Annals, 1, 181-234.
Gardner, M.P. and Siomkos, G.J. (1986). Toward a methodology for assessing effects of in-store
atmosphere. Advances in Consumer Research, 13(1), pp. 27-31.
Gatignon, H. and Xuered, J. (1997). Strategic orientation of the firm and new product performance.
Journal of Marketing Research. 34(2), 77-90.
Gwinner, K., Gremler, D. & Bitner, M. (1998). Relational benefits in services industries: the customer's
perspective. Journal of the Academy of Marketing Science, 26(2), 101-14.
Gwinner, K.P., Bitner, M.J., Brown, S.W. & Kumar, A. (2005). Service customization through employee
adaptiveness. Journal of Service Research, 8(2), 131-48.
Han, H. & Ryu, K. (2009). The roles of the physical environment, price perception, and customer
satisfaction in determining customer loyalty in the restaurant industry. Journal of Hospitality & Tourism
Research, 33(4), 487-510.
Hanna , V. , Backhouse , C. & Burns , N. ( 2004 ). Linking Employee Behavior to External Customer
Satisfaction using Quality Function Deployment. Journal of Engineering Manufacture, 218, 1167 – 1177.
Hogan, J., R. Hogan, & C.M. Busch (1984). How to Measure Service Orientation. Journal of Applied
Psychology, 69(1), 167-73.
Holahan, Charles J. (1982). Environmental Psychology. New York: Random House, Inc.
Huisman, E. R. C. M., Morales, E., Hoof, J. V., & Kort, H. S. M., (2012). Healing environment: A review of
the impact of physical environment factors on users. Building and Environment, 58, 70-80.
Ittelson, William H., Harold M. Proshansky, Leanne G. Rivlin, & Gary H. Winkel (1974). An Introduction
to Environmental Psychology. New York: Holt, Rinehart and Winston, Inc.
Janakiraman, R., Parish, J. T., & Berry, L. L., (2011). The effect of the work and physical environment on
hospital nurses’ perception and attitudes: service quality and commitment. Quality Management Journal,
18(4), 36-49.
Jang, S., & Namkung, Y. (2009). Perceived quality, emotions, and behavioral intentions: Application of an
extended Mehrabian-Russell model to restaurants. Journal of Business Research, 62, 451-460.
Keillor, Bruce D., G. Tomas M. Hult & Destan Kandemir (2004). A Study of the Service Encounter in
Eight Countries, Journal of International Marketing, 2(1), 9-35.

Assessing The Moderating Relationship For Mobile Learning Apps: A Study Of Students In College Context
157
Kim, W.G., & Moon, Y.J. (2009). Customers’ cognitive, emotional, and actionable response to the
servicescape: A test of the moderating effect of the restaurant type. International Journal of Hospitality
Management, 28, 144-156.
Kotler, P. (1973). Atmospherics as a marketing tool. Journal of retailing, 49(4), 48-64.
Krepapa, A., Berthon, P., Webb, D. & Pitt, L. (2003). Mind the gap: an analysis of service provider versus
customer perceptions of market orientation and impact on satisfaction. European Journal of Marketing,
37(1/2), 197-218.
Olshavsky, R. (1985). Perceived quality in consumer decision-making: an integrated theoretical
perspective. in Perceived Quality, Jacoby, J. and Olson, J. (Eds), Lexington Books, Lexington, MA.
Parasuraman, A., Zeithaml, V.A. & Berry, L.L. (1988). SERVQUAL: a multiple-item scale for measuring
consumer perceptions of service quality. Journal of Retailing, 64(1), 12-40.
Pugh, S.D. (2001). Service with a smile: emotional contagion in the service encounter. Academy of
Management Journal, 44(5), 1018-27.
Russell, James A. & Lawrence M. Ward (1982). Environmental Psychology. Annual Review of Psychology,
651-88.
Ryu, K., & Jang, S. (2007). The effect of environmental perceptions on behavioral intentions through
emotions: The case of upscale restaurants. Journal of Hospitality & Tourism Research, 31(1), 56-72.
Saura, I.G., Contrı´, G.B., Taulet, A.C. and Vela´zquez, B.M. (2005). Relationships among customer
orientation, service orientation and job satisfaction in financial services. International Journal of Service
Industry Management, 16(5), 497-525.
Schneider, B. and D.E. Bowen (1985). Employee and Customer Perceptions of Service in Banks:
Replication and Extension. Journal of Applied Psychology, 70(3), pp. 423-33.
Schneider, B., Parkington, J.J. and Buxton, V.M. (1980). Employee and customer perceptions of service in
banks. Administrative Science Quarterly, 25(2), pp. 252-67.
Sherman, E., Mathur, A. and Smith, R.B. (1997). Store environment and consumer purchase behavior:
mediating role of consumer emotions. Psychology & Marketing, 14(4), 361-78.
Sparks, B. (1994). Communicative Aspects of the Service Encounter. Hospitality Research Journal, 17(2), 39–
50.
Srivastava, A. K.. (2008). Effect of Perceived Work Environment on Employees Job Behavior and
Organizational Effectiveness. Journal of the Indian Academy of Applied Psychology, 34(1), 47-55
Stokols, Daniel and Irwin Altman (1987). Handbook of Environmental Psychology. New York: John Wiley &
Sons, Inc.
Tsai, D. & Huang, C. (2002). Mechanisms Linking Employee Effective Delivery and Customer Behavioral
Intentions. Journal of Applied Psychology, 87(5), 179 – 187.
Wakefield, K.L. and Baker, J. (1998). Excitement at the mall: determinants and effects on shopping
response. Journal of Retailing, 74(4), 515-39.
Weerarathna, R.S & Geeganage, I. A. P. H. (2014). The Relationship between Organizational Culture and
Employee Performance: Case of Sri Lanka. International Journal of Scientific & Engineering Research, 5(8),
985, ISSN 2229-5518
Yoon, S.-J., Choi,D.-C. & Park, J.-W. (2007). Service orientation: its impact on business performance in the
medical service industry. Service Industries Journal, 27(4), pp. 371-88.
Zeithaml, V. A. (1988). Consumer perceptions of price, quality and value: a means end model and synthesis of evidence. Journal of Marketing, 5.