physical and cooking properties of two varieties of bio
TRANSCRIPT

Food Science and Quality Management www.iiste.org
ISSN 2224-6088 (Paper) ISSN 2225-0557 (Online)
Vol.71, 2018
1
Physical and Cooking Properties of Two Varieties of Bio-Fortified
Common Beans (Phaseolus Vulgaris. L) Grown in DR Congo
Ariel Buzera1,2* Peter Kinyanjui2 Jackson Ishara1,2 Daniel Sila2 1.Université Evangélique en Afrique, B.P: 465 Cyangugu / Rwanda. 3323 Bukavu, Sud-Kivu / RD Congo
2.Jomo Kenyatta University of Agriculture and Technology, P.O. Box 62000-00200 Nairobi, Kenya
Abstract
Common bean (Phaseolus vulgaris L.) is the most widely grown edible legume species in DR Congo but nevertheless, different varieties vary with respect to their physical, chemical aspects and cooking properties which affect the consumer acceptability. This study evaluated the physical properties and cooking time of two varieties of bio-fortified common beans (HM21_7 and Namulenga), destined for both direct consumption and processing. The parameters assessed included the dimensions, the soaking characteristics, the density characteristics, Colour and the Hardness after cooking. The beans were soaked in distilled water and in 0.025N Na2CO3 solution for 16h then subjected to different test as mention above. The data collected were subjected to Analysis of Variance (ANOVA) using Statistix version 8.1 software. Treatment means were separated using LSD at 0.05 probability level. HM21_7 was larger in size and 100 seeds weight with (36.27±1.33 g) compared to Namulenga (32.77±0.55 g). The sphericity was (54.4% and 58.9%), surface area was (127 mm2 and 118 mm2), aspect ratio was (0.49 and 0.55) and volume was (147 mm2 and 142 mm2) for both HM21_7 and Namulenga respectively. The soaking solutions had a significant effect on the hydration coefficient, swelling coefficient. Soaking the beans in Na2CO3 increased significantly the conductivity and the leached solutes for both the varieties. Namulenga variety had the higher bulk density (0.81 g/ml) compared to HM21_7 (0.77 g/ml). The porosity varied significantly among the two varieties. A significant different (P<0.01) was observed in the colour of the beans after soaking. Beans soaked in distilled water were lighter due to greater pigment leaching. On the other hand, beans soaked in Na2CO3 solution for 16 h showed darker colour. Soaking in sodium carbonate solution prior to cooking significantly reduced the hardness of the beans compared to the unsoaked beans and beans soaked in distilled water. According to the characteristics studied, the Namulenga variety is a good option for both processing and domestic use. Keywords: Physical properties, Hardness, Bio-fortified beans. 1. INTRODUCTION
Common beans (Phaseolus vulgaris. L) is a major grain legume crop in the world (Leterme & Carmenza Muñoz, 2002) and widely consumed in Africa ( Singh et al., 2004; HarvestPlus, 2014). Its third in importance after soybean and peanut as a legume crop, but first in direct human consumption (Broughton et al., 2003). Beans present great variety in color, size, chemical composition and hardness, depending on the cultivar to which they belong. These differences come from intrinsic factors (genotype, which is partially responsible for the differences between cultivars and varieties) or from extrinsic factors such as storage conditions, type of cultivation soil, agronomic practices and climatic and technological factors (Gonzalez et al., 2005; Aghkhani, Ashtiani & Motie, 2012). Nutritionally, common bean is an important source of protein, dietary fiber, iron, complex carbohydrates, minerals, and vitamins for millions of people worldwide and is a basic food of the indigenous populations in South America, Central America, and in Sub-Saharan regions.
Beans are consumed in the Democratic Republic of Congo (D.R. Congo) mainly in the eastern provinces of North and South Kivu, at an estimated 300 grams per capita per day (Lubobo & Harvestplus, 2013) and are affordable by vulnerable groups. Over half of the dry beans produced in the DR Congo are cultivated in North and South Kivu Province (SNSA, 2012). Between 2005 and 2011, annual dry bean production in North Kivu Province nearly doubled, from just over 180,000 MT to over 320,000 MT. This transition was supported by NGOs that provided inputs and other technical assistance in the province (Njingulala et al. 2014; Njingulala & Bahati, 2013).
Common bean genetic breeding programs have produced cultivars with high bean yields, tolerance to pests and diseases, different sizes, colors, shapes, sheen (Perina, 2014). In addition, research to develop bio-fortified foods is ongoing and has largely focused on increasing the Fe and Zn content of the world’s most important staple food crops including common beans [Phaseolus vulgaris (L.)] ( Blair et al., 2013). Bio-fortification therefore complements existing interventions to sustainably provide micronutrients to the most vulnerable people in a comparatively inexpensive and cost-effective way (Bouis et al., 2011).
Information on the physical properties of bean seed such as their dimensions, porosity, volume, density (true and bulk) is important in designing the equipment for harvest, transport, storage, processing, cleaning, hulling, and milling (Akaaimo and Raji, 2006; Coşkuner & Karababa, 2007). One hundreds seed mass is useful in determining the equivalent diameter that can be used in the theoretical estimation of seed volume and in cleaning using aerodynamic forces (Lvin, 1971). It is also important in bean storage capacity planning and machinery design (Atiku, Aviara, & Haque, 2004). The true density indicate that the seeds are heavier than water and this

Food Science and Quality Management www.iiste.org
ISSN 2224-6088 (Paper) ISSN 2225-0557 (Online)
Vol.71, 2018
2
characteristic can be used to design separation or cleaning process for the beans (Mpotokwane et al., 2008). Bulk density is used as an indication of quality during storage of beans (Mpotokwane et al., 2008). Porosity is used to calculate the rate of aeration and cooling, drying and heating and the design of heat exchangers and other similar equipment for bean handling (Asoegwu et al., 2006). The physical properties of common bean have been studied by various researchers such as: Altuntas & Yildiz (2007) for faba bean (Viciafabal.); Olajide and Ade-Omowaye (1999) & Ogunjimi et al. (2002) for locust bean (Ceratonia silique L.) ; Oje & Ugbor (1991) for oil bean (Pentaclethra machrophylla Benth.); Deshpande et al. (1993) for soybean (Glycine max (l) merr.); Cetin (2007) for Barbunia bean (Phaseolus vulgaris L.) ; Altuntas and Demirtola (2007) for kidney bean (Phaseolus vulgaris
L.). On the other hand, consumers and processors desire cultivars with low cooking time, soft texture, stability in color and moderately cracked (Bassinello et al., 2003; Aghakhani et al., 2012; Njage et al., 2012). Gathu and Njage (2012) have postulated that beans with softer texture have shorter cooking time making them more acceptable by consumer, since the bean become more palatable. Wang et al. (2003) mentioned also that consumers and processors alike prefer varieties with low cooking time and low hardness value. However, the physical properties of bio-fortified cultivars have not been adequately or comparatively studied. Because of varietal variability in common beans seeds, knowing the physical and cooking properties of different varieties is necessary. This study was therefore aimed at determining the physical and cooking characteristics of two bio-fortified common beans varieties grown in the DR Congo.
2. MATERIALS AND METHODS
2.1. Sample acquisition and preparation
Two varieties of bio-fortified common bean (P. vulgaris L.): HM21-7 (Figure 1a) and NAMULENGA (Figure 1b), were chosen for this study. This selection was based on their high productivity, high consumption and pleasant taste according to the consumers (Mushagalusa et al., 2016; Casinga, et al., 2015). The seeds were procured from CIAT/HarvestPlus, one of the projects dealing with promoting the bio-fortified beans in DR Congo (Lubobo & HarvestPlus, 2013). The dry beans were collected from an experiment conducted in the short rain season from March to May 2016 at INERA/MULUNGU station, 28 km from Bukavu Town, in DR Congo. Bean seeds were manually cleaned to remove foreign materials and damaged grains. All seeds were stored in moisture tight plastic bags to avoid moisture fluctuations (Güzel & Sayar, 2012). Dry and cleaned seeds were then transported to Nairobi for further analysis in the Food Science laboratories, at JKUAT and store at -21°C the freezer.
Food Science and Quality Management www.iiste.org
ISSN 2224-6088 (Paper) ISSN 2225-0557 (Online)
Vol.71, 2018
3
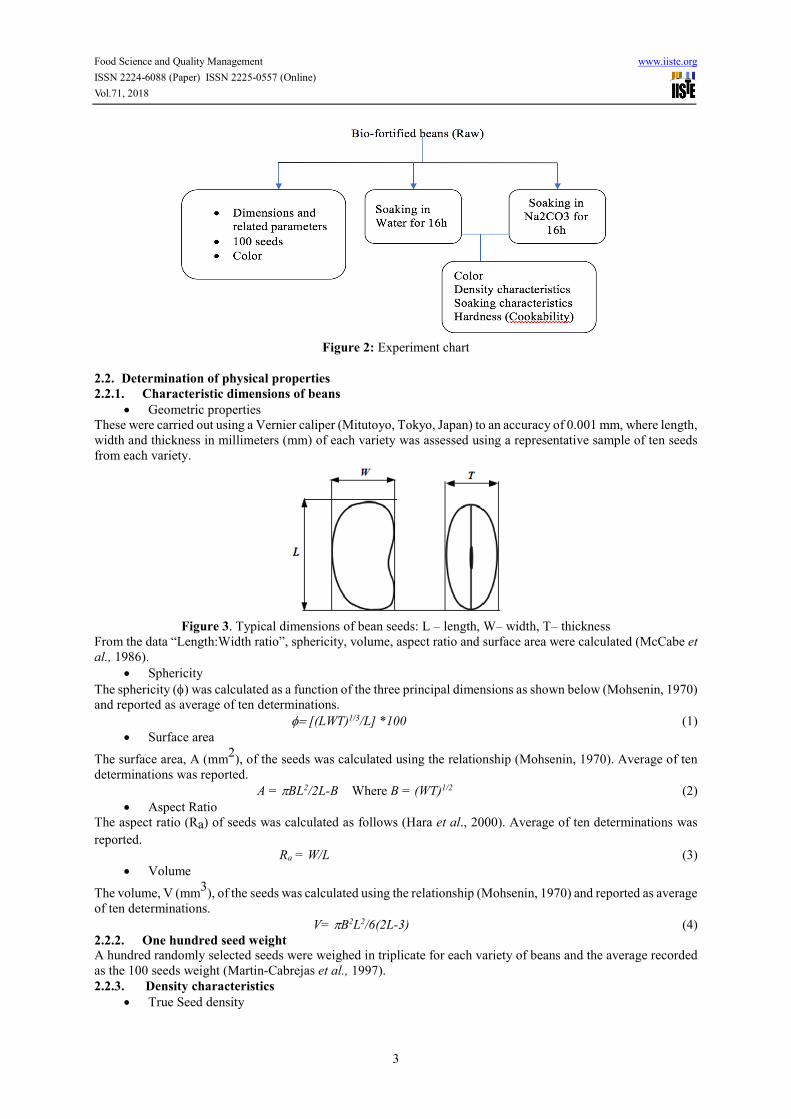
Figure 2: Experiment chart
2.2. Determination of physical properties
2.2.1. Characteristic dimensions of beans
• Geometric properties These were carried out using a Vernier caliper (Mitutoyo, Tokyo, Japan) to an accuracy of 0.001 mm, where length, width and thickness in millimeters (mm) of each variety was assessed using a representative sample of ten seeds from each variety.
Figure 3. Typical dimensions of bean seeds: L – length, W– width, T– thickness
From the data “Length:Width ratio”, sphericity, volume, aspect ratio and surface area were calculated (McCabe et
al., 1986). • Sphericity
The sphericity (φ) was calculated as a function of the three principal dimensions as shown below (Mohsenin, 1970) and reported as average of ten determinations.
φ= [(LWT)1/3/L] *100 (1) • Surface area
The surface area, A (mm2), of the seeds was calculated using the relationship (Mohsenin, 1970). Average of ten determinations was reported.
A = πBL2/2L-B Where B = (WT)1/2 (2) • Aspect Ratio
The aspect ratio (Ra) of seeds was calculated as follows (Hara et al., 2000). Average of ten determinations was
reported. Ra = W/L (3)
• Volume
The volume, V (mm3), of the seeds was calculated using the relationship (Mohsenin, 1970) and reported as average of ten determinations.
V= πB2L2/6(2L-3) (4) 2.2.2. One hundred seed weight
A hundred randomly selected seeds were weighed in triplicate for each variety of beans and the average recorded as the 100 seeds weight (Martin-Cabrejas et al., 1997). 2.2.3. Density characteristics
• True Seed density

Food Science and Quality Management www.iiste.org
ISSN 2224-6088 (Paper) ISSN 2225-0557 (Online)
Vol.71, 2018
4
The true seed density was obtained by liquid displacement (Asoegwu et al., 2006); Altuntaş, Özgöz & Taşer, 2005). Seeds (100g) was immersed in distilled water in a beaker. The mass of the displayed water is the balance reading with the seed submerged minus the mass of the beaker and water. The immersion was for a few seconds to avoid the seeds absorbing moisture. The seed volume (V) was estimated by dividing the mass of displayed water (g) by the density of water (g/cm3). Seed density was determined by dividing the seed mass by the measured seed volume.
True/seed density= �����������(�)�������������������(���) (5)
• Bulk density The AOAC method reported by (Ogunjimi, Aviara & Aregbesola, 2002) was adopted for bulk density determination. A measuring cylinder (500 mL) was filled with seeds to a height of 15 cm and then the content was weighed. This was repeated five times for each variety. Bulk density was calculated as the ratio of the bulk weight and the volume of the container (g/ml) (Asoegwu et al., 2006).
Bulk density= �����������(�)�����������������(���) (6)
• Porosity Seed porosity is the property of the grain which depends on its bulk and true densities. Mohsenin (1980) presents the formula for its calculation as shown below:
Porosity= �1 − ����������� ���������� !" ∗ 100 (7)
2.2.4. Soaking characteristics
• Hydration coefficient Twenty seeds of each variety were weighed in triplicate and soaked in distilled water and sodium carbonate (0.025 M Na2CO3) at 25 ̊C for 16 h at a ratio of 1:5 (w/v) (bean weight to water). The 0.025 N sodium carbonate was chosen due to the retention of natural color of the beans unlike higher concentrations which gave a darker color (Mendoza et al., 1985; Kinyanjui et al. 2016). After soaking, the beans were cut into half along the fissure. The Testa and Cotyledon were separated and free water was removed using a blotting paper. The result was expressed as the hydration coefficient (El-Refai et al., 1988).
Hydration coefficient= �������������������������������������������������� ∗ 100 (8)
• Swelling coefficient Twenty seeds of each variety were weighed in triplicate and soaked in distilled water, sodium carbonate (0.025 M Na2CO3) at 25 ̊C for 16 h at a ratio of 1:5 (w/v) (bean weight to water). The volume of raw bean seeds before and after soaking in distilled water was determined by water volume displaced in a graduated cylinder and expressed as the swelling coefficient (El-Refai et al., 1988).
Swelling coefficient= ����������������������������������������������� ∗ 100 (9)
• Electrolytes (conductivity) and solutes leaching Twenty seeds of each variety were soaked in distilled water and sodium carbonate (0.025 M Na2CO3) at 25 ̊C for 16 h at a ratio of 1:5 (w/v). The soaking water was then collected and leached electrolytes was quantified by assessing conductivity (µOhm/cm) with a digital conductivity meter (Sisabata model SC – 179, Tokyo, Japan). The solutes leached from beans was quantified by evaporating the soaking solution by drying in a hot air oven at 105 ̊C, followed by cooling in a desiccator and weighing. Results was expressed as mg/g dry weight of beans (Hentges et al., 1991). 2.2.5. Evaluation of bean color
Seed Testa colour was measured on the cheek of 10 seeds of each variety with a Minolta Chroma meter CR-400 (minolta-konica, Japan). L* (lightness), a* (green to red), and b* (blue to yellow) values were measured. Minolta a* and b* values were used to compute values for hue angle (H*) and chroma (C*), two parameters that are effective for describing visual colour appearance (Bernalte et al., 2003).
H* = tan–1
(b/a) ; (10)
C* = (a2
+ b2
)1/2 (11)
2.3. Measurement of hardness (cookability)
The raw beans were soaked overnight in distilled water and 0.025N Na2CO3, then cooked on a hot place in a beaker at 96°C for 30, 45, 60, 90, 120, 150, 180 and 210 minutes. The softness/hardness (cookability) of the beans was determined objectively using a Sun-Rheometer (Compact 100 Model CR-100, Sun Scientific Company Ltd, Tokyo, Japan). The system uses a cutting probe which could measure up to a maximum force of 100 N (10 kg) at a speed
of 100 mm min-1. Ten measurements were (seeds) made in each replication of the experiment, where each measurement was made on a different individual bean.
Food Science and Quality Management www.iiste.org
ISSN 2224-6088 (Paper) ISSN 2225-0557 (Online)
Vol.71, 2018
5
2.4. Statistical analysis
Results were expressed as the mean values ± standard deviation (SD). The data reported are averages of triplicate observations, except in some physical and textural properties where data are average of ten observations as specified in methods section. An analysis of variance with a significance level of 5% was done and LSD’s test was applied to determine differences between means using the commercial statistical package (Statistix 8.1). 3. RESULTS AND DISCUSSION
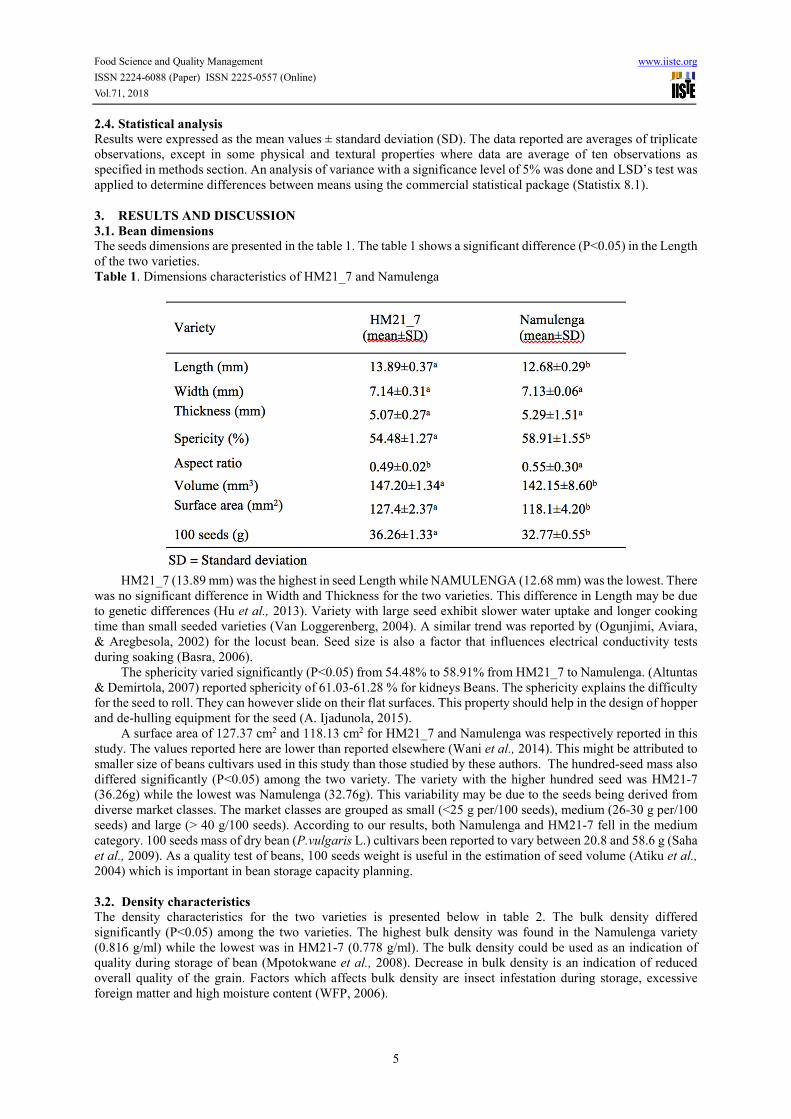
3.1. Bean dimensions
The seeds dimensions are presented in the table 1. The table 1 shows a significant difference (P<0.05) in the Length of the two varieties. Table 1. Dimensions characteristics of HM21_7 and Namulenga
HM21_7 (13.89 mm) was the highest in seed Length while NAMULENGA (12.68 mm) was the lowest. There
was no significant difference in Width and Thickness for the two varieties. This difference in Length may be due to genetic differences (Hu et al., 2013). Variety with large seed exhibit slower water uptake and longer cooking time than small seeded varieties (Van Loggerenberg, 2004). A similar trend was reported by (Ogunjimi, Aviara, & Aregbesola, 2002) for the locust bean. Seed size is also a factor that influences electrical conductivity tests during soaking (Basra, 2006).
The sphericity varied significantly (P<0.05) from 54.48% to 58.91% from HM21_7 to Namulenga. (Altuntas & Demirtola, 2007) reported sphericity of 61.03-61.28 % for kidneys Beans. The sphericity explains the difficulty for the seed to roll. They can however slide on their flat surfaces. This property should help in the design of hopper and de-hulling equipment for the seed (A. Ijadunola, 2015).
A surface area of 127.37 cm2 and 118.13 cm2 for HM21_7 and Namulenga was respectively reported in this study. The values reported here are lower than reported elsewhere (Wani et al., 2014). This might be attributed to smaller size of beans cultivars used in this study than those studied by these authors. The hundred-seed mass also differed significantly (P<0.05) among the two variety. The variety with the higher hundred seed was HM21-7 (36.26g) while the lowest was Namulenga (32.76g). This variability may be due to the seeds being derived from diverse market classes. The market classes are grouped as small (<25 g per/100 seeds), medium (26-30 g per/100 seeds) and large (> 40 g/100 seeds). According to our results, both Namulenga and HM21-7 fell in the medium category. 100 seeds mass of dry bean (P.vulgaris L.) cultivars been reported to vary between 20.8 and 58.6 g (Saha et al., 2009). As a quality test of beans, 100 seeds weight is useful in the estimation of seed volume (Atiku et al., 2004) which is important in bean storage capacity planning.
3.2. Density characteristics
The density characteristics for the two varieties is presented below in table 2. The bulk density differed significantly (P<0.05) among the two varieties. The highest bulk density was found in the Namulenga variety (0.816 g/ml) while the lowest was in HM21-7 (0.778 g/ml). The bulk density could be used as an indication of quality during storage of bean (Mpotokwane et al., 2008). Decrease in bulk density is an indication of reduced overall quality of the grain. Factors which affects bulk density are insect infestation during storage, excessive foreign matter and high moisture content (WFP, 2006).

Food Science and Quality Management www.iiste.org
ISSN 2224-6088 (Paper) ISSN 2225-0557 (Online)
Vol.71, 2018
6
Table 2. Density characteristics of HM21_7 and Namulenga
Bulk density of dry beans cultivars correlates negatively with 100 seeds mass (R= -0.73). This correlation indicates that largest bean type like the HM21_7, because of their high mass and low bulk density, would require larger storage space (Van Loggerenberg, 2004) and this occupy larger volumes. The result for bulk density falls within the range for most seeds as reported by (Mohsenin, 1986) for soya bean (0.840 g/ml), and (Altuntas et al., 2005) for vetch seed (0.785 g/ml). From the table 2, the true density ranged from 1.255 g/cm3 (HM21_7) to 1.249 g/cm3 (Namulenga). There was no significant difference (P>0,05) in the true density among the two varieties. The true density indicates that the seeds are heavier than water and this characteristic can be used to design separation or cleaning process (Mpotokwane et al., 2008).
Bulk density and true density of kidney beans cultivars in the range of 0.72-0.87 g/ml and 1.23-1.131 g/cm3, respectively has been reported (Ozturk et al., 2009). (Wani et al., 2014) reported the bulk density and true density in the range of 0.78-0.81 and 1.22-1.27; which is in agreement with our results.
The porosity ranged from 38.07% (HM21_7) to 34.82% (Namulenga). The HM21 variety was significantly higher in porosity than the Namulenga variety. The porosity is the fraction of the space in the bulk seeds which is not occupied by the seeds (Coşkuner & Karababa, 2007). It depends on the geometry and surface properties of the material (Mpotokwane et al., 2008) and allow fluid to pass through the bulk. It is useful in the calculation of the rate of aeration and cooling, drying and heating and in the design of heat exchangers and other similar equipment for bean handling (Asoegwu et al., 2006). The seed with low porosity will dry very slowly. The aeration of this beans will be difficult; natural aeration is impossible thus high power fans and motors should be employed for effective aeration (Asoegwu et al., 2006). Porosity has practical applications in the design of aeration systems during storage. It is also needed by the design engineer to know the number of seeds that will enter a hollow seed tube of the planter (Akaaimo & Raji, 2006).
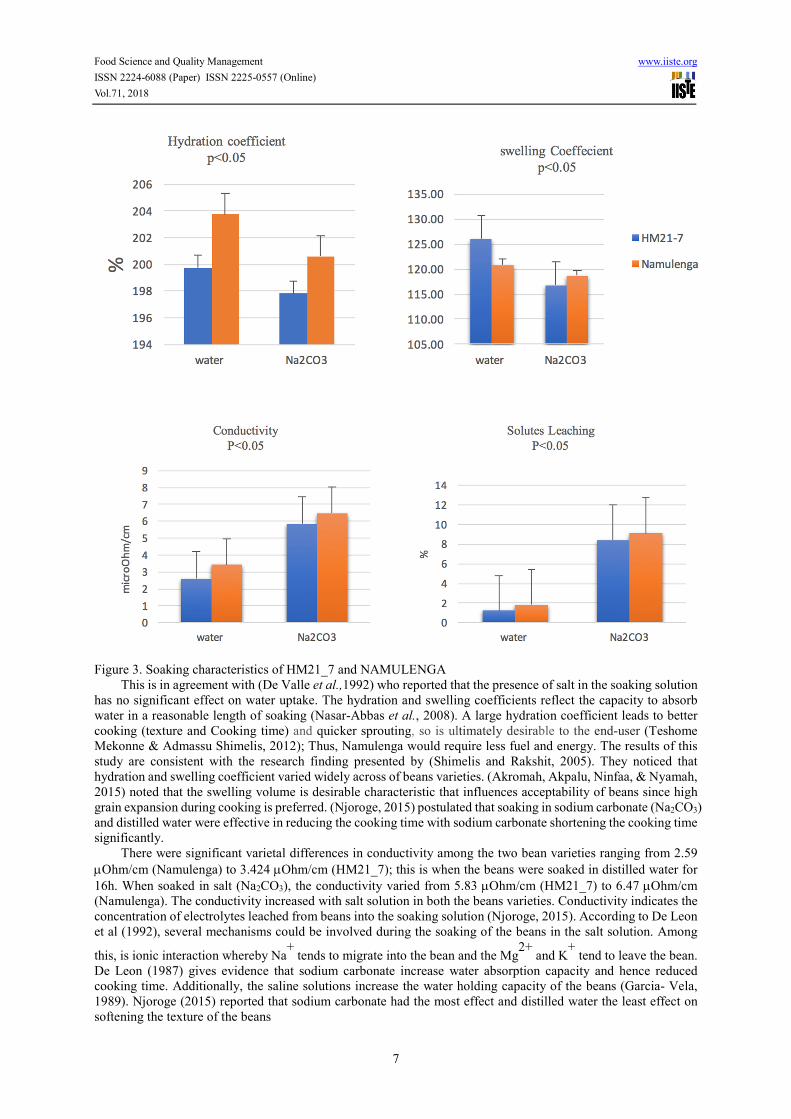
3.3. Soaking characteristics
The soaking characteristics of the two varieties are presented in the figure 3. There was significant difference (P<0.05) in the hydration coefficient among the two variety. When the beans were soaked in water for 16h hours at room temperature, Namulenga variety had the higher hydration coefficient (203.75%) while HM21_7 had the lowest (199.73%). The same effect has been found when the beans were soaked in Na2CO3 for 16h (200.59% for Namulenga and 197.81% for HM21_7). Hosfield & Uebersax (1980) found the hydration coefficient of seven types of white dry beans to range from 182% to 194% and significant differences (P < 0.01) between bean types were found for hydration coefficient. (Balasubramanian et al., 1999) found the same order of hydration coefficient ranges (184% to 196%) and significant differences (P < 0.05) in hydration coefficient values for three navy bean cultivars. There was significant difference (p<0.05) in swelling coefficient among the two variety when the beans were soaked in distilled water. On the other hand, there was no significant difference (p>0.05) in swelling coefficient when the beans were soaked in Na2CO3.
Food Science and Quality Management www.iiste.org
ISSN 2224-6088 (Paper) ISSN 2225-0557 (Online)
Vol.71, 2018
7
Figure 3. Soaking characteristics of HM21_7 and NAMULENGA
This is in agreement with (De Valle et al.,1992) who reported that the presence of salt in the soaking solution has no significant effect on water uptake. The hydration and swelling coefficients reflect the capacity to absorb water in a reasonable length of soaking (Nasar-Abbas et al., 2008). A large hydration coefficient leads to better cooking (texture and Cooking time) and quicker sprouting, so is ultimately desirable to the end-user (Teshome Mekonne & Admassu Shimelis, 2012); Thus, Namulenga would require less fuel and energy. The results of this study are consistent with the research finding presented by (Shimelis and Rakshit, 2005). They noticed that hydration and swelling coefficient varied widely across of beans varieties. (Akromah, Akpalu, Ninfaa, & Nyamah, 2015) noted that the swelling volume is desirable characteristic that influences acceptability of beans since high grain expansion during cooking is preferred. (Njoroge, 2015) postulated that soaking in sodium carbonate (Na2CO3) and distilled water were effective in reducing the cooking time with sodium carbonate shortening the cooking time significantly.
There were significant varietal differences in conductivity among the two bean varieties ranging from 2.59 µOhm/cm (Namulenga) to 3.424 µOhm/cm (HM21_7); this is when the beans were soaked in distilled water for 16h. When soaked in salt (Na2CO3), the conductivity varied from 5.83 µOhm/cm (HM21_7) to 6.47 µOhm/cm (Namulenga). The conductivity increased with salt solution in both the beans varieties. Conductivity indicates the concentration of electrolytes leached from beans into the soaking solution (Njoroge, 2015). According to De Leon et al (1992), several mechanisms could be involved during the soaking of the beans in the salt solution. Among
this, is ionic interaction whereby Na+
tends to migrate into the bean and the Mg2+
and K+
tend to leave the bean. De Leon (1987) gives evidence that sodium carbonate increase water absorption capacity and hence reduced cooking time. Additionally, the saline solutions increase the water holding capacity of the beans (Garcia- Vela, 1989). Njoroge (2015) reported that sodium carbonate had the most effect and distilled water the least effect on softening the texture of the beans

Food Science and Quality Management www.iiste.org
ISSN 2224-6088 (Paper) ISSN 2225-0557 (Online)
Vol.71, 2018
8
The higher levels of leached solutes when the beans were soaked in distilled water was found in the Namulenga variety (1.83%) while the lowest was found in the HM21_7 variety (1.23%). Soaking the beans in Na2CO3 solution increased the leached solutes from 9.09 % (Namulenga) to 8.42 % (HM21_7). Leached solids determine water uptake because of the decrease in the differential between intracellular and extracellular water potential (Hicks et al., 1987). Jones and Boulter (1983) stated that leached solids may affect hydration rate of beans in two ways. On one hand, the leached solids in the soaking water may increase the concentration of the solution which in turn affects water absorption rate. On the other hand, solute leakage may reduce water affinity and water holding capacity as is stipulated by osmotic principles. (Urga K, Fufa H, Biratu E, 2006) reported that the values for swelling power and leached of blanched seeds soaked in salt were significantly higher than those soaked in water. This agree with our finding.
3.4. Color characteristics of beans
Color is one of the properties of beans that consumers have specific preferences about (Hosfield, 1991). Table 3. Color parameter of surface in raw and pre-processed beans under soaking condition in distilled water and Sodium carbonate
The color readings were determined in terms of Hunter -L values (whiteness), Hunter-a values (redness) and
Hunter-b values (yellowness). HM21_7 Hunter-L values were 43.3 (Raw beans), 64.1 (soaked in distilled water) and finally 27.7 (soaked in Na2CO3). Namulenga Hunter-L values were 57.12 (Raw beans), 61.2 (soaked in distilled water) and 21.7 (soaked in Na2CO3). A significant difference (P<0.01) was observed in the L-value for both the varieties. Beans soaked in water had a higher Hunter-L value for both the varieties. This agree with the finding of (Uebersax, Shirazi & Lansing, 1990) who reported that, soaking of beans in water results in lighter colored beans, due to greater pigment leaching. For the raw beans, factors that can influence the color are bean genotype, variety, planting period, chemical composition of the beans and storage time (Mkanda et al., 2007). Chung et al. (1995) also found the lightness values of beans to be affected by seasonal effects in the case of red kidney beans. Beans soaked in Na2CO3 were darker compared to others. Ogwal OM et al.(1994) reported that dry seed soaked in sodium carbonate and bicarbonate cause the color to fade and produce undesirable flavors in beans. (Kinyanjui et al., 2016) reported also the dark color of bean soaked in high concentration of sodium carbonate. (Schoeninger et al., 2013) reported the same effect with carioca beans by saying that salt contributes to the increased darkening of the grain tegument thereby increasing the difference in color to the unprocessed product. This may be explained by several mechanisms involved during the soaking of the beans in the salt solution. Among
this is ionic interaction whereby Na+
tends to migrate into the bean and the Mg2+
and K+
tend to leave the bean (De Leon et al., 1992). The measures of differences in color are important in the food process industry to verify changes occurring after the treatments, to which the product is submitted, being an attribute of primary sensory quality (Barrett, Beaulieu & Shewfelt, 2010).
A significant difference (P < 0.01) was observed for Chroma (C*) and Hue (H*) values. A decrease in their values was observed in the soaked beans compared to the raw beans for both the varieties. Leahu & Rosu (2014) observed a decrease in the value Chroma (C*) index and coloring angle (H*) of the soaked beans compared to the raw sample. They found also that both Chroma and Hue angle values of soaking beans had a small variation range; which agree with our results. The Chroma parameter is indicative of the color intensity perceived by the human vision, the higher the value from parameter the greater the chromatic tonality of the samples, now the H* parameter is understood as tonality and defines the basic coloring of the sample (Granato and Masson, 2010).

Food Science and Quality Management www.iiste.org
ISSN 2224-6088 (Paper) ISSN 2225-0557 (Online)
Vol.71, 2018
9
Figure 4: Changes in color after soaking in distilled water and sodium carbonate
3.5. Effect of boiling on hardness of beans pre-soaked in distilled water and sodium carbonate
The hardness of the cooked beans is defined as the maximum force required for 75% deformation of seeds after cooking (Shimelis, 2006). Compare to the control (Unsoaked beans), soaking in sodium carbonate and distilled water were effective in reducing the cooking time but sodium reduced the cooking time significantly. (Njoroge, 2015) reported the same. The hardness measured in soaked beans indicated that HM21-7 had the harder beans and Namulenga had the softer. This is explained by varietal differences but also by the fact that Namulenga had the higher hydration and swelling coefficient compare to HM21_7 (Table 2). The peak force under compression in the texture analyzer decreased with increasing cooking time. Arntfield et al. (2001) reported similar results for lentils.
Figure 5: Texture of HM21_7 variety
Figure 6: Texture of NAMULENGA variety
Generally, monovalentsodium cations increase the softness. Shi et al. (2004) found CO32- was the most

Food Science and Quality Management www.iiste.org
ISSN 2224-6088 (Paper) ISSN 2225-0557 (Online)
Vol.71, 2018
10
effective anion to induce softness in beans. One of the possible mechanisms behind softening beans is dissolution
of pectic substances, which involves removal of divalent cations (Ca2+and Mg2+
) from pectic substances and
replacement with monovalent cations (Na1+and K1+
) during the salt-soaking process (Shi et al., 2004). Softness of beans can be enhanced by incorporation of higher concentrations of sodium salts, higher pH with ionic strength, and lower pH with higher ionic strength in the soaking solutions (Dewhurst et al.,2006). Schoeninger et al. (2013) investigated the effect of processing beans by soaking, and the bleaching salt solutions to obtain a reduced cooking time for dried beans. 4. Conclusion
This study provided information on physical and cooking properties of bio-fortified common bean (Phaseolus
vulgaris. L). The results from the seed dimensions and density characteristics varied significantly among the two varieties indicating that these would require some variation in the processing equipment design. The hydration coefficient and the swelling capacity were higher in Namulenga than in HM21_7; thus, Namulenga variety will cook fast and required less energy. A difference in 100-seed weight among the varieties was also observed, this indicates that they would occupy unequal space and the cost of transportation and packaging would be different. Beans soaked in distilled water were lighter due to greater pigment leaching whereas beans soaked in Na2CO3 were darker colored. Soaking the beans in Na2CO3 was effective in reducing cooking though it causes the bean to darken. Acknowledgements
I acknowledge with thanks the Université Evangélique en Afrique for funding this project and CIAT/HarvestPlus project for providing the bio-fortified beans. I also acknowledge Mr. David Abuga and Ms. Jessica for earnestly provided me with their technical support in the pursuit of my experiment.
References
A, Ijadunola. J. (2015). Determination of Some Physical Properties and Terminal Velocity of Locust Beans of Parkia Specie (Parkia Biglobosa). Science and Engineering Perspectives SEP, 10(10), 105–111. Aghkhani, M. H., Ashtiani, S. H. M., & Motie, J. B. (2012). Physical properties of Christmas Lima bean at different
moisture content. International Agrophysics, 26(1970), 341–346. https://doi.org/10.2478/v10247-012-0048-0
Akaaimo, D. I., & Raji, A. O. (2006). Some Physical and Engineering Properties of Prosopis africana seed. Biosystems Engineering, 95(2), 197–205. https://doi.org/10.1016/j.biosystemseng.2006.06.005
Akromah, R., Akpalu, M. M., Ninfaa, A. D., & Nyamah, E. Y. (2015). Participatory Rural Appraisal of Constraints to Groundnut ( Arachis hypogaea L .) Production in Northern Ghana, 3(10), 54–76.
Altuntas, E., & Demirtola, H. (2007). Effect of moisture content on physical properties of some grain legume seeds. New Zealand Journal of Crop and Horticultural Science, 35(4), 423–433. https://doi.org/10.1080/01140670709510210
Altuntaş, E., Özgöz, E., & Taşer, Ö. F. (2005). Some physical properties of fenugreek (Trigonella foenum-graceum L.) seeds. Journal of Food Engineering, 71(1), 37–43. https://doi.org/10.1016/j.jfoodeng.2004.10.015
Arntfield, S. D., Scanlon, M. G., Malcolmson, L. J., Watts, B. M., Cenkowski, S., Ryland, D., & Savoie, V. (2001). Reduction in lentil cooking time using micronization: Comparison of 2 micronization temperatures. Journal
of Food Science, 66(3), 500–505. https://doi.org/10.1111/j.1365-2621.2001.tb16139.x Asoegwu, S. N., Ohanyere, S. O., Kanu, O. P., & Iwueke, C. N. (2006). Physical Properties of African Oil Bean
Seed ( Pentaclethra macrophylla ), VIII, 1–16. Atiku, A. A., Aviara, N. A., & Haque, M. A. (2004). Performance Evaluation of a bambara ground nut sheller.
Agricultural Engineering International: The CIGR Journal of Scientific Research and Development, VI, 1–18.
Balasubramanian, P., Slinkard, A., Tyler, R., & Vandenberg, A. (1999). Genotype and environment effect on canning quality of dry bean grown in Saskatchewan. Canadian Journal of Plant Science, 79(3), 335–342. https://doi.org/10.4141/P98-107
Barrett, D. M., Beaulieu, J. C., & Shewfelt, R. (2010). Color, Flavor, Texture, and Nutritional Quality of Fresh-cut Fruits and Vegetables - Desirable Levels, Instrumental and Sensory Measurement, and the Effects of Processing. Critical Reviews in Food Science and Nutrition, 50(5), 369–389. https://doi.org/10.1080/10408391003626322
Blair, M. W., Izquierdo, P., Astudillo, C., & Grusak, M. A. (2013). A legume biofortification quandary: variability and genetic control of seed coat micronutrient accumulation in common beans. Frontiers in Plant Science, 4(July), 275. https://doi.org/10.3389/fpls.2013.00275
Bouis, H. E., Hotz, C., McClafferty, B., Meenakshi, J. V., & Pfeiffer, W. H. (2011). Biofortification: A new tool

Food Science and Quality Management www.iiste.org
ISSN 2224-6088 (Paper) ISSN 2225-0557 (Online)
Vol.71, 2018
11
to reduce micronutrient malnutrition. Food and Nutrition Bulletin, 32(1 SUPPL.). https://doi.org/10.1177/15648265110321S105
Broughton, W. J., Hernández, G., Blair, M., Beebe, S., Gepts, P., & Vanderleyden, J. (2003). Beans (Phaseolus spp.) – model food legumes. Plant and Soil, 252(1), 55–128. Retrieved from http://dx.doi.org/10.1023/A:1024146710611
Casinga, C. M., Cirimwami, L. T., Amzati, G. S., Katembera, Joseph I. Lubobo, A. K., & Mushagalusa, G. N. (2015). Effect of the environment on the adaptability of biofortified bean genotypes in the eastern Democratic Republic of Congo: case of South Kivu. European Journal of Agriculture and Forestry Research, 3(9), 38–47.
Chung East Lansing, MI.), Y. S. (Michigan S. U., Jackson, J. C., Uebersax, M. A., Kelly, J. D., & Long, R. A. (n.d.). Evaluation of color and selected physical characteristics of kidney beans grown in Northern Michigan. Michigan Dry Bean Digest (USA).
Coşkuner, Y., & Karababa, E. (2007). Some physical properties of flaxseed (Linum usitatissimum L.). Journal of
Food Engineering, 78(3), 1067–1073. https://doi.org/10.1016/j.jfoodeng.2005.12.017 Dewhurst, R. J., Shingfield, K. J., Lee, M. R. F., & Scollan, N. D. (2006). Increasing the concentrations of
beneficial polyunsaturated fatty acids in milk produced by dairy cows in high-forage systems. Animal Feed
Science and Technology, 131(3-4), 168–206. https://doi.org/10.1016/j.anifeedsci.2006.04.016 Gonzalez De Mejia, E., Valadez-Vega, M. D. C., Reynoso-Camacho, R., & Loarca-Pina, G. (2005). Tannins,
trypsin inhibitors and lectin cytotoxicity in tepary (Phaseolus acutifolius) and common (Phaseolus vulgaris) beans. Plant Foods for Human Nutrition, 60(3), 137–145. https://doi.org/10.1007/s11130-005-6842-0
Granato, D., & Masson, M. L. (2010). Instrumental color and sensory acceptance of soy-based emulsions: a response surface approach. Ciência E Tecnologia de Alimentos, 30(4), 1090–1096. https://doi.org/10.1590/S0101-20612010000400039
Güzel, D., & Sayar, S. (2012). Effect of cooking methods on selected physicochemical and nutritional properties of barlotto bean, chickpea, faba bean, and white kidney bean. Journal of Food Science and Technology, 49(1), 89–95. https://doi.org/10.1007/s13197-011-0260-0
Hara, M. H., Criner, B. R., Brusewitz, G. H., & Solie, J. B. (n.d.). S Elected P Hysical C Haracteristics and a Erodynamic P Roperties, II(July 2000), 1–14.
HarvestPlus. (2014). Biofortification Progress Briefs, (August), 82. Retrieved from http://www.harvestplus.org/content/new-progress-briefs-biofortification-released
Hicks, B. B., Baldocchi, D. D., Meyers, T. P., Hosker, R. P., & Matt, D. R. (1987). A preliminary multiple resistance routine for deriving dry deposition velocities from measured quantities. Water, Air, and Soil
Pollution, 36(3-4), 311–330. https://doi.org/10.1007/BF00229675 Hu, Z., Zhang, H., Kan, G., Ma, D., Zhang, D., Shi, G., … Yu, D. (2013). Determination of the genetic architecture
of seed size and shape via linkage and association analysis in soybean (Glycine max L. Merr.). Genetica, 141(4-6), 247–254. https://doi.org/10.1007/s10709-013-9723-8
Kinyanjui, P. K., Njoroge, D. M., Makokha, A. O., Christiaens, S., Sila, D. N., & Hendrickx, M. (2016). Quantifying the Effects of Postharvest Storage and Soaking Pretreatments on the Cooking Quality of Common Beans ( Phaseolus vulgaris ). Journal of Food Processing and Preservation, 00. https://doi.org/10.1111/jfpp.13036
Leahu, A., & Rosu, A. I. (2014). COLOUR PARAMETERS OF COMMON BEANS ( Phaseolus Vulgaris L .), XIII(3), 2014.
Leterme, P., & Carmenza Muñoz, L. (2002). Factors influencing pulse consumption in Latin America. The British
Journal of Nutrition, 88 Suppl 3(January 2003), S251–5. https://doi.org/10.1079/BJN/2002714 Lubobo, A., & Harvestplus, C. (2013). Delivery of Iron Beans in Democratic Republic of Congo ( DRC ). Lvin, J. B. (1971). Analytical evaluation of pressures of granular materials on silo walls. Powder Technology,
34(`35), 280–285. Mendoza, E. M. A. E. T. (1985). Effects of soaking in aqueous acidic and alkali solutions on removal o f
polyphenols and in vitro digestibility of cowpea Chemicals Determination o f total and protein-precipitable polyphenols The total polyphenol content of the cowpea seeds ( both contro, 36.
Mpotokwane, S. M., Gaditlhatlhelwe, E., Sebaka, A., & Jideani, V. A. (2008). Physical properties of bambara groundnuts from Botswana. Journal of Food Engineering, 89(1), 93–98. https://doi.org/10.1016/j.jfoodeng.2008.04.006
Mushagalusa, N. G., Kashemwa, A., & Sinza, C. B. (2016). Responses of biofortified common bean varieties to diammonium phosphate fertilizer under climate variability conditions in ... Responses of biofortified common bean varieties to di- ammonium phosphate fertilizer under climate variability conditions in Sou, (September). https://doi.org/10.5897/AJAR2016.11295
Nasar-Abbas, S. M., Plummer, J. A., Siddique, K. H. M., White, P., Harris, D., & Dods, K. (2008). Cooking quality of faba bean after storage at high temperature and the role of lignins and other phenolics in bean hardening.

Food Science and Quality Management www.iiste.org
ISSN 2224-6088 (Paper) ISSN 2225-0557 (Online)
Vol.71, 2018
12
LWT - Food Science and Technology, 41(7), 1260–1267. https://doi.org/10.1016/j.lwt.2007.07.017 Njoroge, D. (2015). Impact of Storage Conditions on the Physical Properties and Cooking Characteristics of Two
Bean Varieties Grown in Kenya, 40, 15–25. Ogunjimi, L. A. O., Aviara, N. A., & Aregbesola, O. A. (2002). Some engineering properties of locust bean seed.
Journal of Food Engineering, 55(2), 95–99. https://doi.org/10.1016/S0260-8774(02)00021-3 Ozturk, I., Kara, M., Yildiz, C., & Ercisli, S. (2009). Physico‐mechanical seed properties of the common Turkish
bean ( Phaseolus vulgaris ) cultivars “Hinis” and “Ispir.” New Zealand Journal of Crop and Horticultural
Science, 37(1), 41–50. https://doi.org/10.1080/01140670909510248 Perina, E. et al. (2014). Technological quality of common bean grains obtained in different growing seasons.
Bragantia, Campinas, 73(1), 14–22. Saha, S., Singh, G., Mahajan, V., & Gupta, H. S. (2009). Variability of nutritional and cooking quality in bean
(Phaseolus vulgaris L) as a function of genotype. Plant Foods for Human Nutrition, 64(2), 174–180. https://doi.org/10.1007/s11130-009-0121-4
Schoeninger, V., Coelho, S. R. M., Christ, D., Sampaio, S. C., & de Almeida, A. J. B. (2013). Pre-processing of aged carioca beans: Soaking effect in sodium salts in the cooking and nutrition quality. Journal of Food,
Agriculture and Environment, 11(1), 184–189. Shi, J., Arunasalam, K., Yeung, D., Kakuda, Y., Mittal, G., & Jiang, Y. (2004). SAPONIN DISTRIBUTION IN
EDIBLE BEANS, 7(1), 67–78. Shimelis, E. A., & Rakshit, S. K. (2005). Proximate composition and physico-chemical properties of improved
dry bean (Phaseolus vulgaris L.) varieties grown in Ethiopia. LWT - Food Science and Technology, 38(4), 331–338. https://doi.org/10.1016/j.lwt.2004.07.002
Shimelis, H. A. (2006). Associations of yield and yield components among selected durum wheats (Triticum turgidum L.). South African Journal of Plant and Soil, 23(4), 305–309. https://doi.org/10.1080/02571862.2006.10634770
Singh, N., Kaur, M., Sandhu, K. S., & Guraya, H. S. (2004). Physicochemical, Thermal, Morphological and Pasting Properties of Starches from some Indian Black Gram (Phaseolus mungo L.) Cultivars. Starch -
St�Rke, 56(11), 535–544. https://doi.org/10.1002/star.200400290 Teshome Mekonne and Admassu Shimelis. (2012). Canning Quality Evaluation of Common Bean (Phaseolus
vulgaris L.) Varieties Grown in the Central Rift Valley of EthiopiaDerese. East African Journal of Science, 6(1), 65–78.
Uebersax, M. A., Shirazi, A., & Lansing, E. (1990). were observed for all soak treatments (Fig. 3). Anasazi beans, 198–199.
Urga K, Fufa H, Biratu E, G. M. (2006). Effects of Blanching and Soaking on Some Physical Characteristics of Grass Pea (Lathyrus Sativus). African Journal of Food Agriculture Nutrition and Development, 6(1), 1–17. https://doi.org/10.4314/ajfand.v6i1.19174
Wani, I. A., Sogi, D. S., Wani, A. A., & Gill, B. S. (2014). Physical and cooking characteristics of some Indian kidney bean (Phaseolus vulgaris L.) cultivars. Journal of the Saudi Society of Agricultural Sciences, 16(1), 7–15. https://doi.org/10.1016/j.jssas.2014.12.002