phylogenomic analysis of a rapid radiation of misfit ... · phylogenomic analysis of a rapid...
TRANSCRIPT

Molecular Phylogenetics and Evolution 113 (2017) 33–48
Contents lists available at ScienceDirect
Molecular Phylogenetics and Evolution
journal homepage: www.elsevier .com/ locate /ympev
Phylogenomic analysis of a rapid radiation of misfit fishes(Syngnathiformes) using ultraconserved elements
http://dx.doi.org/10.1016/j.ympev.2017.05.0021055-7903/� 2017 Elsevier Inc. All rights reserved.
⇑ Corresponding author.E-mail address: [email protected] (S.J. Longo).
S.J. Longo a,⇑, B.C. Faircloth b, A. Meyer c, M.W. Westneat d, M.E. Alfaro e, P.C. Wainwright a
aDepartment of Evolution and Ecology, University of California, Davis, CA 95616, USAbDepartment of Biological Sciences and Museum of Natural Science, Louisiana State University, Baton Rouge, LA 70803, USAcDepartment of Biology, University of Konstanz, D-78457 Konstanz, GermanydDepartment of Organismal Biology and Anatomy, University of Chicago, Chicago, IL 60637, USAeDepartment of Ecology and Evolutionary Biology, University of California, Los Angeles, CA 90095, USA
a r t i c l e i n f o
Article history:Received 12 December 2016Revised 3 May 2017Accepted 4 May 2017Available online 6 May 2017
Keywords:PhylogenomicsUltraconserved elementsSyngnathiformesSyngnathidaeCallionymidaeRapid radiation
a b s t r a c t
Phylogenetics is undergoing a revolution as large-scale molecular datasets reveal unexpected but repeat-able rearrangements of clades that were previously thought to be disparate lineages. One of the mostunusual clades of fishes that has been found using large-scale molecular datasets is an expandedSyngnathiformes including traditional long-snouted syngnathiform lineages (Aulostomidae,Centriscidae, Fistulariidae, Solenostomidae, Syngnathidae), as well as a diverse set of largely benthic-associated fishes (Callionymoidei, Dactylopteridae, Mullidae, Pegasidae) that were previously dispersedacross three orders. The monophyly of this surprising clade of fishes has been upheld by recent studiesutilizing both nuclear and mitogenomic data, but the relationships among major lineages withinSyngnathiformes remain ambiguous; previous analyses have inconsistent topologies and are plaguedby low support at deep divergences between the major lineages. In this study, we use a dataset of ultra-conserved elements (UCEs) to conduct the first phylogenomic study of Syngnathiformes. UCEs have beeneffective markers for resolving deep phylogenetic relationships in fishes and, combined with increasedtaxon sampling, we expected UCEs to resolve problematic syngnathiform relationships. Overall, UCEswere effective at resolving relationships within Syngnathiformes at a range of evolutionary timescales.We find consistent support for the monophyly of traditional long-snouted syngnathiform lineages(Aulostomidae, Centriscidae, Fistulariidae, Solenostomidae, Syngnathidae), which better agrees withmorphological hypotheses than previously published topologies from molecular data. This result wassupported by all Bayesian and maximum likelihood analyses, was robust to differences in matrix com-pleteness and potential sources of bias, and was highly supported in coalescent-based analyses inASTRAL when matrices were filtered to contain the most phylogenetically informative loci. WhileBayesian and maximum likelihood analyses found support for a benthic-associated clade(Callionymidae, Dactylopteridae, Mullidae, and Pegasidae) as sister to the long-snouted clade, this resultwas not replicated in the ASTRAL analyses. The base of our phylogeny is characterized by short internodesseparating major syngnathiform lineages and is consistent with the hypothesis of an ancient rapid radi-ation at the base of Syngnathiformes. Syngnathiformes therefore present an exciting opportunity to studypatterns of morphological variation and functional innovation arising from rapid but ancient radiation.
� 2017 Elsevier Inc. All rights reserved.
1. Introduction
Syngnathiformes (seahorses, pipefishes, and their relatives) area morphologically distinctive group of fishes with novel modes oflocomotion, reproduction, and feeding. Lineages within Syngnathi-formes have evolved vertical swimming postures (head-down in
shrimpfish: Centriscidae; head-up in seahorses: Syngnathidae),prehensile tails (seahorses, pipehorses: Syngnathidae), power-amplified feeding (Syngnathidae), female egg-brooding in special-ized pelvic fins (ghost-pipefishes: Solenostomidae), and, of course,male pregnancy (Syngnathidae). The Syngnathidae is by far themost studied family within Syngnathiformes, and they havebecome a model system for the study of sexual selection andsex-role reversal (Berglund and Rosenqvist, 2003; Mobley andJones, 2013; Stolting and Wilson, 2007; Wilson et al., 2001, 2003)

34 S.J. Longo et al. /Molecular Phylogenetics and Evolution 113 (2017) 33–48
and exceptional adaptation, including feeding behaviors and tailmorphology (Neutens et al., 2014; Porter et al., 2015; VanWassenbergh et al., 2008, 2009). However, the study of the originand evolution of traits within syngnathids, and within syngnathi-forms as a whole, has been hampered by the lack of well-sampled, and well-supported, phylogenetic hypotheses of the rela-tionships between syngnathiform families and their associationwith other acanthomorph fishes.
The order Syngnathiformes encompasses a number of familiescharacterized by an elongated tube-shaped snout with small jawsat the end and traditionally includes at least five families: Aulosto-midae (trumpetfish), Centriscidae (shrimpfish and snipefish), Fis-tulariidae (cornetfish), Solenostomidae (ghost pipefish), andSyngnathidae (seahorses, pipefish, and seadragons) (Nelson,2006). The Pegasidae (seamoths) have often been considered closerelatives of the Syngnathiformes based on a number of characters,including their gill filament structure and the possession of bonyarmor (Johnson and Patterson, 1993; Nelson, 2006; Pietsch,1978). Morphological traits, including the presence of armor andabsence of pleural ribs in some taxa, has also led to the associationof Syngnathiformes with the Gasterosteiformes, which historicallyincluded the families Aulorhynchidae (tubesnouts), Gasterosteidae(sticklebacks), Hypoptychidae (sand eels), and Indostomidae(armored sticklebacks) (Nelson, 2006). The history of phylogenet-ics and taxonomic work on this group is rich, with many of the pos-sible combinations of relationships among syngnathiform andgasterosteiform lineages proposed previously (Wilson and Orr,2011). However, an alternative to a close syngnathiform-gasterosteiform relationship had never been suggested before theuse of molecular phylogenetics.
In contrast with morphological studies, large-scale moleculardatasets with broad taxonomic sampling have consistentlyrejected a close relationship between Syngnathiformes and Gas-terosteiformes (Betancur-R et al., 2013a; Chen et al., 2003; Dettaiand Lecointre, 2005; Kawahara et al., 2008; Leo and Craig, 2007;Li et al., 2009; Near et al., 2012, 2013; Sanciangco et al., 2016;Smith and Wheeler, 2004, 2006; Song et al., 2014). Instead, tradi-tional long-snouted syngnathiform lineages fall out among a sur-prising array of largely benthic-associated fishes, including thefamiliar pegasid seamoths, Dactylopteridae (flying gurnards), Cal-lionymoidei (dragonets), and Mullidae (goatfishes) (Fig. 1). Eachof these groups has been historically problematic in their ownright, with much debate about their relationships to other fishesarising based on morphological studies. Although Pietsch (1978)noted similarities linking Dactylopteridae to Pegasidae and/or Syn-gnathiformes, more recent morphological classifications haveplaced Dactylopteridae as a suborder within Scorpaeniformes(Eschmeyer et al., 2017; Nelson, 1994, 2006; Washington et al.,1984), its own order closely related to Scorpaeniformes (Johnsonand Patterson, 1993), or a perciform family closely related to theMalacanthidae (Imamura, 2000). The Callionymoidei is composedof two families of dragonets, the Callionymidae and Draconettidae;this order has generally been considered a notothenioid derivativewith a strong affinity with gobiesocid clingfishes (Allen, 1984;Gosline, 1970; Nelson, 1994, 2006; Springer and Johnson, 2004),although this affinity has been challenged based on key osteologi-cal differences (Allen, 1984; Houde, 1984). Mullidae, or goatfishes,are largely characterized by a number of unique morphologicalcharacteristics, many of them relating to the specialization of thehyoid apparatus into barbels, which ‘‘have no counterpart, rudi-mentary or well-developed, elsewhere among percoids” (Gosline,1984). Based on vertebral and cranial similarities, goatfish havebeen linked within Perciformes to the Lutjanidae or Sparidae(Gosline, 1984; Gregory, 1933), though Gosline notes that manysuch characters could be the result of convergent adaptation tobenthic feeding. The surprising but replicated rearrangement of
families previously thought to be associated with disparate lin-eages across the Scorpaeniformes, Perciformes, and Gas-terosteiformes into this new syngnathiform clade has been oneof the major upheavals in modern molecular phylogenetics forfishes, akin to the finding of a close relationship between Lophi-iformes and Tetraodontiformes (Miya et al., 2003; Song et al.,2014).
Studies incorporating broad sampling across the fish tree oflife with a variety of genetic loci and phylogenetic reconstructionmethods provide strong evidence for a monophyletic Syngnathi-formes comprised of the Synganthidae, Solenostomidae, Aulosto-midae, Fistulariidae, Centriscidae, Pegasidae, Dactylopteridae,Callionymidae, Draconnetidae, and Mullidae (Betancur-R et al.,2013a; Kawahara et al., 2008; Near et al., 2012, 2013;Sanciangco et al., 2016; Song et al., 2014). Song et al. (2014)recently used whole mitogenomes and a likelihood approach toconfirm the monophyly of this clade; based on their results, Songet al. suggested this clade be referred to as ‘Syngnathiformes’ overother alternatives (e.g., Clade D, Syngnathoidei, Syngnatharia),and we use this more inclusive definition of Syngnathiformeshere. While the affinities of these diverse fishes are strongly sup-ported by molecular data, the interrelationships of syngnathiformfamilies remain ambiguous because previous molecular phyloge-nies recover conflicting topologies (Fig. 1; also see review inSong et al., 2014). For instance, traditional long-snouted syng-nathiforms (Aulostomidae, Centriscidae, Fistulariidae, Solenosto-midae, Synganthidae) may be monophyletic and nested withinthe benthic-associated families (Pegasidae, Dactylopteridae, Cal-lionymidae, Draconnetidae, and Mullidae) similar to Near et al.(2013). Alternatively, the benthic lineages may be interspersedamong traditional syngnathiforms similar to Betancur-R et al.(2013a) or Song et al. (2014). In addition to topological inconsis-tency, previous analyses found low support at multiple nodesseparating the deep divergences among the major lineages withinSyngnathiformes (Fig. 1).
One factor that may account for the inconsistency among previ-ous studies is taxonomic coverage. Of the previous molecular data-sets, only Song et al. (2014) included a representative from alleleven revised syngnathiform families. In addition, because thesestudies were focused on broad-scale relationships among the fishtree of life, most included a single species or few representativesper lineage. Sanciangco et al. (2016) included the most syngnathi-form taxa to date, but their overall species representation is stilllow for the most speciose families (e.g. they included only eightsyngnathid species, which is about 2.5% of the 316 valid speciesin this family according to Eschmeyer et al. (2017)). Although thereis some debate about the effectiveness of increasing taxon sam-pling in light of the computational demands of increasingly largematrices, it is generally agreed that higher species coverage shouldincrease phylogenetic accuracy (Heath et al., 2008; Lecointre et al.,1993; Zwickl and Hillis, 2002). The addition of taxa is also vitallyimportant when lineages have deep divergences and are thereforeseparated by long branches (Hillis et al., 2003). We expect suchchallenges apply to the accurate recovery of the sygnanthiformtree, given that prior studies have found that major lineages siton relatively long branches that in turn stem from a series of rapiddivergences with short internodes (e.g., Betancur-R et al., 2013a;Near et al., 2012; Song et al., 2014). Some of the longest branches,such as those leading to aulostomids and solenostomids, will beimpossible to break given that these families circumscribe fewrecently-diverged species (e.g., Bowen et al., 2001). However, otherfamilies like the Syngnathidae, Callionymidae, and Mullidae aremuch richer in species than their representation in previouslarge-scale analyses, and better sampling from these clades mayhelp alleviate long-branch attraction artifacts (Heath et al., 2008;Hillis et al., 2003).

A. Kawahara et al. (2008)Ce
Pe
So
Sy
Fi
Au
Da
B. Near et al. (2012)Au
Ce
Ca
Sy
Fi
C. Near et al. (2013)MuPeDaCaCeAuFiSy
D. Betancur−R et al. (2013)AuCeDaCaFiSyCrMu
E. Song et al. (2014)CeDaFiAuMuPeCaDrSoSy
F. Sanciangco et al. (2016)DaAuCeFiMuPeCaSy
Bootstrap <70%Bootstrap >69%
Fig. 1. Recently published relationships for syngnathiform lineages based on large-scale molecular datasets. Although sampling varies along studies, traditional long-snoutedsyngnathiform lineages (purple) and pegasids (gray) fall out among an array of benthic-associated lineages. However, among-family relationships are highly variable andoften poorly supported. Cladograms are redrawn from the following sources: (A) Kawahara et al. (2008; Fig. 3), (B) Near et al. (2012; Fig. S1), (C) Near et al. (2013; Fig. S1C),(D) Betancur-R et al. (2013a; Fig. 4), (E) Song et al. (2014; Fig. 2), (F) Sanciangco et al. (2016; Fig. S1). Nodes are labeled by bootstrap support: greater than or equal to 70%(black) or less than 70% (white). Abbreviations: Au = Aulostomidae, Ce = Centriscidae (which includes ‘Macroramphosidae’), Ca = Callionymidae, Cr = Creedidae. Da = Dacty-lopteridae, Dr = Draconettidae, Fi = Fistulariidae, Mu = Mullidae, Pe = Pegasidae, Sy = Syngnathidae, So = Solenostomidae. (For interpretation of the references to color in thisfigure legend, the reader is referred to the web version of this article.)
S.J. Longo et al. /Molecular Phylogenetics and Evolution 113 (2017) 33–48 35
In this study, we investigate the evolutionary history of Syng-nathiformes by inferring several phylogenies using ultraconservedelements (UCEs). Our goal is to estimate the relationships amongsyngnathiform fishes by including members of all major lineages,increasing the sampled species diversity, and leveraging the powerof a phylogenomic dataset. We use an actinopterygian-specific setof probes to target approximately 1340 UCEs that have been effec-tive markers for resolving deep phylogenetic relationships, partic-ularly for acanthomorph fishes (Faircloth et al., 2013; Gilbert et al.,2015). Hybrid capture of UCEs renders sequence data that have adramatic substitution-rate profile—ranging from sites with verylow substitution rates near the UCE core to sites with substantiallyhigher rates in the flanking regions (Faircloth et al., 2012). Both thecore and flanking regions of UCEs have been shown to have consid-erably higher net phylogenetic informativeness compared to pro-tein coding genes over a range of divergence times (Gilbert et al.,2015), and UCE sequence data has been used to resolve phyloge-netic relationships spanning a wide range of divergence dates ina number of clades across the tree of life (Blaimer et al., 2015;Crawford et al., 2012; Faircloth et al., 2014; Harvey et al., 2016;Manthey et al., 2016; McCormack et al., 2012; Smith et al., 2014).Therefore our UCE dataset, combined with increased taxonomiccoverage, should provide increased resolution of the problematicand deep branching patterns within Syngnathiformes spanning a60–90 million-year interval (Betancur-R et al., 2013a; Near et al.,2012; Sanciangco et al., 2016).
2. Materials and methods
2.1. Taxon sampling
Our dataset is composed of 112 species representing 10 out ofthe 11 syngnathiform families as follows: Syngnathidae (59 spe-cies, out of 316), Solenostomidae (2 species, out of 6), Centriscidae(4 species out of 13, including species of Macroramphosus whichwere previously grouped in the family Macroramphosidae),Aulostomidae (2 species, out of 3), Fistulariidae (4 species, out of4), Pegasidae (2 species, out of 6), Dactylopteridae (3 species, outof 7), Callionymidae (22 species, out of 198), and Mullidae (14 spe-
cies, out of 87). Of all syngnathiforms lineages, only a representa-tive of the callionymoid family Draconnetidae (15 species) ismissing due to insufficient sample quality. We used the scombroidTaractichthys longipinnis as an outgroup, because recent molecularstudies using nuclear datasets have identified the Scombroidei (orScombroidei plus other Perciformes) as the closest relatives of Syn-gnathiformes (Betancur-R et al., 2013a; Dettai and Lecointre, 2005;Near et al., 2012, 2013; Sanciangco et al., 2016). AlthoughBetancur-R et al. (2013a) reported the inclusion of Creedidaewithin Syngnathiformes, this result was not replicated by afollow-up study by the same authors, where they noted that suchspurious placement was likely the result of low sample quality orcontamination (Sanciangco et al., 2016). Therefore this family isnot included here. Details regarding sampled taxa can be foundin Supplementary Table S1.
2.2. Library preparation, targeted enrichment of UCEs, sequencing, andassembly
Aside from samples loaned as DNA extracts (SupplementaryTable S1), we extracted DNA from ethanol-preserved tissues fol-lowing a modified Qiagen DNeasy protocols (McGee et al., 2016).We quantified all DNA extracts with a Qubit Fluorometer, assessedeach extract for quality by electrophoresis, and then shearedextracts by sonication to a target size of 600 bp on a Bioruptor(Diagenode, Inc.). Library preparation and targeted enrichmentfor UCEs followed protocols described in detail by McGee et al.(2016), which are also available online (http://ultraconserved.org). In brief, we prepared libraries from sheared DNA using com-mercially available library preparation reagents (Kapa Biosystems),a generic SPRI substitute (Glenn et al., 2016) and custom adapters(Glenn et al., 2016). Following amplification, we grouped librariesinto pools of eight based on taxonomic similarity, and we enrichedpooled libraries for UCE targets using Mycoarray MYbaits UCE Cap-ture Kits designed to target approximately 1340 highly conservedloci across acanthomorph fishes (McGee et al., 2016). We deter-mined the size of enriched and purified pools with a Bioanalyzer(Agilent Technologies, Inc.) and we quantified enriched librariesby qPCR (Kapa Biosystems) prior to sequencing. We sequenced
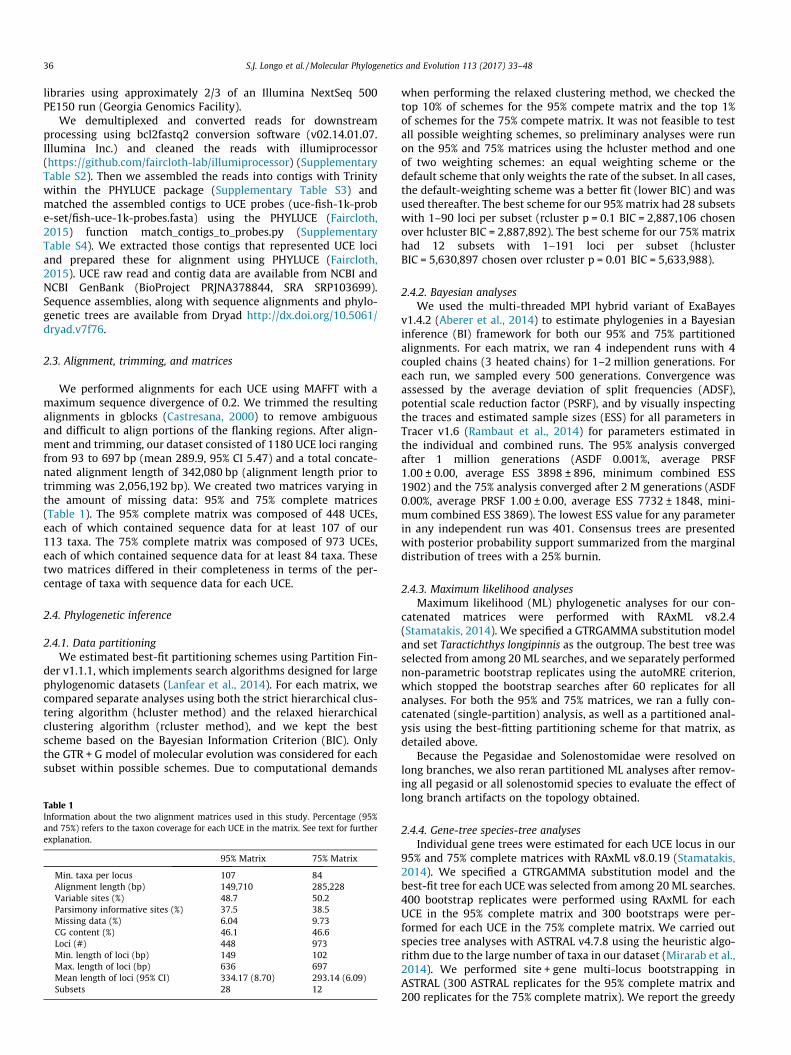
36 S.J. Longo et al. /Molecular Phylogenetics and Evolution 113 (2017) 33–48
libraries using approximately 2/3 of an Illumina NextSeq 500PE150 run (Georgia Genomics Facility).
We demultiplexed and converted reads for downstreamprocessing using bcl2fastq2 conversion software (v02.14.01.07.Illumina Inc.) and cleaned the reads with illumiprocessor(https://github.com/faircloth-lab/illumiprocessor) (SupplementaryTable S2). Then we assembled the reads into contigs with Trinitywithin the PHYLUCE package (Supplementary Table S3) andmatched the assembled contigs to UCE probes (uce-fish-1k-probe-set/fish-uce-1k-probes.fasta) using the PHYLUCE (Faircloth,2015) function match_contigs_to_probes.py (SupplementaryTable S4). We extracted those contigs that represented UCE lociand prepared these for alignment using PHYLUCE (Faircloth,2015). UCE raw read and contig data are available from NCBI andNCBI GenBank (BioProject PRJNA378844, SRA SRP103699).Sequence assemblies, along with sequence alignments and phylo-genetic trees are available from Dryad http://dx.doi.org/10.5061/dryad.v7f76.
2.3. Alignment, trimming, and matrices
We performed alignments for each UCE using MAFFT with amaximum sequence divergence of 0.2. We trimmed the resultingalignments in gblocks (Castresana, 2000) to remove ambiguousand difficult to align portions of the flanking regions. After align-ment and trimming, our dataset consisted of 1180 UCE loci rangingfrom 93 to 697 bp (mean 289.9, 95% CI 5.47) and a total concate-nated alignment length of 342,080 bp (alignment length prior totrimming was 2,056,192 bp). We created two matrices varying inthe amount of missing data: 95% and 75% complete matrices(Table 1). The 95% complete matrix was composed of 448 UCEs,each of which contained sequence data for at least 107 of our113 taxa. The 75% complete matrix was composed of 973 UCEs,each of which contained sequence data for at least 84 taxa. Thesetwo matrices differed in their completeness in terms of the per-centage of taxa with sequence data for each UCE.
2.4. Phylogenetic inference
2.4.1. Data partitioningWe estimated best-fit partitioning schemes using Partition Fin-
der v1.1.1, which implements search algorithms designed for largephylogenomic datasets (Lanfear et al., 2014). For each matrix, wecompared separate analyses using both the strict hierarchical clus-tering algorithm (hcluster method) and the relaxed hierarchicalclustering algorithm (rcluster method), and we kept the bestscheme based on the Bayesian Information Criterion (BIC). Onlythe GTR + G model of molecular evolution was considered for eachsubset within possible schemes. Due to computational demands
Table 1Information about the two alignment matrices used in this study. Percentage (95%and 75%) refers to the taxon coverage for each UCE in the matrix. See text for furtherexplanation.
95% Matrix 75% Matrix
Min. taxa per locus 107 84Alignment length (bp) 149,710 285,228Variable sites (%) 48.7 50.2Parsimony informative sites (%) 37.5 38.5Missing data (%) 6.04 9.73CG content (%) 46.1 46.6Loci (#) 448 973Min. length of loci (bp) 149 102Max. length of loci (bp) 636 697Mean length of loci (95% CI) 334.17 (8.70) 293.14 (6.09)Subsets 28 12
when performing the relaxed clustering method, we checked thetop 10% of schemes for the 95% compete matrix and the top 1%of schemes for the 75% compete matrix. It was not feasible to testall possible weighting schemes, so preliminary analyses were runon the 95% and 75% matrices using the hcluster method and oneof two weighting schemes: an equal weighting scheme or thedefault scheme that only weights the rate of the subset. In all cases,the default-weighting scheme was a better fit (lower BIC) and wasused thereafter. The best scheme for our 95%matrix had 28 subsetswith 1–90 loci per subset (rcluster p = 0.1 BIC = 2,887,106 chosenover hcluster BIC = 2,887,892). The best scheme for our 75% matrixhad 12 subsets with 1–191 loci per subset (hclusterBIC = 5,630,897 chosen over rcluster p = 0.01 BIC = 5,633,988).
2.4.2. Bayesian analysesWe used the multi-threaded MPI hybrid variant of ExaBayes
v1.4.2 (Aberer et al., 2014) to estimate phylogenies in a Bayesianinference (BI) framework for both our 95% and 75% partitionedalignments. For each matrix, we ran 4 independent runs with 4coupled chains (3 heated chains) for 1–2 million generations. Foreach run, we sampled every 500 generations. Convergence wasassessed by the average deviation of split frequencies (ADSF),potential scale reduction factor (PSRF), and by visually inspectingthe traces and estimated sample sizes (ESS) for all parameters inTracer v1.6 (Rambaut et al., 2014) for parameters estimated inthe individual and combined runs. The 95% analysis convergedafter 1 million generations (ASDF 0.001%, average PRSF1.00 ± 0.00, average ESS 3898 ± 896, minimum combined ESS1902) and the 75% analysis converged after 2 M generations (ASDF0.00%, average PRSF 1.00 ± 0.00, average ESS 7732 ± 1848, mini-mum combined ESS 3869). The lowest ESS value for any parameterin any independent run was 401. Consensus trees are presentedwith posterior probability support summarized from the marginaldistribution of trees with a 25% burnin.
2.4.3. Maximum likelihood analysesMaximum likelihood (ML) phylogenetic analyses for our con-
catenated matrices were performed with RAxML v8.2.4(Stamatakis, 2014). We specified a GTRGAMMA substitution modeland set Taractichthys longipinnis as the outgroup. The best tree wasselected from among 20 ML searches, and we separately performednon-parametric bootstrap replicates using the autoMRE criterion,which stopped the bootstrap searches after 60 replicates for allanalyses. For both the 95% and 75% matrices, we ran a fully con-catenated (single-partition) analysis, as well as a partitioned anal-ysis using the best-fitting partitioning scheme for that matrix, asdetailed above.
Because the Pegasidae and Solenostomidae were resolved onlong branches, we also reran partitioned ML analyses after remov-ing all pegasid or all solenostomid species to evaluate the effect oflong branch artifacts on the topology obtained.
2.4.4. Gene-tree species-tree analysesIndividual gene trees were estimated for each UCE locus in our
95% and 75% complete matrices with RAxML v8.0.19 (Stamatakis,2014). We specified a GTRGAMMA substitution model and thebest-fit tree for each UCE was selected from among 20 ML searches.400 bootstrap replicates were performed using RAxML for eachUCE in the 95% complete matrix and 300 bootstraps were per-formed for each UCE in the 75% complete matrix. We carried outspecies tree analyses with ASTRAL v4.7.8 using the heuristic algo-rithm due to the large number of taxa in our dataset (Mirarab et al.,2014). We performed site + gene multi-locus bootstrapping inASTRAL (300 ASTRAL replicates for the 95% complete matrix and200 replicates for the 75% complete matrix). We report the greedy

S.J. Longo et al. /Molecular Phylogenetics and Evolution 113 (2017) 33–48 37
majority rule consensus tree calculated from among the bootstrap-replicate species trees output by ASTRAL.
ASTRAL uses a quartet-based approach to estimate a speciestree from a set of gene trees under the assumption that all genetrees are correct. However, because of the conserved core regions,individual UCE loci can have relatively low phylogenetic informa-tiveness (Gilbert et al., 2015), which may result in high gene treeerror. To partially address this issue, we repeated ASTRAL analyseson subsets of our datasests with the most phylogenetically infor-mative loci, using the number of parsimony informative sites asa proxy for phylogenetic informativeness (Meiklejohn et al.,2016). For each level of matrix coverage (95% and 75%), we calcu-lated the number of parsimony phylogenetically informative sitesfor each locus, and then we selected all loci in the upper quartile(upper 25%) using the AMAS software package (Borowiec, 2016).For the 95% dataset, this reduced the number of loci from 448 to116. For the 75% dataset, this reduced the number of loci from973 to 250. We then estimated consensus gene tree species treesagain in ASTRAL for each dataset of informative loci using the samemethods as for the full datasets.
For each consensus topology, we used ASTRAL to calculate thenormalized quartet score from the best-fit gene trees, which isinterpreted as the percent of quartet trees induced by the best-fitgene trees that are present in the topology of interest (Mirarabet al., 2014). ASTRAL runs on unrooted trees, so we manuallyrooted trees with Taractichthys longipinnis for visualization.
2.4.5. Compositional biasBase compositional bias can produce inconsistent phylogenetic
results and phylogenomic data sets may be especially vulnerable tothis source of bias (Dávalos and Perkins, 2008; Foster and Hickey,1999; Jermiin et al., 2004; Phillips et al., 2004; Rodríguez-Ezpeleta et al., 2007). We performed a Chi-squared test of homo-geneity of state frequencies across taxa in Paup⁄ v4.0a147 for Mac-intosh (Swofford, 2002). GC content for each species was calculatedas a percentage of the total alignment length (not including miss-ing data or indels) for each species (Supplementary Table S5). Aver-age base counts were also calculated for each of the ninesyngnathiform families and tested for homogeneity using thechisq.test function in R (Supplementary Fig. S4; SupplementaryTable S6).
To determine if heterogeneous base frequencies could be lead-ing to the artificial grouping of sequences based on similar basefrequencies, we performed ML analyses of ‘‘RY-coded” matrices(Woese et al., 1991). While this approach does not explicitly modelbase heterogeneity across the tree, it normalizes base frequenciesby coding bases as either purine or pyrimidine and has been shownto outperform ML analyses with homogenous approaches in thepresence of parallel (non-homologous) compositional heterogene-ity (Ishikawa et al., 2012).
We converted the concatenated 95% and 75% complete align-ments into binary matrices composed of 0’s (purines) and 1’s(pyrimidines). We then repeated ML analyses of these RY-codedmatrices in RAxML v8.2.4 (Stamatakis, 2014) using the BINGAMMAmodel for binary characters. As before, we performed 20 indepen-dent searches for the best-fit tree and nonparametric bootstrap-ping with the autoMRE cutoff, which stopped bootstrapping after60 iterations.
3. Results
3.1. Bayesian and maximum likelihood phylogenetic analyses
The consensus tree from the Bayesian analysis of the parti-tioned 95% matrix (Fig. 2) was fully supported at all nodes (poste-
rior probability = 1) and topologically identical to the best-fittopology for both unpartitioned (not shown) and partitioned MLanalyses using the same matrix (Supplementary Fig. S1). In thepartitioned ML analysis for this dataset (95%), we resolved mostrelationships with high bootstrap support (�92), although therewere exceptions (Fig. 2). The clade containing Fistulariidae,Aulostomidae, and Centriscidae had low support (bootstrap = 53),and relationships between the callionymid genera Repomucenus,Draculo, Diplogrammus, and Calliurichthys were not all fully sup-ported (bootstraps ranging from 77 to 100). Within syngnathids,the clade containing seadragaons (Fig. 2, red clade) and messmatepipefishes (Fig. 2, blue clade) was only resolved with moderatesupport (bootstrap = 72).
The Bayesian consensus and best-fit ML trees estimated fromthe analyses of the partitioned 75% complete matrix were fullycongruent with one another and generally recovered syngnathi-form relationships with high support (Supplementary Figs. S2–3).This topology was also identical to that estimated fromML analysisof the concatenated unpartitioned 75% matrix (not shown). Thetopology from the 75% analyses was also congruent with thosefrom the 95% analyses, except for the placement of the seadragonclade (Fig. 2 insert, red clade). Relative support for nodes acrossthe 75% phylogenetic analyses mirrored the 95% analyses. Forinstance, the bootstrap support for the placement of the seadragonclade was only moderate (bootstrap = 67) for the 75% partitionedML tree, but was fully supported in the 75% BI consensus tree.The callionymid genera Repomucenus, Draculo, Diplogrammus, andCalliurichthys were resolved with better support in analyses ofthe 75% complete matrix (e.g., bootstraps 90–100 for the 75% par-titioned ML analysis) compared to the 95% matrix, although thesegenera were still polyphyletic.
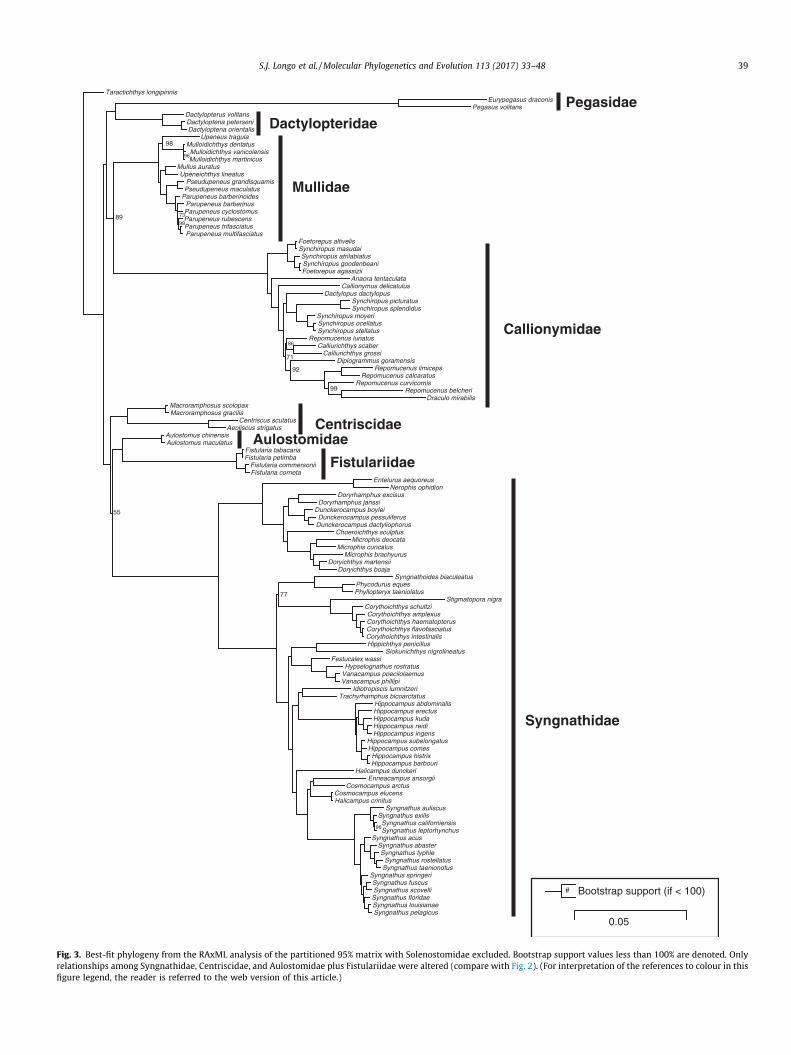
Because the Pegasidae and Solenostomidae were on longbranches, we reran partitioned ML analyses after removing bothpegasid species or both solenostomid species to evaluate the effectof long branch artifacts on the estimated topology. While theremoval of the Pegasidae did not change the topology depicted inFig. 2 (not shown), omitting the Solenostomidae did change thetopological arrangement of the families Centriscidae, Aulostomi-dae, Fistulariidae, and Syngnathidae (Fig. 3). Fistulariidae andAulostomidae were inferred as the closest relative of the Syng-nathidae instead of the Centriscidae but with very low support ata node subtended by an extremely short branch (bootstrap = 55).
3.2. Gene-tree species tree
For both the 95% and 75% complete matrices, we used ASTRALto estimate consensus species trees from bootstrapped sets of genetrees (Fig. 4A, Supplementary Fig. S4A). These represent estimatesof the true species tree topology that take into account individuallocus histories and gene tree uncertainty. The consensus topologyusing all loci in the 95% matrix supported a clade of long-snouted syngnathiforms as in the ML/BI topologies (e.g., compareFig. 4A to Fig. 2), but this clade had lower support in the consensusspecies tree (MLBS = 58). While the benthic lineages Callionymi-dae, Pegasidae, Mullidae, and Dactylopteridae form a clade sisterto traditional long-snouted syngnathiform families in all BI/MLtopologies, the consensus species tree for the full 95% matrix neststhe traditional syngnathiforms within the benthic lineages. How-ever, the exact arrangement of lineages is unclear given the lowsupport for the sister-group relationship between Callionymidaeand the long-snouted clade (MLBS = 47).
The lack of support for the divergences among major syngnathi-form lineages was exacerbated when we analyzed the larger, lesscomplete dataset, the 75% complete matrix with all loci included(Supplementary Fig. S4A). Callionymidae, Pegasidae, the cladeincluding Centriscidae, Aulostomidae, Fistulariidae, and the clade

0.05
Posterior Probability =1
75% Matrix 95% Matrix
Bootstrap support (if < 100)
Macroramphosus gracilisMacroramphosus scolopax
Aeoliscus strigatusCentriscus scutatus
Aulostomus maculatusAulostomus chinensis
Fistularia commersoniiFistularia corneta
Fistularia tabacariaFistularia petimba
Solenostomus cyanopterusSolenostomus paradoxus
Nerophis ophidionEntelurus aequoreus
Doryrhamphus excisusDoryrhamphus janssi
Dunckerocampus boylei
Dunckerocampus dactyliophorusDunckerocampus pessuliferus
Choeroichthys sculptus
Microphis cuncalusMicrophis deocata
Microphis brachyurus
Doryichthys boajaDoryichthys martensii
Syngnathoides biaculeatus
Phyllopteryx taeniolatusPhycodurus eques
Stigmatopora nigraCorythoichthys schultziCorythoichthys amplexusCorythoichthys haematopterus
Corythoichthys intestinalisCorythoichthys flavofasciatus
Hippichthys penicillusSiokunichthys nigrolineatus
Festucalex wassiHypselognathus rostratus
Vanacampus phillipiVanacampus poecilolaemus
Idiotropiscis lumnitzeriTrachyrhamphus bicoarctatus
Hippocampus abdominalis
Hippocampus erectusHippocampus kuda
Hippocampus reidiHippocampus ingens
Hippocampus barbouriHippocampus histrix
Hippocampus comesHippocampus subelongatus
Halicampus dunckeri
Halicampus crinitusCosmocampus elucens
Enneacampus ansorgiiCosmocampus arctus
Syngnathus auliscusSyngnathus exilis
Syngnathus leptorhynchusSyngnathus californiensis
Syngnathus acusSyngnathus abasterSyngnathus typhle
Syngnathus taenionotusSyngnathus rostellatus
Syngnathus springeri
Syngnathus fuscusSyngnathus scovelli
Syngnathus floridae
Syngnathus louisianaeSyngnathus pelagicus
Pegasus volitansEurypegasus draconis
Dactylopterus volitans
Dactyloptena peterseniDactyloptena orientalis
Upeneus tragulaMulloidichthys dentatus
Mulloidichthys vanicolensisMulloidichthys martinicus
Mullus auratusUpeneichthys lineatus
Pseudupeneus maculatusPseudupeneus grandisquamis
Parupeneus barberinoidesParupeneus barberinusParupeneus cyclostomusParupeneus rubescens
Parupeneus trifasciatusParupeneus multifasciatus
Foetorepus altivelisSynchiropus masudai
Synchiropus atrilabiatus
Synchiropus goodenbeaniFoetorepus agassizii
Anaora tentaculataCallionymus delicatulus
Dactylopus dactylopus
Synchiropus splendidusSynchiropus picturatus
Synchiropus moyeri
Synchiropus stellatusSynchiropus ocellatus
Repomucenus lunatus
Calliurichthys grossiCalliurichthys scaber
Diplogrammus goramensis
Repomucenus limicepsRepomucenus calcaratus
Repomucenus curvicornis
Repomucenus belcheriDraculo mirabilis
Taractichthys longipinnis
Entelurus aequoreusNerophis ophidion
Doryrhamphus excisusDoryrhamphus janssi
Dunckerocampus boyleiDunckerocampus pessuliferusDunckerocampus dactyliophorus
Choeroichthys sculptus
Microphis cuncalusMicrophis deocata
Microphis brachyurus
Doryichthys boajaDoryichthys martensii
Stigmatopora nigraCorythoichthys schultziCorythoichthys amplexusCorythoichthys haematopterusCorythoichthys flavofasciatusCorythoichthys intestinalis
Syngnathoides biaculeatusPhycodurus equesPhyllopteryx taeniolatus
Siokunichthys nigrolineatusHippichthys penicillus
Festucalex wassiHypselognathus rostratus
Vanacampus poecilolaemusVanacampus phillipiTrachyrhamphus bicoarctatus
Idiotropiscis lumnitzeriHippocampus abdominalis
Hippocampus erectusHippocampus kuda
Hippocampus reidiHippocampus ingens
Hippocampus barbouriHippocampus histrix
Hippocampus comesHippocampus subelongatus
Halicampus dunckeriCosmocampus arctus
Enneacampus ansorgiiCosmocampus elucensHalicampus crinitus
Syngnathus auliscusSyngnathus exilis
Syngnathus leptorhynchusSyngnathus californiensis
Syngnathus acusSyngnathus abasterSyngnathus typhleSyngnathus rostellatusSyngnathus taenionotus
Syngnathus springeriSyngnathus scovelliSyngnathus fuscusSyngnathus floridaeSyngnathus pelagicusSyngnathus louisianae
72
53
92
67
85
95
77
#
PegasidaeDactylopteridae
Mullidae
Callionymidae
Fistulariidae
AulostomidaeCentriscidae
Solenostomidae
Syn
gn
athid
ae
Fig. 2. Consensus phylogeny from the Bayesian analysis of the partitioned 95% matrix. All nodes were resolved with a posterior probability of 1 (black circles). Maximumlikelihood analysis recovered the same topology; only bootstrap support values less than 100% are denoted. Insert: The Bayesian and maximum likelihood analyses for the75% matrix recovered different relationships among the clades including seadragons (red) and messmate pipefishes (blue) and other tail-brooding pipefishes compared to the95% matrix.
38 S.J. Longo et al. /Molecular Phylogenetics and Evolution 113 (2017) 33–48
Aeoliscus strigatusCentriscus scutatus
Macroramphosus gracilisMacroramphosus scolopax
Nerophis ophidionEntelurus aequoreus
Doryrhamphus janssiDoryrhamphus excisus
Dunckerocampus boylei
Dunckerocampus dactyliophorusDunckerocampus pessuliferus
Choeroichthys sculptus
Microphis cuncalusMicrophis deocata
Microphis brachyurus
Doryichthys boajaDoryichthys martensii
Siokunichthys nigrolineatusHippichthys penicillus
Festucalex wassiHypselognathus rostratus
Vanacampus phillipiVanacampus poecilolaemus
Trachyrhamphus bicoarctatusIdiotropiscis lumnitzeri
Hippocampus abdominalis
Hippocampus barbouriHippocampus histrix
Hippocampus comesHippocampus subelongatus
Hippocampus erectusHippocampus kuda
Hippocampus ingensHippocampus reidi
Halicampus dunckeri
Halicampus crinitusCosmocampus elucens
Cosmocampus arctusEnneacampus ansorgii
Syngnathus auliscusSyngnathus exilis
Syngnathus leptorhynchusSyngnathus californiensis
Syngnathus springeri
Syngnathus floridae
Syngnathus pelagicusSyngnathus louisianae
Syngnathus scovelliSyngnathus fuscus
Syngnathus acusSyngnathus abaster
Syngnathus taenionotusSyngnathus rostellatus
Syngnathus typhle
Syngnathoides biaculeatus
Phyllopteryx taeniolatusPhycodurus eques
Stigmatopora nigra
Corythoichthys amplexusCorythoichthys haematopterus
Corythoichthys intestinalisCorythoichthys flavofasciatus
Corythoichthys schultzi
Aulostomus maculatusAulostomus chinensis
Fistularia cornetaFistularia commersonii
Fistularia petimbaFistularia tabacaria
Pegasus volitansEurypegasus draconis
Dactyloptena orientalisDactyloptena peterseniDactylopterus volitans
Upeneichthys lineatusMullus auratus
Pseudupeneus maculatusPseudupeneus grandisquamis
Parupeneus barberinoidesParupeneus barberinusParupeneus cyclostomusParupeneus rubescens
Parupeneus multifasciatusParupeneus trifasciatus
Mulloidichthys dentatus
Mulloidichthys martinicusMulloidichthys vanicolensis
Upeneus tragula
Synchiropus masudaiFoetorepus altivelis
Synchiropus atrilabiatus
Foetorepus agassiziiSynchiropus goodenbeani
Anaora tentaculataCallionymus delicatulus
Synchiropus moyeri
Synchiropus stellatusSynchiropus ocellatus
Synchiropus splendidusSynchiropus picturatus
Dactylopus dactylopus
Diplogrammus goramensis
Draculo mirabilisRepomucenus belcheri
Repomucenus curvicornisRepomucenus calcaratus
Repomucenus limiceps
Repomucenus lunatus
Calliurichthys grossiCalliurichthys scaber
Taractichthys longipinnis
0.05
Bootstrap support (if < 100)#
89
98
96
73
99
55
92
99
86
71
77
96
PegasidaeDactylopteridae
Mullidae
Callionymidae
Fistulariidae
AulostomidaeCentriscidae
Syngnathidae
Fig. 3. Best-fit phylogeny from the RAxML analysis of the partitioned 95% matrix with Solenostomidae excluded. Bootstrap support values less than 100% are denoted. Onlyrelationships among Syngnathidae, Centriscidae, and Aulostomidae plus Fistulariidae were altered (compare with Fig. 2). (For interpretation of the references to colour in thisfigure legend, the reader is referred to the web version of this article.)
S.J. Longo et al. /Molecular Phylogenetics and Evolution 113 (2017) 33–48 39

Dactylopterus volitans
Dactyloptena peterseniDactyloptena orientalis
Upeneus tragulaMulloidichthys vanicolensis
Mulloidichthys martinicusMulloidichthys dentatus
Pseudupeneus grandisquamisPseudupeneus maculatus
Parupeneus cyclostomusParupeneus barberinoidesParupeneus barberinusParupeneus rubescens
Parupeneus trifasciatusParupeneus multifasciatus
Upeneichthys lineatusMullus auratus
Eurypegasus draconisPegasus volitans
Synchiropus atrilabiatus
Foetorepus agassiziiSynchiropus goodenbeani
Foetorepus altivelisSynchiropus masudai
Anaora tentaculataCallionymus delicatulus
Repomucenus belcheriDraculo mirabilis
Repomucenus curvicornis
Repomucenus calcaratusRepomucenus limiceps
Diplogrammus goramensisRepomucenus lunatus
Calliurichthys grossiCalliurichthys scaber
Dactylopus dactylopus
Synchiropus picturatusSynchiropus splendidus
Synchiropus moyeri
Synchiropus stellatusSynchiropus ocellatus
Solenostomus cyanopterusSolenostomus paradoxus
Dunckerocampus boylei
Dunckerocampus dactyliophorusDunckerocampus pessuliferus
Doryrhamphus janssiDoryrhamphus excisus
Choeroichthys sculptus
Microphis brachyurus
Doryichthys boajaDoryichthys martensii
Microphis cuncalusMicrophis deocata
Nerophis ophidionEntelurus aequoreus
Hippocampus abdominalis
Hippocampus histrixHippocampus barbouriHippocampus comesHippocampus subelongatus
Hippocampus erectusHippocampus kuda
Hippocampus reidiHippocampus ingens
Idiotropiscis lumnitzeriTrachyrhamphus bicoarctatus
Halicampus dunckeri
Syngnathus auliscusSyngnathus exilis
Syngnathus leptorhynchusSyngnathus californiensis
Syngnathus springeri
Syngnathus scovelliSyngnathus fuscus
Syngnathus floridae
Syngnathus louisianaeSyngnathus pelagicus
Syngnathus acusSyngnathus abasterSyngnathus typhle
Syngnathus taenionotusSyngnathus rostellatus
Enneacampus ansorgiiCosmocampus arctus
Halicampus crinitusCosmocampus elucens
Festucalex wassiHypselognathus rostratus
Vanacampus poecilolaemusVanacampus phillipi
Hippichthys penicillusSiokunichthys nigrolineatus
Stigmatopora nigraCorythoichthys schultziCorythoichthys amplexusCorythoichthys haematopterus
Corythoichthys intestinalisCorythoichthys flavofasciatus
Syngnathoides biaculeatus
Phyllopteryx taeniolatusPhycodurus eques
Macroramphosus gracilisMacroramphosus scolopaxCentriscus scutatusAeoliscus strigatus
Fistularia tabacariaFistularia petimbaFistularia cornetaFistularia commersoniiAulostomus chinensisAulostomus maculatus
Taractichthys longipinnis
Upeneus tragulaMulloidichthys vanicolensis
Mulloidichthys martinicusMulloidichthys dentatus
Parupeneus cyclostomusParupeneus barberinoidesParupeneus barberinusParupeneus rubescens
Parupeneus trifasciatusParupeneus multifasciatus
Pseudupeneus grandisquamisPseudupeneus maculatusUpeneichthys lineatusMullus auratus
Dactylopterus volitans
Dactyloptena peterseniDactyloptena orientalis
Eurypegasus draconisPegasus volitans
Synchiropus atrilabiatus
Foetorepus agassiziiSynchiropus goodenbeani
Foetorepus altivelisSynchiropus masudai
Anaora tentaculataCallionymus delicatulusDactylopus dactylopus
Synchiropus picturatusSynchiropus splendidus
Synchiropus moyeri
Synchiropus stellatusSynchiropus ocellatus
Repomucenus lunatus
Calliurichthys grossiCalliurichthys scaber
Diplogrammus goramensisRepomucenus curvicornis
Repomucenus calcaratusRepomucenus limicepsRepomucenus belcheriDraculo mirabilis
Solenostomus cyanopterusSolenostomus paradoxus
Dunckerocampus boylei
Dunckerocampus dactyliophorusDunckerocampus pessuliferus
Doryrhamphus janssiDoryrhamphus excisus
Choeroichthys sculptus
Microphis brachyurus
Doryichthys boajaDoryichthys martensii
Microphis cuncalusMicrophis deocata
Nerophis ophidionEntelurus aequoreus
Hippocampus abdominalis
Hippocampus histrixHippocampus barbouriHippocampus comesHippocampus subelongatus
Hippocampus erectusHippocampus kuda
Hippocampus reidiHippocampus ingens
Idiotropiscis lumnitzeriTrachyrhamphus bicoarctatus
Halicampus dunckeri
Syngnathus auliscusSyngnathus exilis
Syngnathus leptorhynchusSyngnathus californiensis
Syngnathus springeri
Syngnathus scovelliSyngnathus fuscus
Syngnathus floridae
Syngnathus louisianaeSyngnathus pelagicus
Syngnathus acusSyngnathus abasterSyngnathus typhle
Syngnathus taenionotusSyngnathus rostellatus
Enneacampus ansorgiiCosmocampus arctus
Halicampus crinitusCosmocampus elucens
Festucalex wassiHypselognathus rostratus
Vanacampus poecilolaemusVanacampus phillipi
Hippichthys penicillusSiokunichthys nigrolineatus
Stigmatopora nigraCorythoichthys schultziCorythoichthys amplexusCorythoichthys haematopterus
Corythoichthys intestinalisCorythoichthys flavofasciatus
Syngnathoides biaculeatus
Phyllopteryx taeniolatusPhycodurus eques
Macroramphosus gracilisMacroramphosus scolopaxCentriscus scutatusAeoliscus strigatus
Fistularia tabacariaFistularia petimbaFistularia cornetaFistularia commersoniiAulostomus chinensisAulostomus maculatus
Taractichthys longipinnis
Pe
Da
Mu
Ca
Fi
AuCe
So
Sy
PeDa
Mu
Ca
Fi
AuCe
So
Sy
MLBS (if < 100)#
B) 95%: Upper QuartileA) 95%: All loci
83
95
47
58
98
95
87
97
97
97
86
79
93
45
74
81
90
53
57
99
99
98 84
69
94
83
70
27
51
71
98
9182
81
90
42
92
99
63
53
80
49
33
27
5099
65
98
87
60
80
91
99
99
99
68
9878
40
99
74
Fig. 4. Cladograms representing the greedy consensus topologies from the ASTRAL gene-tree species-tree analyses for the 95% complete matrix. We obtained differenttopologies when the analysis was run on all loci (left) or only the most informative loci (loci in the upper quartile for parsimony informative sites; right). Nodes are labeledwhen multi-locus bootstrap support (MLBS) was less than 100%. The placement of the seadragon (red) and messmate pipefish (blue) clades are highlighted for comparisonwith other topologies. (For interpretation of the references to color in this figure legend, the reader is referred to the web version of this article.)
40 S.J. Longo et al. /Molecular Phylogenetics and Evolution 113 (2017) 33–48
including Solenostomidae and Syngnathidae are essentially a poly-tomy in the consensus species tree for the full 75% dataset(MLBS = 31–46). Overall, global support for the consensus species
trees from our ASTRAL analysis on the full 75% dataset (normalizedquartet score = 0.849) was lower than that for the full 95% dataset(normalized quartet score = 0.861).
S.J. Longo et al. /Molecular Phylogenetics and Evolution 113 (2017) 33–48 41
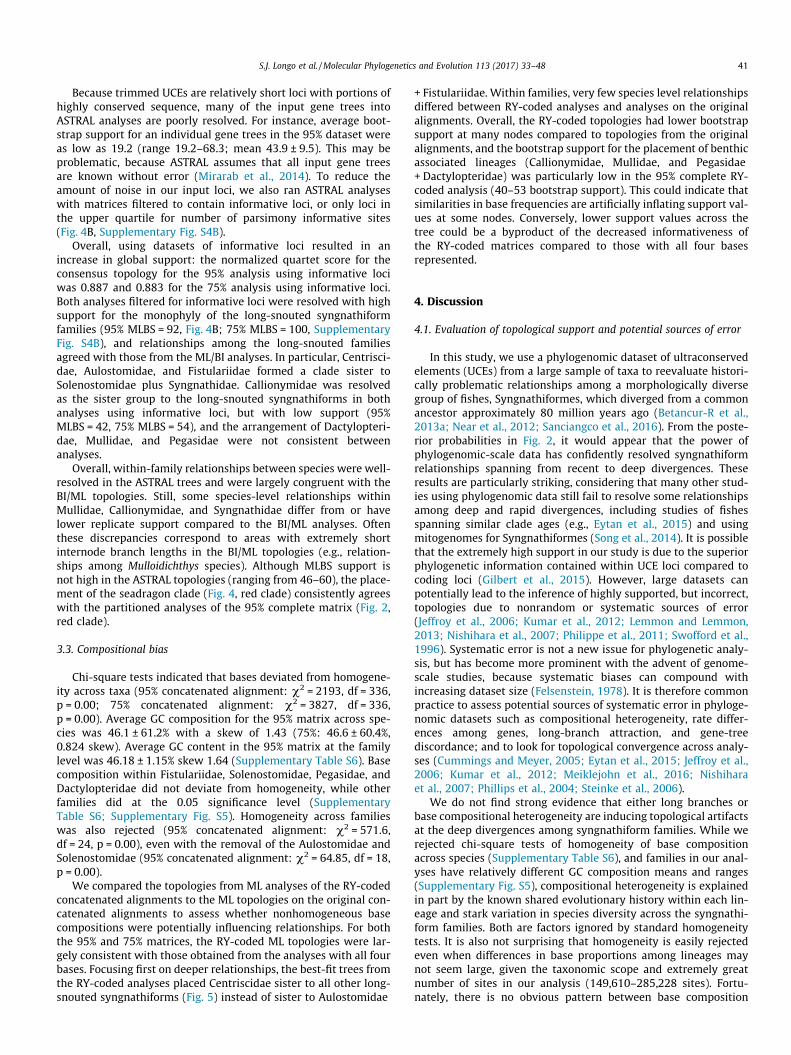
Because trimmed UCEs are relatively short loci with portions ofhighly conserved sequence, many of the input gene trees intoASTRAL analyses are poorly resolved. For instance, average boot-strap support for an individual gene trees in the 95% dataset wereas low as 19.2 (range 19.2–68.3; mean 43.9 ± 9.5). This may beproblematic, because ASTRAL assumes that all input gene treesare known without error (Mirarab et al., 2014). To reduce theamount of noise in our input loci, we also ran ASTRAL analyseswith matrices filtered to contain informative loci, or only loci inthe upper quartile for number of parsimony informative sites(Fig. 4B, Supplementary Fig. S4B).
Overall, using datasets of informative loci resulted in anincrease in global support: the normalized quartet score for theconsensus topology for the 95% analysis using informative lociwas 0.887 and 0.883 for the 75% analysis using informative loci.Both analyses filtered for informative loci were resolved with highsupport for the monophyly of the long-snouted syngnathiformfamilies (95% MLBS = 92, Fig. 4B; 75% MLBS = 100, SupplementaryFig. S4B), and relationships among the long-snouted familiesagreed with those from the ML/BI analyses. In particular, Centrisci-dae, Aulostomidae, and Fistulariidae formed a clade sister toSolenostomidae plus Syngnathidae. Callionymidae was resolvedas the sister group to the long-snouted syngnathiforms in bothanalyses using informative loci, but with low support (95%MLBS = 42, 75% MLBS = 54), and the arrangement of Dactylopteri-dae, Mullidae, and Pegasidae were not consistent betweenanalyses.
Overall, within-family relationships between species were well-resolved in the ASTRAL trees and were largely congruent with theBI/ML topologies. Still, some species-level relationships withinMullidae, Callionymidae, and Syngnathidae differ from or havelower replicate support compared to the BI/ML analyses. Oftenthese discrepancies correspond to areas with extremely shortinternode branch lengths in the BI/ML topologies (e.g., relation-ships among Mulloidichthys species). Although MLBS support isnot high in the ASTRAL topologies (ranging from 46–60), the place-ment of the seadragon clade (Fig. 4, red clade) consistently agreeswith the partitioned analyses of the 95% complete matrix (Fig. 2,red clade).
3.3. Compositional bias
Chi-square tests indicated that bases deviated from homogene-ity across taxa (95% concatenated alignment: v2 = 2193, df = 336,p = 0.00; 75% concatenated alignment: v2 = 3827, df = 336,p = 0.00). Average GC composition for the 95% matrix across spe-cies was 46.1 ± 61.2% with a skew of 1.43 (75%: 46.6 ± 60.4%,0.824 skew). Average GC content in the 95% matrix at the familylevel was 46.18 ± 1.15% skew 1.64 (Supplementary Table S6). Basecomposition within Fistulariidae, Solenostomidae, Pegasidae, andDactylopteridae did not deviate from homogeneity, while otherfamilies did at the 0.05 significance level (SupplementaryTable S6; Supplementary Fig. S5). Homogeneity across familieswas also rejected (95% concatenated alignment: v2 = 571.6,df = 24, p = 0.00), even with the removal of the Aulostomidae andSolenostomidae (95% concatenated alignment: v2 = 64.85, df = 18,p = 0.00).
We compared the topologies from ML analyses of the RY-codedconcatenated alignments to the ML topologies on the original con-catenated alignments to assess whether nonhomogeneous basecompositions were potentially influencing relationships. For boththe 95% and 75% matrices, the RY-coded ML topologies were lar-gely consistent with those obtained from the analyses with all fourbases. Focusing first on deeper relationships, the best-fit trees fromthe RY-coded analyses placed Centriscidae sister to all other long-snouted syngnathiforms (Fig. 5) instead of sister to Aulostomidae
+ Fistulariidae. Within families, very few species level relationshipsdiffered between RY-coded analyses and analyses on the originalalignments. Overall, the RY-coded topologies had lower bootstrapsupport at many nodes compared to topologies from the originalalignments, and the bootstrap support for the placement of benthicassociated lineages (Callionymidae, Mullidae, and Pegasidae+ Dactylopteridae) was particularly low in the 95% complete RY-coded analysis (40–53 bootstrap support). This could indicate thatsimilarities in base frequencies are artificially inflating support val-ues at some nodes. Conversely, lower support values across thetree could be a byproduct of the decreased informativeness ofthe RY-coded matrices compared to those with all four basesrepresented.
4. Discussion
4.1. Evaluation of topological support and potential sources of error
In this study, we use a phylogenomic dataset of ultraconservedelements (UCEs) from a large sample of taxa to reevaluate histori-cally problematic relationships among a morphologically diversegroup of fishes, Syngnathiformes, which diverged from a commonancestor approximately 80 million years ago (Betancur-R et al.,2013a; Near et al., 2012; Sanciangco et al., 2016). From the poste-rior probabilities in Fig. 2, it would appear that the power ofphylogenomic-scale data has confidently resolved syngnathiformrelationships spanning from recent to deep divergences. Theseresults are particularly striking, considering that many other stud-ies using phylogenomic data still fail to resolve some relationshipsamong deep and rapid divergences, including studies of fishesspanning similar clade ages (e.g., Eytan et al., 2015) and usingmitogenomes for Syngnathiformes (Song et al., 2014). It is possiblethat the extremely high support in our study is due to the superiorphylogenetic information contained within UCE loci compared tocoding loci (Gilbert et al., 2015). However, large datasets canpotentially lead to the inference of highly supported, but incorrect,topologies due to nonrandom or systematic sources of error(Jeffroy et al., 2006; Kumar et al., 2012; Lemmon and Lemmon,2013; Nishihara et al., 2007; Philippe et al., 2011; Swofford et al.,1996). Systematic error is not a new issue for phylogenetic analy-sis, but has become more prominent with the advent of genome-scale studies, because systematic biases can compound withincreasing dataset size (Felsenstein, 1978). It is therefore commonpractice to assess potential sources of systematic error in phyloge-nomic datasets such as compositional heterogeneity, rate differ-ences among genes, long-branch attraction, and gene-treediscordance; and to look for topological convergence across analy-ses (Cummings and Meyer, 2005; Eytan et al., 2015; Jeffroy et al.,2006; Kumar et al., 2012; Meiklejohn et al., 2016; Nishiharaet al., 2007; Phillips et al., 2004; Steinke et al., 2006).
We do not find strong evidence that either long branches orbase compositional heterogeneity are inducing topological artifactsat the deep divergences among syngnathiform families. While werejected chi-square tests of homogeneity of base compositionacross species (Supplementary Table S6), and families in our anal-yses have relatively different GC composition means and ranges(Supplementary Fig. S5), compositional heterogeneity is explainedin part by the known shared evolutionary history within each lin-eage and stark variation in species diversity across the syngnathi-form families. Both are factors ignored by standard homogeneitytests. It is also not surprising that homogeneity is easily rejectedeven when differences in base proportions among lineages maynot seem large, given the taxonomic scope and extremely greatnumber of sites in our analysis (149,610–285,228 sites). Fortu-nately, there is no obvious pattern between base composition

Aeoliscus strigatusCentriscus scutatus
Macroramphosus gracilisMacroramphosus scolopax
Aulostomus maculatusAulostomus chinensis
Fistularia petimbaFistularia tabacariaFistularia cornetaFistularia commersonii
Solenostomus paradoxusSolenostomus cyanopterus
Nerophis ophidionEntelurus aequoreus
Doryrhamphus excisusDoryrhamphus janssi
Dunckerocampus boylei
Dunckerocampus pessuliferusDunckerocampus dactyliophorus
Choeroichthys sculptus
Microphis deocataMicrophis cuncalus
Microphis brachyurus
Doryichthys martensiiDoryichthys boaja
Hippichthys penicillusSiokunichthys nigrolineatus
Festucalex wassiHypselognathus rostratus
Vanacampus phillipiVanacampus poecilolaemus
Trachyrhamphus bicoarctatusIdiotropiscis lumnitzeri
Hippocampus abdominalis
Hippocampus erectus
Hippocampus reidiHippocampus ingensHippocampus kuda
Hippocampus barbouriHippocampus histrixHippocampus subelongatusHippocampus comes
Halicampus dunckeri
Cosmocampus arctusEnneacampus ansorgii
Halicampus crinitusCosmocampus elucens
Syngnathus leptorhynchus
Syngnathus exilisSyngnathus californiensis
Syngnathus auliscus
Syngnathus acusSyngnathus abasterSyngnathus typhle
Syngnathus taenionotusSyngnathus rostellatus
Syngnathus springeri
Syngnathus floridae
Syngnathus louisianaeSyngnathus pelagicus
Syngnathus scovelliSyngnathus fuscus
Corythoichthys schultziCorythoichthys amplexus
Corythoichthys intestinalisCorythoichthys flavofasciatusCorythoichthys haematopterus
Stigmatopora nigra
Syngnathoides biaculeatus
Phyllopteryx taeniolatusPhycodurus eques
Foetorepus agassiziiSynchiropus goodenbeaniSynchiropus atrilabiatusSynchiropus masudaiFoetorepus altivelis
Callionymus delicatulus
Synchiropus picturatusSynchiropus splendidus
Synchiropus ocellatusSynchiropus stellatusSynchiropus moyeri
Dactylopus dactylopus
Repomucenus lunatus
Calliurichthys scaberCalliurichthys grossi
Diplogrammus goramensis
Repomucenus limicepsRepomucenus calcaratus
Repomucenus curvicornis
Repomucenus belcheriDraculo mirabilis
Anaora tentaculata
Mullus auratusUpeneichthys lineatus
Pseudupeneus maculatusPseudupeneus grandisquamis
Parupeneus barberinoides
Parupeneus rubescens
Parupeneus multifasciatusParupeneus trifasciatus
Parupeneus barberinusParupeneus cyclostomus
Upeneus tragulaMulloidichthys dentatus
Mulloidichthys martinicusMulloidichthys vanicolensis
Dactylopterus volitans
Dactyloptena orientalisDactyloptena peterseni
Eurypegasus draconisPegasus volitans
Taractichthys longipinnis
Centriscus scutatusAeoliscus strigatus
Macroramphosus gracilisMacroramphosus scolopax
Aulostomus chinensisAulostomus maculatus
Fistularia petimbaFistularia tabacaria
Fistularia cornetaFistularia commersonii
Solenostomus paradoxusSolenostomus cyanopterus
Stigmatopora nigraCorythoichthys schultziCorythoichthys amplexus
Corythoichthys intestinalisCorythoichthys flavofasciatusCorythoichthys haematopterus
Syngnathoides biaculeatus
Phycodurus equesPhyllopteryx taeniolatus
Festucalex wassiHypselognathus rostratus
Vanacampus poecilolaemusVanacampus phillipi
Siokunichthys nigrolineatusHippichthys penicillus
Hippocampus abdominalis
Hippocampus subelongatusHippocampus comesHippocampus histrixHippocampus barbouri
Hippocampus kuda
Hippocampus ingensHippocampus reidi
Hippocampus erectus
Trachyrhamphus bicoarctatusIdiotropiscis lumnitzeri
Halicampus dunckeri
Syngnathus auliscusSyngnathus exilis
Syngnathus californiensisSyngnathus leptorhynchus
Syngnathus acusSyngnathus abasterSyngnathus typhle
Syngnathus taenionotusSyngnathus rostellatus
Syngnathus springeri
Syngnathus louisianaeSyngnathus pelagicusSyngnathus floridaeSyngnathus fuscusSyngnathus scovelli
Cosmocampus elucensHalicampus crinitus
Enneacampus ansorgiiCosmocampus arctus
Nerophis ophidionEntelurus aequoreus
Dunckerocampus boylei
Dunckerocampus dactyliophorusDunckerocampus pessuliferus
Doryrhamphus janssiDoryrhamphus excisus
Choeroichthys sculptus
Doryichthys martensiiDoryichthys boajaMicrophis brachyurus
Microphis cuncalusMicrophis deocata
Dactyloptena peterseniDactyloptena orientalisDactylopterus volitans
Eurypegasus draconisPegasus volitans
Synchiropus goodenbeaniFoetorepus agassiziiSynchiropus atrilabiatusSynchiropus masudaiFoetorepus altivelis
Anaora tentaculataCallionymus delicatulus
Repomucenus curvicornis
Repomucenus belcheriDraculo mirabilis
Repomucenus limicepsRepomucenus calcaratus
Repomucenus lunatusCalliurichthys grossi
Calliurichthys scaber
Synchiropus picturatusSynchiropus splendidus
Synchiropus moyeri
Synchiropus stellatusSynchiropus ocellatus
Dactylopus dactylopusDiplogrammus goramensis
Upeneus tragulaMulloidichthys dentatus
Mulloidichthys vanicolensisMulloidichthys martinicus
Upeneichthys lineatusMullus auratus
Pseudupeneus grandisquamisPseudupeneus maculatus
Parupeneus barberinoidesParupeneus cyclostomus
Parupeneus barberinusParupeneus rubescens
Parupeneus multifasciatusParupeneus trifasciatus
Taractichthys longipinnis
92
93
90
38
40
53
95
77
80
65
98
67
62
97
48
0.02
Bootstrap support (if < 100)#
92
92
48
72
7895
92
37
35
60
93
98
92
85
75% Matrix 95% Matrix
Pegasidae
Dactylopteridae
Mullidae
Callionymidae
FistulariidaeAulostomidae
Centriscidae So
leno
stom
idae
Syn
gn
athid
ae
Fig. 5. Best-fit phylogenies from the RAxML analyses of the RY-coded matrices (95% on the left, 75% on the right). Bootstrap support values less than 100% are denoted. Onlyrelationships among Syngnathidae, Centriscidae, and Aulostomidae plus Fistulariidae were altered (compare with Fig. 2).
42 S.J. Longo et al. /Molecular Phylogenetics and Evolution 113 (2017) 33–48
and phylogenetic placement of the major syngnathiform lineages.For instance, three out of the four pairs of sister families in ourBI/ML analyses (Pegasidae and Dactylopteridae, Solenostomidaeand Syngnathidae, Fistulariidae and Aulostomidae) do not have
overlapping GC composition ranges (Supplementary Fig. S5). Cor-roborating this observation, RY-coded analyses did not dramati-cally alter the best-fit topology compared to analyses with allfour bases represented (Fig. 5).

S.J. Longo et al. /Molecular Phylogenetics and Evolution 113 (2017) 33–48 43
Instead of biasing topology, violation of base heterogeneityassumed by our models of sequence evolution may be affectingbranch lengths or bootstrap support. In some cases, species withextreme GC proportions compared to the rest of their family corre-sponded to tips with unusually long branches (e.g., Stigmatoporanigra in Syngnathidae and Draculo mirabilis in Callionymidae;Fig. 1 and Supplementary Fig. S5). Likewise, the comparatively highGC composition of solenostomids relative to other taxa mayaccount for the long branch inferred for this lineage (Fig. 2, Supple-mentary Fig. S5). However, P. cyclostomus appears to be an outliercompared other goatfishes but has a very short branch (Fig. 2). Wenote that the RY-coded analyses showed relatively lower bootstrapsupport at many nodes compared to topologies from the originalalignments. This could indicate that similarities in base frequenciesare artificially inflating support values at some nodes, but it is alsopossible that lower support values are simply due to decreasedinformativeness of the RY-coded matrices compared to unalteredmatrices.
Long branch attraction is a well-documented phenomenon thatcan produce incorrect topologies (Felsenstein, 1978). Despite thepresence of several long branches at the base of major lineagessuch as Pegasidae and Solenostomidae, these clades did not tendto group together in the Bayesian or likelihood analyses (Fig. 2,Supplementary Fig. S1–3). Removing the Pegasidae had no effecton topology, but the exclusion of Solenostomidae changed rela-tionships among Centriscidae, Fistulariidae, Aulostomidae,Solenostomidae and Syngnathidae (Fig. 2). Nevertheless, changesin topology after the removal of Solenostomidae do not indicatethat its long subtending branch was causing long-branch attractionartifacts: no particularly long branches shifted away from this por-tion of the tree after removal, and bootstrap support for the shiftedplacement of Aulostomidae plus Fistulariidae was not improved.Instead, changes in topology after the exclusion of certain lineagescould indicate that relationships are sensitive to taxonomic sam-pling (Heath et al., 2008). The removal of Solenostomidae rear-ranged nearby relationships separated by extremely shortinternal branch lengths, which are likely to be most sensitive tochanges in the data matrix. As we describe in more detail below,the inclusion of Solenostomidae may be important for informingrelationships among what was an apparently old and rapid radia-tion. While there is not a straightforward case for long-branchattraction, long branches can be symptomatic of and coincidentwith other phylogenetic challenges, including compositionalheterogeneity, lineage specific rate heterogeneity and heterotachy,all of which can mislead phylogenetic inference (Kumar et al.,2012; Rothfels et al., 2012; Whitfield and Kjer, 2008).
Concatenated datasets can result in the inference of incorrecttopologies by ignoring conflicting phylogenetic signal among loci.One common source of discordance among loci in vertebrate taxais incomplete lineage sorting or ILS (Maddison, 1997). ILS resultsin conflict between some gene trees and the true species treeand a coalescent approach should more accurately recover the truespecies tree when there is a moderate to large degree of ILS(Mirarab and Warnow, 2015; Mirarab et al., 2014). Given the largenumber of UCE loci in our datasets and the relatively short internalbranch lengths between speciation events leading to almost allfamilies in our dataset (Fig. 1), we used a coalescent-consistentmethod (ASTRAL) to account for the potential negative impact(s)of ILS.
The consensus species trees we obtained from our ASTRAL anal-yses differed from our BI/ML topology in a number of ways, includ-ing major rearrangements of the relationships among the benthic-associated lineages with respect to each other and to the clade oftraditional syngnathiform lineages (Fig. 4, SupplementaryFig. S4). For instance, while the BI/ML analyses resolved long-snouted syngnathiforms as sister to a monophyletic group of all
the benthic-associated families (Callionymidae, Dactylopteridae,Mullidae, and Pegasidae), this arrangement was not recovered inany of the ASTRAL trees. Instead, the long-snouted syngnathiformswere usually nested as a clade within the benthic associated lin-eages in the ASTRAL topologies, although the actual ordering ofbenthic clades was not consistent and poorly supported.
Both shallow and deep topological discrepancies between theASTRAL topology and BI/ML topology often correspond to areaswith extremely short internode branch lengths in the BI/MLtopologies (e.g., relationships among Mulloidichthys species). Allelse being equal, we would expect these areas of rapid diversifica-tion to have higher rates of ILS, and therefore be more likely to dif-fer from concatenated analyses. While discordance (low nodalsupport) can be due to actual historical events such as ILS, it canbe falsely inflated by violations of the assumptions of the method,such as assuming that input gene trees are correct. We believe thisto be an important issue for our UCE dataset because gene treesfrom short, highly conserved loci often produced poorly-resolvedgene trees. Additionally, poorly resolved gene trees may be moresensitive to sources of systematic error, such as base compositionalbias, compared to multi-locus alignments (Betancur-R et al.,2013b). We therefore ran additional ASTRAL analyses that were fil-tered to include more informative loci (loci in the upper quartilefor number of parsimony informative sites). This approach doesnot solve the issue of low gene tree accuracy, but it does removethe most spurious gene trees from the dataset being analyzed.Using more informative loci increased support for some relation-ships and decreased support at others (Fig. 4, SupplementaryFig. S4). Most notably, the analyses with informative loci resultedin higher support for monophyletic long-snouted syngnathiformsin both matrices. Callionymids also emerged as sister clade to thisgroup in both analyses, though with low support. Overall, focusingonly on the most informative loci (loci in the upper quartile of par-simony informative sites versus all loci) increased global topologi-cal support, although relationships among benthic associatedlineages generally remained inconclusive, as summarized inFig. 6. Low support at these nodes could reflect true discordancedue to historical events (e.g., ILS) or insufficient phylogenetic infor-mation in our loci, but it is reassuring that incongruent relation-ships between analyses on informative loci are reflected by lownode support (Fig. 4B, Supplementary Fig. 4B).
4.2. Evolutionary relationships among long-snouted Syngnathiformes
While there are some striking differences between the topolo-gies we present, they agree on a number of fundamental pointsrelating to controversial relationships among syngnathiform lin-eages. Fig. 4 summarizes the two topological arrangements ofmajor syngnathiform lineages we have described and their variousmeasures of support. Across all analyses, we resolved traditional,long-snouted syngnathiform fishes (Centriscidae, Aulostomidae,Fistulariidae, Solenostomidae, and Syngnathidae) as a mono-phyletic group, sharing a more recent common ancestor with eachother than they do with any of the benthic syngnathiform lineages(Dactylopteridae, Pegasidae, Mullidae, Callionymidae). This nodewas fully supported in the BI/ML analyses (posterior probabil-ity = 1, bootstrap = 100) and the gene-tree species-tree analyses fil-tered for informative loci (95% MLSB = 92, 75% MLBS = 100). Withthe exception of Near et al. (2013), previous large-scale molecularanalyses nested benthic-associated lineages among traditionalsyngnathiforms (Betancur-R et al., 2013a; Dettai and Lecointre,2005; Kawahara et al., 2008; Smith and Craig, 2007; Near et al.,2012; Sanciangco et al., 2016; Song et al., 2014). Our finding of amonophyletic long-snouted syngnathiform group is easier to rec-oncile with the morphological literature where a number of keyfeatures, including aspects of the snout (e.g., Keivany and Nelson,

Fistulariidae
Aulostomidae
Centriscidae
Callionymidae
Dactylopteridae
Mullidae
Pegasidae
Solenostomidae
Syngnathidae
1/100
1/53
1/92
1/100
1/100
1/100
1/100
1/100
1/100
1/100
1/100
1/100
1/100
1/100
1/100
100/100
100/100
100/100
100/100
100/100
100/100
100/100
100/100
1/100
100/100
42/54
92/100
100/100
63/85
100
1/100 99/100
posterior probability/bootstrap 95% MLBS/ 75% MLBS
Bayesian and ML Topology Species Tree
Fig. 6. These cladograms compare the two main topologies of evolutionary relationships among major syngnathiform lineages produced in this study. On the left arerelationships recovered by all Bayesian (BI) and maximum likelihood (ML) analyses that included all lineages. The BI posterior probability followed by the ML bootstrapsupport is labeled above each branch. The topology on the right summarizes relationships from the ASTRAL gene-tree species-tree analyses using datasets of informative loci.Relationships that were inconsistent between analyses (and had low support) were collapsed into polytomies. Site-only multi-locus bootstrap (MLBS) support is includedabove each branch. Relationships among traditional long-snouted syngnathiform families are highlighted by purple branches while the benthic-associated lineages are inorange.
44 S.J. Longo et al. /Molecular Phylogenetics and Evolution 113 (2017) 33–48
2006), suggest that these lineages should remain monophyleticdespite the shift in their global position among all fishes. Neverthe-less, Pegasidae was previously grouped with Syngnathiformesbased on morphological characteristics (Nelson, 2006; Pietsch,1978), but we do not find evidence that they are more closelyrelated to traditional syngnathiforms than the other benthic lin-eages (Fig. 5). Instead, Pegasidae may be most closely related tothe Dactylopteridae, which has been proposed based on morphol-ogy (Pietsch, 1978), although this relationship is not reflected inour consensus species trees (Fig. 4, Supplementary Fig. 4).
Relationships among the long-snouted syngnathiform familiesAulostomidae, Fistulariidae, Solenostomidae, and Syngnathidaewere also generally consistent across analyses using UCEs,although the relative placement of Centriscidae shifted dependingon matrix and inferential approach. Aulostomidae plus Fistulari-idae and Solenostomidae plus Syngnathidae were each fully sup-ported clades (posterior probability = 1, bootstrap = 100,MLBS = 100). Despite short internal branch lengths in this area ofthe tree (as small as 0.0007 units for the 95% partitioned ExaBayesTree; Fig. 2), the Bayesian analyses placed the Centriscidae sister toAulostimidae plus Fistulariidae with high confidence (posteriorprobability = 1). While the best trees from our maximum likeli-hood analyses also recovered this clade with Centriscidae, Fistu-lariidae, and Aulostomidae, there was only moderate support at
this node (bootstrap 53–65 depending on matrix completeness).Likewise, ASTRAL analyses consistently yielded a clade composedof Centriscidae, Fistulariidae, and Aulostomidae, but the supportat this node was only moderate for matrices enriched for informa-tive loci (MLBS = 63–85). There are cases in which Bayesian poste-rior probabilities can be inflated and topological uncertainty maybe better represented by the more conservative nonparametricbootstraps (Alfaro et al., 2003; Cummings et al., 2003; Kumaret al., 2012; Simmons et al., 2004), so the RAxML and ASTRAL treesmay better reflect uncertainty in relationships among Centriscidae,Fistulariidae, and Aulostomidae. It is also important to note thatCentriscidae, Aulostomidae, and Fistulariidae did not form a cladein the RY-coded analyses (Fig. 5), indicating that some inflated sup-port for this clade could be caused by similarity in base composi-tion, although the placement of Aulostomidae and Fistulariidaerelative to other syngnathiforms was only moderately supported(bootstrap = 67–72).
Placement of Centriscidae, Aulostomidae, and Fistulariidae rela-tive to other syngnathiforms has been historically inconsistent andpoorly supported (Betancur-R et al., 2013a; Near et al., 2012;Sanciangco et al., 2016; Song et al., 2014). The short internalbranch lengths in this region of the tree (e.g., Fig. 2) suggest thatthese lineages rapidly diverged from one another in deep time,which is an evolutionary scenario that can be difficult to

S.J. Longo et al. /Molecular Phylogenetics and Evolution 113 (2017) 33–48 45
reconstruct. One way to diagnose an ancient rapid radiation is tolook for topological incongruence with consistently low supportamong analyses and sensitivity to such factors as changes in taxo-nomic representation (Whitfield and Kjer, 2008; Whitfield andLockhart, 2007). Here, removal of a long-branch (Solenostomidae)changed the relationships among the long-snouted families, eventhough short branch lengths and low bootstrap support remain aproblem in this area of the phylogeny (Fig. 2). Changes in topologyafter the removal of certain lineages could indicate that syngnathi-form relationships are sensitive to taxonomic sampling artifacts,such as the inclusion of Solenostomidae. Indeed, the removal ofSolenostomidae caused the topology of long-snouted syngnathi-form taxa to converge on that published by Near et al. (2013),which did not sample a representative of this family.
4.3. Uncertain placement of benthic-associated lineages
While we argue that the overarching signal across our analysessupports that long-snouted syngnathiforms form a clade, the rela-tionship between this clade and the other syngnathiform families(Callionymidae, Dactylopteridae, Mullidae, and Pegasidae) remainsambiguous (Fig. 6). Note that in the BI/ML topologies benthic-associated lineages always formed a monophyletic group, whilethe ASTRAL analyses tended to nest the long-snouted clade withinthe benthic associated lineages (albeit with low support). The dis-crepancies between these two scenarios are significant and haveimportant implications for our understanding of syngnathiformmorphological evolution and diversification. Future UCE studiesthat sample a larger diversity of percomorph outgroup taxa mayhelp alleviate some uncertainty in this area of the syngnathiformtree.
4.4. Resolution of species-level relationships
Within-lineage relationships were highly stable across analysesand remarkably well-resolved. As shown in Fig. 6, all nine syng-nathiform families were fully supported monophyletic groups(posterior probability = 1, bootstrap = 100, MLBS = 100). Most gen-era were also monophyletic, with the exception of those in Cal-lionymidae where many were polyphyletic (Figs. 2–5). Issueswithin callionymids may reflect differing opinions about genericdefinitions among morphological taxonomists (Nelson, 2006),and these problems highlight the need for additional work on thisphylogenetically understudied group of fishes. Within the Syng-nathidae, the genus Microphis was paraphyletic with respect tothe closely related Dorichthys (Dawson, 1981, 1984). In agreementwith a recently published syngnathid phylogeny (Hamilton et al.,2016), Cosmocampus and Halicampus were both polyphyletic. Itappears that a number of syngnathid genera will require revisitingas more species are included in future phylogenetic analyses withincreased taxonomic sampling (Hamilton et al., 2016).
The evolutionary relationships among syngnathid speciesreported in this study largely agree with recently published phylo-genetic analyses (Hamilton et al., 2016; Mwale et al., 2013; Teskeand Beheregaray, 2009; Wilson and Rouse, 2010). One of the majordichotomies within syngnathids is male brood pouch location: onthe trunk region (trunk-brooder) or on the tail region (tail-brooder) (Hamilton et al., 2016; Wilson and Orr, 2011; Wilsonet al., 2001). It has been previously shown that each type of broo-der forms a monophyletic group, with the exception of the trunk-brooder, Syngnathoides biaculeatus, which shares a more recentcommon ancestor with tail-brooding pipefishes (Hamilton et al.,2016; Wilson and Rouse, 2010). In this study, we sampled an addi-tional genus of trunk brooding pipefish (Doryichthys) that has notbeen included in prior molecular syngnathid phylogenies. Dor-yichthys was resolved, as expected, among the trunk brooding
clade (e.g., Fig. 2). Overall, we verify that all trunk-brooding pipe-fish species (except S. biaculeatus) are monophyletic and sister toall tail-brooding pipefishes, which was consistent across everyanalysis in this study with high support. These two broodingstrategies are apparently highly conserved within syngnathids(Hamilton et al., 2016).
The evolutionary relationships of the unusual and charismaticseadragons (Phycodurus eques and Phyllopteryx taeniolatus) havereceived specific attention in the past (Wilson and Rouse, 2010).We find high support for a close relationship between S. biaculeatusand seadragons (red clade in Figs. 2–5). This does not agree withthe previously published phylogeny using mitochondrial data(Wilson and Rouse, 2010), but is consistent with the results usingnuclear loci in Hamilton et al. (2016). However, the placement ofthe clade including seadragons and S. biaculeatuswithin Syngnathi-dae was problematic. Their relationship to other tail-broodingpipefishes was the only topological rearrangement that occurredwhen matrix completeness was altered (Fig. 2, red and blue clades)and this node had low bootstrap and MLSB support across analyses(Figs. 2–5). The addition of more taxa in future UCE analyses mayhelp stabilize the placement of this early-branching lineage withintail-brooding syngnathids. For instance, in a recent study that sam-pled many more genera, including close relatives of seadragons(Solegnathus pipe horses; Hamilton et al. (2016)), the messmatepipefish clade (Corythoichthys and Stigmatopora) was the earliestbranching tail-brooding lineage as in the 75% analysis in Fig. 2(blue clade) .
Because of their specialized brood pouches, upright posture,and extreme tail-prehension, the placement of seahorses withinsyngnathids has garnered special attention. Until recently, it wasgenerally accepted that seahorses are sister to pygmy pipehorses,which also possess tail prehension and lack a caudal fin (Caseyet al., 2004; Kuiter, 2009; Neutens et al., 2014; Teske andBeheregaray, 2009; Teske et al., 2004). However, we find that thesister group to seashores consists of our pygmy pipehorse repre-sentative, Idiotropsicus lumnitzeri, and the pipefish Trachyrhamphusbiocoarctatus. This result was repeated across all datasets andmethods with high support, and replicates the findings for a smal-ler dataset of nuclear loci (Hamilton et al., 2016). A close relation-ship between Trachyrhamphus and either pygmy pipehorses orseahorses has not been suggested based on morphology. Superfi-cially, Trachyrhamphus species appear quite different from sea-horses due to their often-drab coloration and relatively large size(Kuiter, 2009). However, on closer inspection, Trachyrhamphuspipefishes possess a number of key traits resembling seahorsesand pipehorses. For instance, they have a relatively bent-head pos-ture, may exhibit dermal flaps, and the caudal fin is lost or rudi-mentary in adults (Dawson, 1985). If these relationships are bornout, study of Trachyrhamphus armor and caudal developmentmay help inform the evolution of the seahorse’s striking anatomy.
4.5. An ancient rapid radiation of misfit fishes
This is the largest study focused on syngnathiform relationshipsand the first to use a targeted-enrichment approach. The resultspresented here have given significant insights into the evolution-ary relationships among syngnathiform lineages, especially amongthe long-snouted families. Although we did not perform analysesthat infer ultrametric or dated topologies, the extremely shortbranch lengths estimated in our Bayesian and maximum likelihoodanalyses are consistent with a rapid radiation at the base of syng-nathiforms. From previous work, Syngnathiformes are estimated tobe 60–90 million years old (Betancur-R et al., 2013a; Near et al.,2012; Sanciangco et al., 2016). Such ancient rapid radiations arenotoriously difficult phylogenetic problems and can be com-pounded by a suite of associated concerns including long-branch
46 S.J. Longo et al. /Molecular Phylogenetics and Evolution 113 (2017) 33–48
attraction and rate heterogeneity (Whitfield and Lockhart, 2007). Arapid burst of speciation followed by long periods of independentdiversification and radiation within lineages helps explain why tra-ditional approaches before molecular systematics failed to cor-rectly identify syngnathiform outgroups and why the resolutionof branching relationships among currently recognized familieshas been inconsistent across large-scale molecular studies to date.While we anticipate that future studies focusing on this group of‘‘misfit fishes” will reveal previously overlooked morphologicalcharacters uniting them with traditional syngnathiforms, it is alsopossible that rapid radiation followed by extended periods ofdivergence has eroded phylogenetic signal in morphology. Thismay be especially true for lineages such as the goatfish (Mullidae),which have many apomorphic traits associated with adaptationsfor benthic foraging (Gosline, 1984) and which have been histori-cally difficult to place in the fish tree of life based on morphologicalcharacters.
Our study adds further evidence to the case that UCEs have thepotential to resolve difficult issues within rapid radiations (McGeeet al., 2016; Meiklejohn et al., 2016). However, sources of bias mustbe investigated, especially because systematic error is expected tobe particularly problematic for instances where basal internodedistances are closely spaced (Whitfield and Lockhart, 2007). Inour case, we show that incomplete sampling of certain lineages(e.g., exclusion of the solenostomids) can lead to the inference ofhighly supported alternative topologies. In agreement with recentstudies using UCEs (e.g., Meiklejohn et al., 2016), we find that thespecies tree summary method ASTRAL resulted in high discordanceand a shift to unsymmetrical topologies when used on a UCE data-set. The situation may also become worse when applied to rapidradiations that are also ancient, since most loci will be uninforma-tive for very short branches (Townsend et al., 2011). Filtering data-sets to include informative loci may help alleviate somediscordance due to poorly resolved gene trees, although deep rela-tionships in our phylogeny remained poorly supported and incon-sistent across matrices after filtering.
Syngnathiform lineages have acquired a range of functional,morphological, and behavioral innovations including power-amplified head rotation, independently mobile sensory barbels,pectoral-fin subdivision, extreme jaw protrusion, segmentedarmor, male and female brooding, and hovering locomotion. Thereare also substantial differences in morphological disparity and lin-eage diversity between families, ranging from three nearly-morphologically identical species of Aulostomidae to Syngnathi-dae, which includes more than 316 species having exceptionallyhigh body shape disparity (the highest among 53 families of coralreef fishes in Price et al., (2015)). It could be that features of therapid radiation itself, such as mosaicking of genetic backgroundsvia ancestral polymorphism and hybridization, or periods of veryhigh genetic variation within populations caused by these pro-cesses, led to such disparate lineages and facilitated the evolutionof extremely unusual forms. Recent rapid radiations have receivedmuch attention for the unusual circumstances that allow earlydivergence, especially in fishes (Henning and Meyer, 2014;Martin et al., 2015; Meyer et al., 1990; Pickrell and Pritchard,2012; Seehausen, 2006), but the long-term impact of these eventson diversification patterns are not often apparent because of thefocus on young radiations. The nature of the syngnathiform radia-tion suggests the possibility that there were long-term effects ofthis event that were key to the rapid diversification that foundedthis interesting group of fishes. It is unmistakable that this ancientradiation has had a lasting impact, encompassing some of theoddest and most successful groups of fishes. Syngnathiformestherefore present an exciting opportunity to study patterns of nov-elty and disparity arising from a fairly ancient radiation. We antic-ipate future work focused on these ideas to benefit from improved
methodologies, models, and computational innovations designedto accommodate phylogenomic datasets.
Acknowledgements
This research was supported by the National Science Founda-tion (NSF) Graduate Research Fellowship Program under GrantNo. 1148897, NSF Doctoral Dissertation Improvement Grant DEB-1500800, the Center for Population Biology at the University of Cal-ifornia, Davis, and the Society for Integrative and Comparative Biol-ogy. We are grateful to the many individuals who assisted inspecimen collection, specimen loans, and fieldwork, including B.Bowen, S. Chiba, J. Copus, E. Jessup, C. Lyons, K. Mabuchi, C. Martin,S. Mochel, F. Oliaro, L. Rocha, and G. Shinohara. We are also gratefulto the Seaver Institute for financial support that facilitated collec-tions in the field. We thank K. Bemis and those who were crucialin the collection and identification of callionymid specimens,including C. Jones, A. Donovan. J. Johnson, A. Prosser, J. Staunton-Smith, I. Tibbetts, andW.E. Bemis. The following institutions kindlydonated tissue samples: Australian Museum, Birch Aquarium atScripps, Field Museum of Natural History, Florida Museum of Nat-ural History, Kansas Institute of Biodiversity, Philadelphia Acad-emy of Natural Science, Shedd Aquarium in Chicago, and TokyoNational Museum of Nature and Science. We thank G. Ortí, R.Betancur-R, and an anonymous reviewer who provided helpfulcomments and suggestions that improved our manuscript.
Appendix A. Supplementary material
Supplementary data associated with this article can be found, inthe online version, at http://dx.doi.org/10.1016/j.ympev.2017.05.002.
References
Aberer, A.J., Kobert, K., Stamatakis, A., 2014. ExaBayes: Massively Parallel Bayesiantree inference for the Whole-Genome Era. Mol. Biol. Evol. 31, 2553–2556.
Alfaro, M.E., Zoller, S., Lutzoni, F., 2003. Bayes or bootstrap? A simulation studycomparing the performance of Bayesian Markov chain Monte Carlo samplingand bootstrapping in assessing phylogenetic confidence. Mol. Biol. Evol. 20,255–266.
Allen, L.G., 1984. Gobiesociformes: development and relationships. Ontogen.System. Fishes, 629–636.
Berglund, A., Rosenqvist, G., 2003. Sex role reversal in pipefish. Adv. Study Behav.32, 131–168.
Betancur-R, R., Broughton, R.E., Wiley, E.O., Carpenter, K., López, J.A., Li, C., Holcroft,N.I., Arcila, D., Sanciangco, M., Ii, J.C.C., et al., 2013a. The tree of life and a newclassification of bony fishes. PLoS Curr. 5, 1–45.
Betancur-R, R., Li, C., Munroe, T.A., Ballesteros, J.E., Ortí, G., 2013b. Addressing genetree discordance and non-stationarity to resolve a multi-locus phylogeny ofFlatfishes (Teleostei: Pleuronectiformes). Syt. Biol. 62, 763–785.
Blaimer, B.B., Brady, S.G., Schultz, T.R., Lloyd, M.W., Fisher, B.L., Ward, P.S., 2015.Phylogenomic methods outperform traditional multi-locus approaches inresolving deep evolutionary history: a case study of formicine ants. BMC Evol.Biol. 15, 271.
Bowen, B.W., Bass, A.L., Rocha, L.A., Grant, W.S., Robertson, R., 2001. Phylogeographyof the trumpetfishes (Aulostomus): ring species complex on a global scale.Evolution (N. Y) 55, 1029–1039.
Borowiec, M.L., 2016. AMAS: a fast tool for alignment manipulation and computingof summary statistics. PeerJ 4, e1660.
Casey, S.P., Hall, H.J., Stanley, H.F., Vincent, A.C.J., 2004. The origin and evolution ofseahorses (genus Hippocampus): a phylogenetic study using the cytochrome bgene of mitochondrial DNA. Mol. Phylogenet. Evol. 30, 261–272.
Castresana, J., 2000. Selection of conserved blocks from multiple alignments fortheir use in phylogenetic analysis. Mol. Biol. Evol. 17, 540–552.
Chen, W.J., Bonillo, C., Lecointre, G., 2003. Repeatability of clades as a criterion ofreliability: a case study for molecular phylogeny of Acanthomorpha (Teleostei)with larger number of taxa. Mol. Phylogenet. Evol. 26, 262–288.
Crawford, N.G., Faircloth, B.C., McCormack, J.E., Brumfield, R.T., Winker, K., Glenn, T.C., 2012. More than 1000 ultraconserved elements provide evidence that turtlesare the sister group of archosaurs. Biol. Lett. 8, 783–786.
Cummings, M.P., Handley, S.A., Myers, D.S., Reed, D.L., Rokas, A., Winka, K., 2003.Comparing bootstrap and posterior probability values in the four-taxon case.Syst. Biol. 52, 477–487.

S.J. Longo et al. /Molecular Phylogenetics and Evolution 113 (2017) 33–48 47
Cummings, M.P., Meyer, A., 2005. Magic bullets and golden rules: data sampling inmolecular phylogenetics. Zoology 108, 329–336.
Dawson, C.E., 1981. Review of the indo-pacific doryrhamphine pipefish genusdoryichthys. J. Ichthyol. 28, 1–18.
Dawson, C.E., 1984. Revision of the Genus Microphis Kaup (Pisces: Syngnathidae).Bull. Mar. Sci. 35, 117–181.
Dawson, C.E., 1985. Indo-Pacific Pipefishes. Ocean Springs. The Gulf Coast ResearchLaboratory, Mississippi.
Dávalos, L.M., Perkins, S.L., 2008. aturation and base composition bias explainphylogenomic conflict in Plasmodium. Genomics 91, 433–442.
Dettai, A., Lecointre, G., 2005. Further support for the clades obtained by multiplemolecular phylogenies in the acanthomorph bush. Comptes Rendus – Biol. 328,674–689.
Eschmeyer, W.N., Fricke, R., van der Laan, R., 2017. Catalog of Fishes: Genera,Species, References. <http://researcharchive.calacademy.org/research/ichthyology/catalog/fishcatmain.asp>. Electronic version accessed 14 04 2017.
Eytan, R.I., Evans, B.R., Dornburg, A., Lemmon, A.R., Lemmon, E.M., Wainwright, P.C.,Near, T.J., 2015. Are 100 enough? Inferring acanthomorph teleost phylogenyusing Anchored Hybrid Enrichment. BMC Evol. Biol. 15, 113.
Faircloth, B.C., 2015. PHYLUCE is a software package for the analysis of conservedgenomic loci. Bioinformatics 32, 786–788.
Faircloth, B.C., McCormack, J.E., Crawford, N.G., Harvey, M.G., Brumfield, R.T., Glenn,T.C., 2012. Ultraconserved elements anchor thousands of genetic markersspanning multiple evolutionary timescales. Syst. Biol. 61, 717–726.
Faircloth, B.C., Sorenson, L., Santini, F., Alfaro, M.E., 2013. A phylogenomicperspective on the radiation of ray-finned fishes based upon targetedsequencing of Ultraconserved Elements (UCEs). PLoS ONE 8, e65923.
Faircloth, B.C., Branstetter, M.G., White, N.D., Brady, S.G., 2014. Target enrichment ofultraconserved elements from arthropods provides a genomic perspective onrelationships among Hymenoptera. Mol. Ecol. Resour. n/a–n/a.
Felsenstein, J., 1978. Cases in which parsimony or compatibility methods will bepositively misleading. Soc. Syst. Biol. 27, 401–410.
Foster, P.G., Hickey, D.A., 1999. Compositional Bias May Affect Both DNA-Based andProtein-Based Phylogenetic Reconstructions. pp. 284–290.
Gilbert, P.S., Chang, J., Pan, C., Sobel, E.M., Sinsheimer, J.S., Faircloth, B.C., Alfaro, M.E.,2015. Genome-wide ultraconserved elements exhibit higher phylogeneticinformativeness than traditional gene markers in percomorph fishes. Mol.Phylogenet. Evol. 92, 140–146.
Glenn, T.C., Nilsen, R.A., Kieran, T.J., Finger Jr., J.W., Pierson, T.W., Bentley, K.E.,Hoffberg, S.L., Louha, S., García-De León, F.J., Portilla, M.A.D.R., et al., 2016.Adapterama I: Universal stubs and primers for thousands of dual-indexedIllumina libraries (iTru & iNext). BioRxiv, 049114.
Gosline, W.A., 1970. A reinterpretation of the teleostean fish order Gobiesociformes.Proc. Calif. Acad. Sci. 38, 363–381.
Gosline, W.A., 1984. Structure, Function, and Ecology in the Goatfishes (FamilyMullidae). Pacific Sci. 38, 312–323.
Gregory, W.K., 1933. Fish Skulls: A Study of the Evolution of Natural Mechanisms.Trans. Amer. Phil. Soc. 23, 75–481.
Hamilton, H., Saarman, N., Short, G., Sellas, A.B., Moore, B., Hoang, T., Grace, C.L.,Gomon, M., Crow, K., Brian, W., 2016. Molecular phylogenetics and evolutionmolecular phylogeny and patterns of diversification in syngnathid fishes. Mol.Phylogenet. Evol. 107, 388–403.
Harvey, M.G., Smith, B.T., Glenn, T.C., Faircloth, B.C., Brumfield, T., Rouge, B., Rouge,B., Harvey, M.G., 2016. Sequence capture versus rad-seq for shallowsystematics. Syst. Biol. 65, 910–924.
Heath, T.A., Hedtke, S.M., Hillis, D.M., 2008. Taxon sampling and the accuracy ofphylogenetic analyses. J. Syst. Evol. 46, 239–257.
Henning, F., Meyer, A., 2014. The evolutionary genomics of cichlid fishes: explosivespeciation and adaptation in the postgenomic era. Annu. Rev. Genom. Hum.Genet. 15, 417–441.
Hillis, D.M., Pollock, D.D., McGuire, J.A., Zwickl, D.J., 2003. Is sparse taxon sampling aproblem for phylogentic inference? Syst. Biol. 52, 124–126.
Houde, E.D., 1984. Callionymidae: development and relationships. In: Ontogeny andSystematics of Fishes. American Society of Ichthyologists and HerpetologistsSpecial Publication, pp. 637–640.
Imamura, H., 2000. An alternative hypothesis on the phylogenetic position of thefamily Dactylopteridae (pisces: Teleostei), with a proposed new classification.Ichthyol. Res. 47, 203–222.
Ishikawa, S.A., Inagaki, Y., Hashimoto, T., 2012. RY-coding and non-homogeneousmodels can ameliorate the maximum-likelihood inferences from nucleotidesequence data with parallel compositional heterogeneity. Evol. Bioinforma. 8,357–371.
Jeffroy, O., Brinkmann, H., Delsuc, F., Philippe, H., 2006. Phylogenomics: thebeginning of incongruence? Trends Genet. 22, 225–231.
Jermiin, L., Ho, S.Y., Ababneh, F., Robinson, J., Larkum, A.W., 2004. The biasing effectof compositional heterogeneity on phylogenetic estimates may beunderestimated. Syst. Biol. 53, 638–643.
Johnson, G.D., Patterson, C., 1993. Percomorph phylogeny: a survey ofacanthomorphs and a new proposal. Bull. Mar. Sci. 52, 554–626.
Kawahara, R., Miya, M., Mabuchi, K., Lavoué, S., Inoue, J.G., Satoh, T.P., Kawaguchi, A.,Nishida, M., 2008. Interrelationships of the 11 gasterosteiform families(sticklebacks, pipefishes, and their relatives): a new perspective based onwhole mitogenome sequences from 75 higher teleosts. Mol. Phylogenet. Evol.46, 224–236.
Keivany, Y., Nelson, J.S., 2006. Interrelationships of Gasterosteiformes(Actinopterygii, Percomorpha). J. Ichthyol. 46, S84–S96.
Kuiter, R., 2009. Seahorses and Their Relatives. Aquatic Photographics, Seaford,Australia, p. 334.
Kumar, S., Filipski, A.J., Battistuzzi, F.U., Kosakovsky Pond, S.L., Tamura, K., 2012.Statistics and truth in phylogenomics. Mol. Biol. Evol. 29, 457–472.
Lanfear, R., Calcott, B., Kainer, D., Mayer, C., Stamatakis, A., 2014. Selecting optimalpartitioning schemes for phylogenomic datasets. BMC Evolut. Biol. 14, 1–14.
Lecointre, G., Philippe, H., Lanh van Le, H., le Guyader, H., 1993. Species samplinghas a major impact on phylogenetic inference. Mol. Phylogenet. Evol. 2, 205–224.
Lemmon, E.M., Lemmon, A.R., 2013. High-throughput genomic data in systematicsand phylogenetics. Annu. Rev. Ecol. Evol. Syst. 44, 99–121.
Leo, W., Craig, M.T., 2007. Casting the percomorph net widely: the importance ofbroad taxonomic sampling in the search for the placement of serranid andpercid fishes. Copeia 1, 35–55.
Li, B., Dettaï, A., Cruaud, C., Couloux, A., Desoutter-Meniger, M., Lecointre, G., 2009.RNF213, a new nuclear marker for acanthomorph phylogeny. Mol. Phylogenet.Evol. 50, 345–363.
Maddison, W.P., 1997. Gene trees in species trees. Syst. Biol. 46, 523–536.Manthey, J.D., Campillo, L.C., Burns, K.J., Moyle, R.G., 2016. Comparison of target-
capture and restriction-site associated DNA sequencing for phylogenomics: atest in cardinalid tanagers (Aves, Genus: Piranga). Syst. Biol. syw005.
Martin, C.H., Cutler, J.S., Friel, J.P., Dening Touokong, C., Coop, G., Wainwright, P.C.,2015. Complex histories of repeated gene flow in Cameroon crater lake cichlidscast doubt on one of the clearest examples of sympatric speciation. Evolution69, 1406–1422.
McCormack, J.E., Faircloth, B.C., Crawford, N.G., Gowaty, P.A., Brumfield, R.T., Glenn,T.C., 2012. Ultraconserved elements are novel phylogenomic markers thatresolve placental mammal phylogeny when combined with species-treeanalysis. Genome Res. 22, 746–754.
McGee, M.D., Faircloth, B.C., Borstein, S.R., Zheng, J., Darrin Hulsey, C., Wainwright,P.C., Alfaro, M.E., 2016. Replicated divergence in cichlid radiations mirrors amajor vertebrate innovation. Proc. Roy. Soc. B 283, 20151413.
Meiklejohn, K.A., Faircloth, B.C., Glenn, T.C., Kimball, R.T., Braun, E.L., 2016. Analysisof a rapid evolutionary radiation using ultraconserved elements (UCEs):evidence for a bias in some multispecies coalescent methods. Syst. Biol. 0,syw014.
Meyer, A., Kocher, T.D., Basasibwaki, P., Wilson, A., 1990. Monophyletic origin ofLake Victoria cichlid Fishes suggested by mitochondrial DNA sequences. Nature347, 550–553.
Mirarab, S., Warnow, T., 2015. ASTRAL-II: Coalescent-based species tree estimationwith many hundreds of taxa and thousands of genes. Bioinformatics 31, i44–i52.
Mirarab, S., Reaz, R., Bayzid, M.S., Zimmermann, T., Swenson, M.S., Warnow, T.,2014. ASTRAL: genome-scale coalescent-based species tree estimation.Bioinformatics 30, i541–i548.
Miya, M., Takeshima, H., Endo, H., Ishiguro, N.B., Inoue, J.G., Mukai, T., Satoh, T.P.,Yamaguchi, M., Kawaguchi, A., Mabuchi, K., et al., 2003. Major patterns of higherteleostean phylogenies: a new perspective based on 100 completemitochondrial DNA sequences. Mol. Phylogenet. Evol. 26, 121–138.
Mobley, K.B., Jones, A.G., 2013. Overcoming statistical bias to estimategenetic mating systems in open populations: a comparison of Bateman’sprinciples between the sexes in a sex-role-reversed pipefish. Evolution67, 646–660.
Mwale, M., Kaiser, H., Barker, N.P., Wilson, a.B., Teske, P.R., 2013. Identification of auniquely southern African clade of coastal pipefishes Syngnathus spp. J. FishBiol. 82, 2045–2062.
Near, T.J., Eytan, R.I., Dornburg, A., Kuhn, K.L., Moore, J.A., Davis, M.P.,Wainwright, P.C., Friedman, M., Smith, W.L., 2012. Resolution of ray-finnedfish phylogeny and timing of diversification. Proc. Natl. Acad. Sci. USA 109,13698–13703.
Near, T.J., Dornburg, A., Eytan, R.I., Keck, B.P., Smith, W.L., Kuhn, K.L., Moore, J.A.,Price, S.A., Burbrink, F.T., Friedman, M., et al., 2013. Phylogeny and tempo ofdiversification in the superradiation of spiny-rayed fishes. PNAS 110, 12738–12743.
Nelson, J.S., 1994. Fishes of the World. John Wiley & Sons, New York. 600p.Nelson, J.S., 2006. Fishes of the World. John Wiley & Sons, Hoboken, NJ. 600p.Neutens, C., Adriaens, D., Christiaens, J., De Kegel, B., Dierick, M., Boistel, R., Van
Hoorebeke, L., 2014. Grasping convergent evolution in syngnathids: A uniquetale of tails. J. Anat. 224, 710–723.
Nishihara, H., Okada, N., Hasegawa, M., 2007. Rooting the eutherian tree: the powerand pitfalls of phylogenomics. Genome Biol. 8, R199.
Philippe, H., Brinkmann, H., Lavrov, D.V., Littlewood, D.T.J., Manuel, M., Wörheide,G., Baurain, D., 2011. Resolving difficult phylogenetic questions: why moresequences are not enough. PLoS Biol. 9, e1000602.
Phillips, M.J., Delsuc, F., Penny, D., 2004. Genome-scale phylogeny and the detectionof systematic biases. Mol. Biol. Evol. 21, 1455–1458.
Pickrell, J.K., Pritchard, J.K., 2012. Inference of population splits and mixtures fromgenome-wide allele frequency data. PLoS Genet. 8, e1002967.
Pietsch, T.W., 1978. Evolutionary relationships of the sea moths (Teleostei:Pegasidae) with a classification of gasterosteiform families. Copeia 1978, 529.
Porter, M.M., Adriaens, D., Hatton, R.L., Meyers, M.a., McKittrick, J., 2015.BIOMECHANICS. Why the seahorse tail is square. Science, vol. 349, pp. aaa6683.
Price, S.A., Claverie, T., Near, T.J., Wainwright, P.C., 2015. Phylogenetic insights intothe history and diversification of fishes on reefs. Coral Reefs 34, 997–1009.
Rambaut, A., Suchard, M. A., Xie, D., Drummond, A.J., 2014. Tracer v1.6, Availablefrom <http://beast.bio.ed.ac.uk/Tracer>.

48 S.J. Longo et al. /Molecular Phylogenetics and Evolution 113 (2017) 33–48
Rodríguez-Ezpeleta, N., Brinkmann, H., Roure, B., Lartillot, N., Lang, B.F., Philippe, H.,2007. Detecting and overcoming systematic errors in genome-scalephylogenies. Syst. Biol. 56, 389–399.
Rothfels, C.J., Larsson, A., Kuo, L.Y., Korall, P., Chiou, W.L., Pryer, K.M., 2012.Overcoming deep roots, fast rates, and short internodes to resolve the ancientrapid radiation of eupolypod II ferns. Syst. Biol. 61, 490–509.
Sanciangco, M.D., Carpenter, K.E., Betancur-R, R., 2016. Phylogenetic placement ofenigmatic percomorph families (Teleostei: Percomorphaceae). Mol. Phylogenet.Evol. 94, 565–576.
Seehausen, O., 2006. African cichlid fish: a model system in adaptive radiationresearch. Proc. Roy. Soc. B 273, 1987–1998.
Simmons, M.P., Pickett, K.M., Miya, M., 2004. How meaningful are bayesian supportvalues? Mol. Biol. Evol. 21, 188–199.
Smith, B.T., Harvey, M.G., Faircloth, B.C., Glenn, T.C., Brumfield, R.T., 2014. Targetcapture and massively parallel sequencing of ultraconserved elements forcomparative studies at shallow evolutionary time scales. Syst. Biol. 63, 83–95.
Smith, W.L., Craig, M.T., 2007. Casting the percomorph net widely: the importanceof broad taxonomic sampling in the search for the placement of serranid andpercid fishes. Copeia, 35–55.
Smith, W.L., Wheeler, W.C., 2004. Polyphyly of the mail-cheeked fishes (Teleostei:Scorpaeniformes): evidence from mitochondrial and nuclear sequence data.Mol. Phylogenet. Evol. 32, 627–646.
Smith, W.L., Wheeler, W.C., 2006. Venom evolution widespread in fishes: aphylogenetic road map for the bioprospecting of piscine venoms. J. Hered. 97,206–217.
Song, H.Y., Mabuchi, K., Satoh, T.P., Moore, J.A., Yamanoue, Y., Miya, M., Nishida, M.,2014. Mitogenomic circumscription of a novel percomorph fish clade mainlycomprising ‘‘ Syngnathoidei ” (Teleostei). Gene 542, 146–155.
Springer, V.G., Johnson, G.D., 2004. Study of the dorsal gill-arch musculature of theteleostome fishes, with special reference to the actinopterygii. Bull. Biol. Soc.Washingt., 237–260
Stamatakis, A., 2014. RAxML version 8 a tool for phylogenetic analysis and post-analysis of large phylogenies, vol. 30, pp. 1312–1313.
Steinke, D., Salzburger, W., Meyer, A., 2006. Novel relationships among ten fishmodel species revealed based on a phylogenomic analysis using ESTs. J. Mol.Evol. 62, 772–784.
Stolting, K.N., Wilson, A.B., 2007. Male pregnancy in seahorses and pipefish: Beyondthe mammalian model. BioEssays 29, 884–896.
Swofford, D.L., 2002. PAUP*. Phylogenetic Analysis Using Parsimony (*and OtherMethods). Version 4. Sinauer Associates, Sunderland, Massachusetts.
Swofford, D.L., Olsen, G.J., Waddell, P.J., D.M.H., 1996. Phylogenetic inference. In:Hllis, D.M., Moritz, C., Mable, B.K. (Eds.), Molecular Systematics. Sunderland:Sinauer Associates, pp. 407–514.
Teske, P.R., Beheregaray, L.B., 2009. Evolution of seahorses’ upright posture waslinked to Oligocene expansion of seagrass habitats. Biol. Lett. 5, 521–523.
Teske, P.R., Cherry, M.I., Matthee, C.A., 2004. The evolutionary history of seahorses(Syngnathidae: Hippocampus): molecular data suggest a West Pacific originand two invasions of the Atlantic Ocean. Mol. Phylogenet. Evol. 30, 273–286.
Townsend, T.M., Mulcahy, D.G., Noonan, B.P., Sites, J.W., Kuczynski, C.A., Wiens, J.J.,Reeder, T.W., 2011. Phylogeny of iguanian lizards inferred from 29 nuclear loci,and a comparison of concatenated and species-tree approaches for an ancient,rapid radiation. Mol. Phylogenet. Evol. 61, 363–380.
Van Wassenbergh, S., Strother, J.A., Flammang, B.E., Ferry-Graham, L.A., Aerts, P.,2008. Extremely fast prey capture in pipefish is powered by elastic recoil. J. Roy.Soc. Interface 5, 285–296.
Van Wassenbergh, S., Roos, G., Genbrugge, A., Leysen, H., Aerts, P., Herrel, A., 2009.Suction is kid’s play: extremely fast suction in newborn seahorses. Biol. Lett. 5,200–203.
Washington, B.B., Eschmeyer, W.N., Howe, K., 1984. Scorpaeniformes: relationships.Ontogen. System. Fishes, 438–447.
Whitfield, J.B., Kjer, K.M., 2008. Ancient rapid radiations of insects: challenges forphylogenetic analysis. Annu. Rev. Entomol. 53, 449–472.
Whitfield, J.B., Lockhart, P.J., 2007. Deciphering ancient rapid radiations. TrendsEcol. Evol. 22, 258–265.
Wilson, A.B., Orr, J.W., 2011. The evolutionary origins of Syngnathidae: pipefishesand seahorses. J. Fish Biol. 78, 1603–1623.
Wilson, N.G., Rouse, G.W., 2010. Convergent camouflage and the non-monophyly of‘‘seadragons” (Syngnathidae: Teleostei): suggestions for a revised taxonomy ofsyngnathids. Zool. Scr. 39, 551–558.
Wilson, A.B., Vincent, A., Ahnesjö, I., Meyer, a., 2001. Male pregnancy in seahorsesand pipefishes (family Syngnathidae): rapid diversification of paternal broodpouch morphology inferred from a molecular phylogeny. J. Hered. 92, 159–166.
Wilson, A.B., Ahnesjö, I., Vincent, A.C.J., Meyer, A., 2003. The dynamics of malebrooding, mating patterns, and sex roles in pipefishes and seahorses (familySyngnathidae). Evolution 57, 1374–1386.
Woese, C.R., Achenbach, L., Rouviere, P., Mandelco, L., 1991. Archaeal phylogeny:reexamination of the phylogenetic position of Archaeoglohus fulgidus in light ofcertain composition-induced artifacts. Syst. Appl. Microbiol. 14, 364–371.
Zwickl, D.J., Hillis, D.M., 2002. Increased taxon sampling greatly reducesphylogenetic error. Syst. Biol. 51, 588–598.