a functional phylogenomic view of the seed...
TRANSCRIPT

A Functional Phylogenomic View of the Seed PlantsErnest K. Lee1., Angelica Cibrian-Jaramillo1,2,3.¤a, Sergios-Orestis Kolokotronis1.¤b, Manpreet S. Katari3,
Alexandros Stamatakis4¤c, Michael Ott4, Joanna C. Chiu5, Damon P. Little2, Dennis Wm. Stevenson2, W.
Richard McCombie6, Robert A. Martienssen6*, Gloria Coruzzi3, Rob DeSalle1*
1 Sackler Institute for Comparative Genomics, American Museum of Natural History, New York, New York, United States of America, 2 Cullman Program in Molecular
Systematics, The New York Botanical Garden, Bronx, New York, United States of America, 3 Center for Genomics and Systems Biology, Department of Biology, New York
University, New York, New York, United States of America, 4 Department of Computer Science, Technische Universitat Munchen, Munich, Germany, 5 Department of
Entomology, University of California Davis, Davis, California, United States of America, 6 Cold Spring Harbor Laboratory, Cold Spring Harbor, New York, United States of
America
Abstract
A novel result of the current research is the development and implementation of a unique functional phylogenomicapproach that explores the genomic origins of seed plant diversification. We first use 22,833 sets of orthologs from thenuclear genomes of 101 genera across land plants to reconstruct their phylogenetic relationships. One of the more salientresults is the resolution of some enigmatic relationships in seed plant phylogeny, such as the placement of Gnetales as sisterto the rest of the gymnosperms. In using this novel phylogenomic approach, we were also able to identify overrepresentedfunctional gene ontology categories in genes that provide positive branch support for major nodes prompting newhypotheses for genes associated with the diversification of angiosperms. For example, RNA interference (RNAi) has played asignificant role in the divergence of monocots from other angiosperms, which has experimental support in Arabidopsis andrice. This analysis also implied that the second largest subunit of RNA polymerase IV and V (NRPD2) played a prominent rolein the divergence of gymnosperms. This hypothesis is supported by the lack of 24nt siRNA in conifers, the maternal controlof small RNA in the seeds of flowering plants, and the emergence of double fertilization in angiosperms. Our approach takesadvantage of genomic data to define orthologs, reconstruct relationships, and narrow down candidate genes involved inplant evolution within a phylogenomic view of species’ diversification.
Citation: Lee EK, Cibrian-Jaramillo A, Kolokotronis S-O, Katari MS, Stamatakis A, et al. (2011) A Functional Phylogenomic View of the Seed Plants. PLoS Genet 7(12):e1002411. doi:10.1371/journal.pgen.1002411
Editor: Michael J. Sanderson, University of Arizona, United States of America
Received October 19, 2010; Accepted October 21, 2011; Published December 15, 2011
Copyright: � 2011 Lee et al. This is an open-access article distributed under the terms of the Creative Commons Attribution License, which permits unrestricteduse, distribution, and reproduction in any medium, provided the original author and source are credited.
Funding: This work was supported by National Science Foundation (http://www.nsf.gov) Plant Genome grant nos. IOS-0421604 and IOS-0922738 "Genomics ofComparative Seed Evolution" (to GC, RD, DWS, RAM, WRM), DBI-0445666 (to GC), EF-0629817 and DEB-082762 (to DWS), Dorothy and Lewis B. CullmanPostdoctoral Fellowship (to AC-J), and Cullman Program in Molecular Systematics institutional support at AMNH (to RD and S-OK) and at NYBG (to DWS and DLP).The funders had no role in study design, data collection and analysis, decision to publish, or preparation of the manuscript.
Competing Interests: The authors have declared that no competing interests exist.
* E-mail: [email protected] (RD); [email protected] (RAM)
¤a Current address: National Laboratory of Genomics for Biodiversity (LANGEBIO), Irapuato, Guanajuato, Mexico¤b Current address: Department of Biological Sciences, Barnard College, Columbia University, New York, New York, United States of America¤c Current address: Heidelberg Institute for Theoretical Studies, Heidelberg, Germany
. These authors contributed equally to this work.
Introduction
Attempts to clearly resolve the relationships among major seed
plant groups using nuclear gene sequences have been hampered
by the small number of completely sequenced genomes, the
scarcity of ESTs for certain plant groups, and the lack of
automated tools that can assemble and analyze large phyloge-
nomic data sets. Existing phylogenetic hypotheses from molecular
data, are often disputed due to the small sample of genes and/or
taxa used in the analyses, regardless of the degree of support.
Various conflicting topologies for the five basic seed plant groups
have been obtained over time [1,2]. Plant molecular phylogenetics
has long relied on plastid genomes and only a few nuclear markers
to infer relationships [1,3–9]. Recently, progress has been made in
generating plastid genome-based plant phylogenies [3,10–16], but
nuclear genome-scale analyses of plants have only recently started
appearing in the literature [17–19]. The incorporation of nuclear
phylogenomic information in plant phylogenetics would accom-
plish two important goals. First, the phylogenetic patterns
discovered using nuclear genomic information could be used to
corroborate the many well-supported plastid relationships, and to
shed light on those relationships that are still at odds. Second,
nuclear phylogenomic information can be used to derive new
hypotheses for the function of plant genes that are relevant to
major divergence events in plant evolution. In this study, we use
phylogenetic information (emergent measures of phylogenetic
support [20]) as the platform to identify candidate genes that may
have played a role in plant adaptation. We first identify sets of
orthologs from genomic sequences using a phylogenetic context
[21]. We next use these orthologs to construct a total-evidence
phylogeny and examine the distribution of their support metrics
per node [20]. We then assess the statistical significance of Gene
Ontology (GO) categories for gene lists that provide positive
phylogenetic support to a node with functional processes of
interest (e.g. seed development) [22]. The main premise of this
approach is that genes (partitions) that are in agreement or in
PLoS Genetics | www.plosgenetics.org 1 December 2011 | Volume 7 | Issue 12 | e1002411

conflict with the overall evolutionary history of a particular node in
a phylogeny, can be detected and used to derive hypotheses for the
genes and biological processes potentially responsible for some of
the more interesting organismal differences among the taxa in a
phylogenetic analysis. We thus employ a phylogenomic approach
to postulate hypotheses of gene function distributions and
evolutionary mechanisms. These hypotheses can be validated
experimentally in follow-up studies, focusing the effort of finding
candidate genes and planning downstream experiments on those
candidates based on a phylogenomic context. This functional
phylogenomic approach is fundamentally different than classical
phylogenetic analysis methods and also from current functional
genomic methods that mine genomic information without
incorporating a phylogenetic context in their search for both
orthologs and candidate genes of functional importance. The
present study is also a step toward generating an automated
phylogenomic method for the entire nuclear component of plant
genomes. Here, we use this approach to begin exploring and
deriving hypotheses for the evolutionary mechanisms that underlie
plant adaptation and diversification, as exemplified by the
explosion of biodiversity within the seed plants, underlying
Darwin’s abominable mystery on the sudden appearance and
rapid diversification of flowering seed plants, but also on the
persistence of the gymnosperms over evolutionary time.
Results
Inferred seed plant phylogenyWe used OrthologID (OID) [21] – a program for automated,
parsimony tree-based orthology determination, to identify 22,833
sets of orthologs from 150 plant species (see Materials and
Methods for a description of the extended OID pipeline). These
plant species, belonging to 101 different genera, represent a broad
taxonomic range of angiosperms and extant gymnosperms. To
reduce the size of the dataset for maximum likelihood (ML)
analysis, and to remove partitions with the most missing data, we
also constructed a matrix by only including genes with at least
30% representation across all genera. In this .30%-matrix,
multiple taxa belonging to the same genus are collapsed into a
single taxon. The average number of genera represented in each
gene partition is 41 (40.6%) in this matrix. The cumulative
distribution of gene partitions by taxon representation is shown in
Figure S2. We performed maximum parsimony (MP) analysis on
both matrices (MP-full and MP-30), as well as maximum
likelihood analysis on the .30%-matrix (ML-30) (see Text S1).
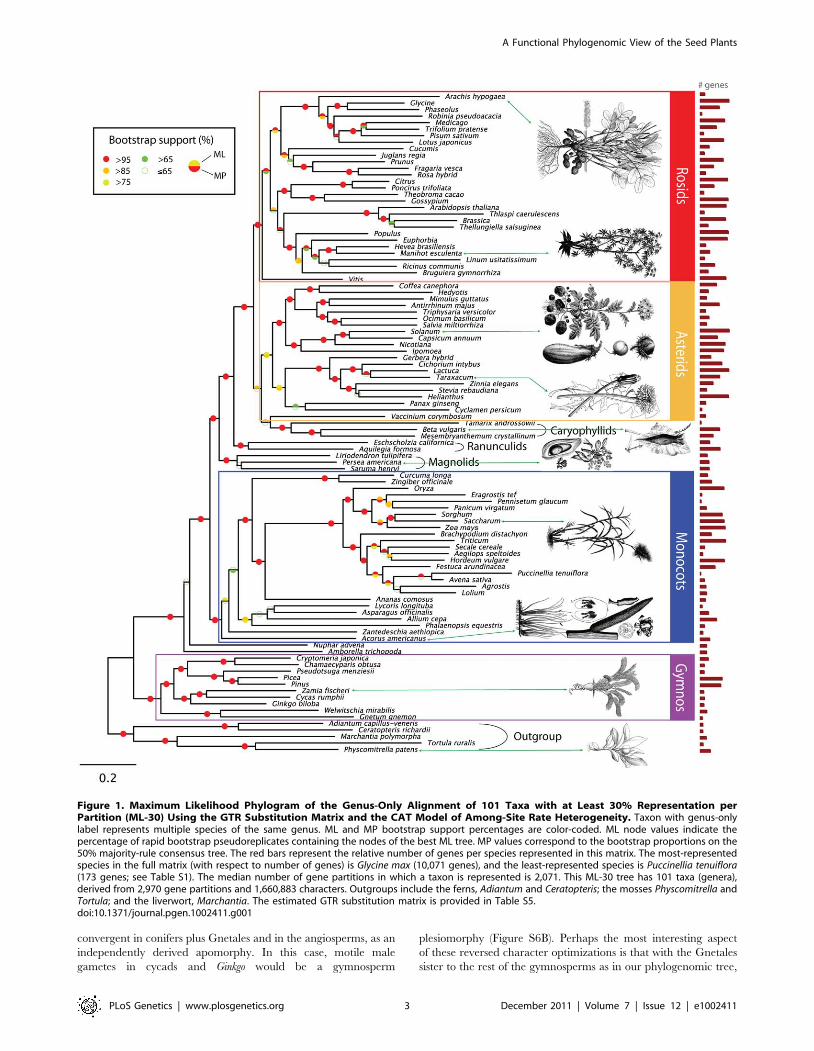
Figure 1 shows the phylogenetic tree generated from the ML-30
analysis.
The basic topologies for all three trees of the seed plants (MP-
full, Figure S3; MP-30, Figure S4; and ML-30) are essentially
identical. Node support based on bootstrap methods yielded a
robust inferred phylogenetic tree overall. All three of our analyses
(MP-full, MP-30, and ML-30) corroborate the same monophyletic
groups of seed plants, as revealed in all previous morphological
analyses and most molecular analyses, namely the seed plants, the
cycads, the conifers, the gnetophytes, and the angiosperms.
Moreover, all of our analyses support the gymnosperms as a
monophyletic group (bootstrap = 100%). This is congruent with
all comparable molecular data sets to date [1,5,11,23], and in
contrast to most morphological analyses, which retrieve gymno-
sperms as paraphyletic [7,24,25]. The differences between
molecular-based topologies of the gymnosperms mainly involve
the placement of the gnetophytes, that is with the gnetophytes as
sister to the conifers [5], nested in conifers [1,11,13,16], as sister to
all other gymnosperms [23], or sister to all other seed plants
[13,26]. The position of the gnetophytes among seed plants, is
indeed one of the most interesting unresolved issues in plant
systematics, as reviewed in [2]. Our inferred genome-wide
phylogeny (bootstrap = 100%) supports the gnetophytes as basal
extant gymnosperms. This finding supports earlier hypotheses
retrieved from individual gene trees such as rpoC1 and rbcL, as well
as the non-coding regions of the inverted repeat representing the
plastome [27–29], and from phytochrome genes [23,30], AGA-
MOUS-like genes [31,32], and FLORICAULA/LEAFY [33] repre-
senting the nuclear genome.
The topology of this phylogenomic view of the seed plants with
a pectinate (i.e. maximally asymmetric, e.g. [34]) series of
angiosperms, Gnetales, cycads + Ginkgo, and conifers has a impact
on the interpretation of plant evolutionary changes, as characters
are optimized in different ways. For example, in the previous view
that cycads are sister to the rest of the gymnosperms, with ferns as
sister to both flowering plants and gymnosperms, then the
comparison is that angiosperms carpels are megasporophylls
(seed-bearing sporophylls), and the angiosperm gynoecium is a
simple strobilus (reproductive organ). By contrast, our phyloge-
nomic view of the seed plants, Gnetales are sister to the rest of the
gymnosperms with ferns as sister to all seed plants, and in this view
each angiosperm carpel bearing ovules can be most parsimoni-
ously interpreted as a simple strobilus. In this phylogenomic view,
the angiosperm gynoecium would now be interpreted as a
compound strobilus, with each carpel representing a bract
enclosing an axillant ovule-bearing axis (Figure S6A). Another
example of the impact of optimization is found with motile male
gametes. Motile male gametes characterize all of the non-seed
plant out-groups, and within seed plants are found only in cycads
and Ginkgo. In our phylogenomic topology, motile male gametes
would be independently and uniquely evolved (apomorphic) in
cycads plus Ginkgo, and loss of motile male gametes in Gnetales
and conifers would be ancestral in the gymnosperms (plesio-
morphic). In contrast, if cycads were sister to the rest of the
gymnosperms, the loss of motile male gametes would be
Author Summary
Understanding the genetic and genomic basis of plantdiversification has been a major goal of evolutionarybiologists since Darwin first pondered his ‘‘abominablemystery,’’ the rapid diversification of the angiosperms inthe fossil record. We develop and deploy a functionalphylogenomic approach that helps identify genes andbiological processes putatively involved in species diver-sification. We assembled a matrix of 22,833 orthologs from150 species to reconstruct seed plant phylogeneticrelationships and to identify gene sets with a uniqueevolutionary signal. Our analysis of overrepresentedbiological processes in these sets narrowed down possiblegenetic mechanisms underlying plant adaptation anddiversification. The phylogenetic relationships we uncov-ered support the hypothesis that gnetophytes are closelyrelated to the rest of the gymnosperms at the base of theliving seed plants. We also found that genes involvedin post-transcriptional silencing via RNA interference(RNAi)—increasingly important in understanding plantevolution—are significantly represented early in angio-sperm and gymnosperm divergence, with an apparentloss of specific classes of small interfering RNAs (siRNA) ingymnosperms. Our functional phylogenomic approachcan be applied to any taxa with available sequences toenhance our knowledge of the evolutionary processesunderlying biodiversity in general.
A Functional Phylogenomic View of the Seed Plants
PLoS Genetics | www.plosgenetics.org 2 December 2011 | Volume 7 | Issue 12 | e1002411
convergent in conifers plus Gnetales and in the angiosperms, as an
independently derived apomorphy. In this case, motile male
gametes in cycads and Ginkgo would be a gymnosperm
plesiomorphy (Figure S6B). Perhaps the most interesting aspect
of these reversed character optimizations is that with the Gnetales
sister to the rest of the gymnosperms as in our phylogenomic tree,
Figure 1. Maximum Likelihood Phylogram of the Genus-Only Alignment of 101 Taxa with at Least 30% Representation perPartition (ML-30) Using the GTR Substitution Matrix and the CAT Model of Among-Site Rate Heterogeneity. Taxon with genus-onlylabel represents multiple species of the same genus. ML and MP bootstrap support percentages are color-coded. ML node values indicate thepercentage of rapid bootstrap pseudoreplicates containing the nodes of the best ML tree. MP values correspond to the bootstrap proportions on the50% majority-rule consensus tree. The red bars represent the relative number of genes per species represented in this matrix. The most-representedspecies in the full matrix (with respect to number of genes) is Glycine max (10,071 genes), and the least-represented species is Puccinellia tenuiflora(173 genes; see Table S1). The median number of gene partitions in which a taxon is represented is 2,071. This ML-30 tree has 101 taxa (genera),derived from 2,970 gene partitions and 1,660,883 characters. Outgroups include the ferns, Adiantum and Ceratopteris; the mosses Physcomitrella andTortula; and the liverwort, Marchantia. The estimated GTR substitution matrix is provided in Table S5.doi:10.1371/journal.pgen.1002411.g001
A Functional Phylogenomic View of the Seed Plants
PLoS Genetics | www.plosgenetics.org 3 December 2011 | Volume 7 | Issue 12 | e1002411

the interpretation of character evolution is the same as in the
Anthophyte hypothesis, where Gnetales is sister to angiosperms,
and cycads are sister to all other seed plants. The optimization of
motile male gametes of cycads and Ginkgo in our phylogenomic-
based topology is thus equivalent to the optimization of characters
required to explain the Gnetales as nested within the conifers. In
this case, the reinsertion of the inverted repeat in the plastid
genome of the Gnetales would be required after its loss in all of the
conifers [11].
It is noteworthy that in this phylogenomic view of the seed
plants, the basic topology of the angiosperm tree used by the
Angiosperm Phylogeny Group (APG II, III) [35,36] is supported
with only minor changes (Figure S5). We retrieve the same
topology of major groups on the pectinate backbone, starting with
Amborella followed by Nuphar, magnoliids, ranunculids, caryophyl-
lids, rosids, and asterids. The few discrepant nodes between our
phylogenomic trees generated using different approaches (e.g. MP
and ML), and between our tree and other major phylogenies, have
low support, and are likely the consequence of ambiguous
orthology statements due to missing data. For instance, Vaccinium
is placed with low support (,65%) either sister to the caryophyllids
in our ML-30 tree (Figure 1), or within the asterids (with
caryophyllids as sister to both rosids and asterids) in the MP-30
tree (Figure S4), which is congruent with APG III (with
caryophyllids as sister to asterids). Resolution of either hypothesis
will probably depend on sampling the Cornales, of which core
taxa have been placed within the asterids, and as sister to Ericales
containing Vaccinium [35,37]. Similarly, increased sampling of the
alismatids and aroids will help confirm the position of Acorus within
the angiosperms. Our findings of Acorus as sister to all other
monocots, supports most analyses conducted with single and
multiple gene trees [38–41], except for those that include atpA,
which in some instances, place Acorus within the Alismatales aroids
plus alismatids [42–44]. Within the rosids, the topology of MP-30
departs from that of APG III, by placing the Sapindales (Citrus and
relatives) with the rosids I, versus rosids II in APG III and in our
MP-full and ML-30 analyses. Our phylogenomic analysis identifies
these controversial nodes and points to the taxa that need further
sampling.
A controversial topology that is present and well supported
(bootstrap = 100%) in all our of phylogenomic trees is the
placement of the monocots between Nuphar and magnoliids. The
monophyly and placement of the magnoliids has been enigmatic
for some time, although recent work has suggested some
resolution. The position of the monocots with respect to
magnoliids has also been controversial. The three principal
competing hypotheses for the position of the magnoliids are as
sister to the eudicot lineage [45–47], as sister to the monocots plus
the eudicots [38,39], and as sister to the monocots [41–43]. By
contrast, our phylogenomic tree firmly places the magnoliids as
sister to the eudicots, and the monocots as sister to the magnoliids
plus the eudicots, both with high support (100%). In fact, bootstrap
support percentages along the backbone (the pectinate portion) of
the angiosperms, also show that overall, our phylogenomic analysis
provides a robust topology for this important group, based on a
broad sampling of genomic and EST data.
Identifying candidate genes of functional significancewithin a phylogenomic framework
With the large number of genes in our phylogenomic matrix
covering every Gene Ontology (GO) category for plants [48] (see
Table S2), we are able to derive hypotheses for the functional
evolution of genes in a phylogenomic context, by analyzing gene
partitions that lend evidence of support at the major nodes on the
tree [49]. Currently, one of the most widely used methods in
testing for selection in phylogenomics, such as dN/dS [50], relies
mostly on statistical methods of detection of natural selection.
Partitioned phylogenetic support detects any positive or negative
support that a gene or category of genes has on any given node on
a phylogenetic tree. We propose that genes with positive
partitioned support at nodes are a broader category of candidate
genes for exploring function that would include genes evolving not
only under positive Darwinian selection, but also under stochastic
processes and even purifying selection. Once these candidate gene
lists that provide positive branch support are derived, we can then
examine them using positive selection scans to determine the
functional categories of genes that are under selective pressure.
Instead of requiring overwhelming statistical evidence of positive
selection, our method identifies significant evolutionary trends by
quantifying both phylogenetic congruence and incongruence, thus
detecting potentially important genes that might be evolving
neutrally or under negative selection. In this way, phylogenetic
incongruence between a functional class of genes (e.g. RNA
silencing genes) and the organismal phylogeny, would suggest that
this given gene has experienced a unique evolutionary history
relative to that of the organisms per se. Detection of such sequences
is given by character information, meaning that no previous
knowledge about the gene or gene function is required. Apart from
being an unbiased approach, this method allows for the discovery
of candidate genes with potential evolutionary and functional
relevance, which can then be evaluated for evidence of selection
using downstream validation and standard evolutionary tests
[51,52]. Here we provide a few examples of candidate genes for
such validations.
For this analysis to be computationally feasible, and to exclude
gene partitions with a large amount of missing taxa, while
retaining as many partitions as possible for statistical analysis, we
extracted a 9,787-gene matrix with .10% representation per
partition and performed Partitioned Bremer Support (PBS)
analysis [20]. This metric gives a relative measure of positive
support on a gene-by-gene basis for each node. We identified
7,689 gene partitions with positive PBS values at one or more
nodes in the simultaneous analysis tree. Of the 7,000+ genes, 4,803
of them have identifiable Arabidopsis orthologs, which were used to
annotate the partitions with GO and MIPS [53] terms. To assign
significance, we tested each node for overrepresented GO or
MIPS categories within the list of gene partitions with positive
PBS. As with any phylogenetic tree, missing genes as a result of
incomplete EST coverage, and the proportion of matches to GO
and MIPs categories, could shift PBS support. Importantly, the
proportion of overrepresented genes with positive PBS is not just a
numbers game, as it does not correlate with the number of genes
per species in our matrix (e.g. Figure 1 shows Glycine and Phaseolus
with a large EST set vs. Cucumis and Juglans regia, with a moderate
EST set, but highly significant overrepresented genes with positive
PBS). Furthermore, although the proportion of positive PBS varies
within the phylogenomic matrix, it remains high even in nodes
with lower numbers of genes and GO and MIPs terms (Figure S7).
This analysis of genes providing positive branch support at key
nodes in the phylogenomic tree identified 29 overrepresented
GO/MIPS term-node pairs (p,0.01), 87 such pairs (p,0.05), and
138 (p,0.10) (see Table S3 for the complete list and Figure 2 and
Figure 3 for the distribution map of overrepresented GO/MIPS
terms). The significant overrepresentation of genes in these GO/
MIPS terms, points to potential candidate genes involved in
metabolic and developmental traits associated with the evolution
of taxa within these clades. Note that overrepresentation in this
context is unrelated to levels of gene expression, referring instead
A Functional Phylogenomic View of the Seed Plants
PLoS Genetics | www.plosgenetics.org 4 December 2011 | Volume 7 | Issue 12 | e1002411
A Functional Phylogenomic View of the Seed Plants
PLoS Genetics | www.plosgenetics.org 5 December 2011 | Volume 7 | Issue 12 | e1002411

to the overrepresentation of proteins in each functional category
among those with amino acid sequences contributing positive PBS
to gene partitions.
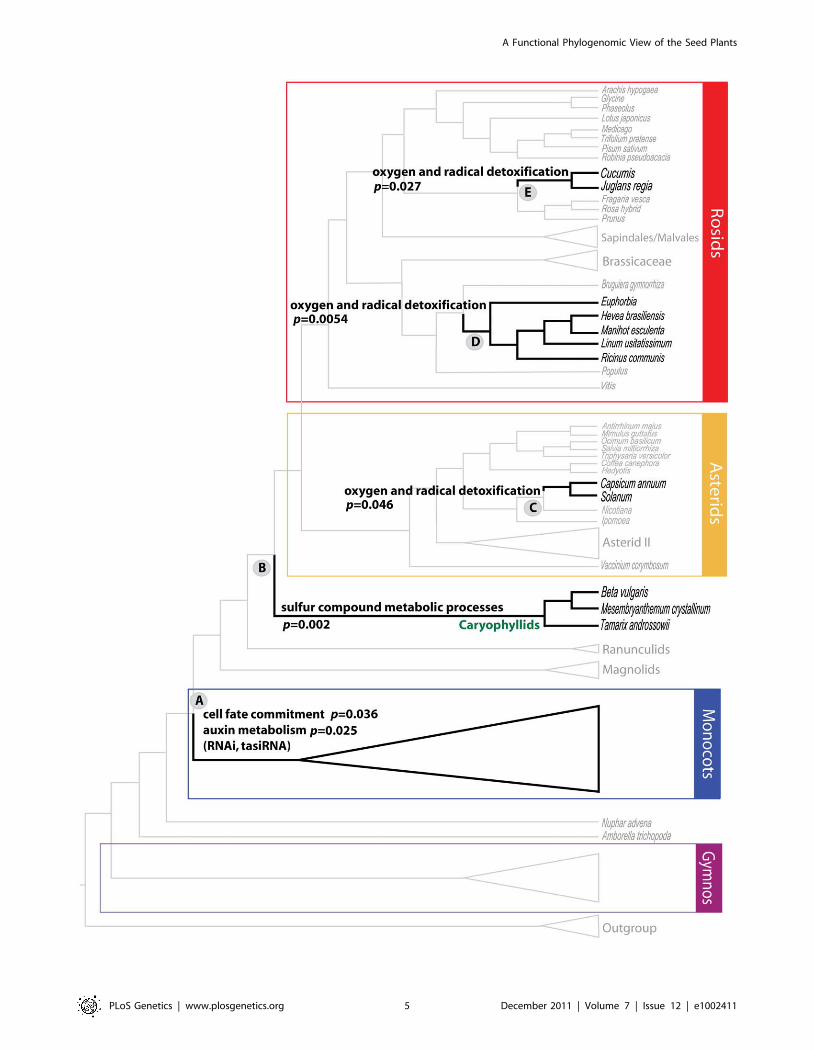
An example of a node with an overrepresentation of genes
involved in a metabolic process is Node 15, which includes the
caryophyllids, members of which include the salt/drought-tolerant
plants Mesembryanthemum and Tamarix. This node shows significant
overrepresentation of genes involved in ‘‘sulfur compound
catabolic processes’’ (p = 0.002), for which experimental data
relates both genes in this GO term (MGL1 and GGT3), to the trait
of drought stress in Arabidopsis [54–56]. The examination of GO
overrepresentation in a phylogenomic framework, confirms
expected patterns of well-characterized genes in some taxa, and
also allows us to identify similar gene functions in atypical
candidates. Genes involved in ‘‘oxygen and radical detoxification’’
were overrepresented in Node 52 (p = 0.046), Node 19
(p = 0.00054), and Node 31 (p = 0.027). Species like tomato
(Solanum lycopersicum) [57] and pepper (Capsicum annuum) [58] in
Node 52, Euphorbia esula and E. tirucalli [58,59] in Node 19, and
walnut (Juglans regia) [60] in Node 31, are well known sources of
detoxifying and antioxidant compounds. The predominance of
glutathione-related genes involved in detoxification [61] in those
clades is not surprising and demonstrates our approach in
principle. The overrepresentation of glutathione peroxidase genes
in other taxa such as melon (Cucumis melo) and cucumber (C. sativus)
in Node 19, is thus worth examining further.
Another example of this functional phylogenomic approach
identified genes belonging to ‘‘cell fate commitment’’ (p = 0.04)
and ‘‘auxin metabolism’’ (p = 0.025) as overrepresented GO terms
among genes with positive PBS at Node A (Figure 2), that defines
all monocots except Acorus. These include three genes that encode
proteins involved in cell fate decision, AGO1, KANADI and
LACHESIS. LACHESIS controls the cell fate within female
gametophytes in Arabidopsis, where mutants have supernumerary
egg cells and are semi-sterile [62]. LACHESIS is a homolog of
yeast PRP4, a kinase that influences mRNA splicing. AGO1 is the
key effector endonuclease for multiple aspects of RNAi, including
cleavage and translational inhibition of target messages via
microRNA and trans-acting short interfering RNA (tasiRNA).
Weak alleles of AGO1 in Arabidopsis have drastic effects on leaf
polarity [63]. KANADI is also a master regulator of leaf polarity,
along with the auxin response factor ARF3 (a target of tasiRNA).
The mRNA export factor homolog SDE5 also contributes positive
PBS to the monocot clade, and is required for trans-acting siRNA
accumulation [64], along with the RNA-dependent RNA
polymerase RDR6, which was found to contribute positive PBS
to the monocot clade in a smaller study of 17 taxa [65]. Mutants in
the tasiRNA pathway disrupt the eponymous monocotyledonous
embryo of rice, which displays radial asymmetry, far more severely
than the symmetric dicotyledonous embryo of Arabidopsis [66],
perhaps because tasiRNA act non-autonomously in Arabidopsis.
Thus, it is hypothesized from this phylogenomic analysis that
RNAi had a significant influence in the divergence of monocots
and magnoliids plus eudicots from the ancestral angiosperm. This
is an exciting hypothesis derived from the functional phylogenomic
analysis of the seed plants, as we are increasingly aware of the
importance of siRNAs and transcriptional gene silencing pathways
of RNAi for plant evolution [67].
In perhaps the most important hypothesis derived from the
phylogenomic approach we describe, the plant-specific RNA
polymerase subunit NRPD2 contributes PBS to several nodes
among lower plants, including conifers and Marchantia/moss, but
especially to gymnosperms as a group, for which there are 21 steps
of support, which is among the highest 2% of all genes with
positive support for the gymnosperm clade. In Arabidopsis, NRPD2
is a subunit of both RNA polymerase IV and RNA polymerase V,
both of which are required for 24nt siRNA biogenesis and for
RNA-directed DNA methylation. Remarkably, 24nt small RNAs,
which correspond to transposons and heterochromatic repeats in
angiosperms, are absent from Pinus contorta, the only gymnosperm
in which they have been examined [68]. They are nonetheless
found in non-seed plants such as Physcomitrella and Selaginella [69].
Our phylogenomic analysis implicates NRPD2 in the loss of 24nt
siRNA from gymnosperms that have very large unmethylated
genomes [70], consistent with a loss of transposon control via
siRNA.
In support of this derived hypothesis, high levels of maternal
24nt siRNA are found in the endosperm of developing Arabidopsis
seeds in which NRPD2 is highly expressed [71]. In angiosperms,
fertilization of both the egg and the central cell nucleus (double
fertilization) lead to embryo and endosperm development,
respectively, while in gymnosperms, the megagametophyte
develops maternally without fertilization [71]. Interestingly,
maternal mutants in Arabidopsis that disrupt this small RNA
pathway are defective in transposon defense and develop
unreduced gametophytes [72], the first step in maternal endo-
sperm formation. We propose therefore that transposon-defense,
mediated by small RNA, is responsible, in part, for the emergence
of novel reproductive strategies within the flowering plants.
Along with NRPD2, a total of 297 genes in the phylogenomic
tree provide PBS for the gymnosperm clade, while 407 genes
provide PBS for the angiosperm clade, but the vast majority of the
remaining ,7,000 genes in this seed plant matrix provide support
for individual nodes in the tree. These candidate genes lay the
ground for new testable hypotheses concerning the evolutionary
changes in function that may be of relevance in the astounding
radiation of flowering plants, potentially underscoring Darwin’s
‘abominable mystery’ of seed plant radiation [73].
In our effort to examine patterns of natural selection across the
seed plants, we used established measures of synonymous (dS) and
nonsynonymous (dN) nucleotide substitution rates – not in a gross
fashion across the whole gene sequence, but rather on a codon-by-
codon basis. The rate ratio dN/dS is a commonly used measure of
selective pressure that has been expanded to incorporate sequence
and codon evolution models, as well as branch rate variation [50].
dS is vulnerable to substitution saturation, and is not reliably
estimated for very divergent taxa, even below the genus level [74].
In this study we are dealing with extant spermatophyte taxa that
diverged near the Devonian–Carboniferous boundary at ca. 350
Ma, with their daughter groups diversifying after the Carbonif-
erous (gymnosperms and conifers), and in the Jurassic in the last
200 million years (Myr) (angiosperms) [75], therefore substitution
saturation is expected at synonymous substitutions. In an attempt
to circumvent dS estimation issues, and thus undefined codon-
specific dN/dS values, we allowed for the non-synonymous
evolutionary rate to vary along the phylogeny, and more
Figure 2. Select Overrepresented GO/MIPS Categories of Genes with Positive PBS at Major Nodes. There are statistically higher numbersof genes belonging to these GO/MIPS categories with positive support for the specific clades, implying that these genes may have special functionalimportance to the evolution of the corresponding clades. Only gene categories mentioned in the main text are shown. For a full list ofoverrepresented categories in each node see Table S3.doi:10.1371/journal.pgen.1002411.g002
A Functional Phylogenomic View of the Seed Plants
PLoS Genetics | www.plosgenetics.org 6 December 2011 | Volume 7 | Issue 12 | e1002411

Figure 3. Distribution Map of Overrepresented GO Terms per Node. Each GO/MIPs category is shown in the upper axis. Color gradientsshow differences in proportions of these genes, with red being the category with the highest counts, light blue the least counts, and black with nomatch to any category. Overrepresentation is estimated on per-node basis. The reference tree is based on the MP-30 phylogenetic tree, and can beused to locate the relative position of a node represented by a heatmap row. The node numbering here corresponds to the node labels in Figure S7.Heat map constructed based on the Arabidopsis genome (source: http://noble.gs.washington.edu/prism – accessed on February 2009).doi:10.1371/journal.pgen.1002411.g003
A Functional Phylogenomic View of the Seed Plants
PLoS Genetics | www.plosgenetics.org 7 December 2011 | Volume 7 | Issue 12 | e1002411

specifically, in the two subtrees united by the node where markedly
high positive PBS scores where detected. We selected genus
Euphorbia (angiosperms, eudicots, rosids, Malpighiales) as a case
study. This is one of the most taxonomically rich plant genera
likely encompassing ,3000 species (http://www.plantsystematics.
org) [76], that occupies habitats distributed worldwide and displays
a marked degree of morphological and anatomical variation. The
pantropical and very speciose family Euphorbiaceae (,6300
species [76], 245 genera [77]) may have diverged from other
Malpighiales in the Lower Cretaceous Aptian age around 119.4–
101.1 Myr before present), but diversification within the family is
much more recent, e.g. within Acalyphoideae within the last ,70
Myr [78]. Note that Acalyphoideae is sister to the rest of the
Euphorbiaceae including Euphorbia (see Figures 3 and 4 in [79])
that is itself nested inside Euphorbiaceae with an origin estimated
at ,38 Myr ago with most of its diversification having occurred in
the interval 30–10 Myr before present (see Figure S1G in [80]).
Euphorbia exhibited high positive PBS scores for 13 proteins
involved in oxygen and radical detoxification (MIPS functional
category 32.07.07). Codon-wise estimates of synonymous rates
showed a highly positively skewed distribution within each gene,
with discrepant median and mean values (dS across genes: median
range = 2.1–3.8, mean range = 89–685, skewness = 3.31–11.05),
thus reinforcing our hesitation to use dS and subsequently dN/dS
(Table S6). Gene-wide estimates of dN/dS [81] were well below 1.0
showing no evidence of the action of positive selection with rate
ratio values ranging from 0.138 to 0.41 (Table S6). Contrasting dN
between the subtree leading to Euphorbia and the ‘‘background’’
subtree, we found statistical evidence (p,0.05) of non-synonymous
rate variation in 3 to 25 codons per gene. More specifically, we
detected a general trend of non-synonymous rate acceleration in
the subtree containing Euphorbia. A more complex picture became
apparent in the case of 2 of those 13 genes (At1g76080 and
At1g76080), where around half of the codons that showed
significant evidence of dN rate change decelerated in the
Euphorbia-containing clade. Detailed results are provided in Table
S6.
Discussion
Using a phylogenetic matrix with broad taxonomic sampling
and gene representation, we are able to provide support for some
of the more controversial topologies within plants, and in
particular within the various hypotheses of gymnosperm evolution.
From a phylogenomic perspective, we suggest hypotheses on genes
and their evolutionary processes might be related to patterns in
plant diversification. By focusing on the clade-specific variation of
phylogenetic characters in a multi-gene matrix, we can determine
the effect of individual genes or groups of genes within a particular
gene category, on support metrics and their statistical correlation
with functional processes of interest (such as seed development and
gene silencing). Specifically, we can pinpoint the amino acid
sequences that support individual branches in the tree. This
enables us to investigate the genetic mechanisms that underlie the
rapid radiation of the angiosperms and the persistence of the
gymnosperms on a subset of candidate genes in follow-up studies.
Our tree-based method, combined with maximum likelihood
methods of non-synonymous and synonymous evolutionary rate
variation, isolated 14 genes involved in oxygen and radical
detoxification from one of the most speciose plant genera,
exhibiting evidence for changes in selective pressure through
non-synonymous rate heterogeneity. Most importantly, our
functional phylogenomic method has shed light on the evolution
of very large gymnosperm genomes, and on maternal endosperm
development via the role of small interfering RNA in transposon
defense and in asexual development.
In all, we demonstrate how a functional phylogenomic
approach can be used to postulate hypotheses of gene function
distributions and evolutionary mechanisms. Our framework sets
the groundwork for future molecular biology, ecological genomics,
and evolutionary development research, which will refine the
hypothesized role of the genes we have identified herein.
Furthermore, with the increasing amount of genomic sequence
data available, we expect to see increased resolution of the seed
plant tree, and more genes of importance to the evolution of major
clades to be discovered using the phylogenomic methodology
described herein.
Materials and Methods
Sequences and orthologsSequences were collected from the gene sets of 5 completely
sequenced plant genomes and ESTs of 145 other plant species
with at least 2,000 unigenes. The complete genomes include
Arabidopsis thaliana (TAIR), Oryza sativa (JCVI), Populus trichocarpa
(JGI), Vitis vinifera (Genoscope), and Physcomitrella patens (JGI).
Unigenes were obtained from the TIGR Plant Transcript
Assemblies (http://plantta.jcvi.org).
Orthology was determined using an extended OrthologID
pipeline (Figure S1). The original OrthologID pipeline [21] only
utilizes complete genomes in the generation of ‘‘guide trees’’ which
are used to classify ESTs and determine their orthologs. However,
the limited number of completely sequenced plant genomes to
date would hamper the accuracy of EST placement when large
numbers of ESTs from diverse plant species are classified into gene
family trees with limited taxonomic representation. To alleviate
this problem, we also included 17 extra species (ingroup and
outgroup) with high number of ESTs in the generation of ‘‘guide
trees’’. These extra species represent a full spectrum of plant
lineages and include: Adiantum capillus-veneris, Aquilegia formosa,
Amborella trichopoda, Ceratopteris richardii, Cichorium intybus, Coffea
canephora, Gossypium hirsutum, Liriodendron tulipifera, Marchantia poly-
morpha, Medicago truncatula, Nuphar advena, Pinus taeda, Saruma henryi,
Solanum tuberosum, Welwitschia mirabilis, Zamia fischeri, and Zingiber
officinale. As in the original OrthologID pipeline, gene families were
clustered using a 1e-20 BLAST E-value cutoff, and were aligned
with MAFFT [82] using three different sets of parameters with
ambiguous regions culled. OrthologID generated guide trees from
these gene families using parsimony. ESTs from all other species
were then classified into gene families using the following stepwise
shortest-tree method extrapolated from OrthologID: Each EST
was identified with a gene family using BLAST. The complete set
of ESTs that belong to a gene family were sorted in decreasing
order of similarity according to their highest BLAST e-values
against gene family members in the guide tree. Each EST was then
inserted into the fixed guide tree in the aforementioned order. At
every iteration the tree with the shortest length (most parsimoni-
ous) with respect to the guide tree is chosen. Finally, we
determined sets of orthologs from the gene family tree by
extracting the largest non-overlapping subsets of genes that are
orthologous according to the topology. In cases where there is a 1-
to-many or many-to-many ortholog relationship, each of the
multiple orthologs is treated as equal and only a randomly selected
one from each species is included in the matrix. In the .30%-
matrix, multiple species of the same genus are represented by a
single taxon. For each gene partition in this matrix, the gene
sequence from the most ancestral of the species belonging to the
A Functional Phylogenomic View of the Seed Plants
PLoS Genetics | www.plosgenetics.org 8 December 2011 | Volume 7 | Issue 12 | e1002411
same genus, as identified by the MP-full tree, is chosen to be the
representative for that genus (taxon).
Phylogenetic analysisWe assembled an alignment phylogenetic matrix of amino acid
residues using the ortholog sets determined above and partitioned
by gene. Only genes with at least four taxa present were included,
resulting in a matrix with 22,833 partitions and 10,768,363
characters. Parsimony analysis was performed on the full
alignment matrix and the .30%-representation genus alignment
matrix using PAUP* v4b10 [83] and TNT [84]. The most efficient
parsimony tree search strategy used the tree fusion method [85]:
100 jackknife resamplings (proportion = 0.3679) were searched
with subtree pruning-regrafting holding two trees per resampling.
The collected jackknife trees were then submitted to 100 rounds of
tree fusion. Parsimony ratchet [86] also resulted in the same
shortest trees (Figures S3 and S4). Node support was evaluated
with 2,000 bootstrap pseudoreplicates and summarized on a 50%
majority-rule consensus tree. Partitioned Bremer support (PBS)
analysis was done on a submatrix that included only gene
partitions with at least 10% taxon-representation. We use PBS to
assess the direction of support (positive, negative, or neutral) of a
particular gene to the various branches or nodes in a phylogeny.
PBS is defined as follows: for a particular combined data set, a
particular node (branch), and a particular data partition, PBS is
the minimum number of character steps for that partition on the
shortest topologies for the combined data set that do not contain
that node, minus the minimum number of character steps for that
partition on the shortest topologies for the combined data set that
do contain that node [20]. Values for these metrics can be positive,
zero or negative, and indicate the direction of support for the
overall concatenated hypothesis: a positive PBS value indicates
that the partition provides support for the node. Negative PBS
means that the length of partition is shorter on an alternative tree
(i.e. that partition provides contradictory evidence). The sum of
PBS values for each data partition always equals Bremer Support
for combined data [87]. We used TreeRot v3 [88] to generate PBS
values for each partition-node pair.
We performed maximum likelihood (ML) inference of phylog-
eny on the .30% representation genus matrix using the fine-
grained parallel Pthreads (POSIX Threads Library) [89] and MPI
(Message Passing Interface) [90,91] implementations of the 2009
development version of RAxML [92]. Our analysis represents the
largest ML-based phylogenetic inference with respect to main
memory requirements (89.2 GB) conducted to date. We employed
both the JTT substitution matrix [93] with empirical amino acid
residue frequencies (F), and the general time-reversible (GTR)
substitution matrix [94] estimated directly from the genus-only
alignment (Table S5). Both amino acid substitution models yielded
the same overall topology. The JTT+F model was selected as the
best-fit model based on its likelihood score among 22 models
overall (11 with fixed residue frequencies and 11 with empirical
residue frequencies calculated from the data in hand). We
investigated the effect of the starting topology on the ML tree
search and determined the best-scoring ML tree by employing ten
random and ten randomized stepwise-addition MP trees in order
to assess convergence to the final best ML topology, as well as the
best single MP tree produced in our parsimony analysis. The way
among-site rate heterogeneity was modeled had an impact on the
final likelihood score; the CAT approximation model [95] with 25
per-site rate categories produced a better likelihood score than the
C-distributed rate heterogeneity model with four discrete rates
[96] in all cases where MP starting trees were used, while the
GAMMA model performed better in 60% of the inferences when
random starting trees were used (Table S4). Using the MP tree as a
starting tree produced better likelihood scores for both rate
heterogeneity models in conjunction with the GTR substitution
model (logLikCAT = –35,802,562; logLikGAMMA = –35,802,416)
(Table S4). Node support was quantified by means of 223 rapid
non-parametric bootstrap pseudoreplicates (RBS) [97]. In order to
determine if we conducted a sufficient number of RBS replicates
we applied the novel bootstrap convergence test [98] implemented
in RAxML a posteriori to our collection of 223 RBS trees. The
Weighted and Frequency Criteria (WC and FC, respectively) [98]
suggested that more than 74 and 122 replicates, respectively,
would not induce significant changes on node support. Unlike
majority-rule consensus trees, these support values indicate the
percentage of pseudoreplicates in which the nodes of the best ML
tree are present. Additional information on the ML analysis can be
found in Text S1.
Gene Ontology analysisIn order to functionally characterize the genes that are
providing positive support to the phylogenetic tree, we identified
the Arabidopsis orthologs of gene partitions with positive PBS at
each node and determined GO [99] and MIPS [100] terms that
are statistically overrepresented at each node. The analysis was
performed using the BioMaps tool [101] available on VirtualPlant
(http://www.virtualplant.org) with the hypergeometric statistics
using the union of genes with positive PBS at all nodes as the
background population, with a correction for multiple hypothesis
testing. Terms with a p-value less than 0.05 were considered
statistically significant. The Gene Ontology version of 31 May
2008 and the MIPS Functional Catalogue (FunCat) database
version of 27 May 2008 were used. Given that we only include
gene partitions with positive PBS in our functional GO term
analysis, but do not use the actual PBS value in our statistical
analysis, the use of a randomly selected ortholog in a gene
partition in the case of multiple co-orthologs will likely have no
effect on our results, except for the cases where the PBS values are
very close to zero. In those scenarios, using a different co-ortholog
may cause the PBS value to change from positive to non-positive,
or vice versa, and therefore be excluded or included in the GO
analysis. However, in a very large dataset, we expect the
randomness to have a cancelling effect when we look at high-
level GO categories that include many genes. Similarly, nodes with
low support in our guide trees may affect orthology determination
and subsequent GO term analysis. However, we expect the effect
to be minimal due to our large sample size.
Selection analysisThe extent of the pressure of natural selection was measured by
estimating the ratio of the rate of nonsynonymous substitutions
(dN) to the synonymous substitution rate (dS). A dN/dS rate value
near one indicates neutral evolution, while deviations exceeding
one are suggestive of positive selection, and positive values below
one are considered to be evidence of purifying or negative
selection as a result of strong structural or functional constraints at
the protein level [102]. Functional protein-encoding genes tend to
be subject to negative selection across their codons [103], therefore
when only a few codons are positively selected [104] the measure
of natural selection is averaged across all codons as a gene-wide
dN/dS rate ratio. Our inference of episodic instances of positive
selection becomes more powerful if, instead of averaging, we allow
for dN/dS rate ratios to vary along the sequence alignment on a
per-codon basis and across the phylogenetic tree [105,106]. For
this reason we estimated dN, dS, and dN/dS in a maximum
likelihood framework as implemented in the latest development
A Functional Phylogenomic View of the Seed Plants
PLoS Genetics | www.plosgenetics.org 9 December 2011 | Volume 7 | Issue 12 | e1002411

build of HyPhy v2.0 [107] (http://www.hyphy.org). Coding
sequence evolution was modeled using the generalized Muse–
Gaut (MG94) [108] model crossed with the Hasegawa–Kishino–
Yano (HKY85) [109] nucleotide substitution model. The selective
pressure at each codon site was quantified using the fixed effects
likelihood (FEL) method [110] that estimates separately dN and dS
rates for each codon and subsequently contrasts them through a
likelihood ratio test (LRT). So as to avoid unpredictably biased
dN/dS results because of saturation of the synonymous substitution
rate dS across such a deep evolutionary timescale examined here,
we chose to compare the variation of nonsynonymous rate dN
along the phylogeny alongside gene-wide dN/dS estimates [81].
We selected a set of genes whose corresponding amino acid
sequences exhibited strong, positive PBS (PBS.10) and belonged
to the same MIPS term, such as 13 genes involved in oxygen and
radical detoxification supporting consistently the node leading to
the genus Euphorbia (Arabidopsis gene symbols: At1g65820,
At1g76080, At2g47730, At1g64500, At3g54960, At3g15360,
At4g33040, At1g20620, At4g31870, At1g19570, At3g27820,
At5g23310, At2g31570). By allowing dN to vary in the two
subsequent subtrees (Euphorbia-containing clade vs. the rest of the
tree), we discounted possible dS biases and examined whether
there is statistical evidence through a LRT for a change in
nonsynonymous rates.
ComputingWe performed maximum parsimony (MP) and Bremer support
analysis on a 64-node Linux cluster at NYU. MP bootstrap
analysis was performed on the 2,000-node BlueHelix HPCC
facility at CSHL. In order to analyze this challenging dataset
under maximum likelihood (ML) we used several clusters, multi-
core nodes, and supercomputers: the Woodcrest Cluster at the
Regionales Rechenzentrum Erlangen in Germany (868 Intel
Woodcrest cores, Infiniband interconnect), the Infiniband Cluster
at the Technical University of Munich (128 AMD Opteron cores,
Infiniband interconnect), the AMD Barcelona multi-core nodes at
the Swiss Federal Institute of Technology in Lausanne (2 16-core
AMD Barcelona nodes), and the SGI ALTIX 4700 supercom-
puter at the Leibniz Rechenzentrum in Munich (8192 Intel
Itanium cores, custom interconnect). The selection ML analysis
was carried out on an Apple Mac Pro 12-core with Intel Xeon
2.66 GHz processors and 8 GB of RAM (1333 MHz DDR3)
running 20 processes for each inference.
The complete phylogenomic matrix and trees are available at
the BIGPLANT website (http://nypg.bio.nyu.edu).
Supporting Information
Figure S1 Extended OrthologID pipeline. (A) Complete ge-
nomes and a selected sets of species with large number of ESTs are
clustered into gene families. These families are aligned and
phylogenetic trees created. Orthologs are determined according to
the phylogenies of these gene families. (B) Sets of orthologs are
determined from a gene family tree in the following manner: as we
move up from the taxa towards the root of the tree, sets of genes
are gathered at each node, until the sets of species of two
descendent nodes overlap. This indicated we encounter a
duplication event, in which case we output the two sets of
orthologs separately as they are not orthologous to each other. In
the figure, A, B, and C are species. Two sets of orthologs are
identified: {A1, B1, C1} and {A2, A3, B2, C2}.
(EPS)
Figure S2 Cumulative distribution of gene partitions by taxon
density in the .30% matrix. The rate of increase in gene
partitions decreases exponentially with the number of taxa
represented.
(EPS)
Figure S3 Maximum parsimony simultaneous analysis tree of
150 taxa and 22,833 genes (MP-full). Support values are based on
2,000 bootstrap pseudoreplicates.
(EPS)
Figure S4 Maximum parsimony simultaneous analysis tree of
the genus-only matrix with 101 taxa and at least 30%
representation per partition (MP-30). Support values are based
on 2,000 bootstrap pseudo-replicates. Nodes with overrepresented
GO/MIPS terms have numeric labels that match the node
numbers in Table S3.
(EPS)
Figure S5 Our ML-30 tree is in broad agreement with the APG
III tree. Relationships among major clades are identical, with the
main exception of the magnoliids as shown here.
(EPS)
Figure S6 Impact on character optimization due to different
topologies. Depending on the topology, a single character can be
interpreted as an apomorphy in one group and a plesiomorphy in
another, or a result of convergence and independently derived
apomorphies. (A) Simple and compound strobilus. Photos of cycad
megasporophylls (right), Liriodendrum tulipifera (tulip) flower (upper
left) and Welwitschia mirabilis seed cones (lower left) illustrate seed-
bearing sporophylls, a gynoecium and ovulate strobili respectively.
(B) Absence and presence of motile sperm. Photo of motile
spermatozoid of Zamia pumila is shown.
(EPS)
Figure S7 Proportion of the number of genes with a positive
PBS (PPBS) from the total of genes per GO and MIPs terms. In (A)
all nodes in our tree, and (B) nodes highlighted in Figure 2 (GO
and MIPs terms are combined), shown here is Euphorbia and sister
taxa 19; (Cucumis/Juglans regia) 31; (Capsicum annum/Solanum) 52;
(Nicotiana (Capsicum annum/Solanum) 53; the split of the Caryophil-
lids 65; the split of Acorus 94; and the Monocots clade 95.
(EPS)
Table S1 List of 150 plant species, sequence sources, and the
number of genes represented in the full matrix.
(DOC)
Table S2 Number of genes with identifiable Arabidopsis orthologs
in the full matrix for each GO Slim category. Each gene may
belong to more than one category.
(DOC)
Table S3 Complete list of overrepresented GO/MIPS terms on
the MP-30 tree. Nodes are numbered as in Figure S4.
(DOC)
Table S4 Log-likelihood scores for inferences based on the CAT
and GAMMA rate heterogeneity models from different starting
trees under the GTR substitution matrix. Inferences that yielded
better likelihood scores in CAT-GAMMA comparisons are shaded
for clarity.
(DOC)
Table S5 GreenREV – a dedicated amino acid general time-
reversible (GTR) substitution matrix estimated from our dataset.
Rectangular symmetric GTR substitution rate matrix, where
amino acids are ordered alphabetically according to their three-
letter code. The bottom line contains the empirical amino acid
frequencies in the same order. This can be used as a user-defined
A Functional Phylogenomic View of the Seed Plants
PLoS Genetics | www.plosgenetics.org 10 December 2011 | Volume 7 | Issue 12 | e1002411

amino acid substitution matrix in RAxML using the -P option. See
file GreenREV.txt.
(TXT)
Table S6 Selection analysis results for the Euphorbia candidate
genes. Values given for 13 genes whose amino acid sequence
showed strong, positive PBS (PBS.10) and belonged to the same
MIPS term.
(DOC)
Text S1 Supporting Methods.
(PDF)
Acknowledgments
The editor and anonymous reviewers provided constructive comments that
greatly improved the manuscript. We thank all members of the New York
Plant Genomics Consortium from NYU, NYBG, AMNH, and CSHL for
support and encouragement.
Author Contributions
Conceived and designed the experiments: EKL DWS WRM RAM GC
RD. Performed the experiments: EKL AC-J S-OK MSK. Analyzed the
data: EKL AC-J S-OK MSK AS MO DPL. Contributed reagents/
materials/analysis tools: RD EKL MSK AS JCC WRM RAM GC. Wrote
the paper: EKL AC-J S-OK MSK DWS RAM RD.
References
1. Burleigh JG, Mathews S (2004) Phylogenetic signal in nucleotide data fromseed plants: implications for resolving the seed plant tree of life. Am J Bot 91:
1599–1613.
2. Mathews S (2009) Phylogenetic relationships among seed plants: persistent
questions and the limits of molecular data. Am J Bot 96: 228–236.
3. Barkman TJ, McNeal JR, Lim SH, Coat G, Croom HB, et al. (2007)Mitochondrial DNA suggests at least 11 origins of parasitism in angiosperms
and reveals genomic chimerism in parasitic plants. BMC Evol Biol 7: 248.
4. Bouchenak-Khelladi Y, Salamin N, Savolainen V, Forest F, Bank M, et al.(2008) Large multi-gene phylogenetic trees of the grasses (Poaceae): progress
towards complete tribal and generic level sampling. Mol Phylogenet Evol 47:
488–505.
5. Bowe LM, Coat G, dePamphilis CW (2000) Phylogeny of seed plants based on
all three genomic compartments: extant gymnosperms are monophyletic andGnetales’ closest relatives are conifers. Proc Natl Acad Sci U S A 97:
4092–4097.
6. Burleigh JG, Hilu KW, Soltis DE (2009) Inferring phylogenies with incompletedata sets: a 5-gene, 567-taxon analysis of angiosperms. BMC Evol Biol 9: 61.
7. Chase MW, Soltis DE, Olmstead RG, Morgan D, Les DH, et al. (1993)
Phylogenetics of seed plants: an analysis of nucleotide sequences from theplastid gene rbcL. Ann Missouri Bot Gard 80: 528–580.
8. Smith SA, Donoghue MJ (2008) Rates of molecular evolution are linked to life
history in flowering plants. Science 322: 86–89.
9. Zhu XY, Chase MW, Qiu YL, Kong HZ, Dilcher DL, et al. (2007)
Mitochondrial matR sequences help to resolve deep phylogenetic relationshipsin rosids. BMC Evol Biol 7: 217.
10. Leebens-Mack J, Raubeson LA, Cui L, Kuehl JV, Fourcade MH, et al. (2005)
Identifying the basal angiosperm node in chloroplast genome phylogenies:sampling one’s way out of the Felsenstein zone. Mol Biol Evol 22: 1948–1963.
11. Braukmann TW, Kuzmina M, Stefanovic S (2009) Loss of all plastid ndh genes
in Gnetales and conifers: extent and evolutionary significance for the seed plantphylogeny. Curr Genet 55: 323–337.
12. Jansen RK, Cai Z, Raubeson LA, Daniell H, Depamphilis CW, et al. (2007)Analysis of 81 genes from 64 plastid genomes resolves relationships in
angiosperms and identifies genome-scale evolutionary patterns. Proc Natl Acad
Sci U S A 104: 19369–19374.
13. McCoy SR, Kuehl JV, Boore JL, Raubeson LA (2008) The complete plastid
genome sequence of Welwitschia mirabilis: an unusually compact plastome with
accelerated divergence rates. BMC Evol Biol 8: 130.
14. Moore MJ, Bell CD, Soltis PS, Soltis DE (2007) Using plastid genome-scale
data to resolve enigmatic relationships among basal angiosperms. Proc Natl
Acad Sci U S A 104: 19363–19368.
15. Qiu YL, Li L, Wang B, Chen Z, Knoop V, et al. (2006) The deepest
divergences in land plants inferred from phylogenomic evidence. Proc NatlAcad Sci U S A 103: 15511–15516.
16. Zhong B, Yonezawa T, Zhong Y, Hasegawa M (2010) The position of Gnetales
among seed plants: overcoming pitfalls of chloroplast phylogenomics. Mol BiolEvol 27: 2855–2863.
17. Burleigh JG, Bansal MS, Eulenstein O, Hartmann S, Wehe A, et al. (2011)
Genome-scale phylogenetics: inferring the plant tree of life from 18,896 genetrees. Syst Biol 60: 117–125.
18. Finet C, Timme RE, Delwiche CF, Marletaz F (2010) Multigene phylogeny of
the green lineage reveals the origin and diversification of land plants. Curr Biol20: 2217–2222.
19. Sanderson M, McMahon M (2007) Inferring angiosperm phylogeny from ESTdata with widespread gene duplication. BMC Evol Biol 7: S3.
20. Baker RH, DeSalle R (1997) Multiple sources of character information and the
phylogeny of Hawaiian drosophilids. Syst Biol 46: 654–673.
21. Chiu JC, Lee EK, Egan MG, Sarkar IN, Coruzzi GM, et al. (2006)
OrthologID: automation of genome-scale ortholog identification within a
parsimony framework. Bioinformatics 22: 699–707.
22. Katari MS, Nowicki SD, Aceituno FF, Nero D, Kelfer J, et al. (2010)
VirtualPlant: a software platform to support systems biology research. Plant
Physiol 152: 500–515.
23. Schmidt M, Schneider-Poetsch HA (2002) The evolution of gymnospermsredrawn by phytochrome genes: the Gnetatae appear at the base of the
gymnosperms. J Mol Evol 54: 715–724.
24. Nixon KC, Crepet WL, Stevenson D, Friis EM (1994) A reevaluation of seed
plant phylogeny. Ann Missouri Bot Gard 81: 484–533.
25. Rothwell GW, Serbet R (1994) Lignophyte phylogeny and the evolution ofspermatophytes: a numerical cladistic analysis. Syst Bot 19: 443–482.
26. Albert VA, Backlund A, Bremer K, Chase MW, Manhart JR, et al. (1994)
Functional constraints and rbcL evidence for land plant phylogeny. AnnMissouri Bot Gard 81: 534–567.
27. Goremykin V, Bobrova V, Pahnke J, Troitsky A, Antonov A, et al. (1996)
Noncoding sequences from the slowly evolving chloroplast inverted repeat inaddition to rbcL data do not support gnetalean affinities of angiosperms. Mol
Biol Evol 13: 383–396.
28. Hasebe M, Kofuji R, Ito M, Kato M, Iwatsuki K, et al. (1992) Phylogeny of
gymnosperms inferred from rbcL gene sequences. J Plant Res 105: 673–679.
29. Samigullin TK, Martin WF, Troitsky AV, Antonov AS (1999) Molecular datafrom the chloroplast rpoC1 gene suggest a deep and distinct dichotomy of
contemporary spermatophytes into two monophyla: gymnosperms (including
Gnetales) and angiosperms. J Mol Evol 49: 310–315.
30. Mathews S, Donoghue MJ. Analyses of phytochrome data from seed plants:
exploration of conflicting results from parsimony and Bayesian approaches;
2002 Aug 2-7; Madison, WI.
31. Becker A, Theissen G (2003) The major clades of MADS-box genes and their
role in the development and evolution of flowering plants. Mol Phylogenet Evol29: 464–489.
32. Winter KU, Becker A, Munster T, Kim JT, Saedler H, et al. (1999) MADS-box
genes reveal that gnetophytes are more closely related to conifers than toflowering plants. Proc Natl Acad Sci U S A 96: 7342–7347.
33. Frohlich MW, Parker DS (2000) The mostly male theory of flower evolutionary
origins: from genes to fossils. Syst Bot 25: 155–170.
34. Pearson PN (1999) Apomorphy distribution is an important aspect of
cladogram symmetry. Syst Biol 48: 399–406.
35. The Angiosperm Phylogeny Group (2003) An update of the Angiosperm
Phylogeny Group classification for the orders and families of flowering plants:
APG II. Bot J Linn Soc 141: 399–436.
36. The Angiosperm Phylogeny Group (2009) An update of the Angiosperm
Phylogeny Group classification for the orders and families of flowering plants:
APG III. Bot J Linn Soc 161: 105–121.
37. Wikstrom N, Savolainen V, Chase MW (2001) Evolution of the angiosperms:
calibrating the family tree. Proc R Soc B Biol Sci 268: 2211–2220.
38. Chase MW, Fay MF, Devey DS, Rønsted N, Davies J, et al. (2006) Multi-geneanalyses of monocot relationships: a summary. Aliso 22: 63–76.
39. Chase MW, Soltis DE, Soltis PS, Rudall PJ, Fay MF, et al. (2000) Higher-levelsystematics of the monocotyledons: an assessment of current knowledge and a
new classification. In: Wilson KL, Morrison DA, eds. Monocots: Systematics
and Evolution. Melbourne: CSIRO. pp 1–16.
40. Chase MW, Stevenson DW, Wilkin P, Rudall PJ (1995) Monocot systematics: a
combined analysis. In: Rudall PJ, Cribb PJ, Cutler DF, Humphries CJ, eds.
Monocotyledons: Systematics and Evolution: Royal Botanical Gardens, Kew.pp 685–730.
41. Duvall MR, Learn GH, Jr., Eguiarte LE, Clegg MT (1993) Phylogenetic
analysis of rbcL sequences identifies Acorus calamus as the primal extantmonocotyledon. Proc Natl Acad Sci U S A 90: 4641–4644.
42. Davis JI, Petersen G, Seberg O, Stevenson DW, Hardy CR, et al. (2006) Aremitochondrial genes useful for the analysis of monocot relationships? Taxon 55:
857–870.
43. Davis JI, Stevenson DW, Petersen G, Seberg O, Campbell LM, et al. (2004) Aphylogeny of the monocots, as inferred from rbcL and atpA sequence variation,
and a comparison of methods for calculating jackknife and bootstrap values.
Syst Bot 29: 467–510.
44. Stevenson D, Davis J, Freudenstein JV, Hardy CR, Simmons MP, et al. (2000)
A phylogenetic analysis of the monocotyledons based on morphological and
molecular character sets, with comments on the placement of Acorus and
A Functional Phylogenomic View of the Seed Plants
PLoS Genetics | www.plosgenetics.org 11 December 2011 | Volume 7 | Issue 12 | e1002411

Hydatellaceae. In: Wilson KL, Morrison DA, eds. Monocots: Systematics and
Evolution. Melbourne: CSIRO. pp 17–24.
45. Soltis DE, Soltis PS, Chase MW, Mort ME, Albach DC, et al. (2000)
Angiosperm phylogeny inferred from 18S rDNA, rbcL, and atpB sequences.
Bot J Linn Soc 133: 381–461.
46. Soltis PS, Soltis DE, Zanis MJ, Kim S (2000) Basal lineages of angiosperms:
relationships and implications for floral evolution. Intl J Plant Sci 161:
S97–S107.
47. Zanis MJ, Soltis DE, Soltis PS, Mathews S, Donoghue MJ (2002) The root ofthe angiosperms revisited. Proc Natl Acad Sci U S A 99: 6848–6853.
48. Ashburner M, Ball CA, Blake JA, Botstein D, Butler H, et al. (2000) Gene
ontology: tool for the unification of biology. The Gene Ontology Consortium.
Nat Genet 25: 25–29.
49. Rosenfeld JA, DeSalle R, Lee EK, O’Grady P (2008) Using whole genome
presence/absence data to untangle function in 12 Drosophila genomes. Fly 2:
291–299.
50. Nielsen R (2005) Statistical Methods in Molecular Evolution. New York:
Springer. 504 p.
51. Biswas S, Akey JM (2006) Genomic insights into positive selection. Trends
Genet 22: 437–446.
52. Yang Z, Bielawski JP (2000) Statistical methods for detecting molecular
adaptation. Trends Ecol Evol 15: 496–503.
53. Mewes HW, Dietmann S, Frishman D, Gregory R, Mannhaupt G, et al. (2008)
MIPS: analysis and annotation of genome information in 2007. Nucleic Acids
Res 36: D196–201.
54. Ohkama-Ohtsu N, Zhao P, Xiang C, Oliver DJ (2007) Glutathione conjugates
in the vacuole are degraded by c-glutamyl transpeptidase GGT3 in
Arabidopsis. Plant J 49: 878–888.
55. Rebeille F, Jabrin S, Bligny R, Loizeau K, Gambonnet B, et al. (2006)
Methionine catabolism in Arabidopsis cells is initiated by a c-cleavage process
and leads to S-methylcysteine and isoleucine syntheses. Proc Natl Acad Sci U S A
103: 15687–15692.
56. Rizhsky L, Liang H, Shuman J, Shulaev V, Davletova S, et al. (2004) When
defense pathways collide. The response of Arabidopsis to a combination of
drought and heat stress. Plant Physiol 134: 1683–1696.
57. Cervilla LM, Blasco B, Rios JJ, Romero L, Ruiz JM (2007) Oxidative stress and
antioxidants in tomato (Solanum lycopersicum) plants subjected to boron toxicity.
Ann Bot 100: 747–756.
58. Mateos RM, Leon AM, Sandalio LM, Gomez M, del Rio LA, et al. (2003)
Peroxisomes from pepper fruits (Capsicum annuum L.): purification, characterisa-
tion and antioxidant activity. J Plant Physiol 160: 1507–1516.
59. Anderson JV, Davis DG (2004) Abiotic stress alters transcript profiles and
activity of glutathione S-transferase, glutathione peroxidase, and glutathione
reductase in Euphorbia esula. Physiol Plantarum 120: 421–433.
60. Bhatia K, Rahman S, Ali M, Raisuddin S (2006) In vitro antioxidant activity of
Juglans regia L. bark extract and its protective effect on cyclophosphamide-
induced urotoxicity in mice. Redox Rep 11: 273–279.
61. Rodriguez Milla MA, Maurer A, Rodriguez Huete A, Gustafson JP (2003)
Glutathione peroxidase genes in Arabidopsis are ubiquitous and regulated by
abiotic stresses through diverse signaling pathways. Plant J 36: 602–615.
62. Gross-Hardt R, Kagi C, Baumann N, Moore JM, Baskar R, et al. (2007)
LACHESIS restricts gametic cell fate in the female gametophyte of Arabidopsis.
PLoS Biol 5: e47. doi:10.1371/journal.pbio.0050047.
63. Kidner CA, Martienssen RA (2004) Spatially restricted microRNA directs leaf
polarity through ARGONAUTE1. Nature 428: 81–84.
64. Hernandez-Pinzon I, Yelina NE, Schwach F, Studholme DJ, Baulcombe D,
et al. (2007) SDE5, the putative homologue of a human mRNA export factor, is
required for transgene silencing and accumulation of trans-acting endogenous
siRNA. Plant J 50: 140–148.
65. Cibrian-Jaramillo A, De la Torre-Barcena JE, Lee EK, Katari MS, Little DP,
et al. (2010) Using phylogenomic patterns and gene ontology to identify
proteins of importance in plant evolution. Genome Biol Evol 2: 225–239.
66. Nagasaki H, Itoh J, Hayashi K, Hibara K, Satoh-Nagasawa N, et al. (2007)
The small interfering RNA production pathway is required for shoot meristem
initiation in rice. Proc Natl Acad Sci U S A 104: 14867–14871.
67. Martienssen R (2010) Molecular biology. Small RNA makes its move. Science
328: 834–835.
68. Morin RD, Aksay G, Dolgosheina E, Ebhardt HA, Magrini V, et al. (2008)
Comparative analysis of the small RNA transcriptomes of Pinus contorta and
Oryza sativa. Genome Res 18: 571–584.
69. Axtell MJ, Snyder JA, Bartel DP (2007) Common functions for diverse small
RNAs of land plants. Plant Cell 19: 1750–1769.
70. Rabinowicz PD, Citek R, Budiman MA, Nunberg A, Bedell JA, et al. (2005)
Differential methylation of genes and repeats in land plants. Genome Res 15:
1431–1440.
71. Mosher RA, Melnyk CW, Kelly KA, Dunn RM, Studholme DJ, et al. (2009)
Uniparental expression of PolIV-dependent siRNAs in developing endosperm
of Arabidopsis. Nature 460: 283–286.
72. Olmedo-Monfil V, Duran-Figueroa N, Arteaga-Vazquez M, Demesa-
Arevalo E, Autran D, et al. (2010) Control of female gamete formation by a
small RNA pathway in Arabidopsis. Nature 464: 628–632.
73. Friedman WE (2009) The meaning of Darwin’s ‘abominable mystery’. Am J Bot
96: 5–21.
74. Weedall GD, Polley SD, Conway DJ (2008) Gene-specific signatures ofelevated non-synonymous substitution rates correlate poorly across the
Plasmodium genus. PLoS ONE 3: e2281. doi:10.1371/journal.pone.0002281.
75. Magallon SA, Sanderson MJ, Soltis P (2005) Angiosperm divergence times: the
effect of genes, codon positions, and time constraints. Evolution 59: 1653–1670.
76. Govaerts R, Frodin DG, Radcliffe-Smith A (2000) World checklist and
bibliography of Euphorbiaceae (with Pandaceae). 4 Volumes. London: RoyalBotanic Gardens, Kew.
77. Radcliffe-Smith A (2001) Genera Euphorbiacearum. London: Royal BotanicGardens, Kew. 464 p.
78. Davis CC, Webb CO, Wurdack KJ, Jaramillo CA, Donoghue MJ (2005)Explosive radiation of Malpighiales supports a mid-Cretaceous origin of
modern tropical rain forests. Am Nat 165: E36–E65.
79. Wurdack KJ, Hoffmann P, Chase MW (2005) Molecular phylogenetic analysis
of uniovulate Euphorbiaceae (Euphorbiaceae sensu stricto) using plastid rbcL andtrnL-F DNA sequences. Am J Bot 92: 1397–1420.
80. Christin P-A, Osborne CP, Sage RF, Arakaki M, Edwards EJ (2011) C4eudicots are not younger than C4 monocots. J Exp Bot 62: 3171–3181.
81. Goldman N, Yang Z (1994) A codon-based model of nucleotide substitution forprotein-coding DNA sequence. Mol Biol Evol 11: 725–736.
82. Katoh K, Toh H (2008) Recent developments in the MAFFT multiplesequence alignment program. Brief Bioinform 9: 286–298.
83. Swofford DL (2003) PAUP*: Phylogenetic Analysis Using Parsimony (and othermethods). Sunderland, MA: Sinauer Associates.
84. Goloboff PA, Farris JS, Nixon KC (2008) TNT, a free program forphylogenetic analysis. Cladistics 24: 774–786.
85. Goloboff PA (1999) Analyzing large data sets in reasonable times: solutions forcomposite optima. Cladistics 15: 415–428.
86. Nixon KC (1999) The parsimony ratchet, a new method for rapid parsimonyanalysis. Cladistics 15: 407–414.
87. Gatesy J, O’Grady P, Baker RH (1999) Corroboration among data sets insimultaneous analysis: hidden support for phylogenetic relationships among
higher level artiodactyl taxa. Cladistics 15: 271–313.
88. Sorenson MD, Franzosa EA (2007) TreeRot. 3 ed. Boston: Boston University.
89. Stamatakis A, Ott M (2008) Efficient computation of the phylogeneticlikelihood function on multi-gene alignments and multi-core architectures.
Phil Trans R Soc B Biol Sci 363: 3977–3984.
90. Ott M, Zola J, Stamatakis A, Aluru S (2007) Large-scale maximum likelihood-
based phylogenetic analysis on the IBM BlueGene/L. Proceedings of the 2007ACM/IEEE Conference on Supercomputing. Reno, NV: ACM.
91. Stamatakis A, Ott M (2008) Exploiting fine-grained parallelism in thephylogenetic likelihood function with MPI, Pthreads, and OpenMP: a
performance study. Pattern Recognition in Bioinformatics. Berlin: Springer.
pp 424–435.
92. Stamatakis A (2006) RAxML-VI-HPC: maximum likelihood-based phyloge-
netic analyses with thousands of taxa and mixed models. Bioinformatics 22:2688–2690.
93. Jones DT, Taylor WR, Thornton JM (1992) The rapid generation of mutationdata matrices from protein sequences. Comput Appl Biosci 8: 275–282.
94. Lanave C, Preparata G, Saccone C, Serio G (1984) A new method forcalculating evolutionary substitution rates. J Mol Evol 20: 86–93.
95. Stamatakis A (2006) Phylogenetic models of rate heterogeneity: a high
performance computing perspective. IEEE International Parallel and Distrib-
uted Processing Symposium. Rhodes, Greece.
96. Yang Z (1994) Maximum likelihood phylogenetic estimation from DNA
sequences with variable rates over sites: approximate methods. J Mol Evol 39:306–314.
97. Stamatakis A, Hoover P, Rougemont J (2008) A rapid bootstrap algorithm forthe RAxML Web servers. Syst Biol 57: 758–771.
98. Pattengale ND, Alipour M, Bininda-Emonds ORP, Moret BME, Stamatakis A(2010) How many bootstrap replicates are necessary? J Comput Biol 17:
337–354.
99. Ashburner M, Ball CA, Blake JA, Botstein D, Butler H, et al. (2000) Gene
ontology: tool for the unification of biology. The Gene Ontology Consortium.Nat Genet 25: 25–29.
100. Mewes HW, Dietmann S, Frishman D, Gregory R, Mannhaupt G, et al. (2008)MIPS: analysis and annotation of genome information in 2007. Nucl Acids Res
36: D196–201.
101. Wang R, Tischner R, Gutierrez RA, Hoffman M, Xing X, et al. (2004)
Genomic analysis of the nitrate response using a nitrate reductase-null mutantof Arabidopsis. Plant Physiol 136: 2512–2522.
102. Yang Z (2006) Computational Molecular Evolution. Oxford: OxfordUniversity Press. 357 p.
103. Sharp PM (1997) In search of molecular darwinism. Nature 385: 111–112.
104. Golding GB, Dean AM (1998) The structural basis of molecular adaptation.
Mol Biol Evol 15: 355–369.
105. Yang Z (1998) Likelihood ratio tests for detecting positive selection and
application to primate lysozyme evolution. Mol Biol Evol 15: 568–573.
106. Yang Z, Nielsen R, Goldman N, Pedersen AM (2000) Codon-substitution
models for heterogeneous selection pressure at amino acid sites. Genetics 155:431–449.
107. Kosakovsky Pond SL, Frost SDW, Muse SV (2005) HyPhy: hypothesis testingusing phylogenies. Bioinformatics 21: 676–679.
A Functional Phylogenomic View of the Seed Plants
PLoS Genetics | www.plosgenetics.org 12 December 2011 | Volume 7 | Issue 12 | e1002411

108. Muse SV, Gaut BS (1994) A likelihood approach for comparing synonymous
and nonsynonymous nucleotide substitution rates, with application to thechloroplast genome. Mol Biol Evol 11: 715–724.
109. Hasegawa M, Kishino H, Yano T (1985) Dating of the human-ape splitting by
a molecular clock of mitochondrial DNA. J Mol Evol 22: 160–174.
110. Kosakovsky Pond SL, Frost SDW (2005) Not so different after all: a
comparison of methods for detecting amino acid sites under selection. Mol
Biol Evol 22: 1208–1222.
A Functional Phylogenomic View of the Seed Plants
PLoS Genetics | www.plosgenetics.org 13 December 2011 | Volume 7 | Issue 12 | e1002411