photochemicalandmicrobialalterationofdissolvedorganicmatter … ·...
TRANSCRIPT
Photochemical andmicrobial alteration of dissolved organic matterin temperate headwater streams associated with different land use
Yuehan Lu,1 James E. Bauer,2 Elizabeth A. Canuel,3 Youhei Yamashita,4
R. M. Chambers,5 and Rudolf Jaffé6
Received 5 March 2012; revised 26 February 2013; accepted 2 March 2013.
[1] Photochemical and microbial transformations of DOM were evaluated in headwaterstreams draining forested and human-modified lands (pasture, cropland, and urbandevelopment) by laboratory incubations. Changes in DOC concentrations, DOC isotopicsignatures, and DOM fluorescence properties were measured to assess the amounts, sources,ages, and properties of reactive and refractory DOM under the influence of photochemistryand/or bacteria. DOC in streams draining forest-dominated watersheds was morephotoreactive than in streams draining mostly human-modified watersheds, possibly due togreater contributions of terrestrial plant-derived DOC and lower amounts of prior lightexposure in forested streams. Overall, the percentage of photoreactive DOC in stream waterswas best predicted by the relative content of terrestrial fluorophores. The bioreactivity of DOCwas similar in forested and human-modified streams, but variations were correlated withtemperature and may be further controlled by the diagenetic status of organic matter.Alterations to DOC isotopes and DOM fluorescence properties during photochemicaland microbial incubations were similar between forested and human-modified streamsand included (1) negligible effects of microbial alteration on DOC isotopes and DOMfluorescence properties, (2) selective removal of 13C-depleted and 14C-enriched DOC underthe combined influence of photochemical and microbial processes, and (3) photochemicalalteration of DOM resulting in a preferential loss of terrestrial humic fluorescence componentsrelative to microbial fluorescence components. This study provides a unique comparison ofDOC reactivity in a regional group of streams draining forested and human-modifiedwatersheds and indicates the importance of land use on the photoreactivity of DOC exportedfrom upstream watersheds.
Citation: Lu, Y. H., J. E. Bauer, E. A. Canuel, Y. Yamashita, R. M. Chambers, and R. Jaffe (2013), Photochemical andmicrobial alteration of dissolved organic matter in temperate headwater streams associated with different land use, J.Geophys. Res. Biogeosci., 118, doi:10.1002/jgrg.20048.
1. Introduction
[2] Human modifications of terrestrial environments mayhave potentially profound impacts on the transfer of organicand other biologically relevant materials to aquatic systems[Wilson and Xenopoulos, 2009; Aufdenkampe et al., 2011].
Recent studies have shown that human land uses affectthe amounts, quality, sources, and ages of dissolved organicmatter (DOM) in streams and rivers. Such impacts includeincreases in the 14C ages of organic carbon exported fromwatersheds [Stern et al., 2007; Sickman et al., 2010], changesin dissolved organic carbon (DOC) concentrations [Sternet al., 2007; Yamashita et al., 2010], and alterations to the struc-tural complexity and chemical composition of DOM [Warner etal., 2009;Wilson and Xenopoulos, 2009;Williams et al., 2010;Edmonds and Grimm, 2011; Yamashita et al., 2011a]. Thesechanges are predicted to lead to modifications in DOM process-ing andmetabolism in aquatic systems, of which photochemicaland microbial transformations are two essential components.[3] Photochemical processes may degrade DOM to smaller
organic compounds and remineralize DOM to inorganicspecies such as CO2 and CO [Moran and Zepp, 1997;Obernosterer and Benner, 2004], whereas bacteria can utilizeDOM as sources of both energy and C, N, and P for cellularsynthesis [Benner, 2003; Kirchman, 2003]. Both photochemi-cal andmicrobial processing of terrestrially derived DOMmaythus play important roles in key biogeochemical processes,such as carbon fluxes between terrestrial, aquatic and atmo-spheric reservoirs [e.g., Gennings et al., 2001; McCallisterand del Giorgio, 2008; Aufdenkampe et al., 2011] and
Additional supporting information may be found in the online version of thisarticle.
1Department of Geological Sciences, University of Alabama,Tuscaloosa, Alabama, USA.
2Aquatic Biogeochemistry Laboratory, Department of Evolution, Ecologyand Organismal Biology, Ohio State University, Columbus, Ohio, USA.
3Department of Physical Sciences, Virginia Institute of MarineSciences, Gloucester Point, Virginia, USA.
4Faculty of Environmental Earth Science, Hokkaido University,Sapporo, Hokkaido, Japan.
5Department of Biology, College of William and Mary, Williamsburg,Virginia, USA.
6Southeast Environmental Research Center and Department ofChemistry & Biochemistry, Florida International University, Miami,Florida, USA.
Corresponding author: Y. H. Lu, Department of Geological Sciences,University of Alabama, Tuscaloosa, AL 35485, USA. ([email protected])
©2013. American Geophysical Union. All Rights Reserved.2169-8953/13/10.1002/jgrg.20048
1
JOURNAL OF GEOPHYSICAL RESEARCH: BIOGEOSCIENCES, VOL. 118, 1–15, doi:10.1002/jgrg.20048, 2013

energy/substrate transfer in aquatic food webs [Cole andCaraco, 2001; del Giorgio and Davis, 2003; Moran and Co-vert, 2003].[4] While photochemical and microbial processing of
stream and river water DOM may vary as a function of landuse, relatively few studies have directly characterized theseeffects. Findlay et al. [2001] found marked changes in thefluorescence characteristics of DOM in subsurface watersfrom pastures after a 2 h sunlight exposure, compared tosmaller changes in DOM from forested areas. They alsoshowed that stream DOC bioavailability, as reflected bybacterial growth and respiration rates, was more closelyrelated to the physical nature of stream flow paths (e.g.,slumping of hillslope soils into the stream) than to land usetypes. Williams et al. [2010] documented that in situmicrobial activity was higher in streams with watershedsmodified by human land use relative to those with lessanthropogenic modification. However, further work isneeded to evaluate DOM reactivity across different landuses, to better constrain the effects of land use on DOMreactivity, and to assess the underlying mechanisms.[5] Assessing how human alteration of watersheds impacts
DOM reactivity is important for improving our understandingof DOM transformation along the land-fluvial-coastal oceancontinuum and for assessing land-to-ocean carbon andorganic matter (OM) fluxes. Terrestrial DOM, for example,has been suggested as a major but relatively unexplored factorcontributing to coastal hypoxia [Bianchi et al., 2010]. Whilestudies suggest that terrestrial OM is more refractory thanaquatic DOM [Benner, 2003], the reactivity of terrestrialDOM may be altered by human activities, contributing tolow dissolved oxygen concentration and poor water qualityin downstream regions. In addition, DOC concentrationsand fluxes in streams and rivers of Europe and North Americahave increased in the last decade [Hejzlar et al., 2003; Evanset al., 2005; Skjelkvåle et al., 2005]. Postulated mechanismsfor these increases include declining acid deposition [Krugand Frink, 1983; Driscoll et al., 2003] and rising tempera-tures [Freeman et al., 2001]. Changes in land use may alsoplay a role in these decadal-scale changes in DOC by alteringits reactivity. In addition, OM inputs via streams and rivershave been extensively studied to evaluate the sources of terres-trial (i.e., allochthonous) versus aquatic (i.e., autochthonous)OM supporting estuarine and coastal metabolism [e.g.,Raymond and Bauer, 2001a; McCallister et al., 2004; Yama-shita et al., 2011b]. Alteration of terrestrial DOM by photo-chemical and microbial processes during its downstreamtransit may be an important factor regulating these terrestrial-aquatic linkages and the extent to which downstream metabo-lism is supported by terrestrial versus aquatic sources of DOM.[6] The primary objective of the present study was to
characterize how DOM exported from varying landuse differs in its characteristics and in its photochemicaland microbial reactivity and transformations. We selectedseven headwater streams, three draining watersheds domi-nated by forests, i.e., forested-streams, and four drainingwatersheds dominated by human-modified land uses, i.e.,human-modified streams, including pasture, cropland, andurban development, in a temperate watershed in Virginia,USA. Laboratory photochemical and microbial incubationswere conducted, and changes in DOC concentrations werecharacterized over the incubation time course to quantify
rates of DOC remineralization. Stable and radio-carbonisotopes (d13C and Δ14C) were used to evaluate changes inthe sources and ages of DOC under the influence ofphotochemistry and/or microbes. Fluorescence properties ofchromophoric DOM (CDOM) determined by excitation emis-sion matrix-parallel factor analysis (EEM-PARAFAC) werefurther used to assess the DOM preferentially mineralizedby photochemistry or/and microbes. Findings from thisstudy provide new insights on the potential role of water-shed land use on the sources and reactivity of DOM and al-terations to DOM characteristics during photochemical andmicrobial processing.
2. Methods
2.1. Sampling Sites and Watershed Land UseClassification
[7] Seven first-order streams (Strahler scale) locatedwithin the lower Chesapeake Bay watershed in Virginia(USA) were chosen for this study (Figure 1). The watershedsof the three forested streams (F1, F2, and F3) have oak-pineforest coverage ranging between 87 and 100% (Table 1).Among the four human-modified streams, two streams drainedpasture-dominated watersheds (P1 and P2), one drained a wa-tershed dominated by cropland (C1), and one was influenced byurbanization (U1) (Table 1 and Figure 1). Pastures were annu-ally rotated between warm-season grasses (May–October) andcool-season grasses (November–April), whereas croplands al-ternated between corn (May–October) and soybeans (Novem-ber–April). All streams except U1 were located in rural areas(population density: 18 per km2 as of 2000). U1 was situ-ated in Williamsburg, Virginia (population density: 564per km2 as of 2008), and was located ~35–39 km from theother streams (Table 1 and Figure 1). During our samplingperiod (May 2009 to November 2009), monthly precipita-tion ranged between 7 and 21 cm and averaged 13 cm,which is typical compared to the precipitation range overthe last decade (www.sercc.com).[8] The watersheds associated with each of the study streams
were delineated according to the 1 : 24,000 topographic maps(U.S. Geological Survey), which were then overlain on aerialphotos (scale of either 1 : 1200 or 1 : 2400) and divided intopolygons based on different land use types. The areas of thepolygons were calculated in ArcGIS to determine the dominantland use in each watershed (Table 1). Assuming that streamDOM was primarily controlled by upstream land use, we onlyconsidered the watersheds upstream of each sampling location.
2.2. Sample Collection
[9] All containers and sampling equipment that were indirect contact with water samples were either combusted at450 �C for 5 h for all glass materials, or acid soaked(10% HCl) and thoroughly rinsed with Milli-Q water forall plastic materials. Stream water samples were collectedin 20 l polycarbonate carboys using a MasterflexW E/S™
portable sampler (Cole-Parmer) equipped with acid-cleanedsilicone tubing. Due to the shallow nature of the sampling sites(15–30 cm), care was taken to avoid disturbing surfacesediments. Sample carboys were stored in the dark on ice untilfiltration, which was done within ~6h of sample collection.Parameters measured in situ included water temperature,
LU ET AL.: DOM IN STREAMS OF DIFFERENT LAND USE
2

76° 39 '0"W76° 42 '0"W76° 45 '0"W
37°
15'0
"N37
°12
'0"N
U1
James River
James River Watershed
York River Watershed
76° 51 '0 "W76° 54 '0 "W76° 57 '0 "W
37°
36'0
"N37
°33
'0"N
C1
F1F2
F3
P1
P2
Mattaponi River
Pamunkey River
Pamunkey River
Watershed
Mattaponi River Watershed
1km
1km
(a)
(b)
Bay
ekae
pase
hC
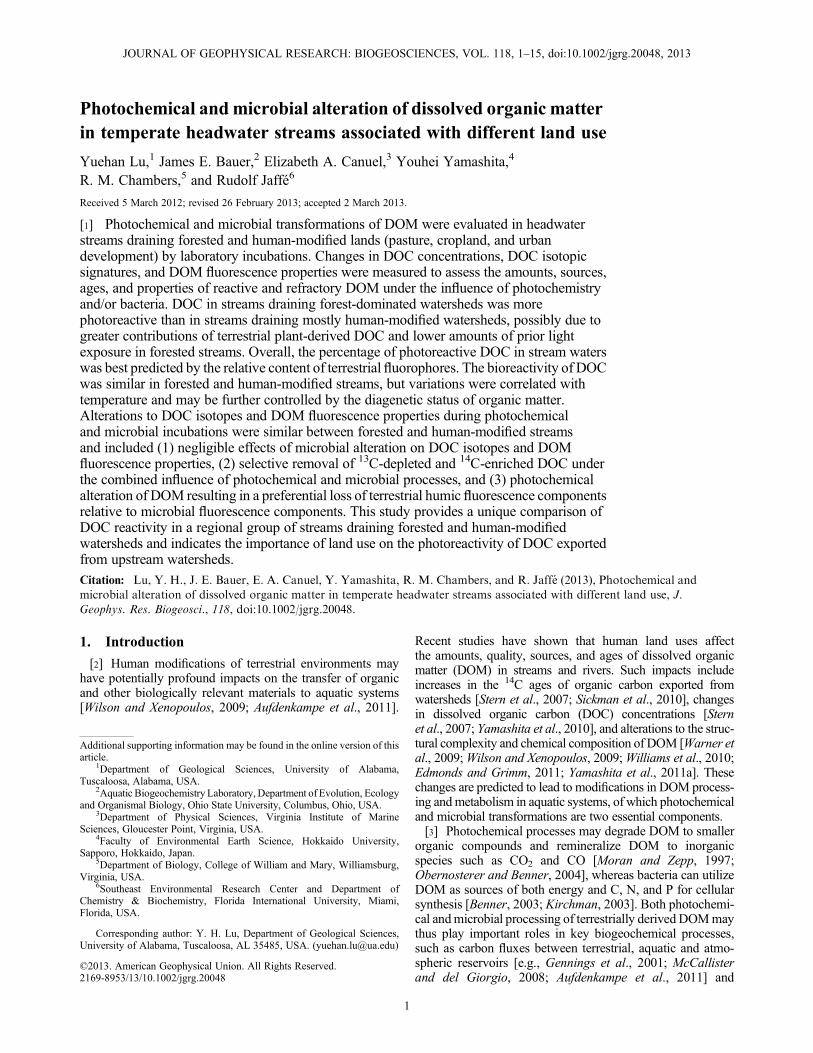
Figure 1. Locations of study sites within the (a) York River and (b) James River watersheds. Samplingstreams are indicated by heavy black lines, and sampling sites are indicated by solid black dots. Otherstreams in this area that were not sampled are indicated by gray lines. The black dashed line delineateswatershed boundaries of the major rivers in the region.
Table 1. Sampling Dates, Environmental Parameters Measured, and Watershed Land Use of the Study Streamsa
SamplingSite
SamplingDates
WaterTemperature (�C)
SpecificConductivity
(mS) pH
DissolvedOxygen(mg/l)
Watershed Land UseComposition
Chlorophyll-a(mg/l)
Nitrate(mg/l)
Ammonium(mg/l)
WatershedSize (km2)
F1 08-18-2009 23.7 43.9 5.5 6.8 83% forest, 17% cropland 0.03 2.1 b.d. 0.27F2 05-22-2009 15 92.5 6.2 5.8 100% forest 0.04 0.52 b.d. 0.09F2 11-09-2009 12.6 158.9 5 3.0 100% forest 0.01 b.d. b.d. 0.09F3 11-09-2009 12.6 56.9 5 7.8 100% forest 0.05 b.d. b.d. 0.28P1 08-18-2009 24 136.7 6 4.0 70% pasture, 30% forest 6.27 0.69 b.d. 0.29P1 11-09-2009 18.3 95.9 6 7.9 70% pasture, 30% forest 0.14 2.29 2.49 0.29P2 08-18-2009 18.5 44.8 5.5 7.3 61% pasture, 39% forest 0.92 0.18 b.d. 0.44P2 11-09-2009 16.5 73.4 6.5 5.8 61% pasture, 39% forest 0.48 b.d. b.d. 0.44C1 05-22-2009 17.8 45.7 4.7 7.0 72% cropland, 28% forest 0.41 17.74 b.d. 0.30U1 08-18-2009 22.5 713 6.5 5.5 81% urban, 19% forest 0.43 0.73 b.d. 0.67
ab.d. = below detection;
LU ET AL.: DOM IN STREAMS OF DIFFERENT LAND USE
3

specific conductivity, pH, and dissolved oxygen concentration(Table 1).
2.3. Experimental Incubations
[10] Pre-baked GF/F glass fiber filters (nominal pore sizeof 0.7 mm, 47mm diameter) were used to remove livingand non-living particulate materials and bacterial predators[Schultz, 1999; Raymond and Bauer, 2000; McCallisteret al., 2004]. A portion of the 0.7 mm filtrate was subse-quently filtered through a 0.2 mm capsule filter (Whatmanpolycap; pre-cleaned with 10% HCl and distilled water) toremove bacteria and serve as an abiologic control. Threeincubation treatments were performed to assess the potentialreactivity of stream water DOC and changes in DOMcharacteristics: (1) 0.7mm filtrate under light for combinedlight + bacteria incubations, (2) 0.7mm filtrate for dark,bacteria-only incubations, and (3) 0.2mm filtrate (i.e.,bacteria-free) for light-only incubations. The incubation exper-iments were started immediately following filtration, and wereconducted in May, August, and November 2009. Tworeplicate incubation vessels were used for each incubationtreatment. The incubation temperature for all experimentswas controlled at 22� 2 �C in order to eliminate temperatureas a confounding variable affecting DOM reactivity.[11] Light incubations were performed in 500ml quartz
flasks on a rotating light table. The light source consistedof 12 UV 340 bulbs (Q-Panel, Westlake, OH), which havespectral light similar to that of natural sunlight from theUV wavelengths between 295 and 365 nm [Dalzell et al.,2009; Spencer et al., 2009]. The irradiance of the lightsource was measured by a photometric meter (Model: IL1700, International Light, MA, USA) and was approxi-mately one third of seasonally averaged daily solar irradi-ance in shallow water at 40�N [Leifer, 1988]. The sampleswere exposed to light for 24 h per day during the incubationexperiments. Thus, the samples in the 10 day and 15 dayincubation experiments received UV exposure equivalent to~6.6 days and 10 days, respectively, of 12 h daylight at thesampling sites. The dark incubation bottles (1000ml borosili-cate brown glass bottles) were placed in cardboard boxescovered by dark bags to prevent light penetration. The incuba-tion duration was 35–36 days for the dark, bacteria-onlytreatments and 10–15 days for the light-only and the combinedlight + bacteria treatments. These incubation times werechosen based on measured changes in DOC concentrationsduring incubations, with the following considerations: (1) theDOC concentrations at the end of incubation were adequatelyhigh for Δ14C-DOC measurements, and (2) the decreases inDOC concentrations were sufficient for the changes in isotopicsignatures, if any, to be determined by isotopic mass balance.Sub-samples collected from the incubation vessels were notre-filtered prior to chemical analyses to avoid artifacts associ-ated with additional handling and filtration. Although particlesizes larger than 0.7 or 0.2mm may potentially interfere withthe measurement of DOC concentration and DOM propertiesdescribed below, this interference should be minor as bothfilter sizes have been well accepted for all these measurements.
2.4. DOC Measurements and Reactivity Estimates
[12] Throughout the stream water incubation experiments,subsamples (20ml) at the start (t0) and end (tend) time pointsas well as at four to six intermediate time points were
collected for DOC concentration to evaluate degradationkinetics. The subsampling frequency varied from 1 to 7 daysand was based on the DOC loss pattern during the experi-ments, which was determined by DOC analysis immediatelyfollowing each subsampling. Sample water was collectedfrom the incubation vessels and analyzed on a ShimadzuTOC-VCSH total organic carbon analyzer. Glucose was usedto construct standard curves, and a consensus seawater refer-ence standard (Hansell laboratory, http://yyy.rsmas.miami.edu/groups/biogeochem/CRM.html) was used to confirmanalytical accuracy. Two to three samples were randomlyselected for replicate analysis in each run, and the relativestandard deviation (RSD) was within 0.7%. The RSD forreplicate incubation bottles was≤ 6%. The percent reactiveDOC was calculated as
% reactive DOC ¼ DOCt0�DOCtendð Þ=DOCt0½ ��100 (1)
where DOCt0 and DOCtend refer to the DOC concentrationsat t0 and tend.[13] The first-order apparent degradation rate constant
(k0 in day�1) for DOC remineralization during the incuba-tions was calculated as
DOCt¼ DOCt0e�k 0t (2)
where DOCt is the DOC concentration measured at thevarious sub-sampling time points (t, in day). The k0 valueswere determined from the slopes of regression lines for lnDOC versus t. Three types of k 0 values were generated, cor-responding to the three incubation treatments: photoreactivek 0 (k 0
P) for the light-only incubations, bioreactive k 0 (k 0B)
for the dark, bacteria-only incubations, and k 0P +B for the
combined light + bacteria incubations.
2.5. Isotopic Analyses and Mass Balance Calculations
[14] The procedure for extracting water DOC for isotopicanalyses is described in detail by Raymond and Bauer[2001a] and Bauer and Bianchi [2011]. Briefly, ~125ml ofsample was placed in quartz reaction vessels, acidified topH= 2 with 85% H3PO4, and sparged with ultrahigh purity(UHP) He to remove inorganic carbon. The samples werethen saturated with UHP oxygen and irradiated with a2400W medium pressure mercury arc ultraviolet (UV) lampfor 4 h. The quartz reaction vessels were then connected to avacuum extraction line to purify and collect CO2 generatedfrom DOC oxidation. The CO2 was collected in 6mm ODPyrex tubes that were submitted to the University of ArizonaAccelerator Mass Spectrometry (AMS) Laboratory for d13Cand Δ14C analyses. d13C values were reported relative to PDBin standard notation as d13C= [(Rsample /Rstandard)� 1] * 103,where R is 13C/12C. Δ14C values, defined as the per mildeviation of a sample compared to the 14C activity ofnineteenth century wood, were corrected by d13C forfractionation. Total measurement uncertainty for Δ14C rangedbetween 4 and 11%. The SD for duplicate samples and stan-dards (oxalic acid II) was within 0.1% for d13C and 3.1%for Δ14C and that for replicate incubation bottles was ≤0.9%for d13C and ≤3.6% for Δ14C.[15] Selected water samples from the combined light +
bacteria incubations and the bacteria-only incubations wereanalyzed for DOC isotopes at t0 and tend. Samples from thelight-only incubations, however, were not measured due to
LU ET AL.: DOM IN STREAMS OF DIFFERENT LAND USE
4

cost constraints. The d13C and Δ14C values of the reactiveDOC pool (d13CReactive, Δ14CReactive) were calculated as
d13CReactive ¼ d13Ct0�DOCt0�d13Ctend�DOCtend
� �= DOCt0�DOCtendð Þ
(3)
Δ14CReactive ¼ Δ14Ct0�DOCt0�Δ14Ctend�DOCtend
� �= DOCt0�DOCtendð Þ
(4)
where d13Ct0 and Δ14Ct0 were the isotopic values of DOC att0 and d13Ctend and Δ14Ctend refer to those values at tend.
2.6. Excitation EmissionMatrix-Parallel Factor Analysis
[16] Differentiating between allochthonous/terrestrial andautochthonous/aquatic sources of DOM has historicallybeen analytically challenging and in recent years has beenfacilitated through the application of optical measurementsof DOM [e.g., Jaffé et al., 2008; Fellman et al., 2010].One technique presently in use to characterize compositionis based on the fluorescence characteristics of DOM, andwhile only a small fraction of DOM is actually fluorescent,these techniques have been shown to be sensitive and appro-priate for DOM characterizations and to correlate with DOCconcentration in freshwater systems [McKnight et al., 2001;Stedmon et al., 2003; Cory and McKnight, 2005]. In partic-ular, EEM-PARAFAC has the capacity to identify and quan-tify individual fluorescence components from the overallEEM spectra, which can be assigned to either allochthonousor autochthonous sources [Stedmon et al., 2003; Williams etal., 2010; Yamashita et al., 2011a].[17] Fluorescence measurements of stream water
DOM during experimental incubations were conducted onsamples at t0, tend and one intermediate sampling time (eitherday 4 or 5). The procedure has been described in detail inYamashita et al. [2011b]. Several post-acquisition stepswere involved in the correction of the fluorescence spectra.First, the UV-visible absorption spectra measured by adual-beam spectrophotometer were used for inner filtercorrections according to McKnight et al. [2001]. Followingthis procedure, the EEM of Milli-Q water was subtractedfrom sample EEMs. Second, the excitation correction factorsobtained monthly using rhodamine b, and the emission cor-rection factors supplied by the manufacturers, were appliedfor correction of our instrument-specific responses, e.g., per-formance of the gratings and the detector with wavelengths[Cory et al., 2010]. Finally, fluorescence intensity wascorrected to the area under the water Raman peak (excita-tion = 350 nm) analyzed daily and then converted to quininesulfate units (QSU). The PARAFAC model was constructedfollowing a statistical approach described in Stedmon et al.[2003], using wavelength ranges of 250 to 450 nm for
excitation and 290 to 520 nm for emission. The analysiswas carried out in MATLAB using the DOMFluor toolboxaccording to Stedmon and Bro [2008]. A five componentEEM-PARAFAC model (C1–-C5) was validated by split-half analysis and random initialization (Table 2). The rela-tive abundance of each of these five fluorescent components(Ci, i= 1 to 5) was calculated as
%Ci¼ Fci=TF � 100 ¼ Fci=ðX5
i¼1
FciÞ � 100 (5)
where FCi represented fluorescence intensity of each specificfluorescent component and TF was total fluorescenceintensity.
2.7. Ancillary Measurements
[18] Chlorophyll-a measurements followed Parsons et al.[1984] using a Turner Design TD-700 fluorometer. Dissolvednutrients (phosphate, nitrate, nitrite, and ammonium) weremeasured by a Dionex ion chromatograph, using an anionand cation mixture (Alltech anion Mix5, Dionex six cation-1standard) for constructing standard curves and Ion-96.3 riverwater from the Grand River, Ontario (Environment Canada),for confirming accuracy (measured values� 2s of certifiedvalues). The RSD for duplicate measurements was within14.4% for nitrate concentrations and 6.6% for ammonium.Phosphate and nitrite concentrations of all the samples werebelow the instrument’s limits of detection for these solutes(phosphate: 75mg/l; nitrite: 50mg/l) (Table 1).
2.8. Statistical Analyses
[19] The streams draining the three types of human landuse (i.e., pasture, cropland and urban) were grouped togetherfor certain of the datasets (i.e., k0P, k0B, %Ci) for statisticalanalyses because of the relatively small sample size and thelack of apparent differences in these datasets across the threetypes of human land use. This grouping ignores the differencesamong the three types of human-modified land use butidentifies differences between forested and human-modifiedwatersheds. Non-parametric Kruskal-Wallis tests wereconducted to compare data between treatments or land uses.[20] A stepwise linear regression model was used to
determine parameter(s) that best predict DOC reactivity. k0Pand k0B were set as dependent variables. All parameters att0 were evaluated as predictors, including DOC concentra-tion, relative abundance of the five fluorescent components(%C1 to %C5), d13C-DOC, Δ14C-DOC, nutrient concentra-tion (nitrate and ammonium), chlorophyll-a, and all in situenvironmental variables (i.e., water temperature, conductiv-ity, pH, and dissolved oxygen concentration) (Table 1). Error
Table 2. Characteristics of the Five Fluorescence Components Identified by PARAFAC and Their Attributed Sources
Component
ExcitationMaximumWavelength
EmissionMaximumWavelength
Similar Fluorescence Components Identified in Previous Studies
Major CompoundGroup AssignmentCoble et al. [1998]
Coryand McKnight [2005]
FCE Model[Yamashita et al., 2010]
C1 <250 (330) 442 A/C C10 C1 or C6 (Terrestrial) Fulvic acid-typeC2 260 (380) 504 - SQ1 C5 (Terrestrial) Humic acid-typeC3 <250 (305) 388 M Q3 or C3 C4 (Microbial) Microbial humic-likeC4 <250 324 B/T Tyr- or Trp-like C7 (Protein) Protein-likeC5 <250 430 A Q1 C2 (Terrestrial) Humic-like
LU ET AL.: DOM IN STREAMS OF DIFFERENT LAND USE
5

assumptions, including constant variance, linearity, andnormality, were examined using residuals versusu fitted plotsand Q-Q plots. The model selection was primarily based onR-square (RSQ) but also considered that the ratio betweenthe numbers of samples and predictors should be ≥ 5.Samples for which the studentized residue was larger thanthe Bonferroni correction value were identified as outliersand thus not included in the model. The significance level,a, was set at 0.05.
3. Results
3.1. Ambient Stream DOM Characteristics
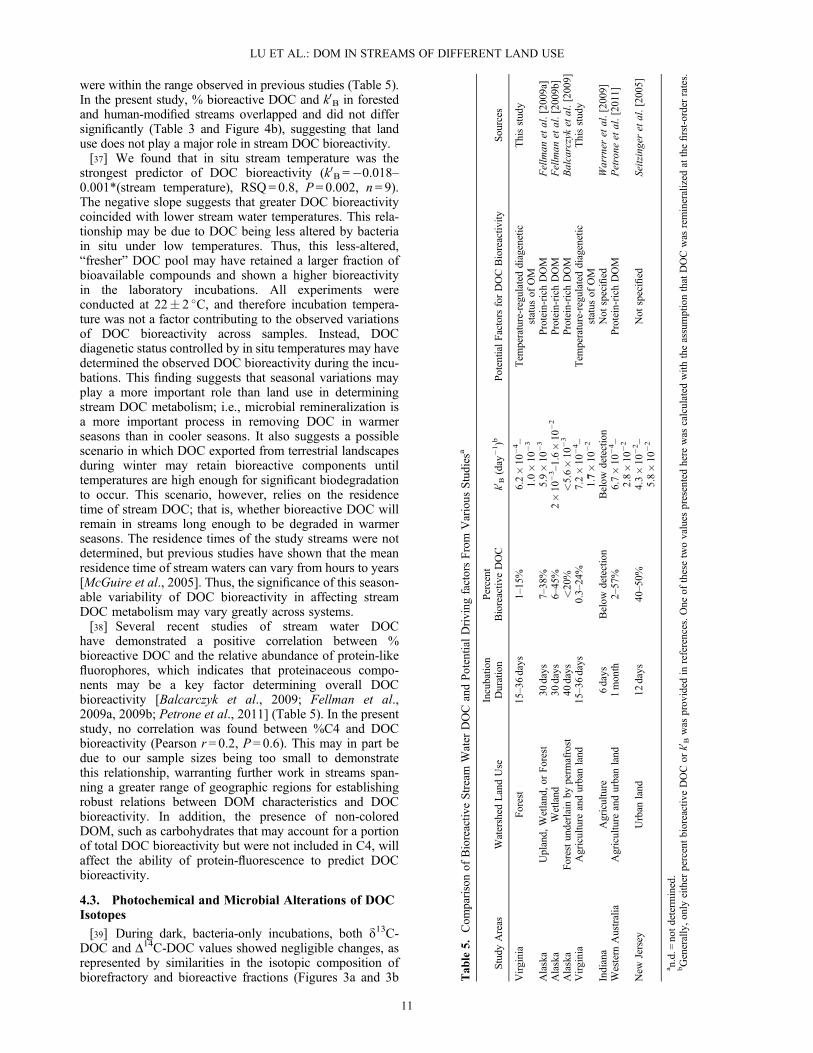
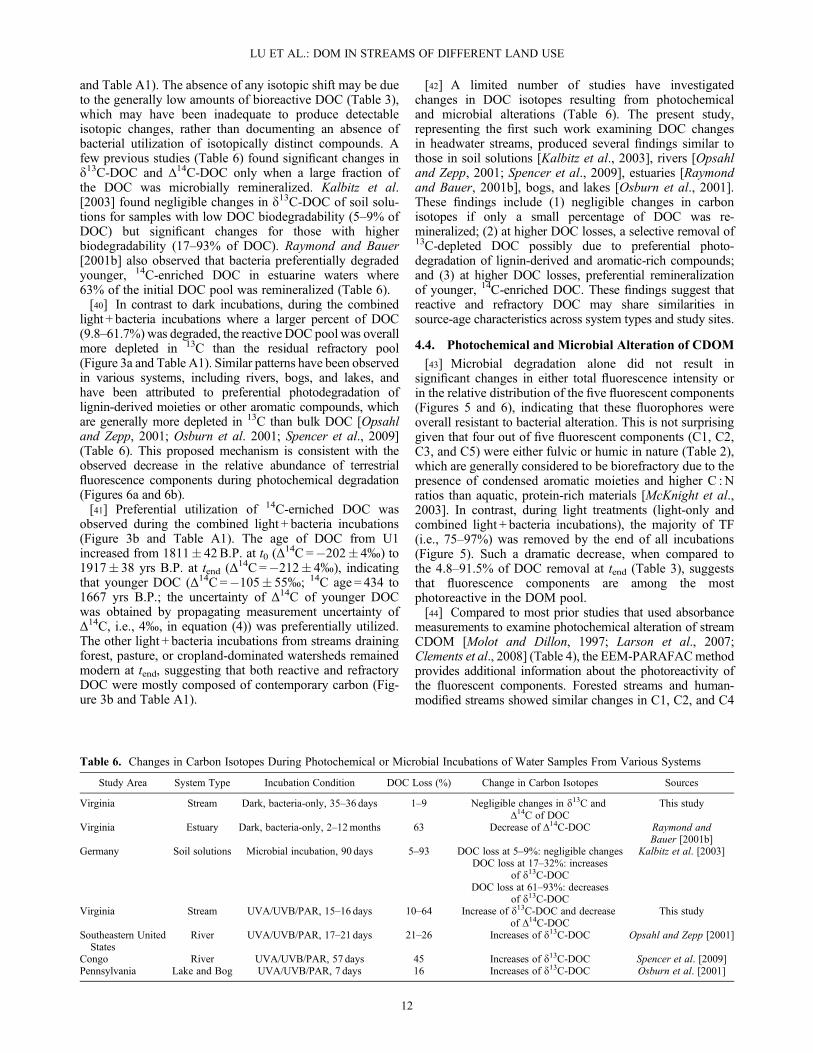
[21] Ambient (i.e., t0) DOM parameters were comparedbetween forested and human-modified streams. Although nostatistical differences were found in DOC concentration at t0(DOCt0) (Kruskal-Wallis test: P=0.8), DOCt0 values inforested streams were generally higher than in the human-modified streams (Figure 2a). The relative distributions of threeof the five DOM fluorescent components (i.e., %C1, %C2, and%C4) differed between the two stream types (Kruskal-Wallistest: P< 0.05 for %C1, %C2, and %C4) (Figure 2b).[22] The d13C and Δ14C of DOC at t0 did not show
systematic differences between forested and human-modifiedstreams and thus were presented according to their individualwatershed land use types (Figures 3a and 3b). d13C-DOCvalues at t0 ranged from �31.2% to �26.0% (Figure 3a).Streams draining forest, pasture, and cropland had enrichedΔ14C-DOC values ranging between 65% and 114%. Incontrast, the urban stream sample (U1) had significantlydepleted ambient Δ14C-DOC (�202� 4%) (Figure 3b).
3.2. Photoreactive and Bioreactive DOC
[23] DOC reactivity varied as a function of the three incu-bation treatments: light-only (i.e., bacteria-free), dark,bacteria-only, and combined light + bacteria incubations.The percent of photoreactive DOC ranged from 4.8 to56.9% and was higher than the percent of bioreactiveDOC, which varied from 0.3 to 23.9% (Table 3). Thepercent reactive DOC in the light + bacteria treatment washighest among the three incubation treatments and rangedover nearly an order of magnitude, from 9.8 to 91.5%(Table 3). The mean k0 value for each incubation treatment
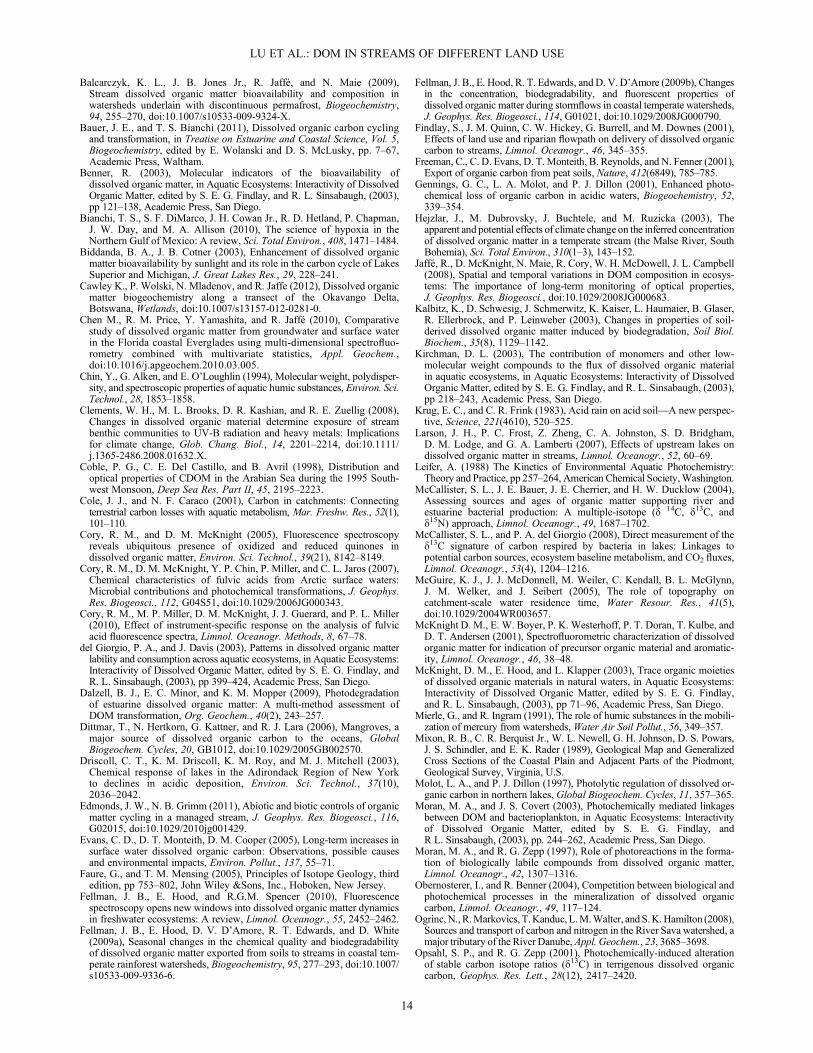
reflected the same general pattern, i.e., k0P+B> k0P> k0B(Figure 4a), and the mean k0 values were significantly differ-ent across the three treatments (Kruskal-Wallis test:P= 0.01) (Figure 4a). A significant positive correlation wasfound between k0P and k0 P+B (Pearson r= 0.9, P= 0.001)but not between k0B and k0P+B (Pearson r = 0.4, P= 0.3).Taken together, these data suggest that photochemistry wasmore effective in removing DOC than bacteria alone.Photochemical processes also played the dominant rolewhen DOC was remineralized in combined photochemicaland microbial incubations.[24] DOC reactivity also varied as a function of land use
type. Themean%reactive DOCwas higher in forested streamsthan in human-modified streams during the photoreactiveand combined incubations (Table 3). A similar pattern was ob-served for k0 values, where k0P and k0P+B for forested streamswere significantly higher than that for human-modified
1000
800
600
400
200
0Forested Streams
Human-modified Streams
DO
Ct0
(µM
)
(a)
Human-modified Streams
(b)
Ci%
50
40
30
20
10
0
C1%* C1%*
C2%*C2%*
C3%
C3%
C4%*
C4%*
C5%
C5%
Forested Streams
Figure 2. Box plot comparisons of DOM properties between forested and human-modified streams: (a)DOC concentrations at t0 (DOCt0) and (b) relative distributions of the five fluorescent components (%Ci).Asterisk (*) indicates significant differences between DOC from forest dominated streams and human mod-ified streams by Kruskal-Wallis tests. Open circle (○) represents mild outlier for C5, i.e., data beyond eitherthe upper/lower quartile � 1.5 inter-quartile range.
t0 Refractory DOC Reactive DOC
-50
-45
-40
-35
-30
-25
-20Forest Pasture Urban Cropland
δ13C
(‰
)
-220
-120
-20
80
180Forest Pasture Urban Cropland
Δ14C
(‰
)
(a)
(b)
Figure 3. (a) d13C and (b) Δ14C values of DOC at t0 and ofrefractory and reactive DOC during the combined light + bac-teria incubations. Error bars are� SD derived from averagingvalues of different streams within the same land use type.
LU ET AL.: DOM IN STREAMS OF DIFFERENT LAND USE
6

streams (Kruskal-Wallis test: k0P: P=0.03; k0P+B: P=0.03)(Figure 4b). In contrast, forested and human-modified streamshad comparable values of %bioreactive DOC (Table 3) andshowed no significant difference in k0B values (Kruskal-Wallistest: P=0.95; Figure 4b). Thus, both %reactive DOC and k0values indicate that DOC photoreactivity was higher in for-ested streams than in human-modified streams, while DOCbioreactivity was not affected by land use type.[25] The linear regression model selected %C2 as the best
predictor of k0P and in situ stream temperature as the bestpredictor of k0B.
3.3. d13C and Δ14C of Reactive and Refractory DOC
[26] During the bacteria-only incubations, changes inboth d13C-DOC and Δ14C-DOC values were within the mea-surement uncertainties (i.e., ≤0.2% for d13C and≤ 4–11% forΔ14C) (Table A1). During the six combined light + bacteriaincubations, however, five incubations showed a preferentialremoval of 13C-depleted DOC (Figure 3a and Table A1) anda concomitant enrichment in 13C in the remaining unoxidizedDOC. In addition, four of the combined light + bacteriaT
able
3.DOCConcentratio
nsandPercentages
ofPhotoreactiv
eandBioreactiv
eDOCin
theStudy
Streamsa
Site
Incubatio
nDate
DOC
att 0(mM)
DOCat
t endof
Photoreactiv
eIncubatio
nb(mM)
Photoreactiv
eDOCb(%
)�SDe
DOCat
t endof
Bioreactiv
eIncubatio
nc(mM)
Bioreactiv
eDOCc(%
)�SDe
DOCat
t endof
Photoreactiv
e+
Bioreactiv
eIncubatio
nd(mM)
Photoreactiv
e+
Bioreactiv
edDOC
(%)�
SDe
F1
08-18-2009
377
170
55.0
f373
1.1�3.0
144
61.7�0.4
F2
05-22-2009
817
n.d.
n.d.
740
9.4�1.2
411
49.7�0.41
F2
11-09-2009
539
267
50.5�1.4
468
13.2�1.6
4691.5�0.9
F3
11-09-2009
562
242
56.9�6.0
478
15.0�3.9
8385.3�0.9
P1
08-18-2009
748
591
21.3�0.5
720
3.8�1.6
602
19.5�0.1
P1
11-09-2009
675
587
12.6�0.01
662
1.9�1.2
568
15.9�2.8
P2
08-18-2009
154
138
10.6�0.3
126
17.9�0.6
130
15.4�0.8
P2
11-09-2009
206
139
32.3�6.1
157
23.9�0.04
103
50.0
�2.1
C1
05-22-2009
178
n.d.
n.d.
n.d.
14.0�1.2
101
43.1�3.8
U1
08-18-2009
267
254
4.8�5.8
254
0.3�0.4
241
9.8�0.7
ForestedStreams
(mean�SD)
574�182
318�187
54.1�3.3
515�157
9.7�6.2
171�165
72.1�9.7
Hum
an-m
odified
Streams(m
ean�SD)
371�267
342�231
10.3�9.7
384�285
16.3�10.7
291�234
25.6�16.6
a n.d.=
notdeterm
ined.
b0.2mm
filter,15
days,lig
ht.
c 0.7mm
filter,35-36days,dark.
d0.7mm
filter,10-15days,lig
ht.
e SD
(standarddeviation)
was
calculated
from
thereplicatebottles.
f SD
was
notprovided
becauseof
sampleloss.
k’(
day-
1) k
’(da
y-1)
0.2
0.15
0.1
0.05
Forested Streams Human-modified Streams
0.2
0.15
0.1
0.05
0P+BP B
(a)
(b)
P*
B
P+B*
P+B*
BP*
0
Figure 4. Box plot comparing first-order DOCremineralization rate constants, k0(day�1) of (a) the three incu-bation treatments and (b) the three types of k0 for forested andmodified streams. P = light-only; B=dark, bacteria-only; P+B= combined light + bacteria incubation; Asterisk (*) indicatessignificant difference between forested and human-modifiedstreams by Kruskal-Wallis tests. Open circle (○) indicates mildoutlier; closed circle (●) indicates extreme outlier, i.e., data be-yond either the upper/lower quartiles � 3inter-quartile range.
LU ET AL.: DOM IN STREAMS OF DIFFERENT LAND USE
7

incubations demonstrated a selective loss of 14C-enrichedDOC (Figure 3b and Table A1).
3.4. Changes in Fluorescence Properties During DOMDegradation
[27] Because changes in DOM fluorescence properties (i.e.,%Ci and TF) during light-only and combined light + bacteriaincubations were similar (Kruskal-Wallis test: P=1),these two treatments are presented and discussed together(Figures 5 and 6). This similarity further suggests that photo-chemistry played the dominant role in altering fluorescenceproperties under the combined effects of light and bacteria.[28] For stream water of all land use types, TF decreased
rapidly over the course of light incubations. TFt (TF at thesub-sampling time point t) was 13.6–40.6% of the initialTF (TFt0) at day 4 or 5 and decreased to 3.3–24.6% by theend of incubation (Figure 5). In contrast, alterations in TFin the dark, bacteria-only incubations were much smaller,with TFt within �15% of TFt0 at day 4 or 5 as well as atthe end of the incubations (Figure 5).[29] Based on the EEM spectral characteristics, C1, C2, C3,
C4, and C5 were categorized as terrestrial fulvic acid-type,terrestrial humic acid-type, microbial humic-like, protein-like, and humic-like components, respectively (Table 2).In both light treatments (i.e., light-only and combinedlight + bacteria incubations), significant changes occurred inthe relative abundance of most fluorescent components(Kruskal-Wallis test for comparing %Ci at t0 and tend:P≤ 0.002 for percentages of C1, C3, C4, and C5 and P=0.1for %C2) (Figures 6a and 6b). Samples from forested streamsand human-modified streams showed similar patterns:decreases in %C1 and increases in %C4 and %C5 at the endof the light incubations (Figures 6a and 6b). In contrast, nosignificant changes were observed in the relative abundancesof any of the fluorescent components during the dark,
bacteria-only incubations (Kruskal-Wallis test: P≥ 0.2 for %C1–%C5) (Figures 6a and 6b).
4. Discussion
4.1. Ambient Properties of DOM From DifferentWatersheds
[30] Ambient DOM properties at t0 of incubationsestablished its baseline characteristics during photochemi-cal and microbial degradation. Both similarities anddifferences in ambient stream water DOM characteristicswere found between forested streams and human-modified streams. The similarities were reflected by (1)the dominance of terrestrial humic-like fluorescent compo-nents (i.e., C1 and C2) in both stream types (Figure 2b andTable 2) [Coble et al., 1998; Cory and Mcknight, 2005],suggesting that terrestrial DOM dominated in all streams,and (2) the ranges of d13C values exhibited by forestedstreams (�28.7 to �28.3%) and human-modified streams(�31.2 to �26%) (Figure 3a and Table A1), which bothfell within the ranges for C3 plants, soil organic matter,freshwater algae, and petroleum-derived chemicals [Faureand Mensing, 2005; Ogrinc et al., 2008]. Differences inthe DOM from the two watershed types were revealed intwo ways. First, the larger range in d13C-DOC in streamsfrom human-modified streams than in forested streamsmay suggest the former has more variable sources thanthe latter. Second, %C1 and %C2 were higher in forestedstream water DOM, and %C4 was higher in human-modified stream DOM (Figure 2b). C4 has been related tomi-crobial consumption and production [Balcarczyk et al., 2009;Fellman et al., 2009a, 2009b] (Table 2). Thus, forestedstreams contained higher contributions of terrestrial DOMbut lower percentages of microbial DOM than human-modified streams on the basis of %Ci. Similar enrichment ofmicrobial fluorescence components in waters from streamsimpacted by human activities including agricultural activitiesor forest management have been reported recently [Williamset al., 2010; Yamashita et al., 2011a].[31] Besides these general differences in DOM character-
istics between forested and human-modified streams, thestream draining the urban watershed (U1) was the onlysystem containing highly aged DOC (mean 14C age =~1,811� 42 years B.P.) (Figure 3b and Table A1). DOCfrom all of the other study streams was post-bomb innature, i.e., contained atmospheric CO2 that was fixedphotosynthetically since the period of thermonuclearweapons testing in the 1950s and 1960s. This indicatesthat the DOC in all streams except U1 was dominated bycarbon fixed and exported from watersheds on timescalesof years to decades. On the other hand, U1 was potentiallyinfluenced by two aged carbon sources in the urbanwatershed: (1) autotrophic fixation of aged dissolvedinorganic carbon derived from the dissolution of sedi-mentary shell carbonate, which is mostly of Tertiary age[Roberts, 1932; Mixon et al., 1989; Geological Map ofVirginia, Virginia Department of Mines Minerals andEnergy] and (2) fossil fuel-derived organic substances(e.g., petroleum hydrocarbons) released by human activ-ity (Y. H. Lu et al., Effects of land use on sources andages of inorganic and organic carbon in temperate head-water streams, submitted to Biogeochemistry, 2013).
TF t/T
F t0(%
)
0
20
40
60
80
100
120
0 10 20 30 40
Dark
Light
At t0: TFt/TFt0=100%
Day of Incubation
Figure 5. Changes in total fluorescence intensity (TF) overthe course of dark (bacteria-only) incubations and light(light-only and combined light + bacteria) incubations.TFt0 = TF at the initial time point and TFt=TF at eachsubsampling time point.
LU ET AL.: DOM IN STREAMS OF DIFFERENT LAND USE
8

4.2. Factors Impacting Headwater Stream DOCPhotoreactivity[32] The %photoreactive DOC and k0P varied between
5 and 57%, and 0.045 and 0.055 day�1, respectively (Table 3and Figure 4a). These values are comparable to ranges previ-ously observed for stream water DOC, which are frombelow detection to ~50% for % photoreactive DOC and frombelow detection to 0.062 day�1 for k0P (summarized inTable 4). The % reactive DOC and k0 values during thelight-only and light + bacteria incubations were overallhigher than those during the dark, microbial incubations(Table 3 and Figure 4a), indicating that photochemicalprocesses are more effective in remineralizing DOC thanbacteria alone in the study streams. These findings areconsistent with the general notion that stream DOC hasrelatively high photoreactivity and low bioreactivity due tothe predominance of terrestrial DOC sources [McKnightet al., 2003; Dittmar et al., 2006; Sulzberger and Durisch-Kaiser, 2009].[33] Forested streams displayed higher %photoreactive
DOC and %photoreactive + bioreactive DOC than human-modified streams (Figure 4b). Consequently, the mean DOCconcentration at tend was higher in human-modified streams
than in forested streams, although the mean DOC concentra-tion was higher in forested streams at t0 (Table 3). There aretwo possible reasons for the higher photoreactivity of DOCin forested streams than in human-modifed streams. First,terrestrial DOM is generally more photoreactive relative tomicrobial and planktonic materials, due to a higher abundanceof aromatic components [Chin et al., 1994; Dittmar et al.,2006; Sulzberger and Durisch-Kaiser, 2009]. The greaterproportion of terrestrial materials in forested streams than inhuman-modified streams (Figure 2b) thus may have led tohigher DOC photoreactivity in forested streams. In fact, wefound that the variability in DOC photoreactivity for allstreams was best predicted by %C2 (k0P =�0.042+ 0.003*(%C2), RSQ=0.7, P=0.006, n=8) and was reasonably pred-icated by %C1 (RSQ=0.6, P=0.02). These quantitative rela-tionships between DOC photoreactivity and the abundance ofterrestrial humic-like components indicate the importance ofDOM sources to DOC photoreactivity—that is, streamscontaining a larger percentage of terrestrial-derived DOM tendto have greater DOC photoreactivity. While the importance ofthe relative contribution of terrestrial DOM to DOCphotoreactivity has been long recognized for lake and oceanwaters [Thomas and Lara, 1995; Moran and Zepp, 1997;
Light treatments (including light-only and combined light+bacterial incubations) at day 4 or 5
Light treatments (including light-only and combined light+bacterial incubations) at day 10 or 15
t0
Bacteria-only incubations at day 4 or 5
Bacteria-only incubations at tend : day 35 or 36
0
10
20
30
40
50
%C1 %C2 %C3 %C4 %C5
Ci (
%)
0
10
20
30
40
50
%C1 %C2 %C3 %C4 %C5
Ci (
%)
Forested Streams
Human-modified Streams
(a)
(b)
Figure 6. Changes in relative abundances of the five fluorescent components during light and darkincubations of DOC from (a) forest-dominated and (b) human-modified streams. Error bars are � SDderived from averaging values of different streams of the same land use and replicate bottles for eachtreatment.
LU ET AL.: DOM IN STREAMS OF DIFFERENT LAND USE
9

Obernosterer and Benner, 2004], this is to our knowledge thefirst study to demonstrate this relationship quantitatively instreams. We further show that the EEM-PARAFAC methodmay provide a potential tool for predicting stream DOCphotoreactivity.[34] Another factor leading to different photoreactivity
between forested stream DOC and human-modified streamDOC is light exposure history, which has been highlightedin several previous studies of freshwater DOC photoreactivity[Molot and Dillon, 1997; Biddanda and Cotner, 2003; Larsonet al., 2007]. In the present study, we did not measure theamount of solar radiation to which DOC has been exposedbefore sample collection and incubation and thus cannotdirectly evaluate the importance of light exporsure history indetermining DOC photoreactivity. However, %C5 may beindicative of photoexposure history of the DOM because theC5 component has been previously found to be photo-stableand considered a photodegradation product of terrestrialhumic-like DOM [Stedmon et al., 2007; Chen et al., 2010;Cawley et al., 2012]. The %C5 in stream water DOM at t0,while not statistically different between forested and human-modified watersheds (Kruskal-Wallis test: P=0.8), washigher in human-modified streams (Figure 2b), agreeing withour observation that light penetration was generally higher inhuman-modified watersheds than in forested ones that shadestreams. Thus, DOM in the human-modified streams mayhave been photodegraded to a greater extent than in theforested streams, retained lower amounts of photoreactivecomponents, and thus showed lower DOC photoreactivity.However, we did not find a significant correlation between%C5 and DOC photoreactivity (Pearson r=0.4, P=0.3),which may suggest that light exposure history plays a second-ary role less important than DOM sources in determiningDOC photoreactivity.[35] Compared to prior work that has focused primarily on
streams draining forest-dominated landscapes (Table 4), thepresent study provides one of the few comparisons of DOCphotoreactivity in a regional group of streams draining forestedand human-modified watersheds and illustrates the importanceof land use on the photoreactivity of DOM exported fromupstream watersheds. We attribute the observed difference inphotoreactivity of DOC between forested and human-modified watersheds to a combination of higher %terrestrialDOM and lower amounts of previous light exposure for the for-ested streams. These two characteristics may represent commondifferences betweenDOMoriginating from forestedwatershedsand DOM form human-modified watersheds. For example,previous studies have also shown that streams in undisturbedforested environments have an enriched terrestrial humic-likefluorescence signature in DOM than those disturbed by humanactivities [Williams et al., 2010; Yamashita et al., 2011a].Further, a fluorescence component possibly representing exten-sive light exposure has been found to be highly enriched inDOM draining agricultural watersheds [Yamashita et al.,2010]. It is thus reasonable to generalize the observations inthe present study to other temperate systems that human landuse may decrease the photoreactivity of DOC from streams.
4.3. Factors Impacting Headwater Stream DOCBioreactivity
[36] The% bioreactive DOC and k0B values ranged between0.3 and 24%, and 6.2*10�4 and 1.7*10�2, respectively, andT
able
4.Com
parisonof
Photoreactiv
eStream
Water
DOCandChanges
inCDOM
From
Various
Studies
a
Study
Areas
Watershed
LandUse
Light
Sources
Incubatio
nDuration
Percent
Photoreactiv
eDOC
k0P(day
�1)b
Changes
inCDOM
Sources
Virginia
Forest
UVB/UVA/
PAR
15days
51–5
7%0.045–0.055
Decreaseof
TFby
~85%
onaverageandchanges
ofrelativ
eabundanceof
fluorophores
Thisstudy
SouthernCanada
Forest
UVB/UVA/
PAR
6–11
days
11–5
0%0.017–0.062
Truecolorcdecreasedby
0–77%
Molot
andDillon
[1997]
NorthernGreat
Lakes
Region
Forest
UVB/UVA/
PAR
56h
6%0.026
Absorbanceat
320nm
reducedby
~10%
Larsonet
al.[2007]
Colorado
Forestandmeadow
UVB
24h
10–2
0%0.11–0
.22
SpecificUV
absorbance
at254nm
(SUVa)
reducedby
~22%
Clementset
al.[2008]
New
Jersey
Forestor
pasture
UVB/UVA/
PAR
21.5–38h
Below
detection
Below
detection
n.d.
Wiegner
andSeitzinger[2001]
Virginia
Agriculture
andurban
watersheds
UVB/UVA/
PAR
15days
5–32%
0.005–0.022
Decreaseof
TFby
~91%
onaverageand
changesof
relativ
eabundanceof
fluorophores
Thisstudy
a n.d.=
notdeterm
ined
bGenerally,o
nlyeither
percentp
hotoreactiv
eDOCor
k0Pwas
provided
inreferences.O
neof
thesetwovalues
presentedhere
was
calculated
with
theassumptionthatDOCwas
remineralized
atthefirst-orderrates.
c Truecolor:amethoddesigned
toem
ulateHazen
units,which
definedwater
coloras
1.35*(broadbandabsorbance
at405–450nm
)–1.68*(broadbandabsorbance
at660–740nm
)[M
ierleandIngram
,1991].
LU ET AL.: DOM IN STREAMS OF DIFFERENT LAND USE
10
were within the range observed in previous studies (Table 5).In the present study, % bioreactive DOC and k0B in forestedand human-modified streams overlapped and did not differsignificantly (Table 3 and Figure 4b), suggesting that landuse does not play a major role in stream DOC bioreactivity.[37] We found that in situ stream temperature was the
strongest predictor of DOC bioreactivity (k0B =�0.018–0.001*(stream temperature), RSQ= 0.8, P= 0.002, n = 9).The negative slope suggests that greater DOC bioreactivitycoincided with lower stream water temperatures. This rela-tionship may be due to DOC being less altered by bacteriain situ under low temperatures. Thus, this less-altered,“fresher” DOC pool may have retained a larger fraction ofbioavailable compounds and shown a higher bioreactivityin the laboratory incubations. All experiments wereconducted at 22� 2 �C, and therefore incubation tempera-ture was not a factor contributing to the observed variationsof DOC bioreactivity across samples. Instead, DOCdiagenetic status controlled by in situ temperatures may havedetermined the observed DOC bioreactivity during the incu-bations. This finding suggests that seasonal variations mayplay a more important role than land use in determiningstream DOC metabolism; i.e., microbial remineralization isa more important process in removing DOC in warmerseasons than in cooler seasons. It also suggests a possiblescenario in which DOC exported from terrestrial landscapesduring winter may retain bioreactive components untiltemperatures are high enough for significant biodegradationto occur. This scenario, however, relies on the residencetime of stream DOC; that is, whether bioreactive DOC willremain in streams long enough to be degraded in warmerseasons. The residence times of the study streams were notdetermined, but previous studies have shown that the meanresidence time of stream waters can vary from hours to years[McGuire et al., 2005]. Thus, the significance of this season-able variability of DOC bioreactivity in affecting streamDOC metabolism may vary greatly across systems.[38] Several recent studies of stream water DOC
have demonstrated a positive correlation between %bioreactive DOC and the relative abundance of protein-likefluorophores, which indicates that proteinaceous compo-nents may be a key factor determining overall DOCbioreactivity [Balcarczyk et al., 2009; Fellman et al.,2009a, 2009b; Petrone et al., 2011] (Table 5). In the presentstudy, no correlation was found between %C4 and DOCbioreactivity (Pearson r = 0.2, P= 0.6). This may in part bedue to our sample sizes being too small to demonstratethis relationship, warranting further work in streams span-ning a greater range of geographic regions for establishingrobust relations between DOM characteristics and DOCbioreactivity. In addition, the presence of non-coloredDOM, such as carbohydrates that may account for a portionof total DOC bioreactivity but were not included in C4, willaffect the ability of protein-fluorescence to predict DOCbioreactivity.
4.3. Photochemical and Microbial Alterations of DOCIsotopes
[39] During dark, bacteria-only incubations, both d13C-DOC and Δ14C-DOC values showed negligible changes, asrepresented by similarities in the isotopic composition ofbiorefractory and bioreactive fractions (Figures 3a and 3b Tab
le5.
Com
parisonof
Bioreactiv
eStream
Water
DOCandPotentialDriving
factorsFrom
Various
Studies
a
Study
Areas
Watershed
LandUse
Incubatio
nDuration
Percent
Bioreactiv
eDOC
k0B(day
�1)b
PotentialFactorsforDOCBioreactiv
itySources
Virginia
Forest
15–3
6days
1–15%
6.2�10
�4–
1.0�10
�3
Tem
perature-regulated
diagenetic
status
ofOM
Thisstudy
Alaska
Upland,
Wetland,or
Forest
30days
7–38%
5.9�10
�3
Protein-richDOM
Fellman
etal.[2009a]
Alaska
Wetland
30days
6–45%
2�10
�3–1
.6�10
�2Protein-richDOM
Fellman
etal.[2009b]
Alaska
Forestunderlainby
perm
afrost
40days
<20%
<5.6�10
�3
Protein-richDOM
Balcarczyket
al.[2009]
Virginia
Agriculture
andurbanland
15–3
6days
0.3–24%
7.2�10
�4–
1.7�10
�2
Tem
perature-regulated
diagenetic
status
ofOM
Thisstudy
Indiana
Agriculture
6days
Below
detection
Below
detection
Not
specified
Warrner
etal.[2009]
Western
Australia
Agriculture
andurbanland
1month
2–57%
6.7�10
�4–
2.8�10
�2
Protein-richDOM
Petrone
etal.[2011]
New
Jersey
Urban
land
12days
40–50%
4.3�10
�2–
5.8�10
�2
Not
specified
Seitzingeret
al.[2005]
a n.d.=
notdeterm
ined.
bGenerally,o
nlyeither
percentbioreactiveDOCor
k0Bwas
provided
inreferences.O
neof
thesetwovalues
presentedhere
was
calculated
with
theassumptionthatDOCwas
remineralized
atthefirst-orderrates.
LU ET AL.: DOM IN STREAMS OF DIFFERENT LAND USE
11
and Table A1). The absence of any isotopic shift may be dueto the generally low amounts of bioreactive DOC (Table 3),which may have been inadequate to produce detectableisotopic changes, rather than documenting an absence ofbacterial utilization of isotopically distinct compounds. Afew previous studies (Table 6) found significant changes ind13C-DOC and Δ14C-DOC only when a large fraction ofthe DOC was microbially remineralized. Kalbitz et al.[2003] found negligible changes in d13C-DOC of soil solu-tions for samples with low DOC biodegradability (5–9% ofDOC) but significant changes for those with higherbiodegradability (17–93% of DOC). Raymond and Bauer[2001b] also observed that bacteria preferentially degradedyounger, 14C-enriched DOC in estuarine waters where63% of the initial DOC pool was remineralized (Table 6).[40] In contrast to dark incubations, during the combined
light + bacteria incubations where a larger percent of DOC(9.8–61.7%) was degraded, the reactive DOC pool was overallmore depleted in 13C than the residual refractory pool(Figure 3a and Table A1). Similar patterns have been observedin various systems, including rivers, bogs, and lakes, andhave been attributed to preferential photodegradation oflignin-derived moieties or other aromatic compounds, whichare generally more depleted in 13C than bulk DOC [Opsahland Zepp, 2001; Osburn et al. 2001; Spencer et al., 2009](Table 6). This proposed mechanism is consistent with theobserved decrease in the relative abundance of terrestrialfluorescence components during photochemical degradation(Figures 6a and 6b).[41] Preferential utilization of 14C-erniched DOC was
observed during the combined light + bacteria incubations(Figure 3b and Table A1). The age of DOC from U1increased from 1811� 42B.P. at t0 (Δ
14C =�202� 4%) to1917� 38 yrs B.P. at tend (Δ14C =�212� 4%), indicatingthat younger DOC (Δ14C =�105� 55%; 14C age = 434 to1667 yrs B.P.; the uncertainty of Δ14C of younger DOCwas obtained by propagating measurement uncertainty ofΔ14C, i.e., 4%, in equation (4)) was preferentially utilized.The other light + bacteria incubations from streams drainingforest, pasture, or cropland-dominated watersheds remainedmodern at tend, suggesting that both reactive and refractoryDOC were mostly composed of contemporary carbon (Fig-ure 3b and Table A1).
[42] A limited number of studies have investigatedchanges in DOC isotopes resulting from photochemicaland microbial alterations (Table 6). The present study,representing the first such work examining DOC changesin headwater streams, produced several findings similar tothose in soil solutions [Kalbitz et al., 2003], rivers [Opsahland Zepp, 2001; Spencer et al., 2009], estuaries [Raymondand Bauer, 2001b], bogs, and lakes [Osburn et al., 2001].These findings include (1) negligible changes in carbonisotopes if only a small percentage of DOC was re-mineralized; (2) at higher DOC losses, a selective removal of13C-depleted DOC possibly due to preferential photo-degradation of lignin-derived and aromatic-rich compounds;and (3) at higher DOC losses, preferential remineralizationof younger, 14C-enriched DOC. These findings suggest thatreactive and refractory DOC may share similarities insource-age characteristics across system types and study sites.
4.4. Photochemical and Microbial Alteration of CDOM
[43] Microbial degradation alone did not result insignificant changes in either total fluorescence intensity orin the relative distribution of the five fluorescent components(Figures 5 and 6), indicating that these fluorophores wereoverall resistant to bacterial alteration. This is not surprisinggiven that four out of five fluorescent components (C1, C2,C3, and C5) were either fulvic or humic in nature (Table 2),which are generally considered to be biorefractory due to thepresence of condensed aromatic moieties and higher C :Nratios than aquatic, protein-rich materials [McKnight et al.,2003]. In contrast, during light treatments (light-only andcombined light + bacteria incubations), the majority of TF(i.e., 75–97%) was removed by the end of all incubations(Figure 5). Such a dramatic decrease, when compared tothe 4.8–91.5% of DOC removal at tend (Table 3), suggeststhat fluorescence components are among the mostphotoreactive in the DOM pool.[44] Compared to most prior studies that used absorbance
measurements to examine photochemical alteration of streamCDOM [Molot and Dillon, 1997; Larson et al., 2007;Clements et al., 2008] (Table 4), the EEM-PARAFACmethodprovides additional information about the photoreactivity ofthe fluorescent components. Forested streams and human-modified streams showed similar changes in C1, C2, and C4
Table 6. Changes in Carbon Isotopes During Photochemical or Microbial Incubations of Water Samples From Various Systems
Study Area System Type Incubation Condition DOC Loss (%) Change in Carbon Isotopes Sources
Virginia Stream Dark, bacteria-only, 35–36 days 1–9 Negligible changes in d13C andΔ14C of DOC
This study
Virginia Estuary Dark, bacteria-only, 2–12months 63 Decrease of Δ14C-DOC Raymond andBauer [2001b]
Germany Soil solutions Microbial incubation, 90 days 5–93 DOC loss at 5–9%: negligible changes Kalbitz et al. [2003]DOC loss at 17–32%: increases
of d13C-DOCDOC loss at 61–93%: decreases
of d13C-DOCVirginia Stream UVA/UVB/PAR, 15–16 days 10–64 Increase of d13C-DOC and decrease
of Δ14C-DOCThis study
Southeastern UnitedStates
River UVA/UVB/PAR, 17–21 days 21–26 Increases of d13C-DOC Opsahl and Zepp [2001]
Congo River UVA/UVB/PAR, 57 days 45 Increases of d13C-DOC Spencer et al. [2009]Pennsylvania Lake and Bog UVA/UVB/PAR, 7 days 16 Increases of d13C-DOC Osburn et al. [2001]
LU ET AL.: DOM IN STREAMS OF DIFFERENT LAND USE
12

during the light incubations; i.e., the percentages of C1 and C2decreased and C4 increased (Figures 6a and 6b), indicatingterrestrial humic-like fluorophores were relatively morephotoreactive than microbially derived fluorophores. Thismay in part be explained by the presence of a variety offluorescence structures (i.e., aromatic and unsaturated aliphaticmoieties) in fulvic and humic macromolecules derived fromterrestrial plants. This observation is also consistent with theincrease in d13C-DOC during the combined light + bacteriadegradation, which also suggests a selective removal of terres-trial DOC (Figure 3a). On the other hand, the relatively higherphoto-resistance of protein-like fluorophores has also beenobserved in DOM from streams and lakes draining Arctictundra [Cory et al., 2007]. Furthermore, all of our incubationsshowed increases in %C5, substantiating the previous expla-nation of fluorescence components similar to C5 as a productof photodegradation of terrestrial humic-like DOM [Stedmonet al., 2007; Chen et al., 2010; Cawley et al., 2012].
5. Effects of Watershed Land Use on DOMReactivity and Implications for DOM Metabolism
[45] The present study provides a unique comparison ofphotochemical and microbial transformations of DOM fromstreams draining a geographically related set of forested andhuman-modified watersheds. A number of major differencesin the amounts and characteristics of DOM were observedbetween watershed types, with consequent implications forthe metabolism of DOM within stream waters and subse-quent downstream fluxes.[46] First, we found that DOC in streams draining
forested systems had significantly higher photoreactivitythan in streams draining human-modified watersheds, whichled to higher mean DOC concentrations in human-modifiedstreams than in forested streams following photochemicalonly or photochemical + bacterial incubations. This findingprovides another possible mechanism for the decadalincrease in surface water DOC concentrations in Europe andNorth America [Hejzlar et al., 2003; Evans et al., 2005;Skjelkvåle et al., 2005]. The finding has further implicationsfor water quality in downstream environments, where watermovement, chemistry, and microbes can be different for thephotoresistant upstream DOC to be remineralized andcontribute to oxygen consumption [Sobczak et al., 2002]. Assuch, photo-resistant DOC from upstream sources may be anunrecognized pool of OM contributing to the downstreamformation of hypoxia that has plagued many coastal areas fordecades [Bianchi et al., 2010]. Future studies should assessthe relative importance of quality vs. quantity of upstreamDOC in hypoxia formation, which may contribute to thedevelopment of more effective watershed managementpractices.[47] Second, DOC bioreactivity did not differ significantly
among land use types but instead varied as a function ofin situ stream temperatures, which may control DOCbioreactivity by regulating its diagenetic status. This findingsuggests that temperature is more important than land use incontrolling the amount of DOC being remineralized instreams of temperate regions. During colder times of theyear, bioreactive DOC components are more likely to persistand be transported to downstream waters than in warmerseasons. From the perspective of alleviating coastal hypoxia,
this finding suggests that it is more important to control theamount of DOC exported from upstream watersheds incolder seasons than in warmer seasons. Since managementpractices do not presently consider the effects of bioreactiveDOC from terrestrial sources on hypoxia, we recommendthat this organic matter source be incorporated into waterquality models.[48] The third main finding is based on our isotopic and
CDOM data, which showed that reactive and refractoryDOM pools remineralized during photochemical and micro-bial alterations shared similar characteristics across watershedland use types. Photochemical alteration, the dominant processcontributing to DOC remineralization, alters the isotopic andCDOM properties of DOM, thereby reducing or removingthe original source signatures and leaving behind resistantDOM that has similar characteristics across land use types.Consequently, using isotopic and fluorescence signaturesto assess the proportion of allochthonous versus aquaticDOM in large, homogeneous downstream systems mayunderestimate the contributions and importance of upstream,allochthonous DOM to downstream metabolism. Identifica-tion and application of novel tracers that are resistant tophotodegradation is therefore important for a reliableassessment of transit and metabolism of DOM exported fromupstream watersheds.[49] Last, we emphasize the variability of DOC reactivity in
streams as shown in the present as well as previous research,suggesting future work on streams from different environmen-tal settings (i.e., temperature/climatic zones, hydrogeology,and lithology) should strive to understand factors driving thisvariability. This is a necessary step to better constrain theinfluence of human land use on stream DOC reactivity andinformation from such studies should be incorporated intoregional or global models of carbon dynamics and manage-ment policies. Related to this, it is important to develop rapid,convenient approaches for consistent, long-term monitoringof stream DOC reactivity. We recommend exploring thepotential of measuring %terrestrial fluorophores using EEM-PARAFAC as a rapid and inexpensive approach for monitor-ing stream DOC photoreactivity and stream water temperaturefor stream water DOC bioreactivity.
[50] Acknowledgments. We thank Edward Keesee, Erin Ferer,Christina Pondell, Sarah Schillawski, and Rachel Sipler for helping with fieldsampling and laboratory work. Jim Kaste provided the access to ion chroma-tography and helped with the analyses of cations and anions. We also thankTimothy Russell and Stuart Hamilton for their help with ArcGIS. This paperis contribution 3270 of the Virginia Institute of Marine Science, College ofWilliam and Mary, and 607 of the Southeast Environmental Research Center.This study was funded by a Mellon Foundation Postdoctoral Fellow Grantfrom The College of William and Mary and by the National Science Founda-tion through DEB Ecosystems grant DEB 0234533, Chemical Oceanographygrant OCE 0327423, and Integrated Carbon Cycle Research Program grantEAR 0403949 to J.E.B, and in collaboration with the Florida Coastal Ever-glades Long-Term Ecological Research program under National ScienceFoundation Grant DBI-0620409 to R.J. E.A.C. acknowledges support fromthe National Science Foundation during preparation of this manuscript (OCE0962277, EAR 1003529, and DEB Ecosystems 0542645). Two anonymousreviewers provided constructive comments that have helped to improve thequality of this paper significantly.
ReferencesAufdenkampe, A. K., E. Mayorga, P. A. Raymond, J. M. Melack, S. Doney,S. R. Aline, R. E. Aaltor, and K. Yoo (2011), Riverine coupling ofbiogeochemical cycles between land, oceans, and atmosphere, Front.Ecol. Environ., 9(1), 53–60, doi:10.1890/100014.
LU ET AL.: DOM IN STREAMS OF DIFFERENT LAND USE
13
Balcarczyk, K. L., J. B. Jones Jr., R. Jaffé, and N. Maie (2009),Stream dissolved organic matter bioavailability and composition inwatersheds underlain with discontinuous permafrost, Biogeochemistry,94, 255–270, doi:10.1007/s10533-009-9324-X.
Bauer, J. E., and T. S. Bianchi (2011), Dissolved organic carbon cyclingand transformation, in Treatise on Estuarine and Coastal Science, Vol. 5,Biogeochemistry, edited by E. Wolanski and D. S. McLusky, pp. 7–67,Academic Press, Waltham.
Benner, R. (2003), Molecular indicators of the bioavailability ofdissolved organic matter, in Aquatic Ecosystems: Interactivity of DissolvedOrganic Matter, edited by S. E. G. Findlay, and R. L. Sinsabaugh, (2003),pp 121–138, Academic Press, San Diego.
Bianchi, T. S., S. F. DiMarco, J. H. Cowan Jr., R. D. Hetland, P. Chapman,J. W. Day, and M. A. Allison (2010), The science of hypoxia in theNorthern Gulf of Mexico: A review, Sci. Total Environ., 408, 1471–1484.
Biddanda, B. A., J. B. Cotner (2003), Enhancement of dissolved organicmatter bioavailability by sunlight and its role in the carbon cycle of LakesSuperior and Michigan, J. Great Lakes Res., 29, 228–241.
Cawley K., P. Wolski, N. Mladenov, and R. Jaffe (2012), Dissolved organicmatter biogeochemistry along a transect of the Okavango Delta,Botswana, Wetlands, doi:10.1007/s13157-012-0281-0.
Chen M., R. M. Price, Y. Yamashita, and R. Jaffé (2010), Comparativestudy of dissolved organic matter from groundwater and surface waterin the Florida coastal Everglades using multi-dimensional spectrofluo-rometry combined with multivariate statistics, Appl. Geochem.,doi:10.1016/j.apgeochem.2010.03.005.
Chin, Y., G. Alken, and E. O’Loughlin (1994), Molecular weight, polydisper-sity, and spectroscopic properties of aquatic humic substances, Environ. Sci.Technol., 28, 1853–1858.
Clements, W. H., M. L. Brooks, D. R. Kashian, and R. E. Zuellig (2008),Changes in dissolved organic material determine exposure of streambenthic communities to UV-B radiation and heavy metals: Implicationsfor climate change, Glob. Chang. Biol., 14, 2201–2214, doi:10.1111/j.1365-2486.2008.01632.X.
Coble, P. G., C. E. Del Castillo, and B. Avril (1998), Distribution andoptical properties of CDOM in the Arabian Sea during the 1995 South-west Monsoon, Deep Sea Res. Part II, 45, 2195–2223.
Cole, J. J., and N. F. Caraco (2001), Carbon in catchments: Connectingterrestrial carbon losses with aquatic metabolism, Mar. Freshw. Res., 52(1),101–110.
Cory, R. M., and D. M. McKnight (2005), Fluorescence spectroscopyreveals ubiquitous presence of oxidized and reduced quinones indissolved organic matter, Environ. Sci. Technol., 39(21), 8142–8149.
Cory, R. M., D. M. McKnight, Y. P. Chin, P. Miller, and C. L. Jaros (2007),Chemical characteristics of fulvic acids from Arctic surface waters:Microbial contributions and photochemical transformations, J. Geophys.Res. Biogeosci., 112, G04S51, doi:10.1029/2006JG000343.
Cory, R. M., M. P. Miller, D. M. McKnight, J. J. Guerard, and P. L. Miller(2010), Effect of instrument-specific response on the analysis of fulvicacid fluorescence spectra, Limnol. Oceanogr. Methods, 8, 67–78.
del Giorgio, P. A., and J. Davis (2003), Patterns in dissolved organic matterlability and consumption across aquatic ecosystems, in Aquatic Ecosystems:Interactivity of Dissolved Organic Matter, edited by S. E. G. Findlay, andR. L. Sinsabaugh, (2003), pp 399–424, Academic Press, San Diego.
Dalzell, B. J., E. C. Minor, and K. M. Mopper (2009), Photodegradationof estuarine dissolved organic matter: A multi-method assessment ofDOM transformation, Org. Geochem., 40(2), 243–257.
Dittmar, T., N. Hertkorn, G. Kattner, and R. J. Lara (2006), Mangroves, amajor source of dissolved organic carbon to the oceans, GlobalBiogeochem. Cycles, 20, GB1012, doi:10.1029/2005GB002570.
Driscoll, C. T., K. M. Driscoll, K. M. Roy, and M. J. Mitchell (2003),Chemical response of lakes in the Adirondack Region of New Yorkto declines in acidic deposition, Environ. Sci. Technol., 37(10),2036–2042.
Edmonds, J. W., N. B. Grimm (2011), Abiotic and biotic controls of organicmatter cycling in a managed stream, J. Geophys. Res. Biogeosci., 116,G02015, doi:10.1029/2010jg001429.
Evans, C. D., D. T. Monteith, D. M. Cooper (2005), Long-term increases insurface water dissolved organic carbon: Observations, possible causesand environmental impacts, Environ. Pollut., 137, 55–71.
Faure, G., and T. M. Mensing (2005), Principles of Isotope Geology, thirdedition, pp 753–802, John Wiley &Sons, Inc., Hoboken, New Jersey.
Fellman, J. B., E. Hood, and R.G.M. Spencer (2010), Fluorescencespectroscopy opens new windows into dissolved organic matter dynamicsin freshwater ecosystems: A review, Limnol. Oceanogr., 55, 2452–2462.
Fellman, J. B., E. Hood, D. V. D’Amore, R. T. Edwards, and D. White(2009a), Seasonal changes in the chemical quality and biodegradabilityof dissolved organic matter exported from soils to streams in coastal tem-perate rainforest watersheds, Biogeochemistry, 95, 277–293, doi:10.1007/s10533-009-9336-6.
Fellman, J. B., E. Hood, R. T. Edwards, and D. V. D’Amore (2009b), Changesin the concentration, biodegradability, and fluorescent properties ofdissolved organic matter during stormflows in coastal temperate watersheds,J. Geophys. Res. Biogeosci., 114, G01021, doi:10.1029/2008JG000790.
Findlay, S., J. M. Quinn, C. W. Hickey, G. Burrell, and M. Downes (2001),Effects of land use and riparian flowpath on delivery of dissolved organiccarbon to streams, Limnol. Oceanogr., 46, 345–355.
Freeman, C., C. D. Evans, D. T. Monteith, B. Reynolds, and N. Fenner (2001),Export of organic carbon from peat soils, Nature, 412(6849), 785–785.
Gennings, G. C., L. A. Molot, and P. J. Dillon (2001), Enhanced photo-chemical loss of organic carbon in acidic waters, Biogeochemistry, 52,339–354.
Hejzlar, J., M. Dubrovsky, J. Buchtele, and M. Ruzicka (2003), Theapparent and potential effects of climate change on the inferred concentrationof dissolved organic matter in a temperate stream (the Malse River, SouthBohemia), Sci. Total Environ., 310(1–3), 143–152.
Jaffé, R., D. McKnight, N. Maie, R. Cory, W. H. McDowell, J. L. Campbell(2008), Spatial and temporal variations in DOM composition in ecosys-tems: The importance of long-term monitoring of optical properties,J. Geophys. Res. Biogeosci., doi:10.1029/2008JG000683.
Kalbitz, K., D. Schwesig, J. Schmerwitz, K. Kaiser, L. Haumaier, B. Glaser,R. Ellerbrock, and P. Leinweber (2003), Changes in properties of soil-derived dissolved organic matter induced by biodegradation, Soil Biol.Biochem., 35(8), 1129–1142.
Kirchman, D. L. (2003), The contribution of monomers and other low-molecular weight compounds to the flux of dissolved organic materialin aquatic ecosystems, in Aquatic Ecosystems: Interactivity of DissolvedOrganic Matter, edited by S. E. G. Findlay, and R. L. Sinsabaugh, (2003),pp 218–243, Academic Press, San Diego.
Krug, E. C., and C. R. Frink (1983), Acid rain on acid soil—A new perspec-tive, Science, 221(4610), 520–525.
Larson, J. H., P. C. Frost, Z. Zheng, C. A. Johnston, S. D. Bridgham,D. M. Lodge, and G. A. Lamberti (2007), Effects of upstream lakes ondissolved organic matter in streams, Limnol. Oceanogr., 52, 60–69.
Leifer, A. (1988) The Kinetics of Environmental Aquatic Photochemistry:Theory and Practice, pp 257–264, American Chemical Society,Washington.
McCallister, S. L., J. E. Bauer, J. E. Cherrier, and H. W. Ducklow (2004),Assessing sources and ages of organic matter supporting river andestuarine bacterial production: A multiple-isotope (d 14C, d13C, andd15N) approach, Limnol. Oceanogr., 49, 1687–1702.
McCallister, S. L., and P. A. del Giorgio (2008), Direct measurement of thed13C signature of carbon respired by bacteria in lakes: Linkages topotential carbon sources, ecosystem baseline metabolism, and CO2 fluxes,Limnol. Oceanogr., 53(4), 1204–1216.
McGuire, K. J., J. J. McDonnell, M. Weiler, C. Kendall, B. L. McGlynn,J. M. Welker, and J. Seibert (2005), The role of topography oncatchment-scale water residence time, Water Resour. Res., 41(5),doi:10.1029/2004WR003657.
McKnight D. M., E. W. Boyer, P. K. Westerhoff, P. T. Doran, T. Kulbe, andD. T. Andersen (2001), Spectrofluorometric characterization of dissolvedorganic matter for indication of precursor organic material and aromatic-ity, Limnol. Oceanogr., 46, 38–48.
McKnight, D. M., E. Hood, and L. Klapper (2003), Trace organic moietiesof dissolved organic materials in natural waters, in Aquatic Ecosystems:Interactivity of Dissolved Organic Matter, edited by S. E. G. Findlay,and R. L. Sinsabaugh, (2003), pp 71–96, Academic Press, San Diego.
Mierle, G., and R. Ingram (1991), The role of humic substances in the mobili-zation of mercury from watersheds,Water Air Soil Pollut., 56, 349–357.
Mixon, R. B., C. R. Berquist Jr., W. L. Newell, G. H. Johnson, D. S. Powars,J. S. Schindler, and E. K. Rader (1989), Geological Map and GeneralizedCross Sections of the Coastal Plain and Adjacent Parts of the Piedmont,Geological Survey, Virginia, U.S.
Molot, L. A., and P. J. Dillon (1997), Photolytic regulation of dissolved or-ganic carbon in northern lakes, Global Biogeochem. Cycles, 11, 357–365.
Moran, M. A., and J. S. Covert (2003), Photochemically mediated linkagesbetween DOM and bacterioplankton, in Aquatic Ecosystems: Interactivityof Dissolved Organic Matter, edited by S. E. G. Findlay, andR L. Sinsabaugh, (2003), pp. 244–262, Academic Press, San Diego.
Moran, M. A., and R. G. Zepp (1997), Role of photoreactions in the forma-tion of biologically labile compounds from dissolved organic matter,Limnol. Oceanogr., 42, 1307–1316.
Obernosterer, I., and R. Benner (2004), Competition between biological andphotochemical processes in the mineralization of dissolved organiccarbon, Limnol. Oceanogr., 49, 117–124.
Ogrinc,N.,R.Markovics, T.Kanduc, L.M.Walter, andS.K.Hamilton (2008),Sources and transport of carbon and nitrogen in the River Sava watershed, amajor tributary of the River Danube, Appl. Geochem., 23, 3685–3698.
Opsahl, S. P., and R. G. Zepp (2001), Photochemically-induced alterationof stable carbon isotope ratios (d13C) in terrigenous dissolved organiccarbon, Geophys. Res. Lett., 28(12), 2417–2420.
LU ET AL.: DOM IN STREAMS OF DIFFERENT LAND USE
14
Osburn, C. L., D. P. Morris, K. A. Thorn, and R. E. Moeller (2001), Chemicaland optical changes in freshwater dissolved organic matter exposed to solarradiation, Biogeochemistry, 54, 251–278.
Parsons, T. R., Y. Maita, and C. M. Lalli (1984), A Manual of Chemical andBiological Methods for Seawater Analysis, pp. 107–109, Pergamon Press,Oxford.
Petrone, K. C., J. B. Fellman, E. Hood, M. J. Donn, and P. F. Grierson (2011),The origin and function of dissolved organic matter in agro-urban coastalstreams, J. Geophys. Res. Biogeosci., 116, doi:10.1029/2010JG001537.
Raymond, P. A., and J. E. Bauer (2000), Bacterial consumption of DOC duringtransport through a temperate estuary, Aquat. Microb. Ecol., 22(1), 1–12.
Raymond, P. A., and J. E. Bauer (2001a), DOC cycling in a temperate estuary:A mass balance approach using natural 14C and 13C isotopes, Limnol.Oceanogr., 46, 655–667.
Raymond, P. A., and J. E. Bauer (2001b), Riverine export of aged terrestrialorganic matter to the North Atlantic Ocean, Nature, 409(6819), 497–500.
Roberts, J. K. (1932), The lower York-James Peninsula. Virginia GeologicalSurvey, Bulletin 37, Educational Series No.2.
Schultz, G. E. (1999), Bacterial dynamics and community structure in theYork River Estuary, Ph.D. Dissertation, School of Marine Sciences, TheCollege of William and Mary.
Seitzinger, S. P., H. Hartnett, R. Lauck, M. Mazurek, T. Minegishi,G. Spyres, and R. Styles (2005), Molecular-level chemical characteriza-tion and bioavailability of dissolved organic matter in stream water usingelectrospray-ionization mass spectrometry, Limnol. Oceanogr., 50, 1–12.
Sickman, J. O., C. L. DiGiorgio, M. L. Davisson, D. M. Lucero, andB. Bergamaschi (2010), Identifying sources of dissolved organic carbon inagriculturally dominated rivers using radiocarbon age dating: Sacramento–San Joaquin River Basin, California, Biogeochemistry, 99, 79–96,doi:10.1007/s10533-009-9391-z.
Skjelkvåle, B. L., et al. (2005), Regional scale evidence for improvements insurface water chemistry 1990–2001, Environ. Pollut., 137, 165–176.
Sobczak, W. V., J. E. Cloern, A. D. Jassby, and A. B. Muller-Solger(2002), Bioavailability of organic matter in a highly disturbed estuary:The role of detrital and algal resources, Proc. Natl. Acad. Sci. U.S.A.,99, 8101–8105.
Spencer, R. G. M., et al. (2009), Photochemical degradation of dissolvedorganic matter and dissolved lignin phenols from the Congo River,J. Geophys. Res., 114, G03010, doi:10.1029/2009JG000968.
Stedmon, C. A., S. Markager, and R. Bro (2003), Tracing dissolved organicmatter in aquatic environments using a new approach to fluorescencespectroscopy, Mar. Chem., 82, 239–254.
Stedmon, C. A., S. Markager, L. Tranvik, L. Kronberg, T. Slatis, andW. Martinsen (2007), Photochemical production of ammonium andtransformation of dissolved organic matter in the Baltic Sea, Mar. Chem.,104, 227–240.
Stedmon C. A., and R. Bro (2008), Characterizing dissolved organic matterfluorescence with parallel factor analysis: A tutorial, Limnol. Oceanogr.Methods, 6, 572–579.
Stern, J., Y. Wang, B. Gu, and J. Newman (2007), Distribution and turnoverof carbon in natural and constructed wetlands in the Florida Everglades,Appl. Geochem., 22, 1936–1948.
Sulzberger, B., and E. Durisch-Kaiser (2009), Chemical characterizationof dissolved organic matter (DOM): A prerequisite for understandingUV-induced changes of DOM absorption properties and bioavailability,Aquat. Sci., 71, 104–126.
Thomas, D. N., and R. J. Lara (1995), Photodegradation of algal deriveddissolved organic-carbon, Mar. Ecol. Prog. Ser., 116, 309–310.
Warrner, T. J., T. V. Royer, J. L. Tank, N. A. Griffiths, E. J. Rosi-Marshall,and M. R. Whiles (2009), Dissolved organic carbon in streams from arti-ficially drained and intensively farmed watersheds in Indiana, USA, Bio-geochemistry, 95, 295–307.
Wiegner, T. N., and S. P. Seitzinger (2001), Photochemical and microbialdegradation of external dissolved organic matter inputs to rivers, Aquat.Microb. Ecol., 24, 27–40.
Williams, C. J., Y. Yamashita, H. F. Wilson, R. Jaffé, and M. A. Xenopoulos(2010), Unraveling the role of land use and microbial activity in shapingdissolved organic matter characteristics in stream ecosystems, Limnol.Oceanogr., 55, 1159–1171.
Wilson, H. F., and M. A. Xenopoulos (2009), Effects of agricultural land useon the composition of fluvial dissolved organic matter, Nat. Geosci., 2(1),37–41.
Yamashita, Y., L. J. Scinto, N. Maie, and R. Jaffé (2010), Dissolved organicmatter characteristics across a subtropical wetland’s landscape: Applica-tion of optical properties in the assessment of environmental dynamics,Ecosystems, 13, 1006–1019.
Yamashita Y., B. D. Kloeppel, J. Knoepp, G. Zausen, and R. Jaffé (2011a),Long term effects of watershed disturbance and forest management ondissolved organic matter characteristics in headwater streams, Ecosystem,14, 1110–1122, doi:10.1007/s10021-011-9469-z.
Yamashita, Y., A. Panton, C. Mahaffey, and R. Jaffé (2011b), Assessing thespatial and temporal variability of dissolved organic matter in LiverpoolBay using excitation emission matrix fluorescence and parallel factoranalysis, Ocean Dynamics, 61, 569–579.
LU ET AL.: DOM IN STREAMS OF DIFFERENT LAND USE
15