microhabitat estimation of an imperiled headwater fish ... · microhabitat estimation of an...
TRANSCRIPT
Microhabitat estimation of an imperiled headwater fish,the Yazoo darter (Etheostoma raneyi), in coastal plain streams
Ken A. Sterling & Melvin L. Warren Jr
Received: 13 February 2017 /Accepted: 2 July 2017# US Government (outside the USA) 2017
Abstract Headwater fishes in the southeastern UnitedStates make up much of the fish biodiversity of theregion yet many are imperiled. Despite this, the specifichabitat requirements of imperiled headwater fishes inlowland Coastal Plain streams have rarely been quanti-fied. Using data collected over three years of seasonalsampling we provide estimates of the microhabitat re-quirements of the imperiled Yazoo darter (Etheostomaraneyi Suttkus and Bart), a small benthic insectivore.Our results indicate that the species is a microhabitatspecialist and that optimum microhabitat within degradedcontemporary streams consists of a narrow range of waterdepths (about 20–30 cm), current velocity ≥ 0.25 m·s−1,complex stable debris piles, rooted macrophytes, andlikely coarse substrate. No pronounced or generalizedseasonal shifts in microhabitat use occurs, and no evi-dence exists for intraspecific partitioning of microhabitat.Though stable and complex instream cover is one of themost important variables explaining variation in micro-habitat use by Yazoo darters, such cover is rare in thedegraded streams within the range of the species. Currentconservation classifications of the Yazoo darter by gov-ernmental agencies and nongovernmental organizationsas well as associated management plans that are based on
the assumption that Yazoo darters are habitat generalistsshould be reviewed in recognition of the increased risk ofdecline becauseYazoo darters aremicrohabitat specialists.These considerations should also be extended to otherclosely related imperiled species of snubnose darters.
Keywords Etheostoma . Microhabitat . Grinnellianniche .Warmwaterstream . Instreamwood .Coastalplain
Introduction
Headwater stream fishes make up a considerable portionof biodiversity within river drainages (Paller 1994;Myer et al. 2007). Many of these fishes in the south-eastern United States are also imperiled (Jelks et al.2008). For small, benthic species especially, their par-ticular suite of life history characteristics (Turner andTrexler 1998; Radinger and Wolter 2014) can com-pound the negative effects of habitat fragmentationleading to increased isolation of populations amongscattered headwater tributaries (Sterling et al. 2012).Increased isolation results in smaller population sizes,reduction or elimination of gene flow, reduced availablehabitat, and can prevent dispersal to refugia duringdisturbance, all of which increases the risk of extirpation(Reed 2008).
Management efforts aimed at conservation of head-water fishes are hampered by a lack of specific informa-tion on the optimal habitat requirements of many speciesof concern, particularly for headwater fishes in lowlandCoastal Plain streams of the southeastern United States
Environ Biol FishDOI 10.1007/s10641-017-0638-6
Electronic supplementary material The online version of thisarticle (doi:10.1007/s10641-017-0638-6) contains supplementarymaterial, which is available to authorized users.
K. A. Sterling (*) :M. L. Warren Jr,Southern Research Station, Center for Bottomland HardwoodsResearch, Stream Ecology Laboratory, USDA Forest Service,1000 Front Street, Oxford, MS 38655, USAe-mail: [email protected]
(Warren et al. 2000; Jelks et al. 2008). Though anextensive set of literature is available on the habitatrequirements of coldwater and upland warmwaterfishes in headwater streams, the results of these studiescannot be assumed to apply to fishes of the CoastalPlain because the streams of this region are funda-mentally different (e.g., geology, hydrology, landuse history, and available habitat) from streams inother parts of the country (Meffe and Sheldon 1988;Shields et al. 1998).
The Yazoo darter (Etheostoma raneyi) is a small(<65 mm SL), benthic, insectivore endemic to smallUpper Gulf Coastal Plain streams in the Yazoo Riverbasin of north-central Mississippi (Suttkus et al. 1994;Johnston and Haag 1996; Sterling et al. 2013). Due tolimited distribution and widespread and ongoing habitatdegradation within its range, the species is categorizedas a Tier 1 species of greatest conservation need by theMississippi State Wildlife Action Plan (MississippiMuseum of Natural Science 2015), as Near Threatenedby the IUCN (NatureServe 2014), and Vulnerable by theSoutheastern Fishes Council and the American FisheriesSociety (Warren et al. 2000; Jelks et al. 2008). Phyloge-netic data indicate that the species is most closely relatedto other Coastal Plain snubnose darters (clade Adonia,Near et al. 2011) at least two of which (Etheostomacervus and E. pyrrhogaster) are species of concern withlimited ranges and are also at risk due to ongoing alter-ation and fragmentation of habitat. The habitat needs ofthese species are unquantified.
A study that examined the mesohabitat affinities ofthe Yazoo darter for a single stream population conclud-ed the Yazoo darter was a habitat generalist among riffle,run, pool, and undercut-bank habitats (Johnston andHaag 1996). No relationships were found between Yaz-oo darter abundance and depth, velocity, instream cover,substrate, or canopy cover using ordination methods(Johnston and Haag 1996). Suttkus et al. (1994) de-scribed reach-scale Yazoo darter habitat as spring-fedstreams with sandy substrate, often with burr-reed(Sparganium sp.) present but noted that within the rangeof the species channelized sites with unstable substrateand defoliated banks that were distant from springsources did not yield Yazoo darters.
Our experience in the field and the species’ occur-rence among local streams indicated that Yazoo darterswere not habitat generalists, and we hypothesized thatcover, particularly instream wood, was closely associat-ed with the occurrence of the species at the microhabitat
scale.We also hypothesized that Yazoo darters may shiftmicrohabitat use in response to seasonal changes instream flow or water temperatures (Schlosser and Toth1984; Schlosser 1991) and that Yazoo darters wouldshift microhabitat use in early spring when they spawn.We implemented a study to answer the following ques-tions: 1) does the Yazoo darter use available microhab-itat non-randomly; 2) what microhabitat variables bestexplain variation in habitat use; 3) are there seasonalshifts in microhabitat use; 4) is microhabitat use relatedto size and sex; 5) how could our results inform man-agement efforts for imperiled Coastal Plain headwaterfishes?
Methods
Site description and field methods
Yazoo darters are distributed within the Northern HillyGulf Coastal Plain Ecoregion (Chapman et al. 2004;Sterling et al. 2013). The area consists of low, rollinghills with elevations of about 80–180 m.We chose threeperennial streams (Table S1) for our study sites based onprevious sampling efforts indicating that these streamshad higher catch rates for Yazoo darters compared withmost other streams (Sterling et al. 2013) and alsoencompassed the two major drainages within their dis-tribution. All three streams were typical of Gulf CoastalPlain streams where the species occurs (i.e., low gradi-ent, flowing, predominantly sandy substrate, and mod-erately incised) (Shields et al. 1998; Warren et al. 2002)with similar water quality (see Supplemental text,Table S2).
Because stream widths and the amount of availablehabitat within a stream varied over time, we followed astandardized procedure to predetermine the length ofour study reach. We fixed the location of the down-stream edge of the reach and then measured the streamwetted width at five, 50-m intervals upstream. Wecalculated average width and multiplied the averageby 30 m to obtain reach length (minimum reachlength, 120 m). Due to the intermittent presence ofbeaver dams and impounded water, we moved studyreaches up- or downstream as needed through time.We used a Hydrolab Quanta sonde to measure waterquality parameters (temperature, conductivity, dissolvedoxygen, and pH) before commencing stream sampling,but because of high similarity among streams and
Environ Biol Fish
samples, we summarized but did not analyze thosevariables (Table S2).
For each sample, we first captured Yazoo darters andmeasured habitat use variables, then measured availablehabitat variables. We usually measured both sets ofvariables on the same day. For data collected on separatedays (habitat used vs available habitat) the maximumnumber of days between paired samples used for anal-yses was five days and measurable rain did not occur.Samples were collected from 2 June 2009 to 6March 2012. We grouped data into three seasons: Sum-mer (May 15–October 31),Winter (Nov. 1-Feb. 15), andSpawn (February 16–May 14). The Summer seasoncorresponds to the average annual low flow period forour study streams as well as the highest seasonal watertemperatures. The Winter and Spawn seasons corre-spond with the average annual high flow period andlower water temperatures (United States GeologicalSurvey 2016). Spawning in Yazoo darters occurs fromthe end of February to the first half of May, dependingon water temperatures (Johnston and Haag 1996).
Starting at the downstream end of the study reach, weused single-pass backpack electroshocking and dip netsto sample Yazoo darters. We allocated fishing effortamong all habitats within the study reach. Immediatelyupon capture of a Yazoo darter, we marked the capturelocation with a small anchored float. For each individualwe recorded standard length (SL) and sex for adults(males retain orange pigment and color bands in themedian fins year round) and juveniles when possible(>6–7 months of age when orange pigment in malesdevelops). Juveniles that could not be sexed were notused for analyses. After releasing Yazoo darters at theirpoint of capture we then immediately began to samplethe next segment of the stream. Because darters ingeneral are not highly vagile (Adams and Warren2005; Radinger and Wolter 2014), and were recoveringfrom capture after release, we are confident that we didnot recapture the same individuals on any given day.
After Yazoo darter sampling was completed, wemeasured a suite of habitat variables within a 50 cmdiameter circular quadrat centered on the point of cap-ture of each darter. We measured water depth (Depth,cm), water velocity (Velocity, m·s−1), distance to thenearest instream cover (e.g., wood, rock, detritus, etc.)(DistNOC, cm), and the distance to the bank (DistBank,cm) from the point of capture. We recorded the relativeabundance (primary, secondary, and tertiary) of coverand substrate types. For example, if small wood was the
predominant cover but there was some detritus presentwe recorded small wood as the primary cover, detritus asthe secondary cover, and no cover as the tertiary cover.We also recorded the number of cover (CovTypes) andsubstrate types (SubTypes) within the quadrat.
We defined cover types as Detritus (organic debris),LW (large wood, >10 cm diameter and >1.5 m long), SW(small wood, <LW), Plant (aquatic macrophytes and al-gae), Bank (rootwads, undercut banks, overhanging ter-restrial macrophytes), Rock (substrate >16 mm, primarilyrip rap), No Cover (no cover types within the quadrat),and Anthro (e.g., appliances, tires, bridge pilings).
We defined substrate types as Clay (particles<0.004 mm), Silt (0.004–0.063 mm), Sand (0.063–2 mm), Gravel (2–256 mm), and Hard Clay(>256 mm). Although we followed a modified Went-worth scale (Wentworth 1922) for substrate classifica-tion for Clay, Silt, and Sand, substrates larger than Sandare rare within the range of the Yazoo darter (Warrenet al. 2002) so we combined fine gravel, coarse gravel,and cobble into one category (Gravel). Substrates largerthan cobble are even more uncommon and were presentin <1% of samples so were dropped from analyses.
After sampling for Yazoo darters, we surveyed ran-dom points within the study reach to characterize avail-able habitat. We used the same procedures as describedfor Yazoo darter samples. To mark random points weused a random number generator to create paired points.Starting at the downstream edge of the study reach, thefirst number of a random pair indicated how manymeters upstream to advance, and the second numberindicated how far from the left bank to locate our sam-ple. Each random point was marked with a weightedfloat and subsequently characterized. We located andmeasured random samples throughout the reach. Differ-ences in stream sizes caused some variation in thenumber of random samples needed to fully sample thereach, but we sampled a minimum of 50 random samplepoints on each visit to a study site.
Tests of nonrandom habitat use
We used Multi-Response Permutation Procedures(MRPP) and SumF as implemented in PC-ORD ver.6.21 (McCune and Mefford 2011) to test for non-random habitat use by comparing multivariate availablehabitat data to habitat use data. MRPP is a nonparamet-ric multivariate method that tests for differences amonggroups and allows for unbalanced designs such as ours.
Environ Biol Fish
Output includes the test statistic T, which indicates sep-aration among groups, and an effect size (A), which is ameasure of within-group similarity. P-values are pro-duced using permutation. We used Sorensen distancesand rank-transformed all variables (McCune and Grace2002). Sum F is similar to MRPP in that it is a multi-variate permutation test; however, the test statistic(SumF) is the sum of univariate F-statistics calculatedfor each response variable included in the overall mul-tivariate test. Samples are then randomly assigned togroups over many permutations and the resulting SumFvalues are compared with the observed value to obtain ap-value (Edgington 1995; Warton and Hudson 2004).One advantage of the SumF method is the output in-cludes the F-statistic for each variable, which indicatesthe relative importance of each variable in distinguishinggroups.
We compiled data from a single paired sample (useand availability) at each site (three replicates) for eachseason and had enough paired samples to create twotests per season comparing habitat availability and hab-itat use (i.e., non-random use of habitat). Though wesampled for three years, weather, logistics, and lowsample sizes of Yazoo darters prevented three seasonaltests each year. We adjusted alpha for six tests(α = 0.0204) using a false discovery rate method(Bender and Lange 2001; Benjamini and Yekutieli2001; Narum 2006). We also used MRPP to test fordifferences in available habitat (six tests) and habitat use(six tests) among seasons (adjusted α = 0.0204). Be-cause tertiary Silt and primary, secondary, and tertiaryAnthro were present in <1% of samples, they weredropped from all MRPP and SumF tests. All othervariables defined in the Field Methods section wereused (Table S3). To avoid pseudoreplication, we didnot pool data from multiple samples at the same sitewithin test groups. For all analyses measurement data(Depth, DistNOC, and DistBank) were log10 trans-formed, and count data (CovTypes, SubTypes, Velocity)were square root transformed (McDonald 2014).
Modeling and PCA ordinations
To estimate which variables were most influential indescribing Yazoo darter habitat use, we used Nonpara-metric Multiplicative Regression (NPMR) as imple-mented in the program HyperNiche v.2.3 (McCuneand Mefford 2004; McCune 2006). NPMR producesresults comparable or superior to other commonly used
niche modeling approaches (e.g., Random Forests,CART, MAXENT, MARS) (McCune 2006; Lintzet al. 2011; Tarkesh and Jetschke 2012). The primaryadvantage of the method is that model forms are notpredetermined and reflect the multiple nonlinear re-sponses of target species to their environment as wellas complex interactions that are inherent to ecologicaldata sets (for details seeMcCune 2006). To evaluate andcompare model fit, HyperNiche output includes AreaUnder the Curve (AUC) from Receiver Operating Char-acteristic curves (Fielding 1999). This metric (range0.5–1) is independent of sample size, and an AUC valueof 0.5 indicates that model fit is no better than random.Variables included in final models are not in order ofimportance and interactions may be stronger than anysingle variable alone.
Because we were using NPMR as a descriptive tool,we pooled data from each of the two seasonal samplesused for MRPP and SumF tests (i.e., instead of produc-ing six models, two for each season, we created onemodel for each season). We also created one Overallmodel pooling all data from the six samples. We used alocal mean Gaussian kernel model with the defaultmoderate overfitting controls in HyperNiche.
We used Pc-ORD ver. 6.21 (McCune and Mefford2011) to produce PCA ordinations as another visualinterpretation of our data. We used the same data asdetailed for NPMR models and produced ordinationsfor each season and overall. We used the built-in ran-domization feature to estimate the number of valid axes.Variables dropped from MRPP and SumF testing (pres-ent in <1% of samples) were not used for NPMR andPCA. All other variables defined in the Field Methodssection were used (Table S3).
Availability versus use of cover and substrate
Though we had tested for non-random habitat use(MRPP and SumF), and estimated which variables weremost influential in describing variation in habitat use byYazoo Darters (NPMR, SumF, and PCA), we also in-vestigated which primary cover and substrate variablesshowed differences between use and availability. Wecalculated relative proportions of all primary cover andsubstrate types for available habitat and habitat usesamples for each season using the same data as forMRPP and SumF tests. To test for differences in sea-sonal proportions of cover and substrate types betweenavailable habitat and habitat use samples, we used
Environ Biol Fish
resampling methods to produce the equivalent of Chi-square tests for small sample sizes (Statistics.com LLC2009). Alpha was adjusted for four tests for substratevariables (α = 0.024) and seven tests for cover variables(α = 0.0193). Due to weather and logistics, we hadsample data that were not used in hypothesis testing(too much time or measurable rain between paired sam-ples). However, to summarize our proportional datausing histograms we used all our data.
Because we believed that Yazoo darters wereselecting for habitat with more complex cover and sub-strate, we used resamplingmethods (Statistics.com LLC2009) to test for differences between the number ofavailable and used cover types (CovTypes) and sub-strate types (SubTypes) for each season. We used thesame data as for the MRPP and SumF analyses. The teststatistic was the sum of the absolute deviations betweenthe group means for available habitat and habitat usesamples and the overall mean. Data was shuffled be-tween available habitat and habitat use samples, and thetest statistic was calculated from 10,000 iterations. Tocalculate a p-value, we compared the observed value forthe test statistic to the number of randomizations with anequal or greater value for the test statistic.
Depth, velocity, DistNOC, and DistBank
We were interested in assessing the breadth of use ofdepth and velocity by the Yazoo darter versus that ofavailable habitat. To do so, we used resamplingmethodsto test whether the standard deviation for Depth andVelocity was different between available habitat andhabitat use data (Statistics.com LLC 2009). Our nullhypothesis was that the standard deviation was the samefor available habitat and habitat used by the Yazoodarter. We shuffled the data for available habitat andYazoo darter habitat and calculated the difference instandard deviations between the two treatments over10,000 iterations. We calculated a p-value as describedfor number of cover types. We used data from a singlesample at each site taken over one week (Summer2010). The test requires a balanced design, but samplesizes for available habitat (n = 160) were higher than forYazoo darter habitat (n = 99). To achieve a balanceddesign, we randomly eliminated available habitat pointsso that each site had an equal number of available andYazoo darter habitat data points. To determine if thisbiased results, we created three balanced data sets and
ran the randomization test for each; results were essen-tially identical.
We calculated means and 95% confidence intervals(CIs) for Depth, Velocity, DistNOC, and DistBank foravailable habitat and Yazoo darter habitat for each sea-son. We used resampling methods (Statistics.com LLC2009) and 10,000 iterations to calculate CIs.
Niche breadth and overlap
To examine possible seasonal shifts in use of substrateand cover we calculated niche breadth and niche overlapfor each season using all primary cover and substratevariables. We used niche metrics (De Cáceres et al.2011) that account for availability of resources as wellas use (Hurlbert 1978) and also similarity among re-sources (Colwell and Futuyma 1971). Niche valuesrange from 0 to 1 with low values indicating narrowniche breadth and less niche overlap and the reverse forhigh values. Bootstrapping was used to estimate 95%confidence intervals (CIs) around point estimates forniche breadth and niche overlap among seasons. Calcu-lations were carried out using the ‘indicspecies’ v.1.7.3package in the R environment v.3.1.1 (De Cáceres et al.2011; R Core Team 2014).
Size and male versus female habitat use
We were interested in comparing habitat use by adults ofdifferent sizes and sex. We used regression analysis toinvestigate possible relationships between SL of Yazoodarters and Velocity, Depth, DistNOC, and DistBankbecause we hypothesized that smaller Yazoo darterswould use habitat that was shallower, closer to the bankand cover, and with lower flow than larger individuals.We used logistic regression to estimate relationshipsbetween SL and the number of substrate types andnumber of cover types because we thought that smallerindividuals would be sampled in more complex habitatover less complex substrates (i.e., slower currents, de-positional areas). To test for possible differences inhabitat use between females and males, we usedPearson’s exact chi-square test (Cytel Inc. 2007) onrelative proportions of primary cover types used by eachsex. Because we hypothesized that female-skewed sexratios (Johnston and Haag 1996) might be related tomales using deeper habitats further from cover, wecompared Depth, Velocity, and DistNOC between sexesusing resampling methods to test for differences in
Environ Biol Fish
means for each variable between sexes (Statistics.comLLC 2009). Because we believed that any differentialintraspecific use of habitat would be influenced by den-sity dependent processes, we only used data for theseanalyses from Big Spring Creek, which had the highestabundance of Yazoo darters among our study streams.
Results
Tests of nonrandom habitat use
Yazoo darters showed nonrandom use of habitat acrosstime as indicated byMRPP (Table 1) and SumF (Table 2)results. Effect sizes (A) and the group differentiationstatistic (T) from MRPP tests are similar for all tests.Results from SumF indicate that primary, secondary,and tertiary No Cover as well as CovTypes were mostinfluential. However, secondary Detritus and Depth werealso influential for some seasons (Tables 3 and S4). Useof habitat by Yazoo darters and available habitat differedsignificantly across seasons (MRPP; Table 4). Groupdifferentiation (T) and effect size (A) are similar amongseasons for habitat use and availability.
Modeling and PCA ordinations
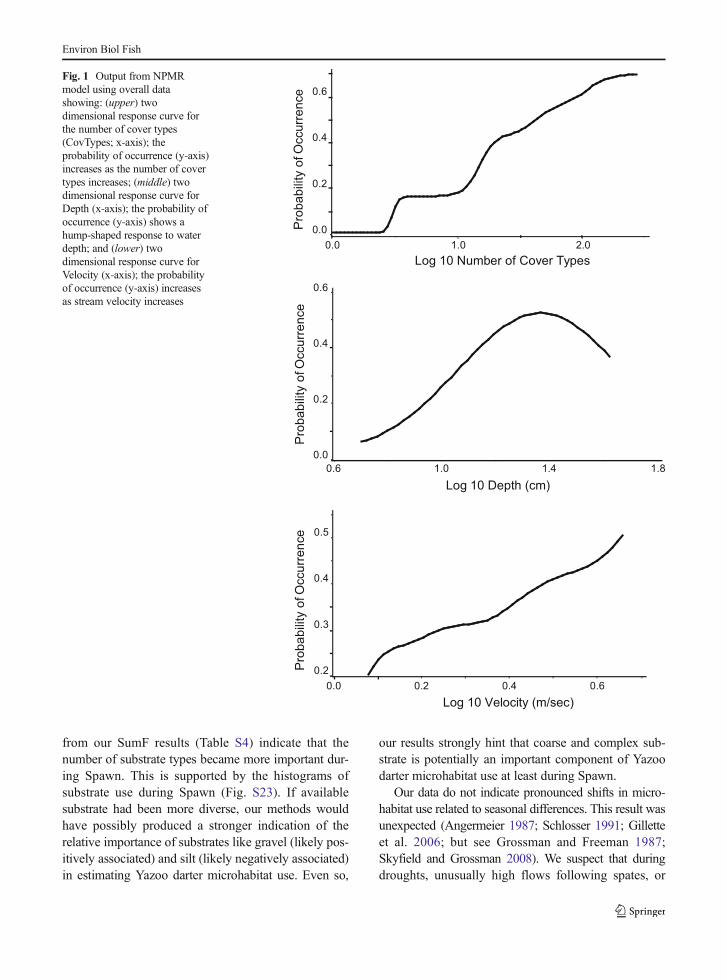
Modeling consistently yielded Depth, primary No Cov-er, secondary No Cover, and CovTypes as the mostinfluential variables describing Yazoo darter microhab-itat use (NPMR; Table 5). Velocity and primary Plant,however, were included in final models for Spawn, andprimary Detritus was included in the final overall model.Tertiary Detritus was included in the final model forWinter. Two dimensional response surfaces show a hump
shape response for Depth and a positive linear responsefor Velocity and CovTypes (Fig. 1). Overall shapes ofspecies response surfaces for all quantitative variableswere consistent across all models (Fig. S1-S3). Responsesurfaces for categorical variables such as No Cover arenot generated by HyperNiche, however, it is clear thatYazoo darters show a strong negative association withareas with no cover (Table 6 and Figs. S16-S19).
Model evaluations (Table 5) indicated that model fitsare moderately well supported (AUC: 0.74–0.84). Forthe overall model about 3% of Yazoo darter use sampleswere classified by the model as absent (error of omis-sion) and about 23% of habitat availability samples(random samples) were classified as present (error ofcommission).
In overall support of the modeling results, PCA re-vealed Yazoo darters are decidedly associated with cov-er in all ordinations. Ordinations show slight changesbetween Summer and Spawn, but apparently largerdifferences between Winter and the other two seasons(Figs. S4-S15). A cover gradient from no cover (prima-ry, secondary No Cover) to complex cover (CovTypes)and wood (primary, secondary SW) was consistent onAxes 1 and 2 for all ordinations. For Summer andSpawn a gradient on Axis 3 is apparent from flowingwater associated with Yazoo darters (primary Sand andVelocity) to backwater or deep pool environments (pri-mary Silt and secondary Sand). This pattern is consis-tent, but weaker, for Winter. Another consistent gradient(Axis 1) is from complex substrate (SubTypes), gravel(primary, secondary Gravel), and rock (primary,
Table 1 MRPP analysis of non-random use of habitat acrossseasons
Test n (Use) n (Available) T A p
Summer1 89 160 −15.86 0.041 <0.0001
Summer2 26 163 −11.79 0.041 <0.0001
Winter1 80 150 −37.52 0.094 <0.0001
Winter2 48 152 −13.57 0.042 <0.0001
Spawn1 58 150 −22.81 0.065 <0.0001
Spawn2 53 160 −21.25 0.062 <0.0001
T = group differentiation, A = within group similarity, adjustedα = 0.0204
Table 2 SumF analysis of non-random use of habitat acrossseasons
Test Obs.SumF
SumF Randomization p
Mean Maximum S.Dev SumF*
Summer1 221.4 37.98 98.79 11.83 0 0.0002
Summer2 141.5 38.53 201.75 12.93 1 0.0004
Winter1 464.6 37.29 108.51 11.54 0 0.0002
Winter2 160.7 38.34 97.87 11.4 0 0.0002
Spawn1 242.1 37.23 132.19 11.82 0 0.0002
Spawn2 266.8 38.17 100.82 11.75 0 0.0002
Obs. SumF = SumF from actual data,Mean =mean SumF from allrandomizations, Maximum = largest SumF from randomizations,S.Dev = standard deviation from randomizations, SumF* = num-ber of randomizations with a SumF ≥ than the observed value ofSumF
Environ Biol Fish
secondary Rock) that is associated with Yazoo darters toless complex substrates dominated by sand (primarySand). In Winter Depth, primary SW, and secondaryLW are associated with Yazoo darters on Axis 2.
Availability versus use of cover and substrate
Across seasons, univariate analyses indicate Yazoodarters completely avoid microhabitats without cover(No Cover), occupy areas with diverse cover types,and show some differences in use of available cover,but no differences in use versus availability of numberof substrates. Proportional differences between availablecover and use of cover indicated that Yazoo darters useinstream wood (SW and LW) in higher proportion thanis available during Summer and SW during Spawn(Table 6). They also show a proportional increase inuse of SW and Rock during Winter. Yazoo darters alsooccur significantly more often in areas with a greaternumber of cover types (i.e., more complex cover) in allseasons (Table 7, see also Figs. 1 and S16-S19). Propor-tional differences between available substrate and Yazoodarter use of substrate show no statistically significantdifferences; likewise for differences in the number ofsubstrate types used (see Table S5, Figs. S20-S23).
Depth, Velocity, and DistNOC
Standard deviation for Depth (p < 0.0002) was signifi-cantly lower for habitat used by Yazoo darters than for
available habitat. No significant difference was detectedfor standard deviation of Velocity in used versus avail-able habitat (p = 0.91).
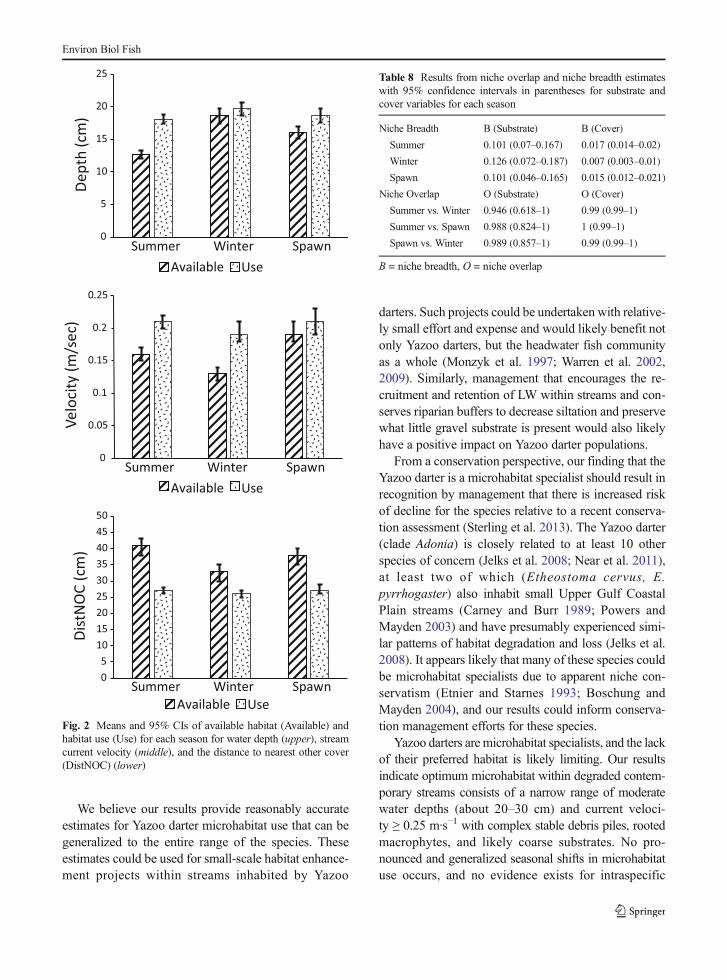
Means and confidence intervals of variables betweenavailable habitat and use indicate Yazoo darters consis-tently occupy habitats nearer to other cover (DistNOC)than is available, but patterns for availability versus useof Velocity and Depth vary among seasons (Fig. 2).Relative to available habitat, Yazoo darters showed apattern of occurring in deeper, faster water in Summer,faster water in Winter, and deeper water during Spawn.Comparisons show less overlap of CIs among availablehabitat variables than for habitat use variables.
Niche breadth and overlap
Yazoo darters exhibited narrow niche breadth for habitatand virtually complete seasonal niche overlap in habitat.Estimates for niche breadth are low for cover and sub-strate variables and are similar among seasonal compar-isons (Table 8). Upper 95% CIs are all <0.2 for substrateand <0.03 for cover variables. The niche overlap esti-mates are all near 1 and lower 95% CIs are all >0.6 forsubstrate and >0.98 for cover variables.
Size and male versus female habitat use
No relationships were detected between size or sex andhabitat use. Regression analysis indicates no relation-ship between SL and Velocity (R2 < 0.01, p = 0.26),
Table 3 Results from SumFshowing variables ranked byF-value for each test
See Table S4 for complete results;numerical prefixes refer to prima-ry, secondary, and tertiary sub-strate and cover types
Test Variable 1 Variable 2 Variable 3 Variable 4 Variable 5
Summer1 1NoCover CovTypes 2NoCover Depth 1SW
Summer2 2NoCover 2Detritus CovTypes 1NoCover Depth
Winter1 2NoCover CovTypes 1NoCover 3NoCover Depth
Winter2 2NoCover CovTypes 2Detritus 1NoCover 3Rock
Spawn1 2NoCover CovTypes 1NoCover 2Detritus 3NoCover
Spawn2 2NoCover CovTypes 3NoCover 1NoCover DistNOC
Table 4 Results from MRPP testing for differences in available habitat and habitat use by season
Summer vs. Winter Summer vs. Spawn Winter vs. Spawn
T A p T A p T A p
Available −19.71 0.037 0 −11.54 0.022 <0.0001 −6.05 0.011 0.0003
Use −4.27 0.017 0.003 −5.33 0.023 0.0005 −3.05 0.014 0.02
T = group differentiation, A = within group similarity, adjusted α = 0.0204
Environ Biol Fish
Depth (R2 < 0.01, p = 0.31), DistNOC (R2 < 0.01,p = 0.98) or DistBank respectively (R2 < 0.01,p = 078). Logistic regression of SL and CovTypes(χ2 = 2.61, p = 0.63) and SubTypes (χ2 = 2.85,p = 0.42) indicated no relationships. Standard length ofYazoo darters at Big Spring Creek ranged from 30 to52 mm. Microhabitat use between sexes does not showdifferences for Depth (resampling methods; p = 0.57),Velocity (p = 0.82), or DistNOC (p = 0.23). Likewise,there are no significant differences in cover or substrateuse between sexes (Pearson’s Chi-square exact test) (allp > 0.07). The male to female sex ratio at Big SpringCreek was 1:4.7.
Discussion
The weight of evidence from all our analyses leads us toconclude that Yazoo darters are decided microhabitatspecialists. Theory and the Yazoo darter’s life historycharacteristics are consistent with this conclusion. Thedistribution of the Yazoo darter appears to be tightlylinked to perennial flow and groundwater input (Suttkuset al. 1994), and the modifying influence of springs andgroundwater input apparently prevented large variationin available habitat for our study streams (e.g., watervelocities, depth, and temperatures). Theory indicatesthat if habitat is relatively stable during an individual’slifetime, adaptation to local conditions will favorGrinnellian specialization (Levins 1968). Yazoo dartersseldom live beyond two years (Johnston and Haag1996), and in the perennial streams they inhabit distur-bance is likely minimized over that time. Yazoo dartersshow limited distribution (Sterling et al. 2013), lowdispersal (Adams and Warren 2005; Sterling et al.2012), and resultant genetic subdivision (Sterling et al.2012) and lower genetic diversity (Sterling et al. 2012),
factors that are also associated with specialization(Levins 1968; Turner and Trexler 1998; Devictor et al.2010; Li et al. 2014). Though our data (MRPP andmeans with CIs) do show significant shifts in availablehabitat among seasons, those differences are relativelysmall. The only large change occurred in the winter withthe annual input of leaves from deciduous plants.
Results show that Yazoo darters use all forms ofcover (Figs. S16-S19), however their relatively greateruse of in-stream wood combined with greater use ofcomplex cover (CovTypes) suggest that cover stabilityis important. Within the unstable and flashy streams ofour study area (Shields et al. 1998), more stable forms ofcover such as rooted macrophytes, LW, or even anthro-pogenic objects such as tires or appliances (Adams2014) may collect more diverse and structurally com-plex cover over time and form debris piles. This in turnmay offer greater protection from predators (Everettand Ruiz 1993) and flashy flows (Crook andRobertson 1999), as well as provide habitat for aquat-ic insect larvae that compose much of the diet of theYazoo darter (Pitt and Batzer 2011; Stewart et al.2012), and spawning substrate for attaching eggs(Johnston and Haag 1996).
Substrate variables were not included in NPMRmodels explaining variation in microhabitat use by Yaz-oo darters. Comparisons of use and availability of pri-mary substrate types did not show statistically signifi-cant differences except perhaps for decreased use ofSand and increased use of Gravel during Spawn(Table S5) when NPMR models indicated that Yazoodarters were selecting for erosional habitat (Table 5).However, PCA ordinations (Figs. S4-S15) did indicatethat complex substrates and Gravel were generally as-sociated with Yazoo darter habitat use and NPMRmodels did show a moderate positive response to morecomplex substrate (Fig. S3). Likewise, the F-statistics
Table 5 Results from NPMR models (HyperNiche) for each season and an Overall model
AUC Omission Commission Variable a Variable b Variable c Variable d
Overall 0.81 0.032 0.23 Depth 1NoCover 2NoCover 1Detritus
Summer 0.74 0.014 0.32 Depth 1NoCover CovTypes
Winter 0.78 0.005 0.29 Depth 2NoCover CovTypes 3Detritus
Spawn 0.84 0.012 0.22 1NoCover 2NoCover Velocity 1Plant
Numerical prefixes refer to primary, secondary, and tertiary substrate and cover types; variables are not ranked
See Figs. 1 and S1–3 for response surfaces and polarity of effects of variables
AUC = area under the curve, Omission = error of omission, Commission = error of commission
Environ Biol Fish
from our SumF results (Table S4) indicate that thenumber of substrate types became more important dur-ing Spawn. This is supported by the histograms ofsubstrate use during Spawn (Fig. S23). If availablesubstrate had been more diverse, our methods wouldhave possibly produced a stronger indication of therelative importance of substrates like gravel (likely pos-itively associated) and silt (likely negatively associated)in estimating Yazoo darter microhabitat use. Even so,
our results strongly hint that coarse and complex sub-strate is potentially an important component of Yazoodarter microhabitat use at least during Spawn.
Our data do not indicate pronounced shifts in micro-habitat use related to seasonal differences. This result wasunexpected (Angermeier 1987; Schlosser 1991; Gilletteet al. 2006; but see Grossman and Freeman 1987;Skyfield and Grossman 2008). We suspect that duringdroughts, unusually high flows following spates, or
0.00.0
1.0 2.0
0.2
0.4
0.6
Log 10 Number of Cover Types
Prob
abilit
y of
Occ
urre
nce
0.60.0
1.0 1.4 1.8
0.2
0.4
0.6
Log 10 Depth (cm)
Prob
abilit
y of
Occ
urre
nce
0.00.2
0.2 0.4 0.6
0.3
0.4
0.5
Log 10 Velocity (m/sec)
Prob
abilit
y of
Occ
urre
nce
Fig. 1 Output from NPMRmodel using overall datashowing: (upper) twodimensional response curve forthe number of cover types(CovTypes; x-axis); theprobability of occurrence (y-axis)increases as the number of covertypes increases; (middle) twodimensional response curve forDepth (x-axis); the probability ofoccurrence (y-axis) shows ahump-shaped response to waterdepth; and (lower) twodimensional response curve forVelocity (x-axis); the probabilityof occurrence (y-axis) increasesas stream velocity increases
Environ Biol Fish
during periods of extreme cold or heat, Yazoo darterslikely shift microhabitat use over short time periods. Evenso, our results indicate that Yazoo darters mostly adhere toa narrow microhabitat niche across seasons and that gen-eralized, seasonal shifts in microhabitat use do not occur.
Our results, however, are not entirely consistent.Significant differences occurred in seasonal habitat use(MRPP), though the effect sizes were small. Proportion-al use of substrate variables during the spawning seasonshow increased use of Gravel and decreased use of Sandand Silt relative to other seasons (Figs. S20-S23) asdiscussed earlier. Likewise, NPMR models indicatedthat Velocity and Plant were important variablesexplaining variation in microhabitat use by Yazoodarters during Spawn. These results point to increaseduse of erosional habitats during the spawning seasonand perhaps use of aquatic vegetation as spawningsubstrate. However, gravel and rock substrates (and
rocky riffles) are so uncommonwithin our study streams(< 4% of random samples overall) and small streams ingeneral within the range of the Yazoo darter (Warrenet al. 2002), any seasonal shift is likely small due tolimiting suitable habitat.
Our study results apparently conflict with the conclu-sion of Johnston and Haag (1996) that Yazoo darterswere habitat generalists, a conflict likely due to factorsrelated to study designs and spatial scales. Their mainfocus was to describe life history characteristics, nothabitat relationships, and so the sampling approachand analytical methods are inherently different in thetwo studies. Most notably, our study focused on habitatuse at a much smaller spatial scale (cm2 vs. m2). Thecomparison of microhabitat use of Yazoo darters viasmall quadrats against random points over a three yearperiod at three streams allowed us to quantify patterns ofhabitat use that were undetectable by applying an ordi-nationmethod to seine hauls pooled across seasons froma single study reach (Johnston and Haag 1996).
Instream cover, particularly in-stream wood, is im-portant for fishes in many lowland streams (Schlosser1987; Monzyk et al. 1997; Dolloff and Warren 2003;Warren 2012), and our results support the importance ofin-stream wood to a headwater darter. Stable, complexcover in the channelized, incised, and flashy streamswithin the range of the Yazoo darter is likely limiting(Shields et al. 1998; Warren et al. 2002; Warren 2012),especially for streams running through lands that havebeen deforested and converted to agricultural and urbanuse. Because the Yazoo darter attaches eggs to instreamwood (Johnston and Haag 1996; unpubl. data), the lackof LW may also limit recruitment of the species.
Table 6 Results from resampling analyses of proportional use and availability of primary cover types for each season,
Group n 1Detritus 1LW 1SW 1Plant 1Bank 1Rock 1NoCover
Summer Use 89 0.146 0.124 0.551 0 0.045 0.135 0
Available 160 0.244 0.019 0.325 0.013 0.019 0.106 0.275
p 0.046 0.0006* 0.0005* 0.41 0.21 0.31 <0.0001*
Winter Use 80 0.45 0.05 0.3625 0 0 0.1375 0
Available 150 0.507 0.007 0.08 0 0.007 0.007 0.393
p 0.25 0.049 <0.0001* — 0.65 0.0002* <0.0001*
Spawn Use 58 0.31 0.121 0.328 0.052 0.035 0.138 0
Available 150 0.373 0.033 0.147 0.02 0 0.1 0.313
p 0.25 0.023 0.004* 0.22 0.073 0.28 <0.0001*
n = sample size for each group across seasons; adjusted α = 0.0193
*significant result
Table 7 Results from resampling analyses of the number of coverand substrate types for habitat use and availability across seasons
Available Use p
n Mean(± S.D.)
n Mean(± S.D.)
Cover Summer 160 1.81 (1.14) 89 2.58 (0.85) <0.0001
Winter 150 1.54 (0.73) 80 2.39 (0.75) <0.0001
Spawn 150 1.41 (1) 58 2.33 (0.76) <0.0001
Substrate Summer 160 1.71 (0.82) 89 1.89 (0.97) 0.135
Winter 150 1.61 (0.67) 80 1.69 (0.84) 0.456
Spawn 150 1.73 (0.8) 58 1.95 (0.63) 0.065
n = sample size, S.D. = standard deviation
Environ Biol Fish
We believe our results provide reasonably accurateestimates for Yazoo darter microhabitat use that can begeneralized to the entire range of the species. Theseestimates could be used for small-scale habitat enhance-ment projects within streams inhabited by Yazoo
darters. Such projects could be undertaken with relative-ly small effort and expense and would likely benefit notonly Yazoo darters, but the headwater fish communityas a whole (Monzyk et al. 1997; Warren et al. 2002,2009). Similarly, management that encourages the re-cruitment and retention of LW within streams and con-serves riparian buffers to decrease siltation and preservewhat little gravel substrate is present would also likelyhave a positive impact on Yazoo darter populations.
From a conservation perspective, our finding that theYazoo darter is a microhabitat specialist should result inrecognition by management that there is increased riskof decline for the species relative to a recent conserva-tion assessment (Sterling et al. 2013). The Yazoo darter(clade Adonia) is closely related to at least 10 otherspecies of concern (Jelks et al. 2008; Near et al. 2011),at least two of which (Etheostoma cervus, E.pyrrhogaster) also inhabit small Upper Gulf CoastalPlain streams (Carney and Burr 1989; Powers andMayden 2003) and have presumably experienced simi-lar patterns of habitat degradation and loss (Jelks et al.2008). It appears likely that many of these species couldbe microhabitat specialists due to apparent niche con-servatism (Etnier and Starnes 1993; Boschung andMayden 2004), and our results could inform conserva-tion management efforts for these species.
Yazoo darters are microhabitat specialists, and the lackof their preferred habitat is likely limiting. Our resultsindicate optimum microhabitat within degraded contem-porary streams consists of a narrow range of moderatewater depths (about 20–30 cm) and current veloci-ty ≥ 0.25 m·s−1 with complex stable debris piles, rootedmacrophytes, and likely coarse substrates. No pro-nounced and generalized seasonal shifts in microhabitatuse occurs, and no evidence exists for intraspecific
Available Use
0
5
10
15
20
25De
pth
(cm
)
Summer Winter Spawn
0
0.05
0.1
0.15
0.2
0.25
Velo
city
(m/s
ec)
Available UseSummer Winter Spawn
05
101520253035404550
Dist
NO
C (c
m)
Available UseSummer Winter Spawn
Fig. 2 Means and 95% CIs of available habitat (Available) andhabitat use (Use) for each season for water depth (upper), streamcurrent velocity (middle), and the distance to nearest other cover(DistNOC) (lower)
Table 8 Results from niche overlap and niche breadth estimateswith 95% confidence intervals in parentheses for substrate andcover variables for each season
Niche Breadth B (Substrate) B (Cover)
Summer 0.101 (0.07–0.167) 0.017 (0.014–0.02)
Winter 0.126 (0.072–0.187) 0.007 (0.003–0.01)
Spawn 0.101 (0.046–0.165) 0.015 (0.012–0.021)
Niche Overlap O (Substrate) O (Cover)
Summer vs. Winter 0.946 (0.618–1) 0.99 (0.99–1)
Summer vs. Spawn 0.988 (0.824–1) 1 (0.99–1)
Spawn vs. Winter 0.989 (0.857–1) 0.99 (0.99–1)
B = niche breadth, O = niche overlap
Environ Biol Fish
partitioning of microhabitat. From our results we hypoth-esize that introduction of LW, rooted macrophytes, androck rubble over small spatial scales within streamreaches with suitable water depths and velocity wouldresult in greater occurrence of stable and complex debrispiles which would have a positive influence on the long-term persistence of the Yazoo darter and closely relatedspecies. We suggest a series of experiments using thistype of habitat modification be conducted to fully evalu-ate effects on Yazoo darters and associates.
Acknowledgments We thank the many people who contributedto this project by assisting in the field and the laboratory, sharingideas and information, providing logistical support, and offeringnumerous other professional courtesies: S. Adams, M. Bland, A.Commens-Carson,W. Haag, G. Henderson, A. Jacobs, C. Jenkins,E. McGuire, G. McWhirter, A. Reitl, V. Reithel, J. Ryndock, andD. Warren. This study was supported by the Stream EcologyLaboratory, Center for Bottomland Hardwoods Research, USDAForest Service, Oxford, MS.
Compliance with ethical standards All applicable internation-al, national, and/or institutional guidelines for the care and use ofanimals were followed.
Conflict of interest The authors declare there is no conflict ofinterest.
References
Adams SB (2014) Crayfish use of trash versus natural cover inincised, sand-bed streams. Environ Manag 53:382–392
Adams SB, Warren ML Jr (2005) Recolonization by warmwaterfishes and crayfishes after severe drought in upper coastalPlain Hill streams. T Am Fish Soc 134:1173–1192
Angermeier PL (1987) Spatiotemporal variation in habitat selec-tion by fishes in small Illinois streams. In: Matthews WJ,Heins DC (eds) Community and evolutionary ecology ofnorth American stream fishes. University of OklahomaPress, Norman, pp 52–60
Bender R, Lange S (2001) Adjusting for multiple testing – whenand how? J Clin Epidemiol 54:343–349
Benjamini Y, Yekutieli D (2001) The control of false discoveryrate under dependency. Ann Stat 29:1165–1188
Boschung HT, Mayden RL (2004) The fishes of Alabama.Smithsonian Books, Washington, DC
Carney DA, Burr BM (1989) Life histories of the bandfin darter,Etheostoma zonistium, and the firebelly darter, Etheostomapyrrhogaster, in western Kentucky. Ill Nat Hist Surv 134:1–16
Chapman SS, Griffith GE, Omernik JM, Comstock JA, Beiser MC,JohnsonD (2004) Ecoregions ofMississippi (color poster withmap [map scale 1:1,000,000], descriptive text, summary
tables, and photographs), US Geological Survey, Reston,VA. https://archive.epa.gov/wed/ecoregions/web/html/ms_eco.html. Accessed 25 May 2016
Colwell RK, Futuyma DJ (1971) On the measurement of nichebreadth and overlap. Ecology 52:567–576
Crook DA, Robertson AI (1999) Relationships between riverinefish and woody debris: implications for lowland rivers. MarFreshw Res 50:941–953
Cytel Inc (2007) StatXact version 8. Cytel Inc., Cambridge, MADe Cáceres M, Sol D, Lapiedra O, Legendre P (2011) A frame-
work for estimating niche metrics using the resemblancebetween qualitative resources. Oikos 120:1341–1350
Devictor V, Clavel J, Julliard R, Lavergne S, Mouillot D, ThuillerW, Venail P, Villéger S, Mouquet N (2010) Defining andmeasuring ecological specialization. J Appl Ecol 47:15–25
Dolloff CA, Warren ML Jr (2003) Fish relationships with largewood in small streams. Am Fish Soc Symp 37:179–193
Edgington ES (1995) Randomization tests, 3rd edn. MarcelDekker, New York
Etnier DA, Starnes WC (1993) The fishes of Tennessee. TheUniversity of Tennessee Press, Knoxville
Everett RA, Ruiz GM (1993) Coarse woody debris as a refuge frompredation in aquatic communities. Oecologia 93:475–486
Fielding AH (1999) How should accuracy be measured? In:Fielding AH (ed) Machine learning methods for ecologicalapplications. Kluwer Academic, Dordrecht, pp 209–223
Gillette DP, Tiemann JS, Edds DR, Wildhaber ML (2006) Habitatuse by aMidwestern USA riverine fish assemblage: effects ofseason, water temperature, and river discharge. J Fish Biol68:1494–1512
Grossman GD, Freeman MC (1987) Microhabitat use in a streamfish assemblage. J Zool 212:151–176
Hurlbert S (1978) The measurement of niche overlap and somerelatives. Ecology 59:67–77
Jelks HL, Walsh SJ, Burkhead NM, Contreras-Balderas S, Diaz-Pardo E, Hendrickson DA, Lyons J, Mandrak NE,McCormick F, Nelson JS, Plantania SP, Porter BA, RenaudCB, Schmitter-Soto JJ, Taylor EB, Warren ML Jr (2008)Conservation status of imperiled north American freshwaterand diadromous fishes. Fisheries 33:372–407
Johnston CE, Haag WR (1996) Life history of the Yazoo darter(Percidae: Etheostoma raneyi), a species endemic to north-central Mississippi. Tulane Stud Zoolog Bot 30:47–60
Levins R (1968) Evolution in changing environments: some the-oretical explorations. Princeton University Press, Princeton
Li S, Jovelin R, Yoshiga T, Tanaka R, Cutter AD (2014) Specialistversus generalist life histories and nucleotide diversity inCaenorhabditis Nematodes. Proc R Soc B 281:20132858.doi:10.1098/rspb.2013.2858
Lintz HE, McCune B, Gray AN, McCulloh KA (2011)Quantifying ecological thresholds from response surfaces.Ecol Model 222:427–436
McCune B (2006) Non-parametric habitat models with automaticinteractions. J Veg Sci 17:819–830
McCune B, Grace JB (2002) Analysis of ecological communities.MjM Software, Gleneden Beach
McCune B, Mefford MJ (2004) HyperNiche ver 2.0. MjMSoftware, Gleneden Beach
McCune B, Mefford MJ (2011) PC-ORD ver. 6.21, multivariateanalysis of ecological data. MjM Software, Gleneden Beach
Environ Biol Fish
McDonald JH (2014) Handbook of biological statistics, 3rd edn.Sparky House Publishing, Baltimore
Meffe GK, Sheldon AL (1988) The influence of habitat structureon fish assemblage composition in southeastern blackwaterstreams. Am Midl Nat 120:225–240
Mississippi Museum of Natural Science (2015) Mississippi’s StateWildlife Action Plan, 2015-2025. Mississippi Department ofWildlife, Fisheries, and Parks, Jackson, Mississippi.http://www.mdwfp.com/media/289701/mdwfp_2015_2025_2.pdf. Accessed 5 May 2016
Monzyk FR, Kelso WE, Rutherford DA (1997) Characteristics ofwoody cover used by brown madtoms and pirate perch incoastal plain streams. T Am Fish Soc 126:665–675
Myer JL, Strayer DL, Wallace JB, Eggert SL, Helfman GS,Leonard NE (2007) The contribution of headwater streamsto biodiversity in river networks. J Am Water Resour Assoc43:86–103
Narum SR (2006) Beyond Bonferroni: less conservative analysesfor conservation genetics. Conserv Genet 7:783–787
NatureServe (2014) Etheostoma raneyi. The IUCN Red List ofThreatened Species 2014: e.T202524A18229709.doi:10.2305/IUCN.UK.2014-3.RLTS.T202524A18229709.en. Accessed 25 May 2016
Near TJ, Bossu CM, Bradburd GS, Carlson RL, Harrington RC,Hollingsworth PR Jr, Keck BP, Etnier DA (2011) Phylogenyand temporal diversification of darters (Percidae:Etheostomatinae). Syst Biol 60:565–595
Paller MH (1994) Relationships between fish assemblage structureand stream order in South Carolina coastal plain streams. TAmerican Fish Soc 123:150–161
Pitt DB, Batzer DP (2011) Woody debris as a resource for aquaticmacroinvertebrates in stream and river habitats of the south-eastern United States: a review. Proceedings of the 2011Georgia water resources conference, April 11–14. Athens,GA https://smartech.gatech.edu/bitstream/handle/1853/46046/4.2.3Pitt.pdf. Accessed 25 May 2016
Powers SL, Mayden RL (2003) A new species from the forkeddeer river system western Tennessee with comparison toEtheostoma pyrrhogaster (Percidae: Subgenus Ulocentra).Copeia 2003:576–582
R Core Team (2014) R: A language and environment for statisticalcomputing. R Foundation for Statistical Computing. Vienna,Austria. http://www.R-project.org/. Accessed 5 May 2016
Radinger J, Wolter C (2014) Patterns and predictors of fish dis-persal in rivers. Fish Fish 15:456–473
Reed DH (2008) Effects of population size on population viability:from mutation to environmental catastrophes. In: Carroll SP,Fox CW (eds) Conservation biology. Oxford UniversityPress, New York, pp 16–34
Schlosser IJ (1987) A conceptual framework for fish communitiesin small warmwater streams. In: Matthews WJ, Heins DC(eds) Community and evolutionary ecology of northAmerican stream fishes. University of Oklahoma Press,Norman, pp 17–24
Schlosser IJ (1991) Stream fish ecology: a landscape perspective.Bioscience 41:704–712
Schlosser IJ, Toth LA (1984) Niche relationships and populationecology of rainbow (Etheostoma caeruleum) and fantail
(E. flabellare) darters in a temporally variable environment.Oikos 42:229–238
Shields FD Jr, Knight SS, Cooper CM (1998) Rehabilitation ofaquatic habitats in warmwater streams damaged by channelincision in Mississippi. Hydrobiologia 382:63–86
Skyfield JP, Grossman GD (2008) Microhabitat use, movementsand abundance of gilt darters (Percina evides) in southernAppalachian (USA) streams. Ecol Freshw Fish 17:219–230
Statistics.com LLC (2009) Resampling Stats add-in for Excel ver.4.0. Arlington, VA
Sterling KA, Reed DH, Noonan BP, Warren ML Jr (2012) Geneticeffects of habitat fragmentation and population isolation onEthesotoma raneyi (Percidae). Conserv Genet 13:859–872
Sterling KA, Warren ML Jr, Henderson LG (2013) Conservationassessment of the Yazoo darter (Etheostoma raneyi).Southeast Nat 12:816–842
Stewart PM, Bhattarai S, Mullen MW, Metcalf CK, Reátegui-Zirena EG (2012) Characterization of large wood and itsrelationship to pool formation and macroinvertebrate metricsin southeastern coastal plain streams, USA. J FreshwEcol 27:351–365
Suttkus RD, Bailey RM, Bart HL Jr (1994) Three new species ofEtheostoma, subgenusUlocentra, from theGulf coastal plain ofsoutheastern United States. Tulane Stud Zoolog Bot 29:97–126
Tarkesh M, Jetschke G (2012) Comparison of six correlativemodels in predictive vegetation mapping on a local scale.Environ Ecol Stat 19:437–457
Turner TF, Trexler JC (1998) Ecological and historical associa-tions of gene flow in darters (Teleostei: Percidae). Evolution52:1781–1801
United States Geological Survey (2016) National WaterInformation System stream gauge data for 07268000 LittleTallahatchie River at Etta, MS. http://waterdata.usgs.gov/usa/nwis/uv?site_no=07268000. Accessed 5 May 2016
Warren ML Jr (2012) Forest landscape restoration: linkages withstream fishes of the southern United States. World For 16:221–264
Warren ML Jr, Burr BM, Walsh SJ, Bart HL Jr, Cashner RC,Etnier DA, Freeman BJ, Kuhajda BR, Mayden RL, RobisonHW, Ross ST, StarnesWC (2000) Diversity, distribution, andconservation status of the native freshwater fishes of thesouthern United States. Fisheries 25:7–29
Warren ML Jr, Haag WR, Adams SB (2002) Forest linkages todiversity and abundance in lowland stream fish communities.In: Holland MM, Warren ML Jr, Stanturf JA (eds)Proceedings of a conference on sustainability of wetlandsandwater resources: howwell can riverine wetlands continueto support society into the 21st century? USDA ForestService, Southern Research Station, General TechnicalReport SRS-50, Asheville, pp 168–182
Warren ML Jr, Sheldon AL, Haag WR (2009) Constructed micro-habitat bundles for sampling fishes and crayfishes in coastalplain streams. N Am J Fish Manag 29:330–342
Warton DI, Hudson HM (2004) A MANOVA statistic is just aspowerful as distance-based statistics, for multivariate abun-dances. Ecology 85:858–874
Wentworth CK (1922) A scale of grade and class terms for clasticsediments. J Geol 30:377–392
Environ Biol Fish