phonology shaped by phonetics: the case of intervocalic
TRANSCRIPT

UNIVERSITY OF CALIFORNIA
SANTA CRUZ
PHONOLOGY SHAPED BY PHONETICS:THE CASE OF INTERVOCALIC LENITION
A dissertation submitted in partial satisfactionof the requirements for the degree of
DOCTOR OF PHILOSOPHY
in
LINGUISTICS
by
Abby Kaplan
June 2010
The Dissertation of Abby Kaplanis approved:
Professor Jaye Padgett, Chair
Professor Armin Mester
Professor Grant McGuire
Professor Keith Johnson
Tyrus MillerVice Provost and Dean of Graduate Studies

Copyright © by
Abby Kaplan
2010

Contents
List of Figures v
Abstract vii
Acknowledgements ix
1 Introduction 11.1 Lenition . . . . . . . . . . . . . . . . . . . . . . . . . . . . . . . . 21.2 Phonetic Bases of Lenition . . . . . . . . . . . . . . . . . . . . . . 51.3 Outline of Dissertation . . . . . . . . . . . . . . . . . . . . . . . . 9
2 Typology of Intervocalic Voicing and Spirantization 112.1 Lenition of Intervocalic Stops: General Observations . . . . . . . 132.2 Place of Articulation . . . . . . . . . . . . . . . . . . . . . . . . . 132.3 Segment Inventory and Contrast Maintenance . . . . . . . . . . . 18
3 Articulatory Effort Reduction 253.1 Assessing Articulatory Effort . . . . . . . . . . . . . . . . . . . . . 263.2 Physical and Linguistic Effects of Alcohol Consumption . . . . . . 313.3 Experiment 1 . . . . . . . . . . . . . . . . . . . . . . . . . . . . . 35
3.3.1 Design . . . . . . . . . . . . . . . . . . . . . . . . . . . . . 353.3.2 Measurements . . . . . . . . . . . . . . . . . . . . . . . . . 383.3.3 Results . . . . . . . . . . . . . . . . . . . . . . . . . . . . . 433.3.4 Discussion . . . . . . . . . . . . . . . . . . . . . . . . . . . 62
3.4 Conclusion . . . . . . . . . . . . . . . . . . . . . . . . . . . . . . . 68
4 Perception of Intervocalic Voicing and Spirantization 694.1 Experiment 2: Relative Perceptibility of Devoicing and Spirantiza-
tion for Voiced Stops . . . . . . . . . . . . . . . . . . . . . . . . . 734.1.1 Design . . . . . . . . . . . . . . . . . . . . . . . . . . . . . 734.1.2 Results . . . . . . . . . . . . . . . . . . . . . . . . . . . . . 804.1.3 Discussion . . . . . . . . . . . . . . . . . . . . . . . . . . . 89
iii

4.2 Experiment 3: Effect of Place of Articulation . . . . . . . . . . . . 924.2.1 Design . . . . . . . . . . . . . . . . . . . . . . . . . . . . . 934.2.2 Results . . . . . . . . . . . . . . . . . . . . . . . . . . . . . 944.2.3 Discussion . . . . . . . . . . . . . . . . . . . . . . . . . . . 99
4.3 Experiment 4: Relative Perceptibility of Voicing and Spirantizationfor Voiceless Stops . . . . . . . . . . . . . . . . . . . . . . . . . . 1024.3.1 Design . . . . . . . . . . . . . . . . . . . . . . . . . . . . . 1024.3.2 Results . . . . . . . . . . . . . . . . . . . . . . . . . . . . . 1054.3.3 Discussion . . . . . . . . . . . . . . . . . . . . . . . . . . . 113
4.4 Discussion and Implications . . . . . . . . . . . . . . . . . . . . . 117
5 Implications for Phonology 1195.1 Perception: Results of Experiments 2 – 4 . . . . . . . . . . . . . . 119
5.1.1 The P-Map . . . . . . . . . . . . . . . . . . . . . . . . . . 1195.1.2 Effects of Voicing and Manner . . . . . . . . . . . . . . . . 1205.1.3 Effect of Place of Articulation . . . . . . . . . . . . . . . . 1245.1.4 Which Faithfulness Constraints Are Projected? . . . . . . 130
5.2 Production: Results of Experiment 1 . . . . . . . . . . . . . . . . 1335.2.1 Previous Models of Articulatory Effort . . . . . . . . . . . 1335.2.2 What Makes a Sound ‘Effortful’? . . . . . . . . . . . . . . 141
5.3 Putting It All Together . . . . . . . . . . . . . . . . . . . . . . . . 1425.3.1 Analysis of Intervocalic Lenition . . . . . . . . . . . . . . . 1435.3.2 Intervocalic Despirantization? . . . . . . . . . . . . . . . . 155
5.4 Conclusion . . . . . . . . . . . . . . . . . . . . . . . . . . . . . . . 159
6 Conclusion 161
7 Appendices 1637.1 Classification of Languages in the Database of Gurevich (2004) . . 1637.2 Stimuli for Experiment 1 . . . . . . . . . . . . . . . . . . . . . . . 179
7.2.1 Nasal-Stop Stimuli . . . . . . . . . . . . . . . . . . . . . . 1797.2.2 Lenition Stimuli . . . . . . . . . . . . . . . . . . . . . . . . 1807.2.3 CVC Stimuli . . . . . . . . . . . . . . . . . . . . . . . . . 181
7.3 Instructions for Experiments 2 – 4 . . . . . . . . . . . . . . . . . . 1827.3.1 Instructions for Experiments 2 and 4 . . . . . . . . . . . . 1827.3.2 Instructions for Experiment 3 . . . . . . . . . . . . . . . . 184
Bibliography 186
iv

List of Figures
1.1 Schematic illustration of lenition . . . . . . . . . . . . . . . . . . . 2
3.1 Production of anchor by subject 01 in the sober condition . . . . 413.2 Production of labor by subject 01 in the sober condition . . . . . 423.3 Duration of frame sentence by subject for nasal-stop and lenition
stimuli . . . . . . . . . . . . . . . . . . . . . . . . . . . . . . . . . 443.4 Illustration of ‘X-pattern’ . . . . . . . . . . . . . . . . . . . . . . 453.5 Duration of stimulus by subject for nasal-stop and lenition stimuli 463.6 Duration of voicing of [d] of said by subject for nasal-stop and
lenition stimuli . . . . . . . . . . . . . . . . . . . . . . . . . . . . 473.7 Duration of consonant by subject for nasal-stop stimuli . . . . . . 493.8 Duration of voicing by subject for nasal-stop stimuli . . . . . . . . 513.9 Proportion of closure that is voiced by subject for nasal-stop stimuli 533.10 Duration of consonant by subject for lenition stimuli . . . . . . . 543.11 Duration of voicing by subject for lenition stimuli . . . . . . . . . 553.12 Proportion of closure that is voiced by subject for lenition stimuli 563.13 Duration of burst by subject for lenition stimuli . . . . . . . . . . 573.14 Ratio of intensity of consonant to adjacent vowel by subject for
lenition stimuli . . . . . . . . . . . . . . . . . . . . . . . . . . . . 583.15 Productions of rapid and rabbit by subject 02, with intensity contours 603.16 Extrema of slope of intensity contour during consonant by subject
for lenition stimuli . . . . . . . . . . . . . . . . . . . . . . . . . . 61
4.1 Density curves for aspiration duration in [aTa] stimuli for Experi-ments 2 and 3 . . . . . . . . . . . . . . . . . . . . . . . . . . . . . 81
4.2 Length of first vowel in stimuli for Experiments 2 and 3 . . . . . . 814.3 Sensitivity to Z ∼ D vs. T ∼ D by subject in Experiment 2 . . . . 824.4 Sensitivity to Z ∼ D vs. T ∼ D by subject and place of articulation
in Experiment 2 . . . . . . . . . . . . . . . . . . . . . . . . . . . . 844.5 Sensitivity to Z ∼ D vs. T ∼ D by talker and place of articulation
for Experiment 2 . . . . . . . . . . . . . . . . . . . . . . . . . . . 85
v
4.6 Partial effects of the interactions between Trial and Comparison,Comparison and Place, and Trial and Place in Experiment 2 . . . 87
4.7 Duration of aspiration by place of articulation in [aTa] stimuli forExperiments 2 and 3 . . . . . . . . . . . . . . . . . . . . . . . . . 94
4.8 Length of first vowel by place of articulation in stimuli for Experi-ments 2 and 3 . . . . . . . . . . . . . . . . . . . . . . . . . . . . . 95
4.9 Sensitivity to Z ∼ D vs. T ∼ D by place of articulation in Experi-ment 3 . . . . . . . . . . . . . . . . . . . . . . . . . . . . . . . . . 96
4.10 Sensitivity to Z ∼ D vs. T ∼ D by subject and place of articulationin Experiment 3 . . . . . . . . . . . . . . . . . . . . . . . . . . . . 96
4.11 Sensitivity to Z ∼ D vs. T ∼ D by talker and place of articulationfor Experiment 3 . . . . . . . . . . . . . . . . . . . . . . . . . . . 97
4.12 Density curves for aspiration duration in [aTa] stimuli for Experi-ment 4 . . . . . . . . . . . . . . . . . . . . . . . . . . . . . . . . . 106
4.13 Duration of consonant in [aSa] stimuli for Experiment 4 . . . . . . 1074.14 Center of gravity of consonant in [aSa] stimuli for Experiment 4 . 1074.15 Intensity of consonant in [aSa] stimuli for Experiment 4 . . . . . . 1084.16 Sensitivity to S ∼ T vs. D ∼ T by subject in Experiment 2 . . . . 1094.17 Sensitivity to S ∼ T vs. D ∼ T by subject and place of articulation
in Experiment 4 . . . . . . . . . . . . . . . . . . . . . . . . . . . . 1104.18 Sensitivity to S ∼ T vs. D ∼ T by talker and place of articulation
for Experiment 4 . . . . . . . . . . . . . . . . . . . . . . . . . . . 1114.19 Partial effects of the interaction between Comparison and Place in
Experiment 4 . . . . . . . . . . . . . . . . . . . . . . . . . . . . . 1124.20 Sensitivity to Z ∼ D vs. T ∼ D by subject in a subset of data from
Experiment 2 . . . . . . . . . . . . . . . . . . . . . . . . . . . . . 114
5.1 Sketch of analysis of spirantization . . . . . . . . . . . . . . . . . 1445.2 Series of unidirectional leniting intervocalic alternations . . . . . . 158
vi
Abstract
PHONOLOGY SHAPED BY PHONETICS:
THE CASE OF INTERVOCALIC LENITION
Abby Kaplan
The goal of this dissertation is to explore the phonetic bases of intervocalic le-
nition – specifically, voicing and spirantization of intervocalic stops. A traditional
understanding of phonological patterns like these is that they involve articulatory
effort reduction, in that speakers substitute an easy sound for a hard one. Exper-
iment 1 uses a novel methodology to investigate whether voiced and spirantized
productions are truly easier than their unlenited counterparts: the speech of in-
toxicated subjects is recorded and compared with their speech while sober, on the
hypothesis that intoxicated subjects expend less articulatory effort. This experi-
ment thus attempts to observe effort reduction in action in the laboratory. The
results of Experiment 1 do not provide evidence that voicing and spirantization are
effort-reducing; rather, intoxicated subjects exhibit an overall contraction of the
articulatory space. Experiments 2 – 4 investigate whether an alternative account
of lenition based on perception is viable. Results suggest that attested alterna-
tions such as spirantization of voiced stops are preferred on perceptual grounds
to unattested alternations such as intervocalic devoicing. Thus, the hypothesis
of the P-map (Steriade 2001) can explain the broad strokes of lenition, although
differences by place of articulation found in Experiment 3 do not match well with
the typology. I conclude with an analysis of intervocalic spirantization couched
within Optimality Theory, and particularly Dispersion Theory, using constraints
motivated by Experiments 1 – 4. Unlike previous accounts of lenition, this anal-

ysis invokes no constraints that directly favor lenited forms over unlenited ones,
since no such constraints were motivated by Experiment 1. The constraints that
are made available by the experimental results are nevertheless able to account for
a sizeable portion of the typology of lenition. I conclude that articulatory factors
say less about lenition than traditionally thought, and that perceptual factors say
more – and that theories of phonology that are committed to taking phonetics
seriously must take notice.
Acknowledgements
I had the good fortune to be advised by a dedicated and intellectually stimulat-
ing committee. My advisor, Jaye Padgett, was unfailingly supportive in matters
both academic and practical; his dedication to his students, as revealed by his gen-
erous sharing of time and intellecual energy, is exemplary. This research would
have been far poorer without his guidance. Grant McGuire was an invaluable help
in considering questions of experimental design, statistical analysis, and interpre-
tation of complex data. Armin Mester was a model of thoughtful phonological
analysis. Keith Johnson generously agreed to be an external member of both
my QE and dissertation committees, and his incisive questions have contributed
greatly to this project.
The UCSC linguistics department was an excellent environment for developing
as a graduate student. The faculty are models of intellectual rigor and humility,
and their devotion to teaching benefits undergraduates and graduates alike. Jim
McCloskey characteristically went above and beyond the call of duty in advising
my syntax QP. The graduate student community is stimulating and supportive; I
am especially glad to have overlapped with Paul Willis and Jeremy O’Brien, with
their infectious enthusiasm for all things phonological.
My parents have supported my linguistic endeavors from the beginning, de-
spite my teenage rebellion of ceasing to be a prescriptivist. Aaron has been the
best husband-linguist anyone could hope for. Graham, of course, is stupendously
amazing.
My graduate education was funded by the National Science Foundation (with
a Graduate Research Fellowship) and the University of California (with a combi-
ix

nation of fellowships and TAships). I’m very grateful to these institutions – and,
by extension, to all US and California taxpayers. Thank you!
Special thanks are due to the following:
� Lev Blumenfeld, whose seminar on the “too-many-solutions” problem in-
spired Experiment 2, which in turn inspired the rest of the dissertation.
� Everyone who lent practical assistance to the experiments reported here:
Ryan Bennett, Judith Fiedler, Victoria Gonzalez-Pagani, Boris Harizanov,
Travis Kephart, Ruth Kramer, Elizabeth Oyarzabal, Hernan Oyarzabal,
Kyle Rawlins, Peter Shoun, Dave Teeple, Luıs Vicente, Jenn Wyatt, Ul-
rike Yang, and the linguist house.
� Robert Henderson, for providing pixie music; Mark Norris, for attacking the
gelatinous cube; Matt Tucker, for reviving Qillathe; and Oliver Northrup,
for breaking her out of the insane asylum.
� Everyone who helped us when we decided it was a good idea to move 700
miles with a four-month-old infant: Mark, Jeremy, Judith, Paul, Astra,
Rachel, and the Southside Church of Christ.
Finally, this dissertation is dedicated to the memory of the teacher who showed
so many students the joys of language, and who introduced me to linguistics in
high school: Dr. Don Houpe, who never met a language he didn’t like.
x

Chapter 1
Introduction
One of the goals of phonological theory is to account for typology – that is,
to formulate testable hypotheses about why certain sound patterns are found in
natural language while others seem to be systematically unattested. In some cases,
the reason a given pattern does not exist is hypothesized to be purely cognitive –
for example, that no phonological feature refers to a particular class of segments.
In recent decades, however, the trend has been for explanations to be grounded in
‘external’ phonetic facts – for example, the perceptibility of the segments involved
(Ohala 1981; Steriade 2001a), how their articulation interacts with the anatomy
and aerodynamics of the vocal tract (Ohala 1983; Hayes 1999), or the types of
diachronic changes that can lead to the pattern (Blevins 2004). The focus of this
dissertation is on the types of phonetic grounding that have been proposed for a
subset of the class of phonological patterns known as ‘lenition’.
1

Figure 1.1: Schematic illustration of sound changes commonly termed ‘lenition’in Bauer (2008), in turn derived from Hock (1986). Dashed lines show ‘possiblebut unobserved changes’ Bauer (2008, 606).
tt
~~||
||
²²dd
²²
t
~~}}}}
}}}}
}
²² ÂÂ???
????
?
d
²²
ÃÃAAA
AAAA
A T
²²
ºº///
////
////
/// P
²²ÂÂÂÂÂÂÂ
D
¨¨±±±±±±±±±±±±±±±
²²
ÂÂ???
????
?
h
²²
r,l
''OOOOOOOOOOOOOOO H
ÁÁ===
====
=
j
¡¡¢¢¢¢
¢¢¢¢
∅
1.1 Lenition
‘Lenition’ refers to a loosely defined network of sound changes, especially when
they occur intervocalically; figure 1.1 illustrates many of the changes to which this
term is applied. Lenition is sometimes considered a distinct type of sound change,
and is often presented as such in textbooks on historical linguistics (e.g., Crowley
(1997, 37-41) and Campbell (2004, 44); both authors acknowledge that the term
is not well defined). By extension, the term can also be applied to phonological
alternations in which the surface realization of a phoneme is ‘lenited’; this is the
sense in which the term is used in this dissertation.
2

Lenition is generally understood as ‘weakening’ of the relevant segments; how-
ever, there is no more consensus on the meaning of the latter term than there is for
the former. There have been a number of attempts in the literature to identify the
defining property of lenition; Lavoie (2001, 12) classifies the various approaches
into four categories:
1. “Lenition as deletion”: lenition is any step along a chain of sound changes
(such as those illustrated in figure 1.1) that end in [∅].
2. “Lenition as an increase in sonority”: the changes that qualify as lenition
involve an increase in sonority.
3. “Lenition as a decrease in effort”: lenition is any sound change that involves
substitution of an easy segment for a difficult one.
4. “Lenition as a decrease in duration and magnitude of gestures”: lenition is
any sound change that involves shorter or smaller gestures.
Note that these approaches define lenition in terms that are phonetic (gestural
magnitude) or nearly so (sonority). An alternative would be to posit that the
unity of lenition lies in the kind of abstract cognitive mechanisms that are the
common currency of formal phonology; indeed, a classic Phonology 101 analysis
of intervocalic lenition involves spreading of features such as [voice] or [continu-
ant] from vowels to the targeted consonant.1 However, arguments that the unity
of lenition lies solely in the realm of formal phonology are rare (although see
1An analysis along these lines could account for the specific lenition processes that are thefocus of this dissertation. Since my goal is to determine the extent to which phonetic factorscontribute to our understanding of lenition, I do not pursue such an analysis here. See alsoKirchner (2001b, 12-13) for arguments that the feature-spreading approach is not the mostinsightful analysis of lenition.
3

Harris (1990)). Instead, analyses of lenition that make use of formal tools such
as Optimality-Theoretic constraints typically propose that those constraints have
phonetic motivations (Kirchner 2001b; Kingston 2008).
A third approach is to deny that lenition is a single, unified phenomenon and
instead view it as a tightly knit network of sound patterns with overlapping causes
and properties. It is this last approach that I adopt as a working assumption. If
research on the phonetic and phonological characteristics of lenition has shown us
anything, it is that these sound changes have many properties in common, none of
which matches perfectly to the canonical set of ‘leniting’ alternations. Any given
property that is held up as ‘what lenition really is’ typically excludes some alter-
nations traditionally called lenition (e.g., deletion is not an increase in sonority)
while including others (e.g., final devoicing is not typically considered leniting but
has been argued to involve effort reduction – although see §3.3.3). Indeed, the
reasoning behind any attempt to determine the defining characteristic of lenition
is essentially circular: Property X is associated with many of the alternations we
call lenition. But we are not certain precisely which alternations really count as
lenition. Fortunately, now that we know that lenition is defined by property X,
we can use X to determine which alternations are leniting and which are not.
So as we continue to investigate individual causes of lenition – a research
program to which this dissertation contributes – let us acknowledge the diversity
of factors that are likely responsible for the network of sound patterns sketched in
figure 1.1, and continue to retain ‘lenition’ as convenient cover term for this set of
interrelated patterns, fuzzy boundaries and all. In this spirit, I will use the term
‘lenition’ to refer to the four specific sound patterns under investigation here (see
(1) and (2) below). Note that this approach to lenition is consonant with another
4

use of term: as a label for certain language-specific alternations with complex
lexical and morphological conditioning. The patterns of this type for which the
term is used are clearly fossilized and are no longer transparently ‘lenition’-like;
in addition to canonical alternations such as spirantization or gliding, they often
include non-canonical alternations such as /m/ → [v] (Breton, Stump 1988, 459)
or /n/ → [nj] (Nuu-chah-nulth, Kim and Pulleyblank 2009, 594).
1.2 Phonetic Bases of Lenition
This dissertation focuses on alternations that affect two features of intervocalic
stops: voicing and continuancy. The four patterns that are of particular interest
are schematized in (1) – (2).
(1) a. Attested: Intervocalic voiceless stops targeted for spirantization
(e.g., Tiberian Hebrew)
(i) /VpV/ → [VfV]
(ii) /VtV/ → [VTV]
(iii) /VkV/ → [VxV]
b. Attested: Intervocalic voiced stops targeted for spirantization
(e.g., Spanish)
(i) /VbV/ → [VBV]
(ii) /VdV/ → [VDV]
(iii) /VgV/ → [VGV]
5

(2) a. Attested: Intervocalic voiceless stops targeted for voicing
(e.g., Warndarang)
(i) /VpV/ → [VbV]
(ii) /VtV/ → [VdV]
(iii) /VkV/ → [VgV]
b. Unattested: Intervocalic voiced stops never targeted for devoicing
(i) */VbV/ → [VpV]
(ii) */VdV/ → [VtV]
(iii) */VgV/ → [VkV]
Both voiced and voiceless stops can be targeted for spirantization intervocalically
or in similar environments. In addition, voiceless stops can be targeted for voicing.
Unattested, however, is another hypothetically possible change, in which intervo-
calica voiced stops are specifically targeted for devoicing (illustrated in (2b)). The
fact that (1a), (1b), and (2a) are attested while (2b) is not is something that must
be explained.
Note that it is not enough to say that the alternation of (2b) is unattested
because “it wouldn’t be lenition”. First, this argument assumes that we know
exactly what lenition is; as argued above, this is not the case. Second, unless
the status of intervocalic devoicing as non-leniting is given some phonetic or other
causal basis, the argument is essentially that intervocalic devoicing does not occur
because it is very different from an attested process (voicing), and indeed is the
reverse. There do exist phonological patterns that seem to be the reverse of each
other (see, e.g., Crosswhite (2001) on two types of vowel reduction); thus, we are
left with an argument that (2b) is unattested because it is different from patterns
6
that are attested. The explanation does not explain.
If we seek to ground our account of the contrast between (1a) – (2a) and (2b)
in the particular phonetic properties of the sounds involved, there are at least two
places we might look – the articulatory characteristics of the relevant sequences, or
their perceptual characteristics.2 As discussed above, one traditional understand-
ing of lenition has in fact been that it is a type of articulatory effort reduction.
For cases of spirantization, the intuition is that since the gesture required to pro-
duce a fricative is of smaller magnitude than the gesture required to produce a
stop, the fricative is less effortful than the stop; spirantization is therefore seen
as a type of articulatory ‘undershoot’ along the lines of Lindblom (1983). Some
evidence along these lines has been adduced by the EPG experiments of Lavoie
(2001) and the model of the vocal tract detailed by Kirchner (2001b). For voicing
of voiceless stops, the claim is essentially that having a period of voicelessness
between two (voiced) vowels requires extra effort on the part of the glottis, while
simply continuing modal voicing throughout the entire sequence is less effortful;
Westbury and Keating (1986) and Kingston and Diehl (1994) present evidence for
this view. This account suggests one explanation for the absence of intervocalic
devoicing: as the reverse of intervocalic voicing, devoicing introduces a period of
voicelessness between the vowels, increasing the difficulty of the sequence.
Despite its intuitive appeal, this claim is very difficult to test directly, forcing
researchers to resort to the various indirect methods described above for investi-
gating the relative difficulty of these segments in the appropriate environments.
In addition, precisely because the articulatory account seems so plausible, there
2Naturally, these are not the only possibilities. Gurevich (2004) and Silverman (2006) dis-cuss the interaction of lenition process with the pressure to avoid neutralization; see §2.3 for adiscussion of these issues.
7

has been little investigation of other factors that might help us understand this
type of lenition (although see Kingston (2008)). There may also be reasons to be a
bit suspicious of the articulatory account: for example, from another perspective,
we might expect fricatives to be more effortful than stops because they require
precise placement of the active articulator (Bauer 2008, 609).3 In addition, if
lenited forms are articulatorily superior to unlenited forms, then we might expect
lenition-like patterns to emerge in child language. Interestingly, though, Lleo and
Rakow (2005) found in a study of Spanish-German bilingual children that instead
of transferring the spirantization pattern to their German productions, children
transferred lack of spirantization to their Spanish productions, beginning at about
2;6.4 The evidence that lenited sounds are truly easier is far from clear.
Although discussions of phonetic grounding are dominated by articulatory
considerations in the domain of lenition, there is evidence for other phonological
patterns that perception – and, importantly, misperception – plays an important
role. For example, Ohala (1981) shows that listeners can compensate for coar-
ticulatory effects among segments that are near each other, and proposes that
overcompensation by listeners drives dissimilation-like processes. Hume (2003)
argues that the likelihood of phonological metathesis is related to the ability of the
listener to recover the intended order of the relevant sounds (and as related to the
listener’s native phonotactics). Blevins’ (2004) typology of Change, Chance,
and Choice is intended to account for different ways in which the interaction
between variable production and (mis)perception drives sound change.
3On the other hand, it has been argued by Lavoie (2001), among others, that spirantizationresults not in fricatives but rather in approximants, for which this difficulty would not arise.
4As the authors acknowledge, there are a number of independent factors that might haveencouraged transfer in this direction – most prominently, that the bilingual children were beingraised in Germany.
8

In this dissertation, I present the results of a series of experiments designed to
test the possible perceptual and articulatory bases of lenition. The overarching
goal is to determine whether – and if so, to what extent – phonetic realities
match the typology of lenition and therefore suggest explanations for the range of
attested patterns.
1.3 Outline of Dissertation
In chapter 2, I survey attested lenition processes that apply to intervocalic
stops in order to establish the facts that we must account for.
Chapter 3 discusses a production experiment designed to elicit more and less
effortful productions and investigates whether ‘lenited’ productions are truly less
effortful, as claimed by articulation-based accounts of lenition. The data does not
support the traditional view of lenition as straightforward effort reduction, but
it does suggest that considerations of effort reduction may lead speakers to avoid
‘extreme’ articulations, a practice that may in turn provide precursors to lenition.
Chapter 4 reports the results of three perceptual experiments designed to test
whether a perceptual account of the basic typology of (1) and (2) is viable. The
results of Experiments 2 and 4 suggest that a perceptual account is consistent
with the broad outlines of the typology, while Experiment 3 shows that the more
fine-grained differences by place of articulation revealed in chapter 2 cannot be
explained in the same way.
The combined results of Experiments 1 – 4 fail to support the traditional
account of lenition by which lenited productions are articulatorily easier than un-
lenited ones: articulatory considerations appear to have less to say about lenition
9

than usually thought, and perceptual considerations have more. Chapter 5 illus-
trates what a phonological analysis of lenition would have to look like in order to
be consistent with the results of these four experiments. Chapter 6 concludes.
10
Chapter 2
Typology of Intervocalic Voicing
and Spirantization
Since the goal of this dissertation is to arrive at a better understanding of
the phonetic bases of the lenition of intervocalic stops, its starting point must
naturally be a typology of such lenition. The following survey is based on the work
of Gurevich (2004), who has codified previous typological databases of lenition by
Lavoie (2001) and Kirchner (2001b) and expanded them by compiling the segment
inventories of the relevant languages. Gurevich’s database includes 153 languages,
of which 136 (those for which she was able to obtain a full consonant inventory)
are analyzed here. The table in appendix 7.1 summarizes her findings as they are
relevant to this study.
As acknowledged by its creators, this database is not exhaustive, nor is it
designed to be a typologically balanced sample. The numbers reported below
therefore have dubious statistical value. The importance of this survey is that it
presents a rough picture of the types of lenition processes affecting intervocalic
11
stops that are attested in natural language, and it provides suggestive evidence
as to whether some kinds of processes are more common than others. But the
smaller the numbers involved (especially when very specific processes are under
consideration), the more skeptical we should be of how representative they are.
Gurevich’s (2004) database contains information on a broad range of lenition
processes; thus, only a subset of the processes described in it affect intervocalic
stops (93 of the languages have at least one such alternation). §2.1 gives an
overview of the basic types of processes found in the database that affect intervo-
calic stops. §2.2 examines the effect of place of articulation of the targeted stops,
and §2.3 examines the role of contrast maintenance.
Two kinds of counts are given in the following tables: counts of alternations and
counts of languages. Here, an ‘alternation’ is a change affecting a single segment
and may in fact represent only part of a larger phonological phenomenon. In
Tiberian Hebrew, for example, voiced and voiceless stops (a total of six segments)
undergo spirantization; this pattern is coded as six separate ‘alternations’ (one for
each segment). This method of coding is intended to reflect the extent of the effect
of lenition and to aid the breakdown by place of articulation detailed in §2.2; the
term ‘alternations’ is adopted for convenience and is not intended to represent a
claim about the phonological (dis)unity of the relevant phenomena.
12

2.1 Lenition of Intervocalic Stops: General Ob-
servations
Table 2.1 summarizes the lenition processes in the database that target voice-
less stops, and table 2.2 those that target voiced stops. 61 languages in the
database lenite voiceless stops, and 56 lenite voiced stops. Voicing is overwhelm-
ingly the most common process affecting voiceless stops, followed by spirantization
and simultaneous voicing and spirantization. Spirantization is most common for
voiced stops. A significant number of stops of both types undergo flapping (only
alveolars and retroflexes are affected), and several more undergo approximantiza-
tion.
Table 2.1: Lenition of voiceless stops
Number of Number ofType of Lenition Languages AlternationsVoicing 26 90Spirantization 17 29Both 11 22Other 14 29
Approximantization 5 16Flapping 5 5Debuccalization 3 5Glottalization 3 3
2.2 Place of Articulation
It is not a given that all voiceless stops, or all voiced stops, will behave the
same way with respect to lenition. One factor that might be expected to have an
13

Table 2.2: Lenition of voiced stops
Number of Number ofType of Lenition Languages AlternationsSpirantization 42 81Other 26 35
Flapping 18 18Degemination 2 8Approximantization 3 3Lateralization 2 2‘Lenition’ 2 2Debuccalization 1 1Deaspiration 1 1
effect on a given stop’s behavior is its place of articulation; indeed, to the extent
that the effect of place on stops’ perceptual or articulatory properties is mirrored
in the typology of lenition, we have correspondingly strong (or weak) evidence that
those phonetic factors are driving the attested phonological patterns. This section
compares how often intervocalic stops lenite at three major places of articulation;
if stops at one place are especially prone (or resistant) to a certain kind of lenition,
we may expect to find some phonetic motivation for that fact.
Stops are grouped into three broad categories of place: labials, coronals (den-
tals, alveolars, and retroflexes), and dorsals (velars). Labialized and palatalized
consonants are classified with their primary place of articulation; for example,
labialized velars are classified as dorsals. Palatals and uvulars are excluded en-
tirely.
For each place of articulation, table 2.3 gives the number of languages with a
voiceless stop at that place and, of those, the number that target that stop for
voicing intervocalically (possibly among other environments). The first column
14
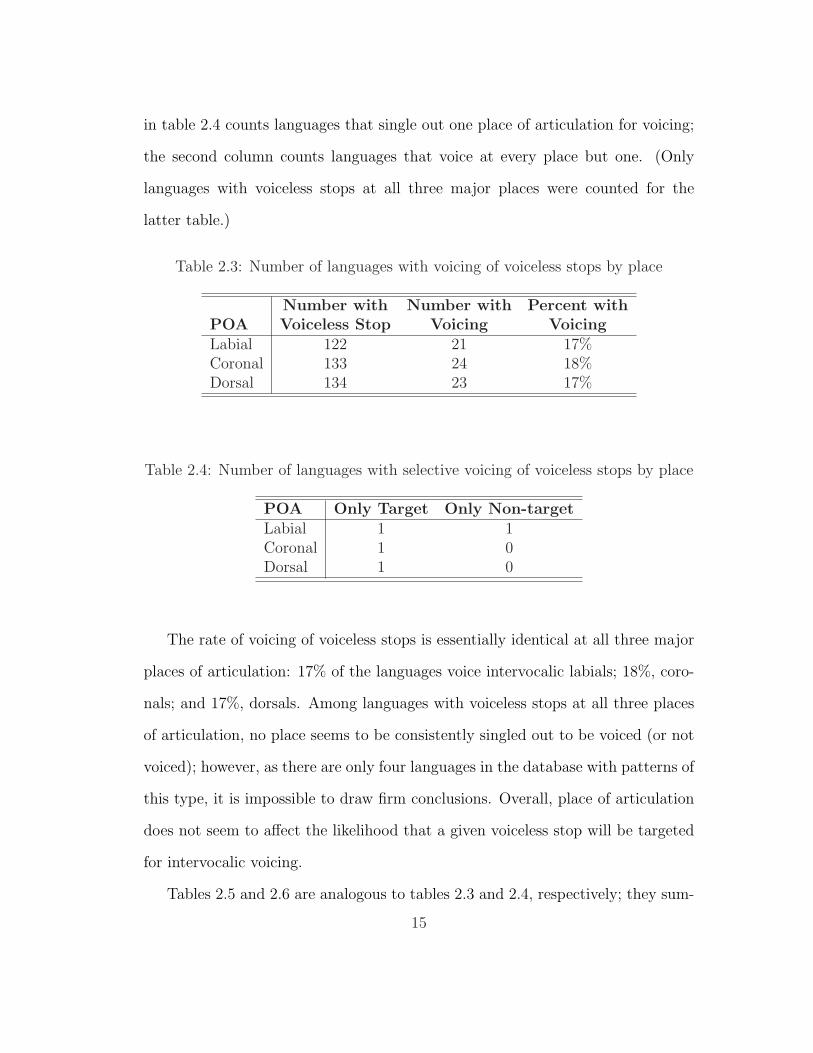
in table 2.4 counts languages that single out one place of articulation for voicing;
the second column counts languages that voice at every place but one. (Only
languages with voiceless stops at all three major places were counted for the
latter table.)
Table 2.3: Number of languages with voicing of voiceless stops by place
Number with Number with Percent withPOA Voiceless Stop Voicing VoicingLabial 122 21 17%Coronal 133 24 18%Dorsal 134 23 17%
Table 2.4: Number of languages with selective voicing of voiceless stops by place
POA Only Target Only Non-targetLabial 1 1Coronal 1 0Dorsal 1 0
The rate of voicing of voiceless stops is essentially identical at all three major
places of articulation: 17% of the languages voice intervocalic labials; 18%, coro-
nals; and 17%, dorsals. Among languages with voiceless stops at all three places
of articulation, no place seems to be consistently singled out to be voiced (or not
voiced); however, as there are only four languages in the database with patterns of
this type, it is impossible to draw firm conclusions. Overall, place of articulation
does not seem to affect the likelihood that a given voiceless stop will be targeted
for intervocalic voicing.
Tables 2.5 and 2.6 are analogous to tables 2.3 and 2.4, respectively; they sum-
15
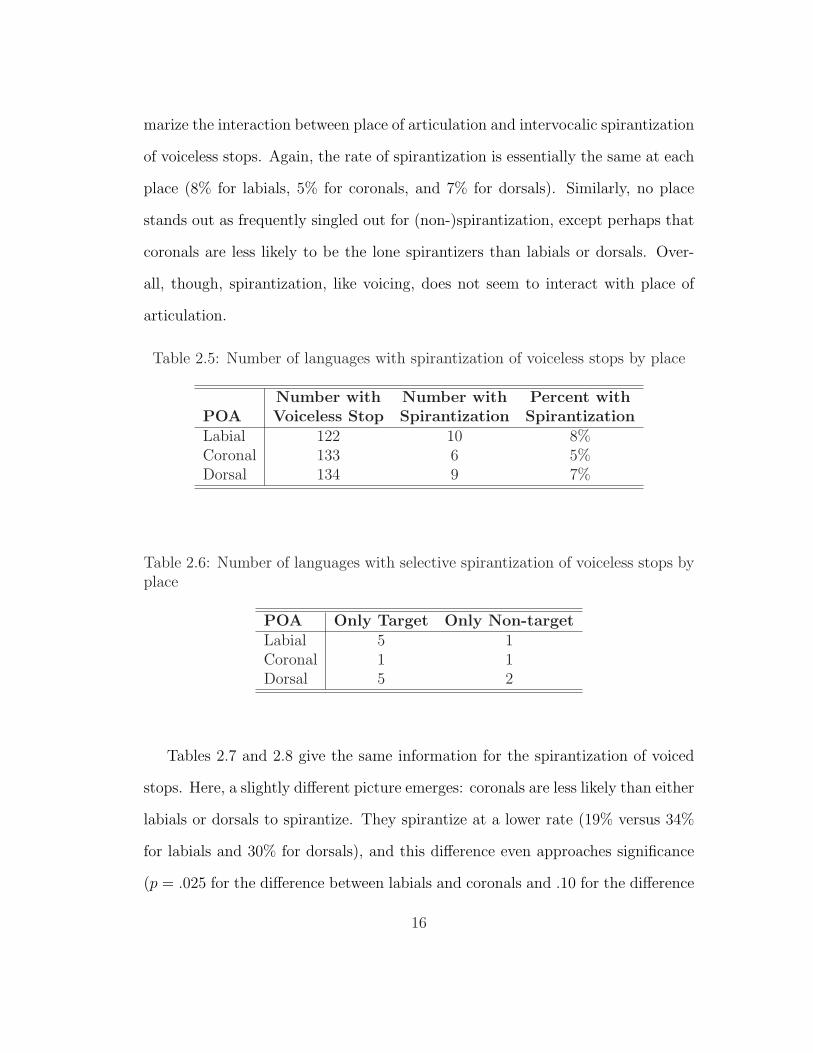
marize the interaction between place of articulation and intervocalic spirantization
of voiceless stops. Again, the rate of spirantization is essentially the same at each
place (8% for labials, 5% for coronals, and 7% for dorsals). Similarly, no place
stands out as frequently singled out for (non-)spirantization, except perhaps that
coronals are less likely to be the lone spirantizers than labials or dorsals. Over-
all, though, spirantization, like voicing, does not seem to interact with place of
articulation.
Table 2.5: Number of languages with spirantization of voiceless stops by place
Number with Number with Percent withPOA Voiceless Stop Spirantization SpirantizationLabial 122 10 8%Coronal 133 6 5%Dorsal 134 9 7%
Table 2.6: Number of languages with selective spirantization of voiceless stops byplace
POA Only Target Only Non-targetLabial 5 1Coronal 1 1Dorsal 5 2
Tables 2.7 and 2.8 give the same information for the spirantization of voiced
stops. Here, a slightly different picture emerges: coronals are less likely than either
labials or dorsals to spirantize. They spirantize at a lower rate (19% versus 34%
for labials and 30% for dorsals), and this difference even approaches significance
(p = .025 for the difference between labials and coronals and .10 for the difference
16

between dorsals and coronals, without adjustment for multiple comparisons). In
addition, of languages with voiced stops at all three major places, seven spirantize
labials and dorsals to the exclusion of coronals; labials are never singled out in
this way and only one language (Dahalo) singles out dorsals as non-spirantizing.
However, it is possible that the apparent recalcitrance of coronals simply reflects
the fact that only coronals (alveolars and retroflexes) are subject to flapping – in
other words, many coronals that would otherwise be targeted for spirantization
flap instead. Indeed, if we add the coronals that flap to the counts in table 2.7,
the number of coronals targeted for lenition rises to 32 (34%), the same rate as
labials and dorsals.
The rate of spirantization for labials is very close to that of dorsals. The
counts suggest that if there is a difference at all, spirantization may preferentially
target labials over dorsals. Labials spirantize at a slightly higher rate (although
the difference is not significant; p = .67), are singled out for spirantization in nine
languages versus five for dorsals, and are never the only place not spirantized. But
since the numbers involved are extremely small and the language sample is not
necessarily balanced, it is possible that this trend is an artifact of this particular
dataset.
Table 2.7: Number of languages with spirantization of voiced stops by place
Number with Number with Percent withPOA Voiced Stop Spirantization SpirantizationLabial 96 33 34%Coronal 95 18 19%Dorsal 89 27 30%
Note that these findings do not necessarily agree with statements elsewhere in
17
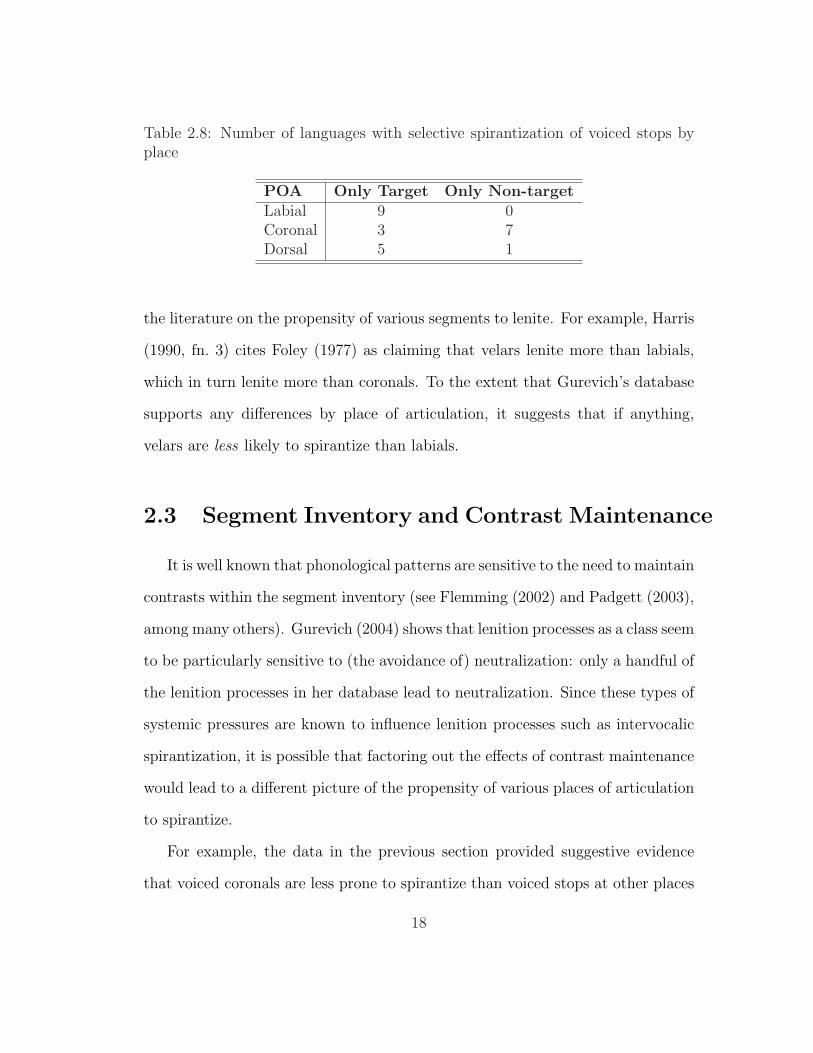
Table 2.8: Number of languages with selective spirantization of voiced stops byplace
POA Only Target Only Non-targetLabial 9 0Coronal 3 7Dorsal 5 1
the literature on the propensity of various segments to lenite. For example, Harris
(1990, fn. 3) cites Foley (1977) as claiming that velars lenite more than labials,
which in turn lenite more than coronals. To the extent that Gurevich’s database
supports any differences by place of articulation, it suggests that if anything,
velars are less likely to spirantize than labials.
2.3 Segment Inventory and Contrast Maintenance
It is well known that phonological patterns are sensitive to the need to maintain
contrasts within the segment inventory (see Flemming (2002) and Padgett (2003),
among many others). Gurevich (2004) shows that lenition processes as a class seem
to be particularly sensitive to (the avoidance of) neutralization: only a handful of
the lenition processes in her database lead to neutralization. Since these types of
systemic pressures are known to influence lenition processes such as intervocalic
spirantization, it is possible that factoring out the effects of contrast maintenance
would lead to a different picture of the propensity of various places of articulation
to spirantize.
For example, the data in the previous section provided suggestive evidence
that voiced coronals are less prone to spirantize than voiced stops at other places
18
of articulation, and that voiced labials may be slightly more prone to spirantize
than voiced dorsals. If, for independent reasons, systemic pressures have a dispro-
portionate influence on certain places of articulation, then we could conclude that
the observed asymmetries are not the result of an inherent tendency for languages
to spirantize some places of articulation more than others.
There are at least two ways systemic facts might interact with spirantization.
First, if a language already has a contrast between a voiced stop and a voiced
spirant at some place of articulation, then spirantization at that place of articula-
tion would lead to neutralization and is therefore likely to be avoided. Therefore,
if there are more languages with [G] than with [B], then there are more languages
that are free to spirantize labials than dorsals without fear of neutralization.
Second, if a language has voicing of voiceless stops in at least some of the
contexts where it already has voiced stops, then spirantization would be a way to
maintain the contrast between the two series in the relevant environments. (In
fact, Silverman (2006) argues that pressure from intervocalic voicing is the pri-
mary, or perhaps the only, motivation for intervocalic spirantization.) Therefore,
if there are more languages that voice /p/ in the relevant contexts than languages
that voice /k/, then there are more languages that are pressured to spirantize
labials than dorsals in order to maintain the relevant contrast.
Tables 2.9 – 2.11 present counts of the languages in Gurevich’s (2004) database,
broken down by the systemic possibilities discussed above. Each table includes
only those languages that have a voiced stop at the relevant place of articula-
tion (thus, those languages with a possibility of spirantizing). The first two lines
of each table report the number of languages with and without the relevant con-
trasting voiced fricative; the tables for labials and coronals also report the number
19

of languages with [v] and [z], respectively – although spirantization yields these
segments less often than [B] and [D], it is possible that they might nevertheless
be systemically relevant. The second two lines of each table report the number
of languages with and without voicing of voiceless stops at the relevant place of
articulation, where voicing takes place in at least some of the same environments
as spirantization. Languages that were reported to lack the relevant voiceless
stop altogether were included and were classified as not having voicing, since any
spirantization that does occur takes place without being ‘pushed’ by voicing of
another series.
Table 2.9: Number of languages with spirantization of /b/ by presence of /B/ andvoicing of /p/
No Percent withSpirantization Spirantization Spirantization
/B/ (/v/) Present 0 (9) 4 (15) 0% (38%)/B/ Absent 24 44 35%/p/ → [b] 2 3 40%/p/ 6→ [b] 31 60 34%
Table 2.10: Number of languages with spirantization of /d/ by presence of /D/and voicing of /t/
No Percent withSpirantization Spirantization Spirantization
/D/ (/z/) Present 0 (12) 4 (36) 0% (25%)/D/ Absent 6 37 14%/t/ → [d] 3 2 60%/t/ 6→ [d] 16 75 18%
At all three places of articulation, languages are less likely to spirantize at
20
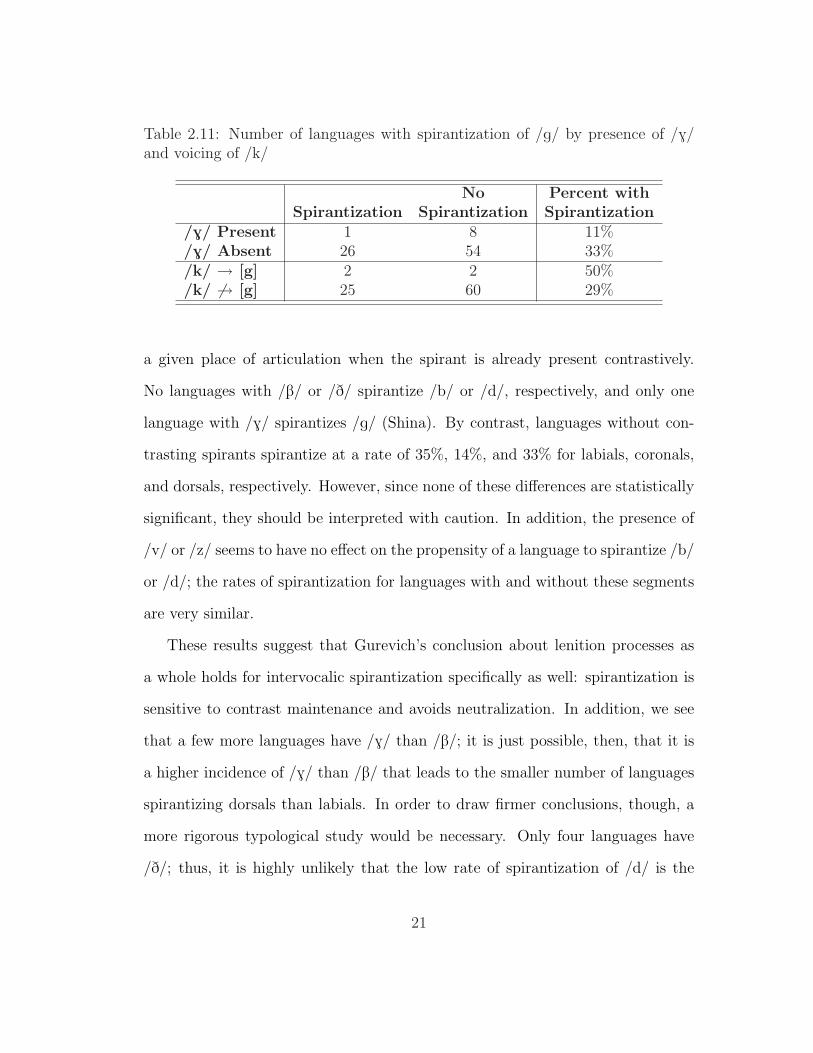
Table 2.11: Number of languages with spirantization of /g/ by presence of /G/and voicing of /k/
No Percent withSpirantization Spirantization Spirantization
/G/ Present 1 8 11%/G/ Absent 26 54 33%/k/ → [g] 2 2 50%/k/ 6→ [g] 25 60 29%
a given place of articulation when the spirant is already present contrastively.
No languages with /B/ or /D/ spirantize /b/ or /d/, respectively, and only one
language with /G/ spirantizes /g/ (Shina). By contrast, languages without con-
trasting spirants spirantize at a rate of 35%, 14%, and 33% for labials, coronals,
and dorsals, respectively. However, since none of these differences are statistically
significant, they should be interpreted with caution. In addition, the presence of
/v/ or /z/ seems to have no effect on the propensity of a language to spirantize /b/
or /d/; the rates of spirantization for languages with and without these segments
are very similar.
These results suggest that Gurevich’s conclusion about lenition processes as
a whole holds for intervocalic spirantization specifically as well: spirantization is
sensitive to contrast maintenance and avoids neutralization. In addition, we see
that a few more languages have /G/ than /B/; it is just possible, then, that it is
a higher incidence of /G/ than /B/ that leads to the smaller number of languages
spirantizing dorsals than labials. In order to draw firmer conclusions, though, a
more rigorous typological study would be necessary. Only four languages have
/D/; thus, it is highly unlikely that the low rate of spirantization of /d/ is the
21
result of languages avoiding neutralization with /D/.
The numbers above also suggest a role played by voicing of voiceless stops.
At each place of articulation, a greater proportion of languages with voicing also
spirantize than languages without voicing. Again, though, the numbers are too
small to be statistically significant. (The results for the coronals come closest;
p = .082.) In addition, the number of languages with voicing is very similar
at each place of articulation, suggesting that independent patterns of voicing of
voiceless stops are not likely to account for the different rates of spirantization at
various places of articulation.
Finally, these results present us with the opportunity to investigate the strong
and interesting claim of Silverman (2006) referred to above. Silverman discusses
the case of Corsican, which has both intervocalic voicing of voiceless stops and in-
tervocalic spirantization of voiced stops. He argues that intervocalic spirantization
is not a ‘natural’ sound change, but rather one that is motivated by considerations
of contrast maintenance:
The idea, then, is that intervocalic spirantization arises in functionalresponse to the phonetically natural #[t]-V[d]V alternation. Just as [t]naturally moves towards [d] intervocalically largely for phonetic rea-sons, the other [d] here will not be pushed in any particular directionfor phonetic reasons, but instead will gradually be pushed toward [D]largely for functional reasons, since tokens with fricative variants werecommunicated more successfully to listeners, while variants that re-main [d]-like will be more confusable with those intervocalic [d]s thatalternate with word-initial [t]....
To summarize, the example of Corsican reveals something very im-portant about the inter-relatedness of contrastive sounds that eachhas its own [sic] set of allophonic alternants: while phonetic pressuresmay pull one sound towards a context-specific more natural state,functional pressures may, in response, push an opposing sound to a
22

context-specific less natural state.
(pp. 165-166, italics original)
Although Silverman is likely correct that intervocalic voicing encourages inter-
vocalic spirantization – and the data above provides additional evidence for this
view – his claim that neutralization avoidance is the only (or even the primary)
motivation for intervocalic spirantization cannot be supported. Of the languages
with spirantization counted in tables 2.9 – 2.11, the vast majority do not also have
voicing of voiceless stops (94%, 84%, and 93% for labials, coronals, and dorsals,
respectively);1 thus, Silverman’s claim that “[spirantization] is usually found in
languages that also have a #[t]-V[d]V alternation as well” (p. 165) is simply false.
If spirantization is unnatural but can be forced by voicing of another stop series,
where do all of the languages with spirantization but no voicing come from? The
results of Experiment 2 suggest that part of the answer may be voiced stops’ high
degree of confusability with voiced spirants, although the question of what induces
voiced stops to change at all remains unanswered. Again, articulatory factors may
play a role, although as Silverman (2006, 165) correctly points out, any claims
about the influence of articulation must be supported with more direct evidence
than is currently available. Indeed, the results of Experiment 1 support Silver-
man’s contention that considerations of effort reduction do not directly encourage
intervocalic spirantization.
Incidentally, Silverman’s argument from typological evidence that intervocalic
spirantization is articulatorily unnatural is not supported by Gurevich’s data ei-
ther. He argues that intervocalic spirantization is shown to be unnatural because
1Northern Corsican, which is Silverman’s case study, was excluded from this analysis becauseits segment inventory is not given in Gurevich (2004). Even if it is included, the numbers remainhigh: 91%, 80%, and 89% for labials, coronals, and dorsals, respectively.
23

intervocalic voiceless stops rarely spirantize, especially not to voiced spirants.
However, table 2.1 above shows that although spirantization of voiceless stops is
less common than either voicing of voiceless stops or spirantization of voiced stops,
the /T/ → [S] pattern is nevertheless robustly attested, and even the /T/ → [Z]
pattern is far from nonexistant. Thus, intervocalic spirantization is a well-attested
option across languages, places of articulation, and voicing of the affected stops.
24
Chapter 3
Articulatory Effort Reduction
This chapter reports the results of an experiment designed to explore whether
articulatory effort reduction plays a role in the lenition of intervocalic stops. Pre-
vious studies of articulatory effort, I argue below, are lacking in that they use
indirect means to assess effort: either abstract models of the articulatory appara-
tus, or post-hoc reasoning from the characteristics of the relevant gestures to the
relative effort involved. Experiment 1 takes an approach that is, to my knowledge,
nearly unique in the literature: it attempts to observe effort reduction in action
in the laboratory, by creating conditions meant to encourage subjects to use less
effort in speaking.
The premise of the experiment is that a subject who is tired or impaired
will produce less effortful articulations than he otherwise would; therefore, by
comparing the speech of subjects in normal and tired conditions, we can identify
as ‘easy’ those productions that are favored in the tired condition. Of course,
saying that we would like to study tired speech is one thing, and actually inducing
tiredness in a laboratory setting is another. In Experiment 1, I simulated tiredness
25

with intoxication, comparing the speech of subjects who were intoxicated with the
speech of the same subjects when they were sober. I do not claim that inducing
intoxication is the only or even the best way to simulate tiredness in the laboratory;
indeed, it is possible that each of the conceivable methods of inducing tiredness
or other general impairment (intoxication, exercise, sleep deprivation, emotional
stress, etc.) has its own unique characteristics and gives us only a partial picture
of speech under impairment. Experiment 1 is intended as an initial exploration
of what impairment of some kind might tell us about articulatory effort.
3.1 Assessing Articulatory Effort
Most previous assessments of articulatory effort in the literature fall into one
of two categories. In the first type, a researcher argues that some characteristic
of a certain type of production causes that production to require more effort than
productions that lack that characteristic. The following representative quotations
illustrate some of the characteristics of speech sounds that have been claimed to
affect their difficulty:
Displacement of articulator “Extreme displacements and extreme velocities
are avoided....we find that speech production appears to operate as if phys-
iological processes were governed by a power constraint limiting energy ex-
penditure per unit time.” (Lindblom 1983, 231)
Speed of articulator movement “Matthies et al. (2001) report that the peak
velocities of lip movements are greater for clear speech than for conversa-
tional speech for /iCu/ syllables. These studies demonstrate that the pro-
26
duction of clear speech requires more effort and expends more energy than
does the production of conversational speech.” (Uchanski 2005, 226)
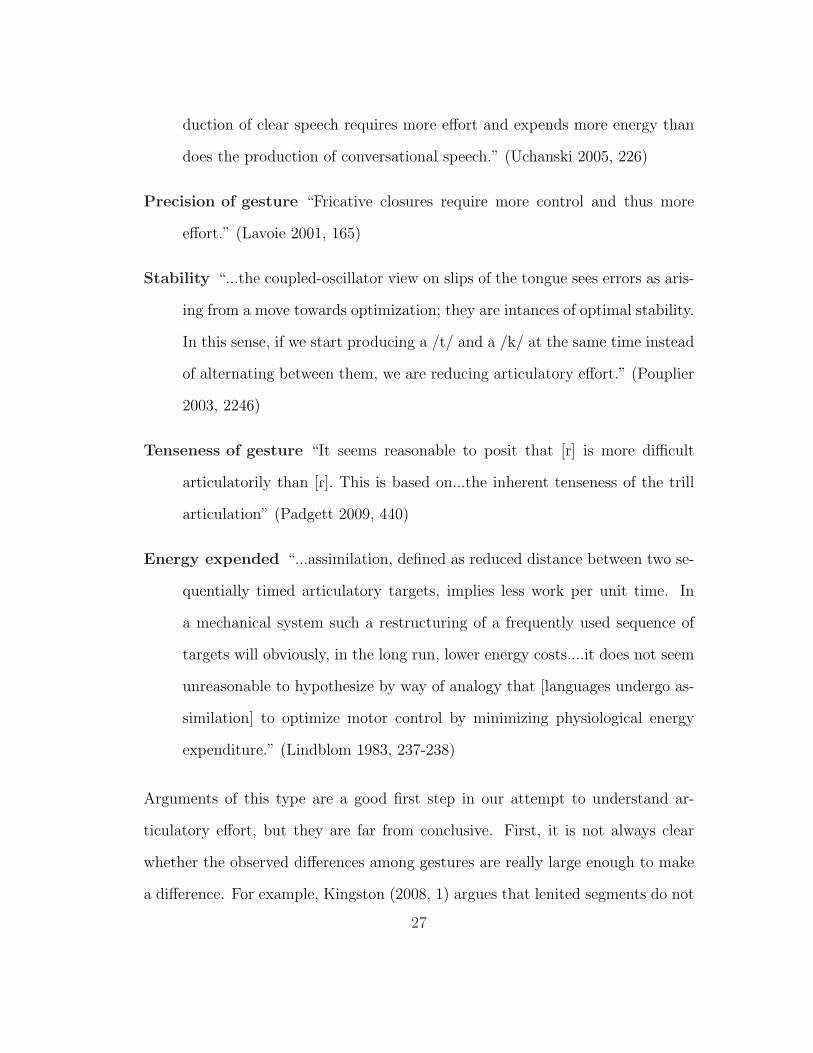
Precision of gesture “Fricative closures require more control and thus more
effort.” (Lavoie 2001, 165)
Stability “...the coupled-oscillator view on slips of the tongue sees errors as aris-
ing from a move towards optimization; they are intances of optimal stability.
In this sense, if we start producing a /t/ and a /k/ at the same time instead
of alternating between them, we are reducing articulatory effort.” (Pouplier
2003, 2246)
Tenseness of gesture “It seems reasonable to posit that [r] is more difficult
articulatorily than [R]. This is based on...the inherent tenseness of the trill
articulation” (Padgett 2009, 440)
Energy expended “...assimilation, defined as reduced distance between two se-
quentially timed articulatory targets, implies less work per unit time. In
a mechanical system such a restructuring of a frequently used sequence of
targets will obviously, in the long run, lower energy costs....it does not seem
unreasonable to hypothesize by way of analogy that [languages undergo as-
similation] to optimize motor control by minimizing physiological energy
expenditure.” (Lindblom 1983, 237-238)
Arguments of this type are a good first step in our attempt to understand ar-
ticulatory effort, but they are far from conclusive. First, it is not always clear
whether the observed differences among gestures are really large enough to make
a difference. For example, Kingston (2008, 1) argues that lenited segments do not
27

require less effort than unlenited segments, because the differences between the
two productions in distance traveled by the articulators and in time are extremely
small. Second, the metrics of effort listed above may conflict. For example, frica-
tives require a smaller gesture than stops (suggesting that they require less effort),
but they also require more precision (suggesting that they require more). There
is not always an obvious way to combine these metrics and determine the overall
amount of ‘effort’ required for a given production.
The second way researchers have assessed articulatory effort involves building
an abstract model of the speech apparatus and comparing the production re-
quirements predicted by the model for different segment types. Such approaches
generally interpret one parameter (or more) of the model as a measure of articu-
latory effort, with a given production’s value for that parameter translating into
the degree of effort it requires. Notable examples of models of this type include
the following:
� Lindblom and Sundberg (1971), Lindblom (1983), and Lindblom (1990)
describe a model of tongue shapes and the possible shapes associated with
various consonants and vowels. Lindblom (1983) argues that coarticulation
between consonants and vowels is predicted by a constraint that penalizes
extreme parameter values in the model.
� Westbury and Keating (1986) describe a model of airflow in the vocal tract.
They define ‘easy’ articulations to be those that require the slowest artic-
ulator movements, and show that the model predicts voicing to be easier
in some contexts (intervocalically) than in others (initially or finally). The
same model has been applied by Hayes (2004[1999]) to other environments.
28
� Kirchner (2001b) constructs a mass-spring model of the vocal tract (along
the lines sketched in Lindblom (1983, 227-229)). He defines effort as the
total force exerted throughout a production, showing that the model pre-
dicts that certain types of lenited consonants are less effortful than their
unlenited counterparts (for example, that singleton stops are less effortful
than geminates).
� Nam et al. (2009) model articulatory gestures as coupled oscillators. They
assume that in-phase (0°) coupling is the most stable mode and anti-phase
(180°) coupling the second most stable, as established in research on coordi-
nated movement of human limbs; they also follow earlier work in associating
the two modes with CV and VC sequences, respectively. They show that a
model based on these two assumptions makes a number of correct predic-
tions, including earlier acquisition of CV relative to VC by children.
Models of this type are an improvement over case-by-case reasoning in that they
attempt to model larger systems, and often offer at least an in-principle solution
to the problem of conflicting measures of effort. For example, Kirchner (2001b)
incorporates into his metric of force expended the dimensions of speed of articu-
lator movement (greater speed requires more force), distance traveled (a greater
distance requires more force), and precision (precise gestures require several coun-
teracting forces to keep the relevant articulator at exactly the right position). All
these factors are collapsed onto a single dimension so that the net effort expended
can be determined.
However, abstract models like these still require the researcher to choose some
parameter of the model as the one that best represents ‘effort’; although the
29

methods described above involve reasonable choices, there is no guarantee that
they are the best choices in terms of describing which sounds are more effortful
than others. In addition, since models are by definition simplifications of real-
world phenomena, there is always the danger of putting into these models what
we expect to get out of them. It is not surprising, for example, that if we describe
the articulatory apparatus as a means of applying forces to various masses, then
it takes more force to cause a given mass to move farther or faster; or that if we
assume that children are biased towards more stable CV sequences over less stable
VC sequences, then they acquire CV sequences first.
In Experiment 1, I take a different approach altogether. Rather than trying
to reason through whether lenited productions are more or less effortful than
unlenited productions, I attempt to create conditions in the laboratory that will
encourage subjects to use less articulatory effort than they otherwise would. If
subjects favor one type of production in the ‘low-effort’ condition more than they
do in the control condition, then we have evidence that that production requires
less effort than productions that are not favored in the ‘low-effort’ condition. I am
aware of only one other study along these lines in the literature: Walter (2008)
reports experimental results showing that qualitative lenition is more likely in
consonants with an identical consonant in an adjacent syllable.
In this study, I encourage effort reduction in subjects with intoxication. If this
method is successful, it will tell us which segments are easier than others, but not
why they are easier. As detailed in §3.2, intoxication impairs subject performance
in a number of different ways, any of which might or might not be responsible
for any effort reduction revealed by Experiment 1. Determining what factors
contribute to articulatory effort and how they interact is an important topic for
30
future research. However, the necessary first step is to acquire more solid evidence
as to which productions require more or less effort in the first place, and that is
the goal of Experiment 1.
3.2 Physical and Linguistic Effects of Alcohol
Consumption
Alcohol is a depressant and is known to impair cognitive and motor function
(Chin and Pisoni 1997). At small doses, alcohol may actually increase performance
slightly on some tasks (Chin and Pisoni 1997, 19-20,22); however, this effect seems
to be limited to blood alcohol concentrations well below the level of .10 achieved
in this study (Hollien and Martin 1996, 109-111). In general, intoxication impairs
both speed and accuracy on tasks, and at levels above .10 impairs fine motor
performance (Chin and Pisoni 1997, 21-22).
By far the most common documented effect of intoxication on speech is an over-
all lengthening effect; see, e.g., Lester and Skousen (1974, 233-234), Pisoni et al.
(1986, 138), Johnson et al. (1990), Kunzel (1992, 33,36), and Hollien and Martin
(1996, 125). Intoxication has also been reported to result in expanded (Kunzel
1992; Watanabe et al. 1994, 341) and more variable (Pisoni et al. 1986, 141) pitch
ranges. Alcohol induces production errors at the segmental level (Kunzel 1992;
Hollien and Martin 1996, 125); specific errors that have been documented include
lengthening of vowels and consonants, deletion, changes in nasality, and distor-
tions of [s] (Lester and Skousen 1974; Kunzel 1992; Pisoni et al. 1986). Kunzel
(1992, 33) observes substitution of [D] for [d] and attributes the change to incom-
31
plete articulation. Purnell (2010) observes what appears to be a rotation of the
vowel space (at least for front vowels) in intoxicated subjects.
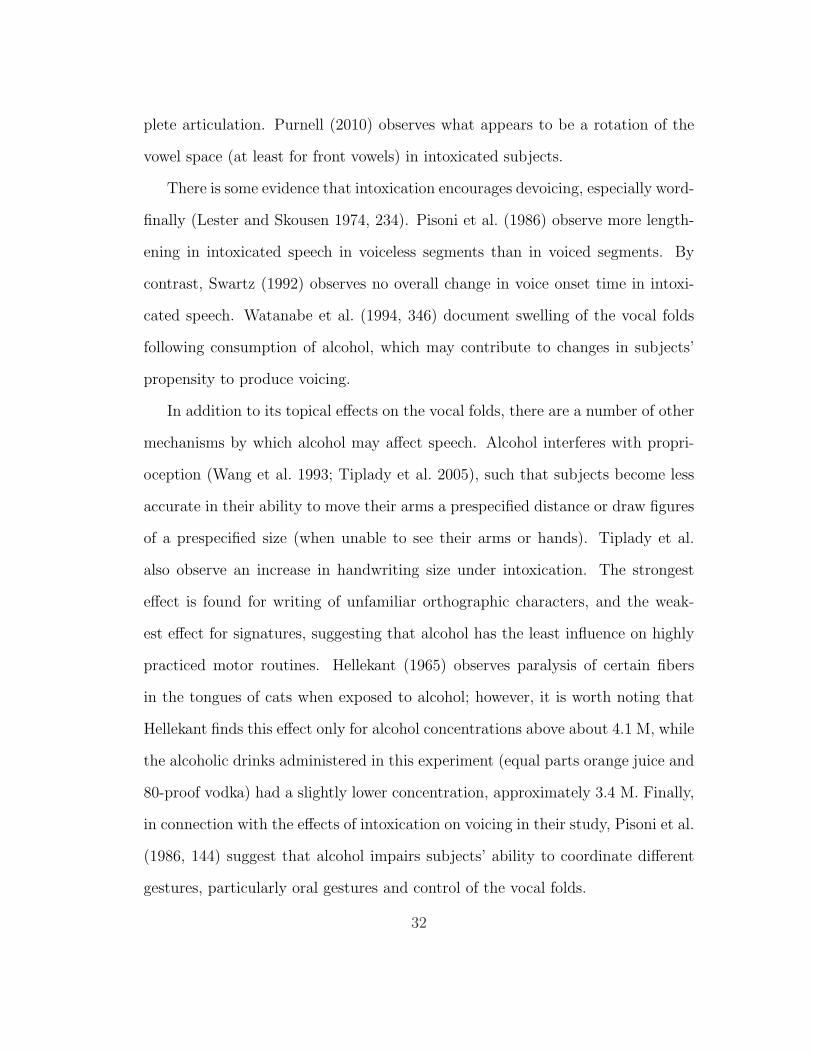
There is some evidence that intoxication encourages devoicing, especially word-
finally (Lester and Skousen 1974, 234). Pisoni et al. (1986) observe more length-
ening in intoxicated speech in voiceless segments than in voiced segments. By
contrast, Swartz (1992) observes no overall change in voice onset time in intoxi-
cated speech. Watanabe et al. (1994, 346) document swelling of the vocal folds
following consumption of alcohol, which may contribute to changes in subjects’
propensity to produce voicing.
In addition to its topical effects on the vocal folds, there are a number of other
mechanisms by which alcohol may affect speech. Alcohol interferes with propri-
oception (Wang et al. 1993; Tiplady et al. 2005), such that subjects become less
accurate in their ability to move their arms a prespecified distance or draw figures
of a prespecified size (when unable to see their arms or hands). Tiplady et al.
also observe an increase in handwriting size under intoxication. The strongest
effect is found for writing of unfamiliar orthographic characters, and the weak-
est effect for signatures, suggesting that alcohol has the least influence on highly
practiced motor routines. Hellekant (1965) observes paralysis of certain fibers
in the tongues of cats when exposed to alcohol; however, it is worth noting that
Hellekant finds this effect only for alcohol concentrations above about 4.1 M, while
the alcoholic drinks administered in this experiment (equal parts orange juice and
80-proof vodka) had a slightly lower concentration, approximately 3.4 M. Finally,
in connection with the effects of intoxication on voicing in their study, Pisoni et al.
(1986, 144) suggest that alcohol impairs subjects’ ability to coordinate different
gestures, particularly oral gestures and control of the vocal folds.
32
Thus, alcohol affects subject performance in a number of ways, and it also
affects speech. Several of the specific effects of alcohol parallel the metrics of
articulatory effort discussed above:
� Reduced speed of subject performance may decrease the speed at which
subjects can move their articulators
� Impaired accuracy may decrease subjects’ ability to effect precise placement
of their articulators
� Alcohol as a depressant may limit the overall amount of energy subjects are
able or willing to expend
� By impairing subjects’ overall cognitive abilities, alcohol may impair sub-
jects’ ability to manage complex patterns of gestural coordination and cause
them to revert to more ‘stable’ patterns
The fact that alcohol impairs cognitive and motor function in these ways, and the
fact that intoxicated subjects do make more speech errors, suggest that alcohol
consumption is a promising way to encourage subjects to expend less articulatory
effort. Indeed, some of the speech errors documented under intoxication (such as
substitution of [D] for [d]) look tantalizingly like the types of lenition processes
being investigated here.
However, intoxication is most relevant to the study of articulatory effort in
general to the extent that it induces or exaggerates behavior that has other causes
as well. In other words, if intoxication has some effect on speech production
that causes subjects to lenite, but only intoxication affects speech in that way,
then lenition by intoxicated subjects probably does not tell us much about what
33
drives lenition in general. It is unlikely that lenition never occurs in teetotalling
communities! For some of the effects of alcohol (such as a general impairment
of fine motor control), it seems quite likely that there are other ways to produce
similar effects; for others, however (such as swelling of the vocal folds), it is less
clear that we are not dealing with something alcohol-specific.
It is entirely possible, therefore, that in the final analysis intoxicated speech
tells us little that is relevant to the role of articulatory effort in phonological pat-
terns. But in the absence of more direct evidence concerning which productions
are more difficult than others, I submit that this method is worth serious con-
sideration. In addition, because the physical effects of alcohol are so varied, and
because the articulatory apparatus is so complex, I am not comfortable pointing
to any one effect of alcohol and claiming that that effect is the sole or primary
cause of the results seen in Experiment 1. Indeed, it would be irresponsible to
rule out intoxication entirely as a tool for investigating effort reduction simply
because it might have other effects as well. No method of studying articulatory
effort is perfect. We simply do not know the extent to which the results of this
method are or are not specific to intoxicated speech – and we cannot know until
we have tried it. I view this experimental method as an important early step in a
research program that attempts to observe effort reduction in action.
34

3.3 Experiment 1
3.3.1 Design
Stimuli
Three sets of stimuli were used in the experiment; all were real words of En-
glish. A full list of stimuli is included in appendix 7.2. The ‘effective contrast’
(frequency-weighted neighborhood density, Ussishkin and Wedel (2009)) of each
stimulus was calculated from the frequency data in the CELEX database (Baayen
et al. 1995); within each set, stimuli were chosen from as narrow a range of EC
values as possible to ensure comparability among different subsets of stimuli.
The ‘nasal-stop’ set consisted of 56 disyllabic words with an intervocalic nasal-
stop cluster (e.g., amber); each possible stop ([b], [p], [d], [t], [g], or [k]) was
represented by 10 stimuli, except for [g], for which there were 6 stimuli. All words
had primary stress on the first syllable and no stress on the second syllable.
The ‘lenition’ set consisted of 72 disyllabic words with a single intervocalic
stop (e.g., buggy); each possible stop was represented by 12 stimuli. All words
had primary stress on the first syllable and no stress on the second syllable.
The ‘CVC’ set consisted of 136 words with the shape CVC; each of the vowels
and diphthongs of English ([i], [I], [E], [æ], [a], [2], [Ú], [u], [eI], [oÚ], [aI], [aÚ], or
[OI]) was represented by 12 stimuli, except for [Ú], [aÚ], and [OI], for which there
were fewer stimuli. All of the consonants in these stimuli were obstruents. These
stimuli are treated as fillers in the analyses below and are not analyzed further.
35
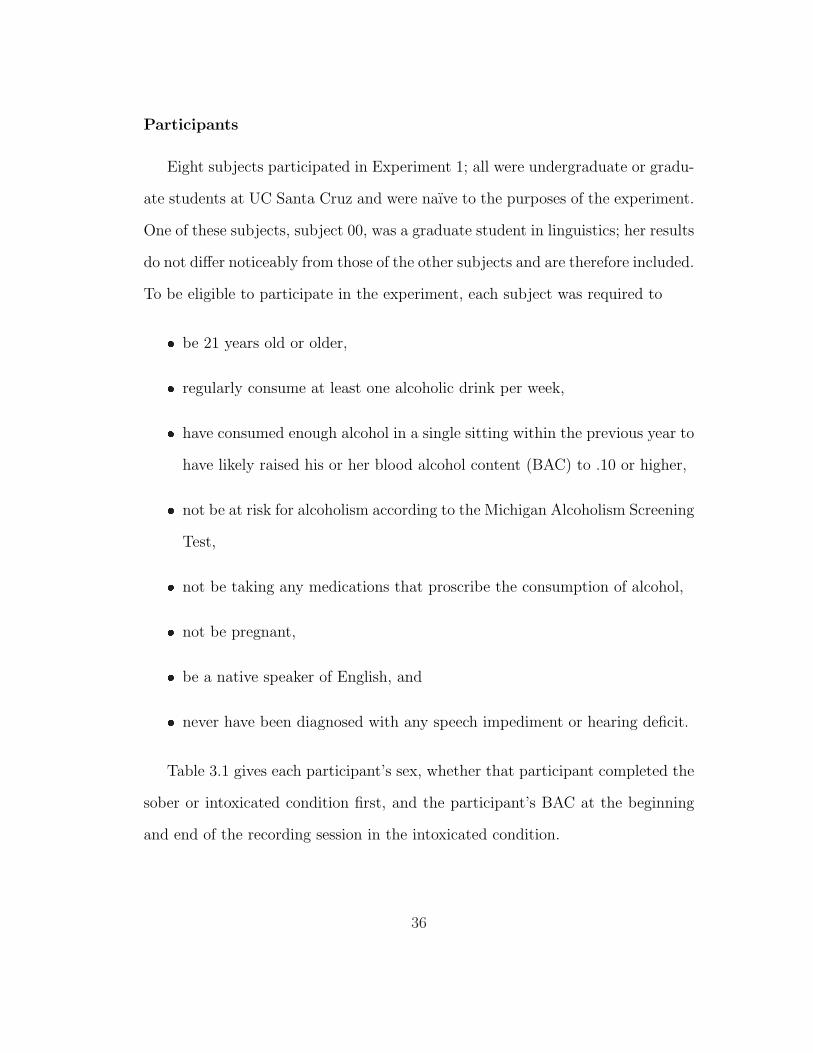
Participants
Eight subjects participated in Experiment 1; all were undergraduate or gradu-
ate students at UC Santa Cruz and were naıve to the purposes of the experiment.
One of these subjects, subject 00, was a graduate student in linguistics; her results
do not differ noticeably from those of the other subjects and are therefore included.
To be eligible to participate in the experiment, each subject was required to
� be 21 years old or older,
� regularly consume at least one alcoholic drink per week,
� have consumed enough alcohol in a single sitting within the previous year to
have likely raised his or her blood alcohol content (BAC) to .10 or higher,
� not be at risk for alcoholism according to the Michigan Alcoholism Screening
Test,
� not be taking any medications that proscribe the consumption of alcohol,
� not be pregnant,
� be a native speaker of English, and
� never have been diagnosed with any speech impediment or hearing deficit.
Table 3.1 gives each participant’s sex, whether that participant completed the
sober or intoxicated condition first, and the participant’s BAC at the beginning
and end of the recording session in the intoxicated condition.
36

Table 3.1: Participants in Experiment 1. BACi and BACf are the participant’sBAC at the beginning and end, respectively, of the recording session in the intox-icated condition
Subject Sex First Session BACi BACf
00 F sober .10 .0701 F intoxicated .09 .0702 F intoxicated .11 .0903 M sober .12 .1004 M sober .10 .1305 M intoxicated .10 .0906 F sober .10 .0707 M sober .10 .18
Procedure
Each subject was recorded in both the sober condition and the intoxicated
condition. With the exception of subject 00, the two recording sessions took place
on separate days; the order of the two sessions was varied across subjects. Sessions
followed the following procedure:
1. For the intoxicated condition, the subject was asked not to consume alcohol
for 12 hours before the session began, and not to eat for 2 hours before the
session.
2. At the beginning of each session, the subject read out loud a printed list of
the stimuli to ensure that the subject was familiar with all of the words and
had seen them all recently.
3. In the intoxicated condition, alcohol was administered so that the subject
had a BAC between .10 and .12. (This level is slightly above .08, the legal
limit for driving in the United States.)
37

(a) The initial dose of alcohol (equal parts 80-proof vodka and orange juice)
was half of what was calculated to be necessary to bring the subject’s
BAC to between .10 and .12, based on the subject’s sex and weight.
(b) After the subject finished the initial dose, he or she was given a Breath-
alyzer test and, if necessary, received further smaller doses of alcohol
until the window of .10 – .12 was reached.
4. The subject made the recording alone in a sound-attenuated booth. Stimuli
were presented one by one in random order on a computer screen; the subject
read each word in the frame sentence “I SAID already” and pressed the
space bar to move on to the next word. Each stimulus was presented twice;
the entire recording session took 20 – 30 minutes.
5. In the intoxicated condition, the subject remained in the lab until his or her
BAC had declined to .04 or below.
3.3.2 Measurements
Subjects’ recordings were analyzed in Praat (Boersma and Weenink 2007).
The following sections describe the landmarks that were identified for each type
of stimulus and how they were placed.
All Stimuli
The following landmarks were identified in all tokens, regardless of stimulus
type.
Beginning of utterance (Ui) The beginning of the utterance (that is, the frame
38

sentence) was defined as the beginning of the (regular or irregular) glottal
pulses of the I.
End of utterance (Uf) The end of the utterance was defined as the first point
in the [i] of already that was followed by a period of silence (that is, a period
with no energy at any point in the spectrum). Subjects commonly produced
breathy voice at the end of the frame sentence, sometimes making such a
point difficult to identify.
Beginning of stimulus (Wi) The way in which the beginning of the stimulus
was defined depended on the initial segment of the stimulus.
For stimuli beginning with a vowel or sonorant consonant, Wi was placed
after the release of the [d] of said and any associated aspiration or other
turbulent noise. If the subject paused between said and the stimulus, Wi
was placed at the first glottal pulse of the stimulus.
For stimuli beginning with a stop or affricate, Wi was placed at the closure
of the [d] of said. This location was chosen because in the vast majority of
cases, subjects did not produce a separate release for the [d] of said, and it
was therefore impossible to distinguish between the closure of the [d] and
the closure of the initial consonant of the stimulus. In the few tokens that
did have a separate release after said, Wi was nevertheless placed at the
closure of the [d] for the sake of consistency.
For stimuli beginning with a fricative, Wi was placed at the beginning of
the turbulent noise associated with the frication.
End of stimulus (Wf) The way in which the end of the stimulus was defined
39

depended on the final segment of the stimulus.
For stimuli ending with a stop, Wf was placed after the release of the stop
and any release or aspiration associated with it.
For stimuli ending with a fricative or affricate, Wf was placed at the end of
the turbulent noise associated with the frication.
For stimuli ending with a nasal, Wf was placed at the point where the
antiformants and decreased intensity associated with the nasal ended.
For stimuli ending with a vowel or sonorant consonant, Wf was placed at
the beginning of the formant transitions between the final segment of the
stimulus and the [a] of already. In most cases, this final segment was either
[i], in which case the beginning of the F2 transition was used, or [ô"], in which
case the beginning of the F3 transition was used.
Closure of [d] of said (Sclo) For all stimuli that did not begin with a stop or
affricate (that is, those for which Wi was not placed at the closure of the [d]
of said), an additional landmark Sclo was placed at the closure.
End of voicing of [d] of said (Svoi) The end of voicing of the [d] of said was
defined as the last glottal pulse following Sclo. If there was continuous voicing
from the release of the [d] through the beginning of the stimulus, Svoi was
not marked.
Nasal-Stop Stimuli
Figure 3.1 illustrates the additional landmarks that were identified in nasal-
stop tokens.
40

Figure 3.1: Production of anchor by subject 01 in the sober condition
Time (s)0.4051 0.7857
0
5000
Freq
uenc
y (H
z)
A B C D
End of vowel (A) The end of the vowel was defined as the beginning of visible
antiformants associated with the following nasal. If no antiformants were
visible, A was placed at the sharp drop in intensity associated with the
closure of the stop.
End of nasal (B) The end of the nasal was defined as the sharp drop in intensity
associated with the closure of the stop. B was marked only if it was clearly
distinct from both A and C, and if there were no frequencies above 1700 Hz
immediately before the closure.
End of voicing (C) The end of voicing was defined as the end of the visible
voice bar. In ambiguous cases, I relied on the glottal pulses identified by
Praat for guidance.
41

Figure 3.2: Production of labor by subject 01 in the sober condition
Time (s)0.3352 0.824
0
5000
Freq
uenc
y (H
z)
E F G H
Release of consonant (D) The release of the consonant was defined as the ver-
tical dark bar after the closure. If there was no clear release, D was not
marked.
Lenition Stimuli
Figure 3.2 illustrates the additional landmarks that were identified in lenition
tokens.
Beginning of consonant (E) The beginning of the consonant was defined as
the sharp drop in intensity following the preceding vowel.
End of voicing (F ) As in the nasal-stop stimuli, the end of voicing was defined
as the end of the visible voice bar.
42
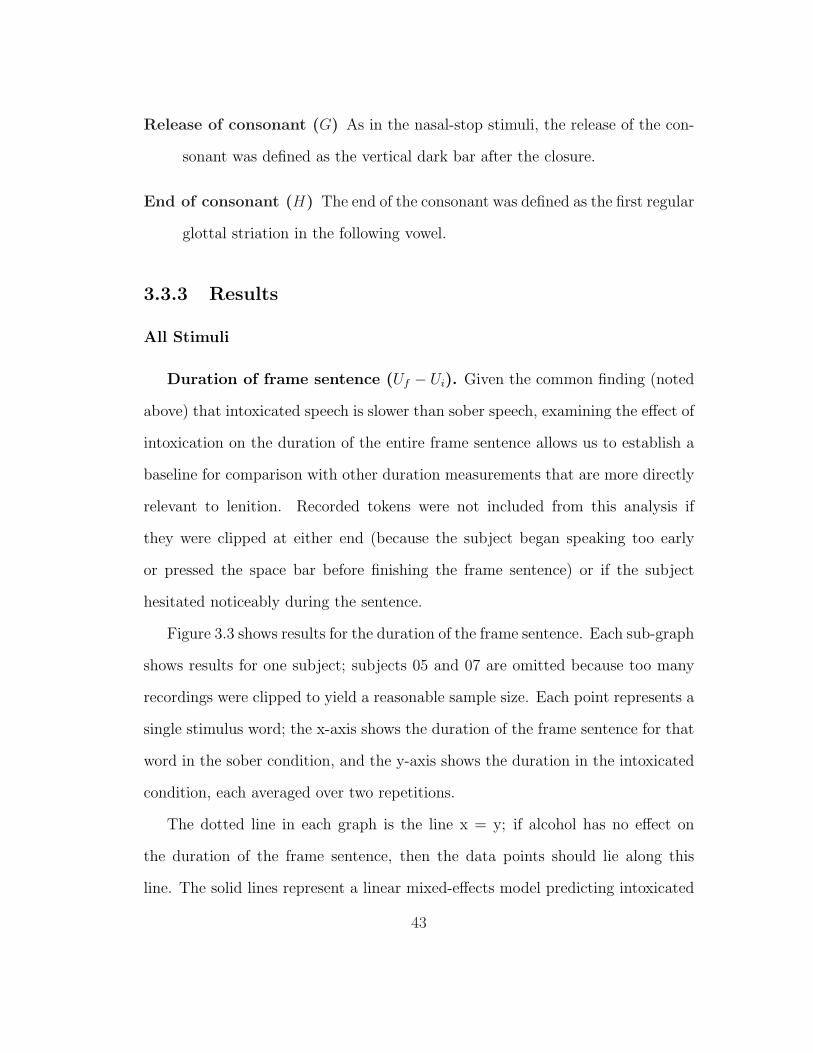
Release of consonant (G) As in the nasal-stop stimuli, the release of the con-
sonant was defined as the vertical dark bar after the closure.
End of consonant (H) The end of the consonant was defined as the first regular
glottal striation in the following vowel.
3.3.3 Results
All Stimuli
Duration of frame sentence (Uf − Ui). Given the common finding (noted
above) that intoxicated speech is slower than sober speech, examining the effect of
intoxication on the duration of the entire frame sentence allows us to establish a
baseline for comparison with other duration measurements that are more directly
relevant to lenition. Recorded tokens were not included from this analysis if
they were clipped at either end (because the subject began speaking too early
or pressed the space bar before finishing the frame sentence) or if the subject
hesitated noticeably during the sentence.
Figure 3.3 shows results for the duration of the frame sentence. Each sub-graph
shows results for one subject; subjects 05 and 07 are omitted because too many
recordings were clipped to yield a reasonable sample size. Each point represents a
single stimulus word; the x-axis shows the duration of the frame sentence for that
word in the sober condition, and the y-axis shows the duration in the intoxicated
condition, each averaged over two repetitions.
The dotted line in each graph is the line x = y; if alcohol has no effect on
the duration of the frame sentence, then the data points should lie along this
line. The solid lines represent a linear mixed-effects model predicting intoxicated
43

Figure 3.3: Duration of frame sentence by subject for nasal-stop and lenitionstimuli. Stars next to subject numbers mark subjects with a slope significantlydifferent from 0 and 1 at α = .05. Stars at the top or bottom of the graphsmark subjects for whom duration is significantly greater or less, respectively, inthe intoxicated condition
Total duration, sober (s)
Tota
l dur
atio
n, in
toxi
cate
d (s
)
1.01.21.41.61.82.02.2
*Subject 00 *
1.0 1.5 2.0
*Subject 01 *
*Subject 02 *
1.0 1.5 2.0
*
Subject 03 *
*Subject 04 *
1.0 1.5 2.0
1.01.21.41.61.82.02.2
Subject 06
duration from sober duration with by-subject slopes and intercepts. Outliers –
defined as data points with residuals more than 2.5 standard deviations from the
mean (Baayen 2008, 188-192) – are omitted from the final models and plotted in
light gray. A star next to a subject number means that for that subject, the slope
of the regression line is significantly greater than 0 and less than 1. A star at the
top or bottom of a subject’s graph means that for that subject, a paired t-test
reveals significantly longer or shorter durations, respectively, in the intoxicated
condition. For both tests, the cutoff for significance is α = .05. All subsequent
graphs in this section have the same layout.
44

Figure 3.4: Illustration of ‘X-pattern’
Sober productionsIn
toxi
cate
d pr
oduc
tions
These results suggest the expected overall pattern of lengthening in the intox-
icated condition; subjects 00, 01, 02, and 04 exhibit significantly longer durations
in the intoxicated condition. (However, subject 03 shows the opposite pattern,
and subject 06 shows no effect.) Note, though, that no subject exhibits uniform
lengthening in the intoxicated condition. Except for subject 06, all of the subjects
display what I will refer to as the ‘X-pattern’: the slope of the regression line is
shallower than 1, and the regression line crosses the line x = y near or within the
main grouping of data points. Thus, the ‘X-pattern’ reveals a tendency whereby,
in the intoxicated condition, relatively more time is added to (or removed from)
utterances with extreme duration values (that is, very long or very short utter-
ances) than for utterances with less extreme values. When the regression line
crosses x = y in the middle of the data, subjects exhibit this avoidance of extreme
values at both ends of the scale: very long utterances are shortened, and very
short utterances are lengthened. Figure 3.4 schematizes how this compression
leads to the ‘X-pattern’. In other words, subjects appear to exhibit less variance
in utterance duration in the intoxicated condition.
45
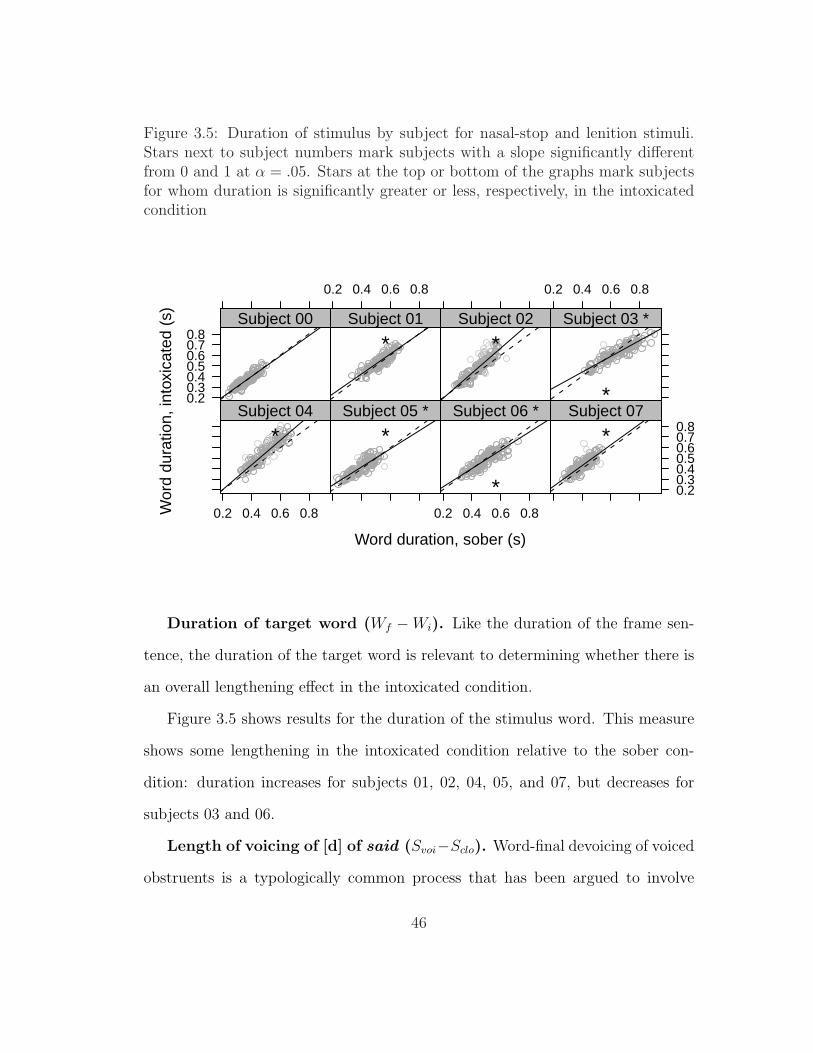
Figure 3.5: Duration of stimulus by subject for nasal-stop and lenition stimuli.Stars next to subject numbers mark subjects with a slope significantly differentfrom 0 and 1 at α = .05. Stars at the top or bottom of the graphs mark subjectsfor whom duration is significantly greater or less, respectively, in the intoxicatedcondition
Word duration, sober (s)
Wor
d du
ratio
n, in
toxi
cate
d (s
)
0.20.30.40.50.60.70.8
Subject 00
0.2 0.4 0.6 0.8
*Subject 01
*Subject 02
0.2 0.4 0.6 0.8
*
Subject 03 *
0.2 0.4 0.6 0.8
*Subject 04
*Subject 05 *
0.2 0.4 0.6 0.8
*
Subject 06 *
0.20.30.40.50.60.70.8*
Subject 07
Duration of target word (Wf −Wi). Like the duration of the frame sen-
tence, the duration of the target word is relevant to determining whether there is
an overall lengthening effect in the intoxicated condition.
Figure 3.5 shows results for the duration of the stimulus word. This measure
shows some lengthening in the intoxicated condition relative to the sober con-
dition: duration increases for subjects 01, 02, 04, 05, and 07, but decreases for
subjects 03 and 06.
Length of voicing of [d] of said (Svoi−Sclo). Word-final devoicing of voiced
obstruents is a typologically common process that has been argued to involve
46

Figure 3.6: Duration of voicing of [d] of said by subject for nasal-stop and lenitionstimuli. Stars next to subject numbers mark subjects with a slope significantlydifferent from 0 and 1 at α = .05. Stars at the top or bottom of the graphsmark subjects for whom duration is significantly greater or less, respectively, inthe intoxicated condition
Voicing duration in "said", sober (s)Voi
cing
dur
atio
n in
"sa
id",
into
xica
ted
(s)
0.000.020.040.060.080.100.12
kkkksc
skkkkkkkkpppppp ppppssssSSssssssssstTt
ttt tt
t
Subject 00 *
0.00 0.10 0.20
k
kkksc
sk
kkk kk k
k
pp pppppp
pps
sssSSss
s s
s
sssst
Tt
tttttt
Subject 01 *
k
k
kks s
kk
kk k
k
k
p
ppp
p
p
pp
sssSS
s
ss
s
s
s
s
sst
Tt
tttt tt
c
k
pp
s
Subject 02 *
0.00 0.10 0.20
k kk
kscs
kk
k kkk
kk
p ppppp
p p ppss ssS
Ss
ss ss
s sstT
tt
ttt
tt
*
Subject 03
0.00 0.10 0.20
kk
kks
c
sk
kkk
kkkk
p
pp
pp
p
pp
pss
sSSs
ss s
s
ss
sst
Tt
tt
tt
t
p stSubject 04
kk
kk
sk
k
kkk k
k p
ppppp
p
ps
s
sS
S
s
ss
ss
ss
t
T
t
tt t
cp sst
*Subject 05 *
0.00 0.10 0.20
kkkk
s
c
s k
k
k
k
kkkk ppp
pppp
pp
ssss
S
Ss s
ssss
ss
stT
ttt
tttt
p *Subject 06 *
0.000.020.040.060.080.100.12
kkkks cskkkk
kk
kkppp
pppp
ppp
ssss
SSsssssssss
tT ttttttt
Subject 07 *
effort reduction (see Westbury and Keating (1986, 156-157), among others). If
intoxication encourages final devoicing, then the final voiced [d] of said in the
frame sentence should have less voicing in the intoxicated condition than in the
sober condition. In addition, examining the voicing of the [d] of said allows us to
distinguish between any effects that intoxication has on postnasal and intervocalic
stops from the effects that it has on stops generally. Voicing of the [d] is analyzed
only when the target word begins with a voiceless stop or sibilant: before voiced
obstruents and sonorants, there is the possibility that the [d] may assimilate in
voicing to the following segment, resulting in an increase in voicing; before the
47

non-sibilant voiceless fricatives [f], [T], and [h], the voicing of [d] often continued
well into the following segment.
Figure 3.6 shows results for the duration of voicing in the [d] of said. The
plotting symbol for each point is the initial consonant of the stimulus word; 〈c〉represents [Ù], and 〈S〉 represents [S]. There is no support for an overall pattern
of devoicing: subject 03 has decreased voicing in the intoxicated condition, while
subjects 05 and 06 have increased voicing. Although several subjects exhibit
the ‘X-pattern’ (00, 01, 02, 05, 06, and 07), two have no significant correlation
between voicing durations in the two conditions (03 and 04). This weak result is
not surprising, given the fact that utterances are paired across conditions by the
stimulus word. We expect the duration of the word to be highly dependent on
the identity of the word, and, thus, we should find a strong correlation between
the duration of the word in the sober and intoxicated conditions. However, the
identity of the word is likely to have a smaller effect on the voicing of the final
consonant of the word that immediately precedes it; thus, the correlations between
the sober and intoxicated conditions are weaker.
Nasal-Stop Stimuli
Duration of consonant. Voiceless obstruents tend to be longer than voiced
obstruents (Kingston and Diehl 1994, 441). If intoxication encourages postnasal
voicing, then consonants should be shorter in the intoxicated condition. Conso-
nant duration was calculated in two ways: from the end of the vowel (D − A),
and from the end of the nasal, if present (D −B).
Figure 3.7 shows results for the duration of the consonant, as measured from
the end of the vowel (top graph) and from the end of the nasal (bottom graph).
48

Figure 3.7: Duration of consonant from end of vowel (top) and nasal (bottom)by subject for nasal-stop stimuli. Stars next to subject numbers mark subjectswith a slope significantly different from 0 and 1 at α = .05. Stars at the top orbottom of the graphs mark subjects for whom duration is significantly greater orless, respectively, in the intoxicated condition
Consonant duration, sober (s)
Con
sona
nt d
urat
ion,
into
xica
ted
(s)
0.05
0.10
0.15
bkg dd t
ktdd
kk
p
t
t
pk
t
kb
tg
p gt
bp
g
bb bg
kb
p d
kd
dk
b tp
pt
p
dbd
b
k
ptp
d
Subject 00 *
0.04 0.08 0.12
bk
g
ddt
kt
d d
kk
p
t
tp kt
k bt
gp
g
tg
bpg bbbg
kbp
dk
ddkbt ppt
p
db
d
dbk
ptp
Subject 01 *
bkgddt
k
t
ddk
kp
tt
p
kkbtg
p
gt
g
bp
gbbbg
k
bpdddkbt
pp
t
p
dd
d bkp
tp
t
k
b
*Subject 02 *
0.04 0.08 0.12
bk
g dd
t
kt
dd
k
k p
tt
p
t t
gp
g
tg
bp
g
bbbg
k
b
pd
kd
dk
b
tpp
t
pd
b
dd
bk p
t
pk
b
*Subject 03 *
0.04 0.08 0.12
bk
dd
t
k
t dd
kk
pt
t pk
t
k b
tg
pg tg
bp
gb
bbg kb
pdk d
dkb
t
pp
t
pd
b
dd
b
k
pt
pg
Subject 04 *
g
d
dt kt
d kk
ptt
p
t
b
t
gpt
gbp
gbbb
g
kbpd
kktpt
p
db
ddbt
p
kp
Subject 05 *
0.04 0.08 0.12
bk
g
dd
tdd
k
k
p
t
t pk
b
t gp
gt g bp
gb
b bg
k bpdk
dd k
b
t
pptp
d
b
dd
bk
pt
pkt
t
k*Subject 06 *
0.05
0.10
0.15
bkg
dd
t
k
tdd
kk
ptt
pk
t
k
btg
p
gt
bp
g
b
bb
gb
p dkd
dk b
t
ppt
p
db
d
dbk p
tp
*Subject 07 *
Consonant duration, sober (s)
Con
sona
nt d
urat
ion,
into
xica
ted
(s)
0.000.020.040.060.08
bkg dd
t
ktd
kk
t
pk
t
kb
tg
pg
t
b
p
gb
bbgb
pd k
d d
k
b
t
p
p
db dd b
ptp
k
*
Subject 00 *
0.00 0.04 0.08
b
k
gdd t
kt
d
d
kkp
t t
p k
t
k
b
t
g
p
gt
gb
p
g bb
b
g
k
b
p
d
k
dd
k
b
t pp
d bdd b
kp
t
pp
*Subject 01 *
b
k
gdd
tk
tdd
k
kp
tt
p
kk
b
t
g
p
g
t
gb
p
g bbbg
k
b
p
d
k
dd
k
b
t pp
t
p
dbd
db
k
p
t
p
Subject 02 *
0.00 0.04 0.08
bk
g dd tkt
d
d
k
k p
t
t
p
kt
k
t
g
p
g
t
g
p
g
b
bg k
b pd
kd
dk
bt
pp
t
p
ddd
b
k
p
t
pb b bb*
Subject 03 *
0.00 0.04 0.08
bkg
ddtk
tdd
kk
t
tpk
t
kb
t
p
g
tg b
p
gb
bb
g
k
b
p
d
k
d
d
kb
t
pt p
dbdd
b k
p
t p
Subject 04 *
gdt
kd
kk
t
p
ktb
tg
t
g
b
gbb
bg
k
b
p kkt
pt
p
bd b
t
pp
Subject 05 *
0.00 0.04 0.08
b
kg
dd t
kt
d
d
kk
p
t
tp k
t
kb tg
p
g
t
gb
p
g bb
bg
k
b
pd
k
dd
kb
pp
p
d
b
dd
b kp
t p
t
*Subject 06 *
0.000.020.040.060.08
b
kg d
dt
k
tdd
kk
tt
pk
tk
bt
g
p
g
tb
p
g
bb bgb
p
d
k
dd
kbt
pp
d
b
dd b
k p
t
p
Subject 07 *
49

The plotting symbol is the stop in the nasal-stop sequence of the stimulus word.
As was the case for the two global duration measures considered above, there
appears to be a general trend of lengthening in the intoxicated condition; only
subjects 00, 04, and 05 fail to exhibit a significant increase in consonant duration
for at least one measurement. The ‘X-pattern’, where the regression lines have a
slope shallower than 1, is consistent across subjects and measurements.
This lengthening effect is not consistent with postnasal voicing. However, it
is possible that the lengthening seen here is not due to postnasal devoicing in the
intoxicated condition, but rather to the overall lengthening of intoxicated speech.
Duration of voicing. If intoxication encourages postnasal voicing, then voic-
ing should increase in the intoxicated condition. As for overall duration, voicing
duration was calculated in two ways: from the end of the vowel (C−A), and from
the end of the nasal, if present (C − B). In each case, if the consonant was fully
voiced, then voicing duration was measured up to the release of the consonant
(D).
Figure 3.8 shows results for the duration of voicing. For both measures, four
subjects exhibit significantly increased voicing. When voicing is measured from
the end of the nasal, the remaining three subjects exhibit decreased voicing; when
voicing is measured from the end of the vowel, the remaining three subjects show
no effect. Because a large number of recorded tokens contained fully voiced con-
sonants (as shown by the clustering of data points for voicing proportion in figure
3.9 around 1), it is likely that these results are parasitic on the effect of intoxica-
tion on overall consonant length. Note that in most cases, a subject who shows
a significant increase or decrease in voicing duration in the intoxicated condition
for some measure also shows an increase or decrease in consonant duration for the
50

Figure 3.8: Duration of voicing from end of vowel (top) and nasal (bottom) bysubject for nasal-stop stimuli. Stars next to subject numbers mark subjects witha slope significantly different from 0 and 1 at α = .05. Stars at the top or bottomof the graphs mark subjects for whom duration is significantly greater or less,respectively, in the intoxicated condition
Voicing duration, sober (s)
Voi
cing
dur
atio
n, in
toxi
cate
d (s
)
0.00
0.05
0.10
0.15
b
k gddtkt dd
kkp
t
tpkt
kb
tgp
gt
bpg
bbbgkbp
d
k
ddkb
tppt
pd
bdd
b
kp
tp
Subject 00 *
0.00 0.05 0.10
b
k
g
ddt kt dd
kk
pt
tpk tk
b
t
g
p
g
tg
b
pgbbb
gk
b
p
d
k
dd
k
b
t pp
tp
dbd
db
kp tp
Subject 01 *
b
k
gdd
tkt
dd
k kpttpk
t
k
bt
g
p
g
t
g
b
pgbbbg
k
b
p
ddd
k
b
tpp
t
pddd bk
p tp
k
b
Subject 02
0.00 0.05 0.10
b
kg dd
t
k
t
ddk
kpttp
kt
b
t
g
p
g
t
g
b
pg
bbbg
k
b
p
d
k
dd
k
b
tppt
p
db
dd
b
k
pt
p*
Subject 03 *
0.00 0.05 0.10
b
kddt k
t ddkk
pt
t
pkt
kb
tg
p
ggb
pg b
b
bgk
b
pd
kd dk
b
tp
p t
pd bd
db
k
p tp
g
t
Subject 04 *
g
dd
tkt
d
kk
pt tpt
b
t
g
pt
gb
pg
bbbg
k p
d
k ktppt
pd
bd
dbtp
k
b*
Subject 05 *
0.00 0.05 0.10
bk
g
dd
tk
t
ddk
kp
ttp
k t
k b
tgp gt g bpg
bb bgk bp
dk
dd
k
b
tp
p
t
pd
bd
db
k pt p*
Subject 06 *
0.00
0.05
0.10
0.15
bkg
dd
t k t
ddkk
p t
tp k
tk
b
t gp
gt
b
p g
b
bb
gb
p
dk
d
dk
b
tpp t
p d bd
dbk
pt p
*Subject 07 *
Voicing duration, sober (s)
Voi
cing
dur
atio
n, in
toxi
cate
d (s
)
0.000.020.040.060.08
b kg
d
d
t kt d k
ktpk
t
kb tgp
gtb pg
b
bb
gkbpd
kd d
k
btp p d
b ddbp t
p
*
Subject 00 *
0.00 0.02 0.04 0.06
bk
gdd
tk
t
d
dkkp
t t
p
ktk
bt
g p
gt
gb
p
g bb
bgkb
pdk
dd
k
bt p
pp
d bd
db
kp
tp
*Subject 01 *
b kgd d t ktdd k kptt pk
k
b
tgpg tgb
p
g b
bbgkbp ddd
kbt p
p
t
p
d b
ddb
k
p tp
k
*
Subject 02 *
0.00 0.02 0.04 0.06
b
kg ddt
kt
d
dkk
pt
tp
ktkt
gpg t
g p
g bg
k
b
p
d
kd d
k
b
tpp tp
d dd
b
kp
t p
bb b
b
b
*Subject 03 *
0.00 0.02 0.04 0.06
b
kgd
dt
k
t ddkkt
t
pk tk b t
pg t
g bpgb bb gk
bp dk
d
dk
b
t
pt
pdbd db
k
p t p
*
Subject 04 *
g dtk
dk
k
tpk tbtg tg
bp
g bb
bgk
b
p
k
kt pt
p
bd b
tp
*Subject 05 *
0.00 0.02 0.04 0.06
b
kg
dd t
kt
d
d
kkp
t
tp
kt
kb
tgp
g
t
gb
p
g bb
bgk
b
pd k
dd
b
t
p
d dd
bk
pp
k
p
b
t*Subject 06 *
0.000.020.040.060.08
b kg ddt ktd dk
kt
tpk t kbtg
p
gtbp
gbb bg
bpd
kdd k
b
tp
p
d
b
dd bk
pt
p
Subject 07 *
51

corresponding measure. In addition, no subject shows a significant effect in one
direction for consonant duration and in another direction for voicing duration.
Proportion of consonant that is voiced. Since intoxication appears to
have a slight lengthening effect on consonant duration, any increase in voicing
duration may be due solely to the change in consonant length, and not to a
change in subjects’ propensity to produce voicing. Measuring voicing in terms of
the proportion of the consonant that is voiced is one way to factor out the effect
of overall consonant length. As above, voicing proportion was calculated in two
ways: from the end of the vowel (C−AD−A
), and from the end of the nasal, if present
(C−BD−B
).
Figure 3.9 shows results for voicing proportion. Although linear models were
fitted to these results as to the others, they are not entirely appropriate since the
dependent variable, a proportion, is bounded by 0 and 1; thus, the ‘X-pattern’
exhibited for voicing measured from the end of the nasal may not be reliable. Only
a few subjects show a consistent change in voicing proportion in the intoxicated
condition, and the direction of the change is not consistent (an increase in some
cases, a decrease in others). This measure, therefore, does not provide evidence
that there was an overall change in the amount of voicing in the intoxicated
condition.
Lenition Stimuli
Duration of consonant (G − E). If intoxication encourages intervocalic
voicing, then consonants should be shorter in the intoxicated condition. Duration
was calculated to the release of the consonant, as with the nasal-stop stimuli.
Figure 3.10 shows results for consonant duration. There appears to be a
52
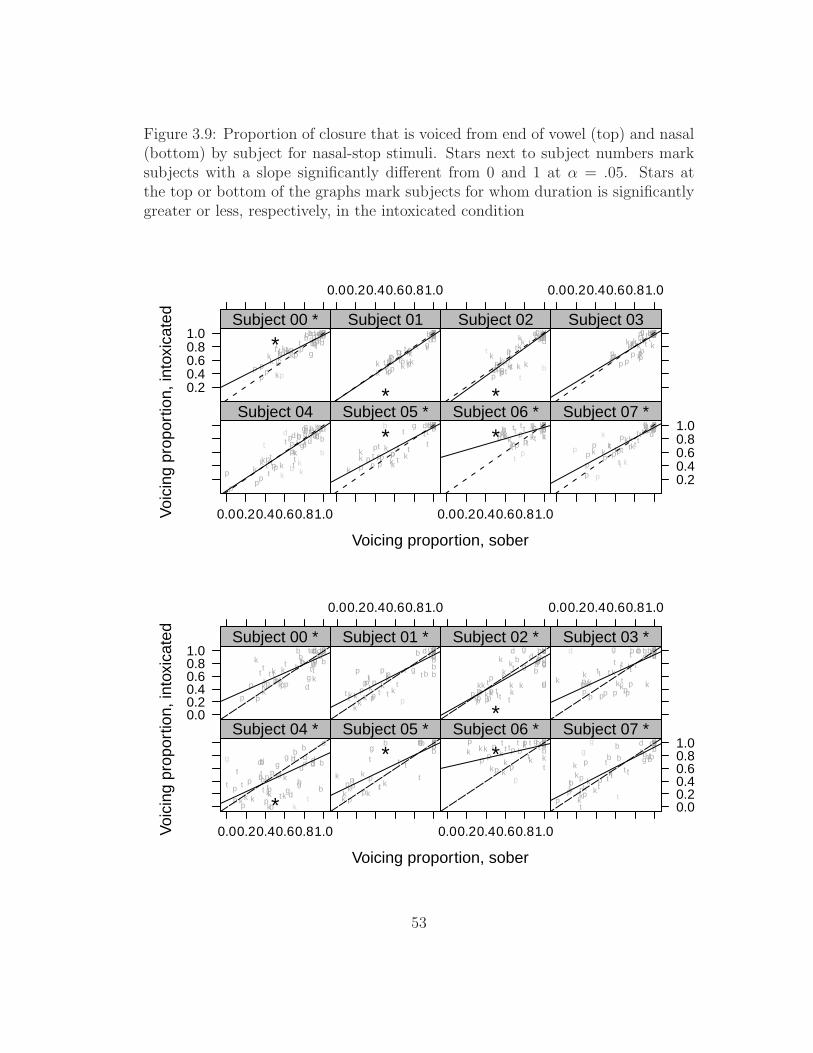
Figure 3.9: Proportion of closure that is voiced from end of vowel (top) and nasal(bottom) by subject for nasal-stop stimuli. Stars next to subject numbers marksubjects with a slope significantly different from 0 and 1 at α = .05. Stars atthe top or bottom of the graphs mark subjects for whom duration is significantlygreater or less, respectively, in the intoxicated condition
Voicing proportion, sober
Voi
cing
pro
port
ion,
into
xica
ted
0.20.40.60.81.0 b
k g
ddt
k
tdd
k
kp
tt
ktk
bt g
p
g
t
b
p
gb bbg
k
b
p
d
k
dd
k
b
t
pp
t p
dbddb
kpt
p
p
*Subject 00 *
0.00.20.40.60.81.0
b
k
gdd
t
k
t
dd
k kpttp
k
t
k
bt
g
p
g
t
gb
p
gbbbg
k
b
p
d
k
dd
k
b
tp
pt p
dbdd
b
kp t
p
*
Subject 01b
k
g dd
tk
t
dd
kkp
tt
p
kk
bt
g
p
g
t
gb
p
gbbbg
k
b
p
dk dd
k
b
pp t
p
dddbk
p
t
pt
tb
*
Subject 02
0.00.20.40.60.81.0
bk
gddtk
t dd
kkp
t t
pktk
btg
p
g
t
gb
p
gbbbgk
b
p
d
k
ddk
bt
pp
tp
dbdd bk
p
t
p
Subject 03
0.00.20.40.60.81.0
k
gd
d
t
dd
k
p
t
t
pk t
k
bt
g
p
g
t
g b
p
gbbg
k
b
p
d
k
dd
k
b
tpp
t
p
db db
p
tp
bk
t
kb
d
k
Subject 04gddt
k t
d
kk
pt
t
pk
t
bt
g
p
t
g b
p
gbbbg
kp
d
kk
t
p
p
tp
dbd dbt
p
b
*Subject 05 *
0.00.20.40.60.81.0
bk gddt
kt
ddk
kp tt
p
k
tk
btg
p
gt gbp
gbbbgkb
pdkdd
k
b
tp
p
dbddbk
p
t
pp
t
*Subject 06 *
0.20.40.60.81.0b
k
gdd
t t
dd
kk
t
ktk
bt
g
p
g
t
b
p
gb bbgb
p
ddd
k
b
t
pp t
p
dbddb
k
p
tp
k
pt
p
k
Subject 07 *
Voicing proportion, sober
Voi
cing
pro
port
ion,
into
xica
ted
0.00.20.40.60.81.0
b
kg
d
d
t
k
td
k
k
t
p
kt k
bt g
p
g
t
b
p
gb b
b g
k
b
p
d
k
ddk
b
t
p p
db
dd
b
pt
p
Subject 00 *
0.00.20.40.60.81.0
b
k
gdd
t
k
t
dd
kk
p
tt
p
k
tk
b
t
g
p
g
t
gb
p
gbbb
g
k
b d
k
dd
kb
t p
p
p
d
b
dd
b
k
p t
pp
Subject 01 *
b
k
g dd
tk
t
dd
kkp t
t
p
k
k
b
t g
p
g
t
gb
p
g bb
bg
k
b
p
d
k
d
d
k
b
tpp
t
p
d
b
dd
b
k
p
t
p
*
Subject 02 *
0.00.20.40.60.81.0
b
k
gdd
t
k
t
dd
kkp
tt
p k
t k
bt
g
p
g
t
gb
p
gbbbg
k
b
p
d
k
dd
k
b
t
p
pt
p
dbd
b
kp
t
p
dSubject 03 *
0.00.20.40.60.81.0
b
k
gdd
t
k
td
d
kk t
t
pkk
b
t
p
g
t
b
pgb
b
b
g
k
b
pdk
d
d
k
b
t pt
p
dbd d
b
p
tp
t
g
k*
Subject 04 *g dt
k
d
kk
t
pkt
b
t
g
t
gb
p
gbbbg
k
b
p
k
kt
pt
p
bdb
t
p
*Subject 05 *
0.00.20.40.60.81.0
bk gddt
kt
ddk
k
p
t
tp
k
t
k
btg
p
gt
gbpgbbbg
k bpd
k
ddk
bt
p
dbddbk
p
t
p
p
*Subject 06 *
0.00.20.40.60.81.0
b
k
d
d
t
kt
dd
kk
t
pk
tk
b
t
g
pt
b
p
g
bbb
gb
p
d
k
dd
k
b
t
p
p
db
db
k
p
tp
g
t
gSubject 07 *
53
Figure 3.10: Duration of consonant by subject for lenition stimuli. Stars next tosubject numbers mark subjects with a slope significantly different from 0 and 1at α = .05; stars at the top or bottom of the graphs mark subjects for whomduration is significantly greater or less, respectively, in the intoxicated condition
Consonant duration, sober (s)
Con
sona
nt d
urat
ion,
into
xica
ted
(s)
0.020.040.060.080.10
k
t
b
t
bkg
d
kkk
gbb k
ppgp
b
k
k
t
p
t
kb
d d
p
t
bb
d
g
p
kp
t
p
bd
p k
bd b
bd
g
d
dp
k
g
pg
p
t
g
Subject 00 *
0.02 0.06 0.10
k
tg
d
kkk
gb b
d
k
p
p
g
t
gbkk
dt
pk
b
d
p
t
b bk
p
t
t
ppk
b
d
bb
dd
g
dt
p
kg
p
g
g
p
g
Subject 01 *
kb
d
bg
kkk k pp
gg
p
bk k
d
p
kb
d
p
b b
d
g
p
kpp pk
d
bb
ddg
p
k
g
pp
g
b*
Subject 02 *
0.02 0.06 0.10
kt
tb
dt
bk
t
g
d
kkkg
bb
dk
ppg
tgg
pb
k k
d t
p
t
k
d d
p
t
bb
d
g
kp
tt
p
bd
p
kb
d
bb
dg
d
gdt
p
k g
p
gg
p
tg
bp*
Subject 03 *
0.02 0.06 0.10
k bbk
d
k kg
bb k
p
p
gt
p
kd
p
k b
d
pgp
kp
t
p
d
pk bd b
d
g
gdt
p
kg
pgg
p
g
k
Subject 04 *
k
bbk
t
d
kk
gbb
d
p
tg
p
bk
p
t
k
d
p p
k
pp
b
pkb
db b
p
kp p
tg k
tt
*Subject 05 *
0.02 0.06 0.10
kb
d
kg
d
kk
kg
bb
d
k ppg
p
kk
d
p
t
k
d d
p
bb
d
gp
kp
t
p
b
pkb
d
bb
d
g
d
g
p
kg
pg
g
p
tg g
b*Subject 06 *
0.020.040.060.080.10
k
td
bk kk
kg
kpp
t
g
pb k
k
t
p
kp
bb
d
pkp
p
bp
k
dd
g
dt
p
kp
gp
g
*Subject 07 *
lengthening effect; five subjects (02, 03, 05, 06, and 07) show significantly in-
creased duration in the intoxicated condition, and no subject has the opposite
effect. Stronger and more consistent, though, is the ‘X-pattern’ noted above: the
regression line for every subject has a slope between 0 and 1 (and significantly
different from either).
Duration of voicing (F−E). If intoxication encourages intervocalic voicing,
then voicing should increase in the intoxicated condition. As for nasal-stop stimuli,
if the consonant was fully voiced, voicing was measured to the release (G).
Figure 3.11 shows results for voicing duration. There appears to be no overall
shift in voicing duration in the intoxicated condition; only two subjects have a
54

Figure 3.11: Duration of voicing by subject for lenition stimuli. Stars next tosubject numbers mark subjects with a slope significantly different from 0 and 1at α = .05; stars at the top or bottom of the graphs mark subjects for whomduration is significantly greater or less, respectively, in the intoxicated condition
Voicing duration, sober (s)
Voi
cing
dur
atio
n, in
toxi
cate
d (s
)
0.000.020.040.060.08
ktbd t
bk
tgdk
kk
g
bb
kppggp bk
ktp
tkb
ddpt
b
b
dgp
kp
t
p bd
pk
bdb
b
dg
d gd
t
p
k gp gg
p t g
Subject 00 *
0.00 0.04 0.08
ktgd
k
k
k
bb
dkpp
g
tgb
k kdt
pk
bd
p
t bb
kp t
tppk
bdb bdd gd
tp
kg
pg
gp
t
g
g
Subject 01 *
k
b
d
bk
g
k
k
kkpp
gg
gp
b
kk
d
pk
bd
p
bb
d
g
p
kp
ppk
b
d bb
d
g
d
gpk
g
pp
g
Subject 02 *
0.00 0.04 0.08
kt t
b
d
t
b
k t
g
d
k
k
k
g
b
b
d
kpp
g
t
gg
b
k
d
tp tk
d d
pt
bb
dg
p
k
pt t
d
pk
b
d
bb
dg
d
gd
p
k
g
p
gg
p t
g
pk
b
p
b
t
Subject 03
0.00 0.04 0.08
kttbdt
b
kdk kk
g b
b d kpp
g
tpk k dk
b
dd
pt
bpkpt
t
pdpk
b
d
bb
d
g
d
gd
t
p
kg
p
gg
p t
g
g
p
g
*
Subject 04 *
k
b
t
b
k
t
dkk
gb
dp
tg
p
b
kt
ptk
d
pp
kpt
tp
b
pk
db
p
k
p p
tg
kbbb
Subject 05 *
0.00 0.04 0.08
k
t
bd
b
k
g
d k
kk
gb
b
dkp
p
ggg
p
b
kk
d
ptkddp b
b
d
g
k pt
pbp kb
d
b
b
d
g
dgp
k
g
p
g
gp
tg
p*
Subject 06 *
0.000.020.040.060.08
ktt
bd
b
k
t
dk kk
g
kpp
g
t
g
p
b
kk
tp kdp b
b
dpkptp bpk
d
b
dg
d
tp
kp
gp
g
Subject 07 *
significant effect (in different directions). However, every subject except subject
03 exhibits a significant ‘X-pattern’: highly voiced consonants become slightly less
voiced in the intoxicated condition, and consonants with very little voicing acquire
slightly more. Subjects in the intoxicated condition appear to avoid extreme values
of voicing at either end of the spectrum, and instead favor intermediate voicing
durations.
Proportion of consonant that is voiced (F−EG−E
). As with the nasal-stop
stimuli, voicing during the consonant was also calculated in terms of the proportion
of the consonant that is voiced, in order to factor out the effect of changes in overall
consonant length.
55

Figure 3.12: Proportion of closure that is voiced by subject for lenition stimuli.Stars next to subject numbers mark subjects with a slope significantly differentfrom 0 and 1 at α = .05. Stars at the top or bottom of the graphs mark subjectsfor whom duration is significantly greater or less, respectively, in the intoxicatedcondition
Voicing proportion, sober
Voi
cing
pro
port
ion,
into
xica
ted
0.00.20.40.60.81.0
k
t
b
t
b
k
gd
k
k
k
g
b
b
kpp
gp
bk
kt
p
t
k
bd
d
p
t
b
b
dg
pkp
t
pb
d
pk
bdb b
d
gd
dp
k
gp
g
p
t
g
Subject 00 *
0.00.20.40.60.81.0
k
tg
d
k
k
k
gb
b d
kpp
g
t
gb
k k
dt
pk
bd
p
t
bb
kp
t
t
ppk
b
d
bb
d
d
g
d
p
kg
p
g g
p
g
t
Subject 01 *
k
b d
bg
k
k
kkpp
gg
p
b
kk
d
pk
b
d
p
bb
dg
pk
pppk
bd
bbd
dg
pk
g
p p
g
Subject 02 *
0.00.20.40.60.81.0
kt
t
bd
t
b
kt
g
d
k
k
k
g
b
bd
k
pp
g
t
gg
p
b
kk
d
t
p
t
k
bd d
pt
bbdg
pk
p t
t
p
b
d
pk
bdbbdgdg
dt
pk
g
p
gg
p t
g
*
Subject 03
0.00.20.40.60.81.0
k
b
b
kg
d kk
g
bk
pp
g
p
kk
p
kb
d
p
g
pkp
t
pdpk
b
d
b
d
g
d
t
p
k
g
p
g
g
p
b
td
gSubject 04 *
k
bb
k
t
dkk
g
b
dp
tg
p
b
k
t
ptk
d
ppk
pp
b
pk
d b
pk
p p
tgkbtbb
Subject 05
0.00.20.40.60.81.0
kb
d
k
g
dkk
gb
b
d
kp
p
gg
pb
kk
p
t
k
dd
p
b
bd gp
kp
t
p
b
p k
bdb b
d
g
dgpk
g
p
g
g
pt
g
kd
Subject 06 *
0.00.20.40.60.81.0
k
t db
kkk
k
g
kpp
tg
p
b
kk
tp kp
bd
pk
p
ppk
d
g
d
t
p
kp
gp g
bb
dSubject 07 *
Figure 3.12 shows results for voicing proportion. Only subject 03 exhibits a
change in overall voicing in the intoxicated condition (a slight decrease); all other
subjects except subject 05 have the ‘X-pattern’ but no general shift in the amount
of voicing during the consonant. Thus, this measure does not support a pattern
of intervocalic voicing.
Duration of burst (H −G). The duration of the consonant’s burst and any
subsequent aspiration (referred to here simply as “burst duration”) is longer for
voiceless stops than for voiced stops. (In English, the extra duration for voiceless
stops is due at least in part to the aspiration that follows them, even in intervocalic
56

Figure 3.13: Duration of burst by subject for lenition stimuli. Stars next tosubject numbers mark subjects with a slope significantly different from 0 and 1at α = .05. Stars at the top or bottom of the graphs mark subjects for whomduration is significantly greater or less, respectively, in the intoxicated condition
Burst duration, sober (s)
Bur
st d
urat
ion,
into
xica
ted
(s)
0.000.020.040.060.080.10
k
tbt b
kg
dk
kk
g
b b
k ppg
p
b k
ktpt
k
b
d
pt b b
dgpk
p
tpbdp
kbd
bbd
gdd
pk
gp gpt
g
d
*Subject 00
0.000.020.040.06
kg
d
k
kkg
bbd
kppg
t
gb
k
k
d
t
p
k
bd pt b
bkp
t pp kbd
bbd d
g
d
pkgp g
gpg t
t
t
*Subject 01
k
bdbg
kk
k kppg gp b
k
kd
p
k
bd
pbbd
gp
k
ppp
k
bd
bbdd
gp kgp pg
Subject 02 *
0.000.020.040.06
k tt
b d
t
b
kg
d
kk
kg
bbd
kpp
gt
gg
pb
kkd
t
p
k
bddp
t
bbd
g pk
p
tt
pbdp
k
bdbbd
g
dg
dp
kg
pgg
p
t
g
tt
t*
Subject 03
0.000.020.040.06
k
b
bkk k
g
bb
kp pg
tp
k
kd
pk
bd
pg
p
kp
tpd
p
k
bd
bd
g gdt
pk
g pg g
pg
Subject 04 *
k
bb
k
tdk k
bbd pt
gpb
k
tp
t
k
d pp
k
ppbp
k
bd bbp k
p
p
tg
kg
t
Subject 05 *
0.000.020.040.06
k
bd
kg
dkk k
g
bbd
kpp g
pb
kk
dpt
k
ddpb bd gp
k
ptp bpk
bd
bb
dgd
gpk g
pg
gp
t
gg
*Subject 06 *
0.000.020.040.060.080.10
k
t db k
k k
kgkp
pt
gpb
k
ktp
k
pbbd pk
p
pb p
kd
dg
d
pk
pg
p
g
t
Subject 07 *
position, as noted in the discussion of the stimuli for Experiment 2. As shown in
table 5.1 below, burst duration differed significantly between voiced and voiceless
stops for all subjects in Experiment 1 except subject 00.) Thus, we expect burst
duration to decrease in the intoxicated condition.
Figure 3.13 shows results for burst duration. Four subjects show increased
burst duration in the intoxicated condition (00, 01, 03, and 06); five show the
‘X-pattern’ (02, 04, 05, 06, and 07). Burst duration does not support a pattern of
intervocalic voicing in the intoxicated condition; if anything, it suggests a change
in the opposite direction.
Ratio of minimum intensity in consonant to maximum intensity in
57
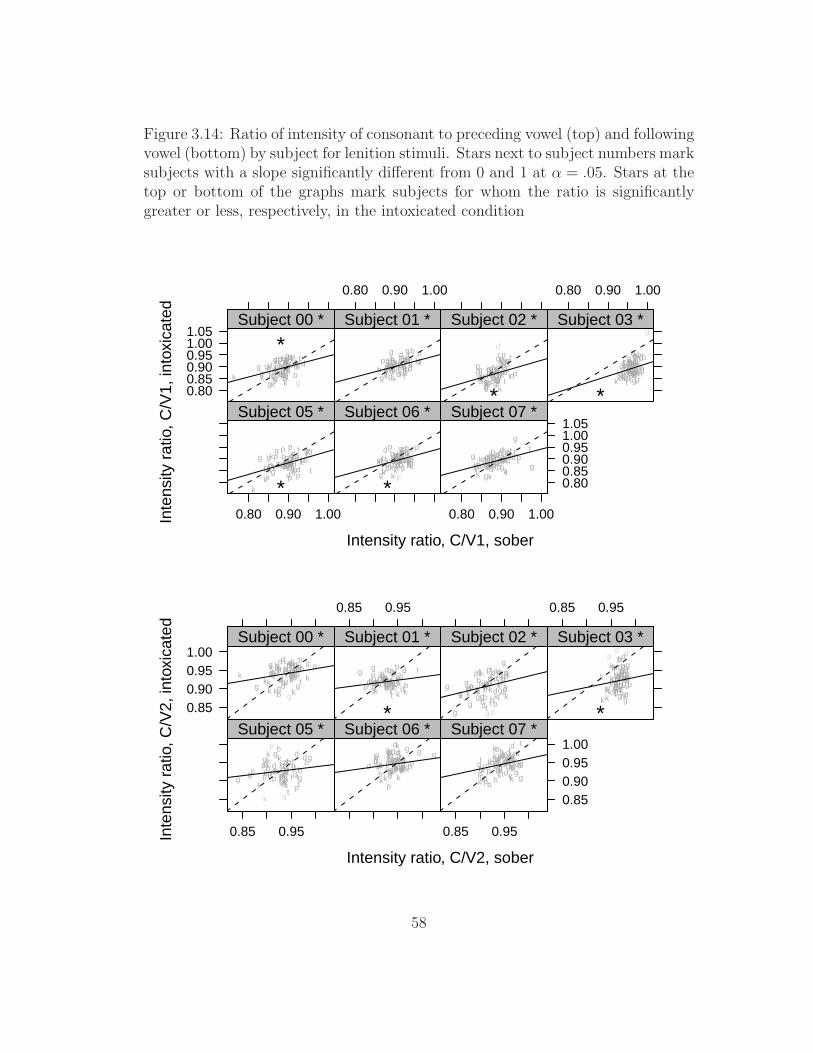
Figure 3.14: Ratio of intensity of consonant to preceding vowel (top) and followingvowel (bottom) by subject for lenition stimuli. Stars next to subject numbers marksubjects with a slope significantly different from 0 and 1 at α = .05. Stars at thetop or bottom of the graphs mark subjects for whom the ratio is significantlygreater or less, respectively, in the intoxicated condition
Intensity ratio, C/V1, sober
Inte
nsity
rat
io, C
/V1,
into
xica
ted
0.800.850.900.951.001.05
kttbd
t
bk
tgd
k kkg
b bd
k
pp
gt
gp
bk
kd
tpt
kbdd
pt
bb
d
gp
kp
ttp
bd
p
k
b
d b
bd
g d
g
dt
pk g
p
ggpt
gg
*Subject 00 *
0.80 0.90 1.00
bdb k
t
gd kk
k
gbb
dkpp
g
tg
gbk
kdtp
k
bddptb
b
d
g
kptt
pb
dpkb d bbd
dg d
t
p
k
gp ggp
t
g
Subject 01 *
kt
t
bdb
kt
g
kk
kgb b dkp
p
gt
g p
bkkd
t
pt
kb
ddptb b
dgp kp
tt
p
b dp k b
dbbd
gd
g
dt
pk
gp
g gpg
d
g*
Subject 02 *
0.80 0.90 1.00
kttb
dt
bkt
gdkk
k g
bbd
kp
pgtg
pb
kkdt
ptk
bd
d
p
tb
bdgp
k
pt
t
pb
dpk
b
d
bbdgd
gdt
p
k gpggp t
g
g
*
Subject 03 *
0.80 0.90 1.00
k tbd t
bk
t
gd
kk
kg b
b
d
p
gtg
gp
bkdtp
t
k
dd
p
tb
d
gp
kp
t
t
p
bd
pk
bdb
b
dg
dg dtp k
g
p g
g
ptg
*
Subject 05 *
k
t tbd
tbk
tg d
kkkg
b bdk
p
pg
tg g
p
bkk
d
tp tkbdd pt
bbd g
pk pt t
pbdp
k
b d
bb
dg
d
g
dt kgpg gptg
p
*
Subject 06 *
0.80 0.90 1.00
0.800.850.900.951.001.05
k ttb
dt
bk
tgdkk
kgb
bd
k
pp g
tg
g
pb
kk
dt
p
t
k
bd dpt
b
bdg pkp
tt p
bdpk
bd b b
d
g
dgd
t pkgp
gg p
t g
Subject 07 *
Intensity ratio, C/V2, sober
Inte
nsity
rat
io, C
/V2,
into
xica
ted
0.850.900.951.00
ktt
b dt
b
k
tgdk
kk
gb
b
d
kp pg
tg p
bkkd
t p
tk
bddp
t
b
bd
g
p
k
pt
t
pbdp
k
b
db
b dg dg
dt p
kgp
g g
ptg
g
Subject 00 *
0.85 0.95
bd
bk
t
g
dk
k
kg
bbd
kp pg
tg
g bk
kdtp
k
bdd
ptb
b
d
g
kp t
tp
bd
pkb
dbb
dd gd
t
p
k
g pgg ptg
*
Subject 01 *
k
tt
b
db
k
tgdk
kk
g
b
bdkpp
gt
g
pb
kk
dt
tkb
ddptb
bd
g pk
pt
tp
b
dp
k
bd
b
bdg
d
g
d
t
p kg
p
gg
pg
gp
Subject 02 *
0.85 0.95
ktt
bd
t
b
kt
g
d
kk
k
g
bb
dk
p
gtggp bkkd
t
t
k
bd
dpt
bb
d
g
p
k
p
t
t
pbdp
k bb
bdg
dgdtp
k gpggptg
pp d
*
Subject 03 *
0.85 0.95
kt
bd
tb
k
t
g
d
k
kk
g
bbp
tgg
p
b
k
d
t
tdd
p
t
bd
gpkp t
t
pbdp
k
b
d
bb
d
g
dgdtp
k
g
p gg p tg
d
p
k
Subject 05 *
k
tt
bd
tbk
t
gd
k
k
kg
b bd
kp
p g
tg
gp b
kkd
tp tkb
dd
ptb
bd
g
pk ptt
pbdpk
bd
bb
d
gd
g
d
t
p
k
g
pg
gpt
g
Subject 06 *
0.85 0.95
0.850.900.951.00
kt
tb
d
t
bk
tg
d
kk
k
g
b
bd
kp
p gtgg
p
bkk
dt
p
t
kb ddp t
b
bd
gp
k
pt
tp
b
d
pkb db
b
d
gdg
dt
pk
g
p
g
gpt
g
Subject 07 *
58
vowel. Voiced stops are expected to be more intense than voiceless stops during
closure because of the energy added by the voicing component; spirants are ex-
pected to be more intense than stops because of the energy added by the turbulent
airflow of frication. If intoxication encourages intervocalic voicing or spirantiza-
tion, the intensity of the consonant should increase in the intoxicated condition.
With this measure, the intensity of the consonant (represented by the minimum
intensity during the consonant closure) is relativized to the maximum intensity
of the preceding or following vowel. For this measure, and for all subsequent
measures involving intensity, subject 04 is omitted: this subject’s recordings had
significant clipping in the sober condition.
Figure 3.14 shows results for intensity ratios relative to the preceding vowel
(top graph) and following vowel (bottom graph). Although subject 00 has in-
creased consonant intensity relative to the preceding vowel in the intoxicated
condition, there is no other significant increase in consonant intensity, and there
are several significant decreases. Thus, these measures provide no evidence for
an overall pattern of intervocalic voicing or spirantization in the intoxicated con-
dition. The ‘X-pattern’, on the other hand, is significant for every subject for
both measures: in the intoxicated condition, subjects avoid both very intense
consonants and very quiet ones.
Smallest/largest slope of intensity contour in consonant. Another
measure of the intensity of the consonant relative to the surrounding vowels in-
volves the slope of intensity contour (Kingston 2008). The quieter the consonant,
the steeper the slope of the contour will be leading into and out of the consonant
(because of the large transition between the loud vowel and the quiet consonant);
conversely, the more intense the consonant, the shallower the slope will be. We
59

Figure 3.15: Intoxicated production of rapid (top) and sober production of rabbit(bottom) by subject 02, with intensity contours; arrows show maximum slope ofintensity contour during consonant
Time (s)0.5084 0.8627
0
5000
Fre
quen
cy (
Hz)
“rapid”
Time (s)0.4608 0.8111
0
5000
Fre
quen
cy (
Hz)
“rabbit”
can get a global measure of the slope of the intensity contour leading into the con-
sonant by finding its smallest (most negative) slope; similarly, we can measure the
slope leading out of the consonant by finding its largest slope. (See figure 3.15 for
an illustration.) If intoxication induces intervocalic voicing or spirantization, then
each measure should be significantly closer to zero in the intoxicated condition.
Figure 3.16 shows results for minimum (top graph) and maximum (bottom
graph) slopes of the intensity contour. There is no general pattern in terms of an
60

Figure 3.16: Minimum (top) and maximum (bottom) slope of intensity contourduring consonant by subject for lenition stimuli. Stars next to subject numbersmark subjects with a slope significantly different from 0 and 1 at α = .05. Stars atthe top or bottom of the graphs mark subjects for whom the slope is significantlygreater or less, respectively, in the intoxicated condition
Min slope, sober (dB/.008s)
Min
slo
pe, i
ntox
icat
ed (
dB/.0
08s)
−1000
−500
0
k
t
t
b
d t
bk
tg
d
kk k
g
b
b
d
k pp
t
ggp b
kk
d
tpt
k b
dp tbb dg p
k p
t
tpb
dpk
bd
bb
dg
d
g
d
t
pk
gp
g
g
pt
g
gd
Subject 00 *
−1000 0
bd
bk
t
g
dk
kk
gb
bd
k
p
p
g
t
g gbkk
dtp
k
b
d
dp
t
bb
dg
kpt
tp
b dp
k
b
d
bbd dg
dt
pk
g
p
gg
p
t
g
*Subject 01 *
k
t
tb
d
b
k
t
g
k k
gbb
dkp
p
gt
g g
pb
kk d
t
p tk
bdd
p
tbb dg
pk
p t
t
p
bd
pk
b
dbb
d
g
d
gd tpk
g
p
gg
p
g
d
k *Subject 02 *
−1000 0
ktt
bdt
b
k
tg
dkk k
g
b
bdk
pp
g
t
gg
p
b
k
kd
t p
t
k
b
d
d
p t
b
bd
g
pkp
tt
p
b d
pk
bd
b
b
d
g dgd
tp
k
g
p
gg
pt
g
*
Subject 03 *
−1000 0
k
tb
d
b
k
tg d
kk
gb
b
d
p
g
t
g g
p
b
k
d
p
t
k
dd
p
tb
d
g
p p
tt
p
bd
pk
b
d
b
bd g
dg
dt
pk
g
p
gg
p
tg
t
k
t
k
Subject 05 *
k tt
b
d
t
b
kt
g
d
kk k
gbb
d
k
p p
g
t
ggp
bk
k
dt
pt
k
b
d
dp
t
bb
dgp
kp
t t
pb
d
p k
b
db
b
dgdg dt
pkg
p ggp tg
*Subject 06 *
−1000 0
−1000
−500
0
k
t t
b
dtb
k
tgd
kkk
g bbd
k
p
pg
t
gg
pb
k k
dt
p
t
kbd
d
p
tbb
dg
pk
p t
t
p
b
dpk b
d
bbg dgd
tp
k
g
pg
g
p
t
g
d
*
Subject 07 *
Max slope, sober (dB/.008s)
Max
slo
pe, i
ntox
icat
ed (
dB/.0
08s)
0500
10001500
k
tt
b
dt
bk
t
g
d
kkk
g bb
d
kp p
gt
g
g
p
bk
k
dt
p
t
kb
dd
p
t
bbd
gpkp
tt
pb
d
pk
bd
bb
d
g
d
g
dt
p
k
gpg
g
p
t
g
Subject 00 *
500 10001500
d
k
tg
dk
k
kgbbd
k
ppg
t
gg
b kk
d t
p
k
b
dp
t
b
dg
kp
t
t pb
d
p
kb
d
bbd
d gdt
pkg
pgg
p
tg
bb
d
b
*
Subject 01 *
k
tt b db
k
tgd
kk k
gb
bd
kppgtgg pb
kk
dt
pt
kb
dd
p
tb
b
dg
pk
p
tt
p
bd
pk
b dbbd
g dgt
pk
g
p
gg
p
g
d
Subject 02 *
500 10001500
k
t tb
dtb kt
gd
kkk
g
bbd
k
p
p
g
tgg
p
bk
k
d
t
p
tk
b
d d
p
tbb
d
g
pk p
tt
p
bd
pkb
d
b bdg
dgd
tp
kg
p
gg
pt
g
*Subject 03
500 10001500
k
tbd
t
b
k
t gd
kkk
gb
b
d
p
gt g
p
bk
d
p
t
k
dd
p
tbdg
p
k
p
tt
p
b
d
pk
b
d
bb
dg dgdt
pk
g
p
g
g p
tg
gt
*Subject 05
k
tt
bd
t
bk
t
g
d
kk
kg b
d
kpp g
t
gg pbkk
dt
pt
kb
d
d p
t
bbd g
pkp
tt
p b
d
pk b
d
bb
dg
d
g
dt
pkg
pgg pt
gb
*
Subject 06 *
500 10001500
050010001500
k
tt
b
dt
b k
t
gd
kk
k
gb
bd
kp p
gt
g g pbk
k
dt
p
t
k
bd
d
p
t
b
bdg
pkpt
t
pbp
k
b
d
b b
dgdg
d
t
p k
g
pgg p
t
g
d
*Subject 07 *
61

overall shift in the intoxicated condition: for each measure, some subjects have
significant increases, while others have significant decreases. These measures, like
most of those before them, do not support a pattern of intervocalic voicing or spi-
rantization. The ‘X-pattern’, however, remains robust: with only two exceptions
(subjects 03 and 05 for maximum slope), the regression lines uniformly have a
slope between 0 and 1.
3.3.4 Discussion
Overall Results
Table 3.2 summarizes significant results for each of the measures discussed
above. For each subject and each measure, there are two possible significant
effects. The first is whether the subject displays the ‘X-pattern’ for that measure:
that is, whether the slope of the regression line for that subject is significantly
less than 1 (but greater than 0). Subjects with this pattern appear to avoid
‘extreme’ articulations at one or both ends of the relevant scale, and to favor
instead productions with intermediate values. For example, for subject 06, if a
consonant in one of the lenition stimuli had a great deal of voicing in the sober
condition as measured by proportion of the closure that was voiced, then that
consonant in the same stimulus in the intoxicated condition tended to have slightly
less voicing. But if a consonant had very little voicing in the sober condition,
then it tended to have slightly more in the intoxicated condition. Significant
‘X-patterns’ are shown with gray cells.
The second type of significant effect is an overall difference in the measured
quantity between the two conditions, as determined by a paired t-test. Subjects
62
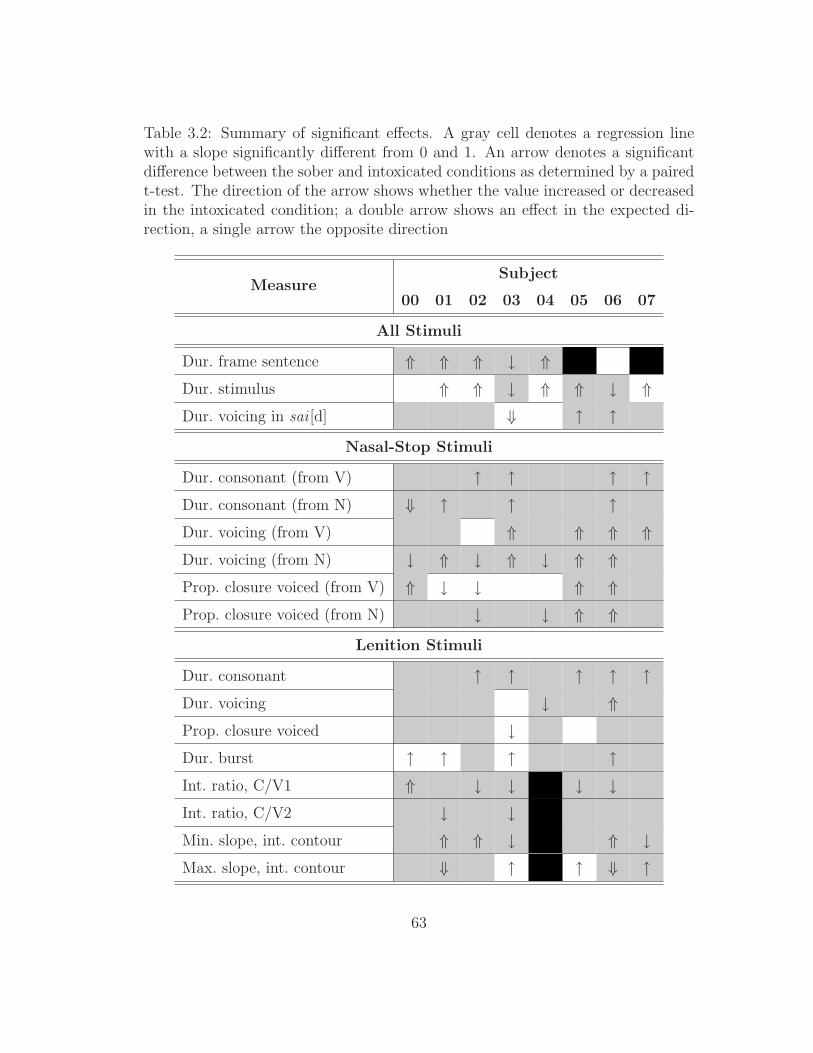
Table 3.2: Summary of significant effects. A gray cell denotes a regression linewith a slope significantly different from 0 and 1. An arrow denotes a significantdifference between the sober and intoxicated conditions as determined by a pairedt-test. The direction of the arrow shows whether the value increased or decreasedin the intoxicated condition; a double arrow shows an effect in the expected di-rection, a single arrow the opposite direction
MeasureSubject
00 01 02 03 04 05 06 07
All Stimuli
Dur. frame sentence ⇑ ⇑ ⇑ ↓ ⇑Dur. stimulus ⇑ ⇑ ↓ ⇑ ⇑ ↓ ⇑Dur. voicing in sai [d] ⇓ ↑ ↑
Nasal-Stop Stimuli
Dur. consonant (from V) ↑ ↑ ↑ ↑Dur. consonant (from N) ⇓ ↑ ↑ ↑Dur. voicing (from V) ⇑ ⇑ ⇑ ⇑Dur. voicing (from N) ↓ ⇑ ↓ ⇑ ↓ ⇑ ⇑Prop. closure voiced (from V) ⇑ ↓ ↓ ⇑ ⇑Prop. closure voiced (from N) ↓ ↓ ⇑ ⇑
Lenition Stimuli
Dur. consonant ↑ ↑ ↑ ↑ ↑Dur. voicing ↓ ⇑Prop. closure voiced ↓Dur. burst ↑ ↑ ↑ ↑Int. ratio, C/V1 ⇑ ↓ ↓ ↓ ↓Int. ratio, C/V2 ↓ ↓Min. slope, int. contour ⇑ ⇑ ↓ ⇑ ↓Max. slope, int. contour ⇓ ↑ ↑ ⇓ ↑
63

with this pattern display an overall preference for one end of the scale over the
other in the intoxicated condition. For example, subject 03 had more intense
consonants in the intoxicated condition, as measured by the maximum slope of
the intensity contour during the consonant, than in the sober condition. Sig-
nificant differences of this type are shown with an arrow. The direction of the
arrow shows whether the measured value increased (up) or decreased (down) in
the intoxicated condition. The shape of the arrow shows whether the change
was in the expected direction (that is, the direction corresponding to intervocalic
voicing/spirantization, postnasal voicing, or final devoicing): double arrows show
expected changes, and single arrows unexpected ones. For the overall duration of
the frame sentence and the stimulus word, neither change is necessarily predicted
by the sound patterns under consideration; for these measures, the ‘expected’
change (as marked in the table) is an increase in duration, given previous findings
in the literature that intoxication leads to slower speech.
Note that these two patterns are not mutually exclusive: it is possible for
a subject to display the ‘X-pattern’ in addition to an overall preference for one
end of the scale over the other for the same measure. For example, subject 06
shows longer consonants (measured from the end of the nasal) in the nasal-stop
stimuli in the intoxicated condition. However, the effect is strongest for those
stimuli whose consonants are very short in the sober condition; for stimuli whose
consonants are already very long in the sober condition, there is little or no increase
in the intoxicated condition. In other words, the range of consonant duration that
subject 06 is willing to produce is smaller in the intoxicated condition than in
the sober condition, even though the midpoint of that range is relatively high
compared to the range in the sober condition.
64

Table 3.2 provides little, if any, support for the prediction that intoxicated
speech mirrors attested phonological patterns. Significant changes in the intox-
icated condition that correspond to the attested patterns of intervocalic voicing
and spirantization, postnasal voicing, or final devoicing are few and far between,
and a change in the expected direction for one subject is almost always accompa-
nied by a change in the opposite direction for that measure for some other subject.
This is the case even if we disregard all of the measures based on duration, where
the general lengthening of intoxicated speech may be a confounding factor.
The pattern for which table 3.2 provides strong support is the ‘X-pattern’:
when intoxicated, subjects are less willing to make ‘extreme’ productions. There
are only a handful of cases where this pattern is not significant. Thus, the articu-
latory space of intoxicated subjects appears to be compressed; rather than (or in
addition to) favoring one end of the scale over the other, subjects are reverting to
gestures in the middle of the articulatory space.
The recurrent ‘X-pattern’ is consistent with the idea that intoxicated subjects
expend less effort. If extreme gestures require more effort to produce than gestures
in the middle of the articulatory space, then the compression of the articulatory
space observed in the intoxicated condition means that subjects expended less
effort after drinking alcohol than they did while they were sober. As discussed in
chapter 5, there are in fact a number of proposals in the phonological literature
linking articulatory effort with the extremes of the articulatory space; thus, the
results of this experiment speak directly to particular theories of the relationship
between articulatory effort and phonological patterns.
65
Effect of BAC
If the primary effect of alcohol on production is to cause contraction of the
articulatory space, then we might expect higher levels of intoxication to cause
more contraction. Because BAC varied both within and across subjects during
Experiment 1 (as shown in table 3.1), it is possible the data could provide us with
evidence for such an effect.
I used the within-subject variation in BAC to determine whether there was
a within-subject effect of BAC on the degree of articulatory contraction. Each
recording session was divided into two parts: the first half of the trials (containing
the first repetition of each stimulus word) and the second half (containing the
second repetition). The initial and final BAC measures for each subject were used
as a rough approximation of that subject’s BAC during the first and second halves
of the intoxicated recording session, respectively.
As above, for each measure of lenition, I built a linear mixed-effects model
predicting values in the intoxicated condition from values in the sober condition.
Productions from the first half of the intoxicated recording session for each subject
were paired with productions from the first half of the sober recording session for
the same subject; productions from the second half of each session were paired in
the same way. Each model includes random slopes and intercepts for each half
of the recording session for each subject. If higher BACs do indeed cause greater
contraction of the articulatory space, then the slope of the regression line should
be systematically smaller for the half of the recording session in which a given
subject had a higher BAC, and larger for the other half of the recording sesion
for the same subject.
66

As it turns out, there is no systematic difference in slope between subjects’
productions with higher or lower BACs. A paired t-test of the slope of the regres-
sion line for all measures and subjects reveals no significant difference between
more and less intoxicated parts of the recording session (p = .71). However, there
are several reasons not to be surprised at this null result:
� The within-subject differences in BAC are very small (usually between .01
and .03).
� For most subjects, BAC was higher at the beginning of the recording session;
for subjects 04 and 07, BAC was higher at the end. It is possible that there
are independent effects of timing within each session that are masking any
effects of relative BAC.
� Although we know each subject’s BAC at the beginning and end of the
experiment, we do not know what trajectory the subject’s BAC took dur-
ing the recording session. For example, subject 00 began the intoxicated
recording session with a BAC of .10 and ended it with a BAC of .07. How-
ever, we do not know whether the subject peaked at .10 and experienced a
monotonic decline in BAC during the session, or whether the subject peaked
later during the session and only then experienced a drop in BAC. Thus,
beginning and ending BAC give us only a rough approximation of subjects’
BAC throughout the recording session.
� For subjects 04 and 07, who had a higher BAC at the end of the session
than at the beginning, we do not know whether they peaked during or
after the recording session – that is, whether the value measured at the
67

end of the session was on the rising or falling side of the BAC curve. This
difference is important because of the phenomenon known as the Mellanby
effect, whereby perforance of intoxicated subjects is more impaired while
BAC is rising than it is at same BAC when BAC is falling (Wang et al.
1993).
Thus, although a post-hoc analysis of the effects of variation in BAC in Ex-
periment 1 provides no evidence that higher BACs lead to greater contraction of
the articulatory space, it is possible that an experiment specifically designed to
answer this question would find an effect.
3.4 Conclusion
Experiment 1 was designed to determine whether intoxication – hypothesized
to induce subjects to expend less articulatory effort – results in productions that
resemble certain phonological patterns that have been claimed to involve effort
reduction, including final devoicing, postnasal voicing, and intervocalic voicing
and spirantization. The results of the experiment show that subjects did not sys-
tematically alter their productions when intoxicated in a manner corresponding to
these patterns; instead, the most robust effect observed was a compression of the
articulatory space in the intoxicated condition. Although there is no guarantee
that alcohol consumption does in fact encourage subjects to expend less articula-
tory effort, the articulatory compression that they exhibit is plausibly interpreted
as effort reduction and should not be lightly dismissed. Chapter 5 considers the
implications of these results both for phonological theories of articulatory effort
and for our account of lenition patterns in particular.
68
Chapter 4
Perception of Intervocalic Voicing
and Spirantization
This chapter reports the results of three experiments that were designed to
explore the possible role of perception in the lenition of intervocalic stops. As
discussed in the introduction, the potential effect of perceptual factors on lenition
has received little attention in the literature, Kingston (2008) being a recent ex-
ception. The particular perceptual model that I examine is the P-map (Steriade
2001a,b).
Recall the basic typological fact I intend to account for – that spirantization
of intervocalic voiceless and voiced stops (as in (1)) and voicing of intervocalic
voiceless stops (as in (2a)) are attested, while devoicing of intervocalic voiced
stops (as in (2b)) is not.
(1) a. Attested: Intervocalic voiceless stops targeted for spirantization
(e.g., Tiberian Hebrew)
(i) /VpV/ → [VFV]
69

(ii) /VtV/ → [VTV]
(iii) /VkV/ → [VxV]
b. Attested: Intervocalic voiced stops targeted for spirantization
(e.g., Spanish)
(i) /VbV/ → [VBV]
(ii) /VdV/ → [VDV]
(iii) /VgV/ → [VGV]
(2) a. Attested: Intervocalic voiceless stops targeted for voicing
(e.g., Warndarang)
(i) /VpV/ → [VbV]
(ii) /VtV/ → [VdV]
(iii) /VkV/ → [VgV]
b. Unattested: Intervocalic voiced stops never targeted for devoicing
(i) */VbV/ → [VpV]
(ii) */VdV/ → [VtV]
(iii) */VgV/ → [VkV]
The P-map (Steriade 2001a,b) builds on the ideas of Licensing by Cue to provide
a framework for a perceptually-based understanding of typological gaps such as
the absence of patterns like (2b). The core intuition of Steriade’s proposal is that
“[t]he aim, in any departure from the UR, is to change it minimally to achieve
compliance with the phonotactics” (Steriade 2001a, 4). She formalizes this notion
of minimality in terms of perceptibility: form A is ‘closer’ to form B than form C
is if the A ∼ B distinction is perceptually less salient than the C ∼ B distinction,
where perceptual salience is defined as mutual confusability. Knowledge of the
70
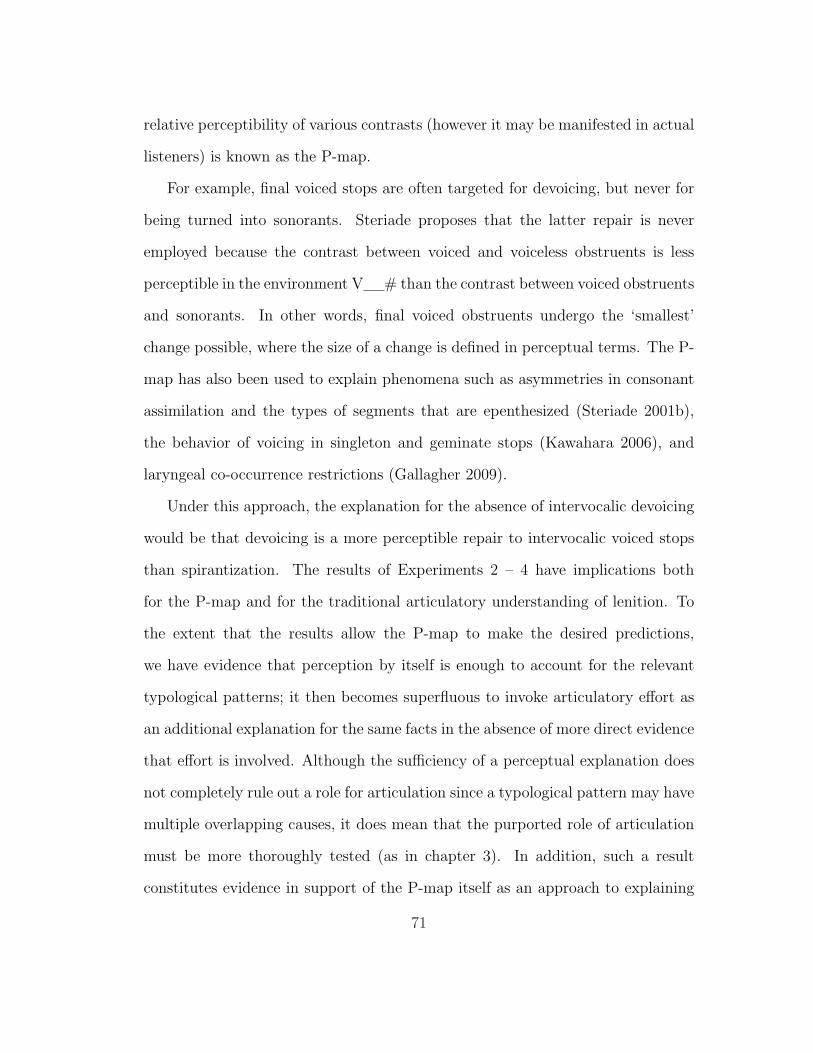
relative perceptibility of various contrasts (however it may be manifested in actual
listeners) is known as the P-map.
For example, final voiced stops are often targeted for devoicing, but never for
being turned into sonorants. Steriade proposes that the latter repair is never
employed because the contrast between voiced and voiceless obstruents is less
perceptible in the environment V # than the contrast between voiced obstruents
and sonorants. In other words, final voiced obstruents undergo the ‘smallest’
change possible, where the size of a change is defined in perceptual terms. The P-
map has also been used to explain phenomena such as asymmetries in consonant
assimilation and the types of segments that are epenthesized (Steriade 2001b),
the behavior of voicing in singleton and geminate stops (Kawahara 2006), and
laryngeal co-occurrence restrictions (Gallagher 2009).
Under this approach, the explanation for the absence of intervocalic devoicing
would be that devoicing is a more perceptible repair to intervocalic voiced stops
than spirantization. The results of Experiments 2 – 4 have implications both
for the P-map and for the traditional articulatory understanding of lenition. To
the extent that the results allow the P-map to make the desired predictions,
we have evidence that perception by itself is enough to account for the relevant
typological patterns; it then becomes superfluous to invoke articulatory effort as
an additional explanation for the same facts in the absence of more direct evidence
that effort is involved. Although the sufficiency of a perceptual explanation does
not completely rule out a role for articulation since a typological pattern may have
multiple overlapping causes, it does mean that the purported role of articulation
must be more thoroughly tested (as in chapter 3). In addition, such a result
constitutes evidence in support of the P-map itself as an approach to explaining
71

typological patterns (although not to the exclusion of other perceptual approaches;
there are other models of phonological patterns that can achieve similar results).
On the other hand, to the extent that the results do not provide a perceptual
explanation along the lines of the P-map for the relevant typological facts, we have
evidence that other influences must be at work. One notable example is the fact
that the P-map is meant to explain not why a given configuration is changed –
in Optimality-Theoretic terms (Prince and Smolensky 2004[1993]), this is the role
of markedness constraints – but rather how it changes (the role of faithfulness
constraints). Thus, perception may not tell us anything at all about whatever
markedness constraint drives languages to lenite in the first place; I return to this
point in §5.1.
As the results of Experiment 2 show, intervocalic devoicing is a more per-
ceptible change than intervocalic spirantization; by contrast, Experiment 4 shows
that spirantization and voicing of voiceless stops are about equally perceptible.
Therefore, the approach of the P-map seems to be on the right track in explaining
the broad typology of (1) and (2). However, we will see from the results of Exper-
iment 3 that for voiced stops, the perceptual facts differ by place of articulation in
ways that do not line up neatly with the typology discussed in §2.2. Thus, while
perceptual facts may be able to explain the broad outlines of intervocalic lenition,
there must be other factors at work as well.
72
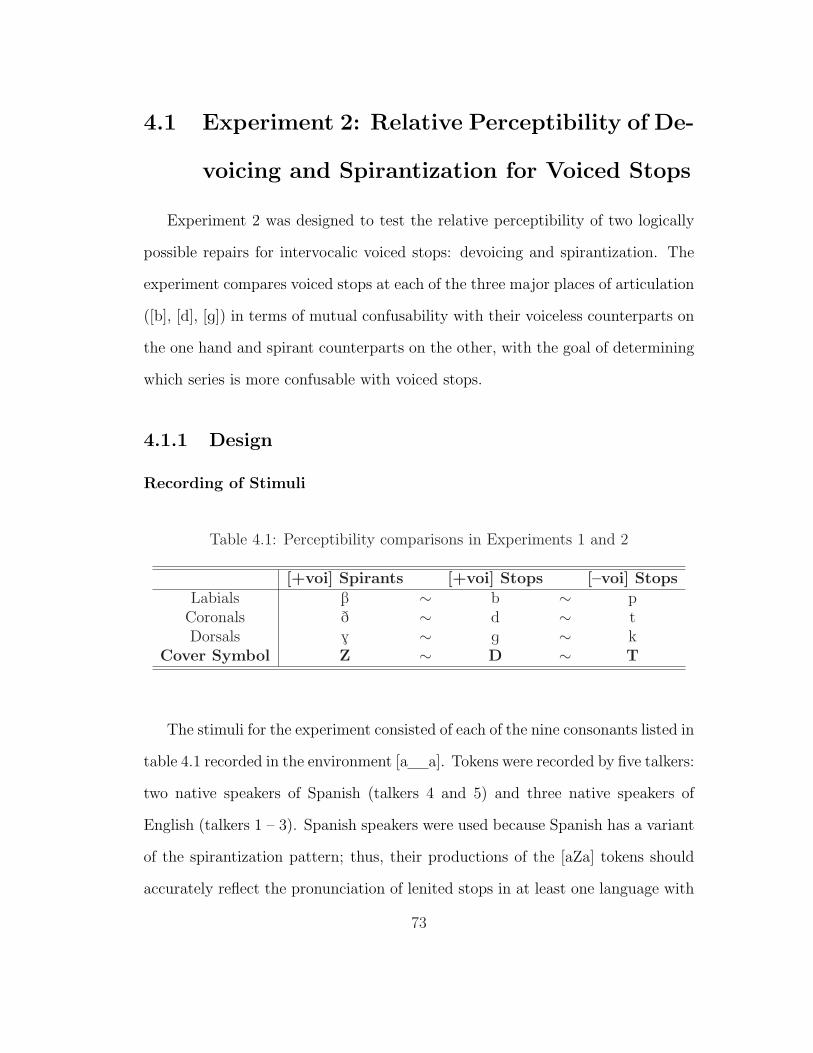
4.1 Experiment 2: Relative Perceptibility of De-
voicing and Spirantization for Voiced Stops
Experiment 2 was designed to test the relative perceptibility of two logically
possible repairs for intervocalic voiced stops: devoicing and spirantization. The
experiment compares voiced stops at each of the three major places of articulation
([b], [d], [g]) in terms of mutual confusability with their voiceless counterparts on
the one hand and spirant counterparts on the other, with the goal of determining
which series is more confusable with voiced stops.
4.1.1 Design
Recording of Stimuli
Table 4.1: Perceptibility comparisons in Experiments 1 and 2
[+voi] Spirants [+voi] Stops [–voi] StopsLabials B ∼ b ∼ p
Coronals D ∼ d ∼ tDorsals G ∼ g ∼ k
Cover Symbol Z ∼ D ∼ T
The stimuli for the experiment consisted of each of the nine consonants listed in
table 4.1 recorded in the environment [a a]. Tokens were recorded by five talkers:
two native speakers of Spanish (talkers 4 and 5) and three native speakers of
English (talkers 1 – 3). Spanish speakers were used because Spanish has a variant
of the spirantization pattern; thus, their productions of the [aZa] tokens should
accurately reflect the pronunciation of lenited stops in at least one language with
73
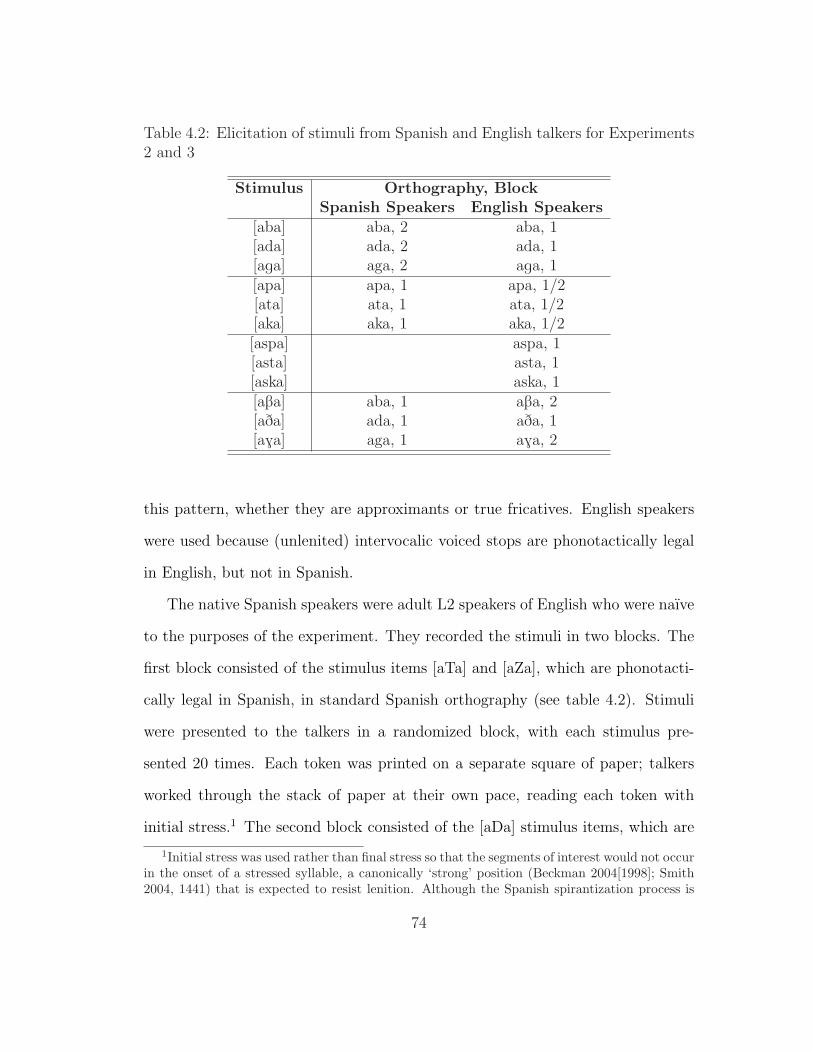
Table 4.2: Elicitation of stimuli from Spanish and English talkers for Experiments2 and 3
Stimulus Orthography, BlockSpanish Speakers English Speakers
[aba] aba, 2 aba, 1[ada] ada, 2 ada, 1[aga] aga, 2 aga, 1[apa] apa, 1 apa, 1/2[ata] ata, 1 ata, 1/2[aka] aka, 1 aka, 1/2[aspa] aspa, 1[asta] asta, 1[aska] aska, 1[aBa] aba, 1 aBa, 2[aDa] ada, 1 aDa, 1[aGa] aga, 1 aGa, 2
this pattern, whether they are approximants or true fricatives. English speakers
were used because (unlenited) intervocalic voiced stops are phonotactically legal
in English, but not in Spanish.
The native Spanish speakers were adult L2 speakers of English who were naıve
to the purposes of the experiment. They recorded the stimuli in two blocks. The
first block consisted of the stimulus items [aTa] and [aZa], which are phonotacti-
cally legal in Spanish, in standard Spanish orthography (see table 4.2). Stimuli
were presented to the talkers in a randomized block, with each stimulus pre-
sented 20 times. Each token was printed on a separate square of paper; talkers
worked through the stack of paper at their own pace, reading each token with
initial stress.1 The second block consisted of the [aDa] stimulus items, which are
1Initial stress was used rather than final stress so that the segments of interest would not occurin the onset of a stressed syllable, a canonically ‘strong’ position (Beckman 2004[1998]; Smith2004, 1441) that is expected to resist lenition. Although the Spanish spirantization process is
74
phonotactically illegal in Spanish (Spanish has spirantization of voiced stops in-
tervocalically, among other environments). For this block, talkers were instructed
to pronounce the consonants as they would be pronounced in English (i.e., as
stops); the talkers and the experimenter discussed how the English and Spanish
pronunciations differ to ensure that the talkers understood what was being asked
of them.
The native English speakers were linguistically trained American students in
their 20s who were naıve to the purposes of the experiment. Again, the stimuli
were recorded in two blocks. The first block consisted of the stimulus items [aTa],
[aDa], and [aDa], which are phonotactically legal in English (but not [aBa] or [aGa],
which are not). Subjects were requested to avoid flapping in [ata] and [ada]; since
flapping is optional, these pronunciations were still phonotactically legal, although
perhaps in a more formal register. Stimuli were presented in IPA (see table 4.2).
The first block also contained the additional stimulus items [asTa], which were
recorded in hopes of obtaining reduced aspiration on the voiceless stops. Stimuli
were presented and recorded as described above. The second block consisted
of the stimuli [aBa] and [aGa], which contain segments absent from the English
inventory; in addition, the [aTa] stimuli were presented again, and talkers were
asked to avoid aspirating the voiceless stops.
Selection of Stimuli
Naturally produced stimuli were used because the purpose of this experiment
is to determine how well listeners can distinguish between the relevant sounds,
not to identify what cues they use to do so. However, there are three ways in
not sensitive to stress, other lenition processes are (such as English flapping).
75
which the production of these stimuli might bias the results of the experiment:
1. English voiced and voiceless stops contrast in aspiration, and not merely
voicing. This property is especially pronounced at the beginning of stressed
syllables, but seems to be present even intervocalically (see figure 4.1 below).
Thus, the voiced and voiceless stops produced by the English talkers might
be easier to discriminate than the voicing contrast in a language that does
not use aspiration to the same extent.
2. In producing the [aBa] and [aGa] stimuli, the English speakers tended to
produce relatively long initial vowels (see figures 4.2 and 4.8), presumably
because these stimuli were non-native and required extra attention. This
property of those talkers’ stimuli could be used by subjects as a cue to the
Z ∼ D distinction that may not be found in natural speech, thus artificially
increasing the salience of that distinction. This length difference could also
interfere with subjects’ perception of the T ∼ D distinction, where length
of the preceding vowel is a common cue for voicing (see Kingston and Diehl
(1994) and references therein).
3. As noted above, for all of the talkers, some of the stimuli involved non-native
segments, phonotactics, or both. It is possible that the vowels in these non-
native stimuli were distorted, thus providing an additional (artificial) cue to
the relevant distinctions.
Of the 20 tokens of each stimulus produced by each talker, approximately
10 tokens were selected for use in the experiment. The number of tokens that
were selected depended on the quality of the tokens and ranged between 6 and
76
13; in most cases (33 out of 45), the number was between 8 and 10. Tokens were
analyzed in Praat (Boersma and Weenink 2007) and selected so as to maximize the
naturalness of the tokens and minimize the potential confounds 1 and 3 discussed
above, as follows:
1. English speakers’ tokens of [aTa] were selected from the ordinary [aTa] stim-
uli in the first block. The [asTa] tokens were not used because of the effects
of the coronal [s] on the formants of the first vowel. The unaspirated [aTa]
tokens were not used because they were difficult for the English speakers to
produce naturally.
2. All tokens with any obvious abnormality were excluded (e.g., tokens with
stress on the final syllable, closure during a spirant, lack of closure during a
stop, and so on).
3. All [aZa] tokens (of both English and Spanish speakers) were rated for nat-
uralness by two native speakers of Spanish (not the same Spanish speakers
who recorded stimuli). These speakers were asked to evaluate the tokens as
Spanish nonsense words, paying attention only to the consonant. For each
talker and place of articulation, the tokens with the highest ratings from
both raters were selected.
4. For the English speakers, the tokens of the [aTa] stimuli were selected that
had the shortest period of aspiration after the stop.
5. One of the Spanish speakers (talker 4 in the graphs below) produced to-
kens of the [aTa] stimuli with unusually long stop closures. For this talker,
the [aTa] tokens with the shortest closures were chosen. [aTa] tokens for
77
the other Spanish speaker (talker 5) were selected like the [aDa] tokens, as
described below.
6. After filtering by these criteria, the F1 and F2 values of the vowels of the
remaining stimuli were measured. For each talker and place of articulation,
the [aDa] tokens were chosen that were closest to the [aZa] and [aTa] tokens
for that talker and place of articulation (as measured by the formants of the
first vowel). The goal of this procedure was to ensure that the vowels of
the [aDa] tokens were not systematically more similar to those of the [aZa]
tokens than the [aTa] tokens, or vice versa. Thus, we can be reasonably sure
that listeners’ sensitivity to the relevant pairs is truly grounded in differences
among the consonants, not accidental differences among the vowels.2
Selected tokens were trimmed, leaving 200 ms of silence on either side of the
word, and amplitude-normalized using a Praat script that set the peak of each file
at .8. The acoustic characteristics of the selected tokens, as relevant to the possible
confounds described above, are given below with the results of the experiment.
Participants
24 native speakers of English participated in the experiment; all were students
in undergraduate linguistics courses at the University of California, Santa Cruz.
Subjects received either monetary compensation or extra credit, depending on
the course. Subjects ranged in age from 18 to 23 years old and none were native
speakers of a language other than English.
2Of course, some of the cues to the voicing and continuancy distinctions of interest are foundin the vowels as well as the consonants. Since the formant values were measured at the midpointsof the vowels, it is reasonable to assume that they were affected by the adjacent consonants aslittle as possible.
78
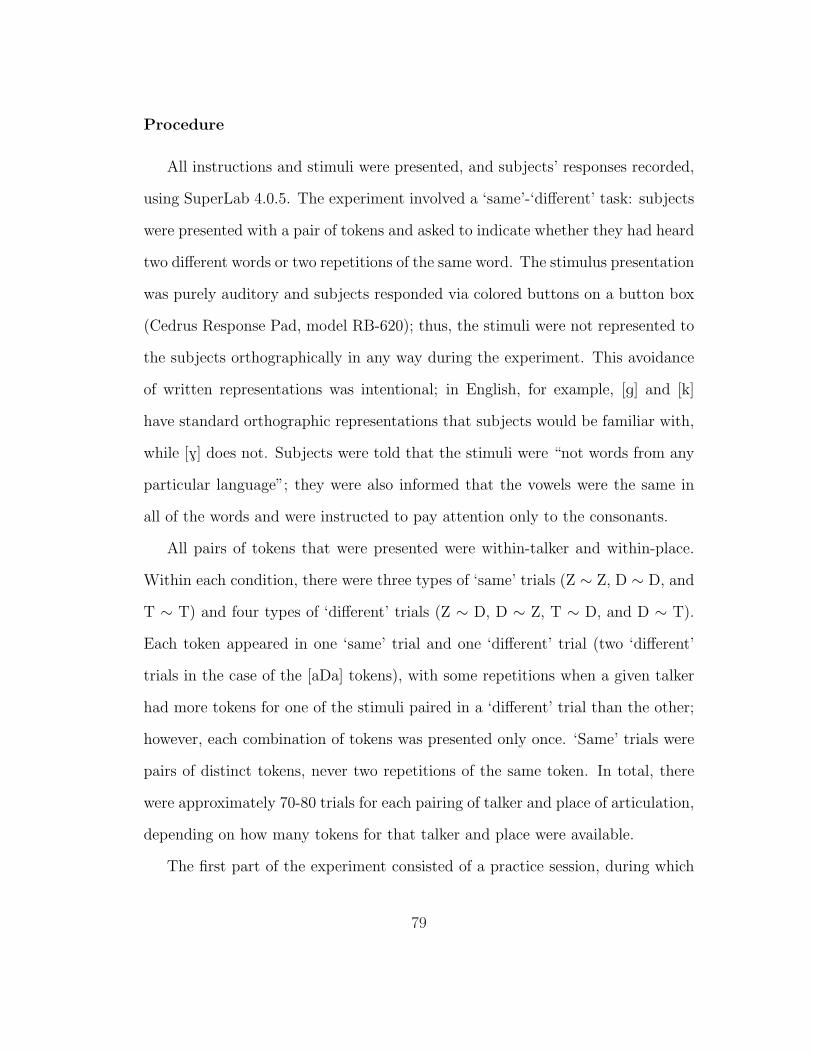
Procedure
All instructions and stimuli were presented, and subjects’ responses recorded,
using SuperLab 4.0.5. The experiment involved a ‘same’-‘different’ task: subjects
were presented with a pair of tokens and asked to indicate whether they had heard
two different words or two repetitions of the same word. The stimulus presentation
was purely auditory and subjects responded via colored buttons on a button box
(Cedrus Response Pad, model RB-620); thus, the stimuli were not represented to
the subjects orthographically in any way during the experiment. This avoidance
of written representations was intentional; in English, for example, [g] and [k]
have standard orthographic representations that subjects would be familiar with,
while [G] does not. Subjects were told that the stimuli were “not words from any
particular language”; they were also informed that the vowels were the same in
all of the words and were instructed to pay attention only to the consonants.
All pairs of tokens that were presented were within-talker and within-place.
Within each condition, there were three types of ‘same’ trials (Z ∼ Z, D ∼ D, and
T ∼ T) and four types of ‘different’ trials (Z ∼ D, D ∼ Z, T ∼ D, and D ∼ T).
Each token appeared in one ‘same’ trial and one ‘different’ trial (two ‘different’
trials in the case of the [aDa] tokens), with some repetitions when a given talker
had more tokens for one of the stimuli paired in a ‘different’ trial than the other;
however, each combination of tokens was presented only once. ‘Same’ trials were
pairs of distinct tokens, never two repetitions of the same token. In total, there
were approximately 70-80 trials for each pairing of talker and place of articulation,
depending on how many tokens for that talker and place were available.
The first part of the experiment consisted of a practice session, during which
79
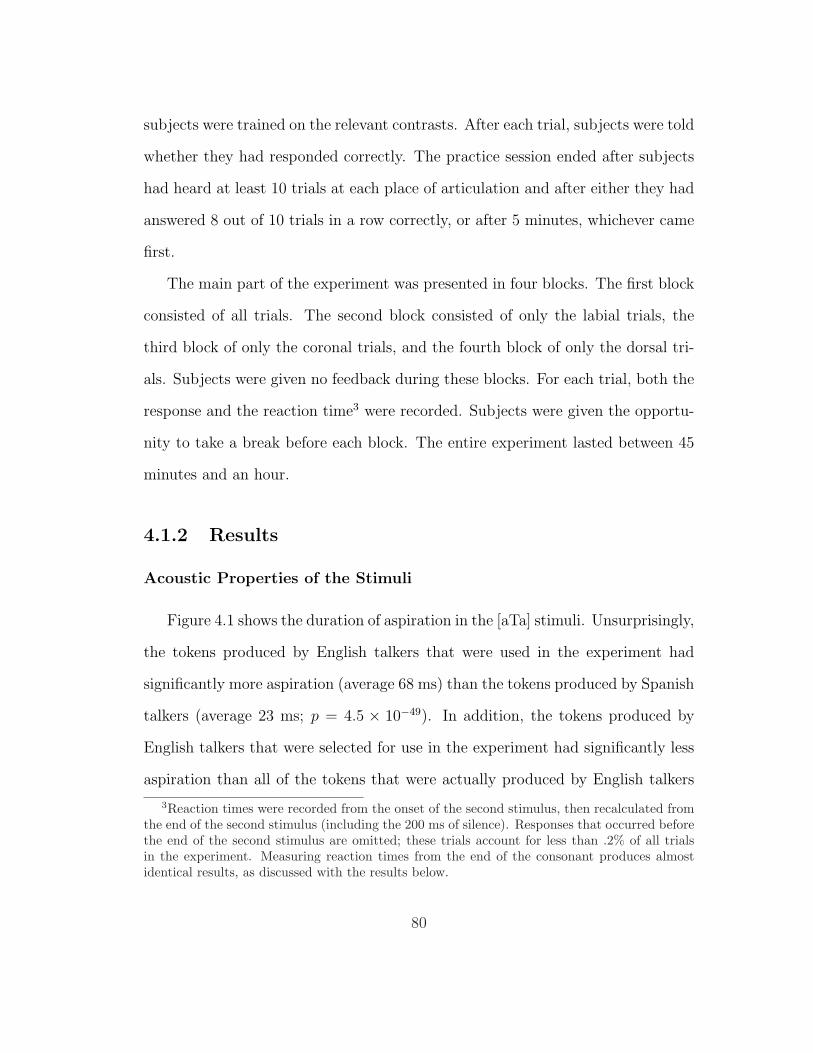
subjects were trained on the relevant contrasts. After each trial, subjects were told
whether they had responded correctly. The practice session ended after subjects
had heard at least 10 trials at each place of articulation and after either they had
answered 8 out of 10 trials in a row correctly, or after 5 minutes, whichever came
first.
The main part of the experiment was presented in four blocks. The first block
consisted of all trials. The second block consisted of only the labial trials, the
third block of only the coronal trials, and the fourth block of only the dorsal tri-
als. Subjects were given no feedback during these blocks. For each trial, both the
response and the reaction time3 were recorded. Subjects were given the opportu-
nity to take a break before each block. The entire experiment lasted between 45
minutes and an hour.
4.1.2 Results
Acoustic Properties of the Stimuli
Figure 4.1 shows the duration of aspiration in the [aTa] stimuli. Unsurprisingly,
the tokens produced by English talkers that were used in the experiment had
significantly more aspiration (average 68 ms) than the tokens produced by Spanish
talkers (average 23 ms; p = 4.5 × 10−49). In addition, the tokens produced by
English talkers that were selected for use in the experiment had significantly less
aspiration than all of the tokens that were actually produced by English talkers
3Reaction times were recorded from the onset of the second stimulus, then recalculated fromthe end of the second stimulus (including the 200 ms of silence). Responses that occurred beforethe end of the second stimulus are omitted; these trials account for less than .2% of all trialsin the experiment. Measuring reaction times from the end of the consonant produces almostidentical results, as discussed with the results below.
80
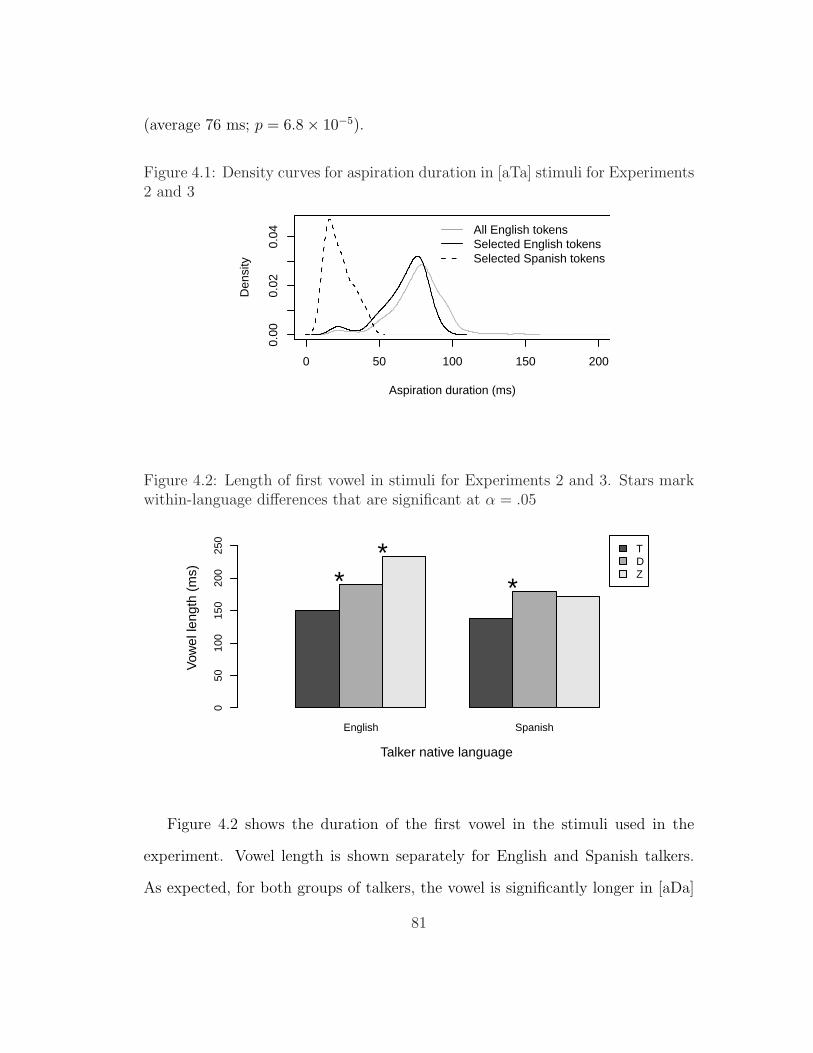
(average 76 ms; p = 6.8× 10⁻⁵).
Figure 4.1: Density curves for aspiration duration in [aTa] stimuli for Experiments2 and 3
0 50 100 150 200
0.00
0.02
0.04
Aspiration duration (ms)
Den
sity
All English tokensSelected English tokensSelected Spanish tokens
Figure 4.2: Length of first vowel in stimuli for Experiments 2 and 3. Stars markwithin-language differences that are significant at α = .05
English Spanish
TDZ
Talker native language
Vow
el le
ngth
(m
s)
050
100
150
200
250
**
*
Figure 4.2 shows the duration of the first vowel in the stimuli used in the
experiment. Vowel length is shown separately for English and Spanish talkers.
As expected, for both groups of talkers, the vowel is significantly longer in [aDa]
81
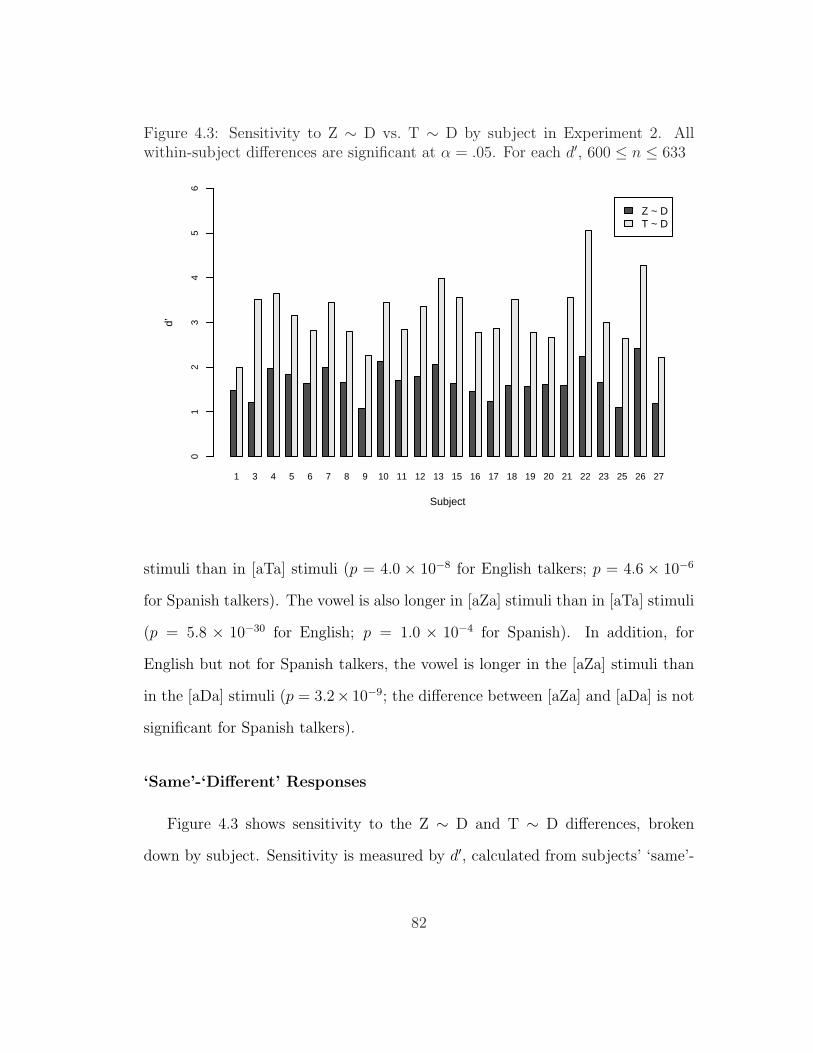
Figure 4.3: Sensitivity to Z ∼ D vs. T ∼ D by subject in Experiment 2. Allwithin-subject differences are significant at α = .05. For each d′, 600 ≤ n ≤ 633
1 3 4 5 6 7 8 9 10 11 12 13 15 16 17 18 19 20 21 22 23 25 26 27
Z ~ DT ~ D
Subject
d’
01
23
45
6
stimuli than in [aTa] stimuli (p = 4.0 × 10⁻⁸ for English talkers; p = 4.6 × 10⁻⁶
for Spanish talkers). The vowel is also longer in [aZa] stimuli than in [aTa] stimuli
(p = 5.8 × 10⁻³⁰ for English; p = 1.0 × 10⁻⁴ for Spanish). In addition, for
English but not for Spanish talkers, the vowel is longer in the [aZa] stimuli than
in the [aDa] stimuli (p = 3.2× 10⁻⁹; the difference between [aZa] and [aDa] is not
significant for Spanish talkers).
‘Same’-‘Different’ Responses
Figure 4.3 shows sensitivity to the Z ∼ D and T ∼ D differences, broken
down by subject. Sensitivity is measured by d′, calculated from subjects’ ‘same’-
82

‘different’ responses, using the Independent-Observation Model.4 Each subject
is significantly more sensitive to the voicing distinction than to the continuancy
distinction; when the results for each subject are broken down by place, as shown
in figure 4.4, the direction of the effect is the same in every case. Significance for
d′ was calculated using the G statistic of Gourevitch and Galanter (1967).
Figure 4.5 shows sensitivity by talker and place of articulation. For each
combination of talker and place, sensitivity to T ∼ D is significantly greater than
sensitivity to Z ∼ D. Recall that talkers 1 – 3 are the English speakers, and talkers
4 and 5 the Spanish speakers.
Subjects were slightly more sensitive to all differences in later blocks than in
the first block; however, the differences in sensitivity are very small.
4The design of this experiment is neither a pure ‘fixed’ design nor a pure ‘roving’ one. SeeKabak and Idsardi (2007, fn. 6) for an argument for the appropriateness of the Independent-Observation Model for this kind of experiment.
83

Figure 4.4: Sensitivity to Z ∼ D vs. T ∼ D by subject and place of articulationin Experiment 2. Stars mark within-subject and within-place differences that aresignificant at α = .05. For each d′, 194 ≤ n ≤ 213. Within each plot, the threepairs of bars are for labials, coronals, and dorsals (left to right), and the y-axismeasures d′
1
01
23
45
6
*
3
01
23
45
6
* * *
4
01
23
45
6* *
5
01
23
45
6
* *
6
01
23
45
6
* *
7
01
23
45
6
* *
8
01
23
45
6
* *
9
01
23
45
6* *
10
01
23
45
6
* * *
11
01
23
45
6
* * *
12
01
23
45
6
**
13
01
23
45
6
* * *
15
01
23
45
6
* * *
16
01
23
45
6
* * *
17
01
23
45
6
* * *
18
01
23
45
6
* * *
19
01
23
45
6
* *
20
01
23
45
6
* *
21
01
23
45
6
* * *
22
01
23
45
6 * * *23
01
23
45
6
* *
25
01
23
45
6
* * *
26
01
23
45
6
* * *
27
01
23
45
6
* *
Z ~ DT ~ D
84

Figure 4.5: Sensitivity to Z ∼ D vs. T ∼ D by talker and place of articulationfor Experiment 2. All within-talker and within-place differences are significant atα = .05. For each d′, 864 ≤ n ≤ 1203. Within each plot, the three pairs of barsare for labials, coronals, and dorsals (left to right), and the y-axis measures d′
1
01
23
4
2
01
23
43
01
23
4
40
12
34
5
01
23
4
Z ~ DT ~ D
Reaction Times
Reaction times were analyzed with a linear mixed-effects model, which pre-
dicted log reaction time from the factors Comparison (Z ∼ D vs. T ∼ D), Place,
Trial (the number of the trial for each subject), and their two-way interactions
as fixed effects and the factors Talker and Subject as random effects. The model
also included by-Subject random effects of Trial. Significance of each fixed effect
was estimated from its t-statistic with degrees of freedom equal to the number
of observations minus the number of fixed-effects parameters (Baayen 2008, 248).
Only reaction times for ‘different’ trials to which subjects responded correctly
were included. In general, responses were faster in the same conditions in which
subjects exhibited greater sensitivity, as detailed below.
A model of this type with multiple categorical factors, such as Comparison
85

and Place, does not produce information about the main effect of one factor
independently of the other. For example, the main effect of Comparison in this
model is actually the effect of Comparison within the level of Place that happens
to be chosen as the baseline (that is, among either labials, coronals, or dorsals,
but not across the three places). For the crucial effect of Comparison, I built three
separate models, one with each place of articulation as the baseline, in order to
determine whether the effect of Comparison was significant for each place. For
other effects, I report the results from the model with coronals as the baseline;
unless otherwise noted, all significant effects in this model were also significant in
the two other models.
The effect of Comparison was significant for all three places of articulation:
labials (p = 1.6× 10⁻³), coronals (p = 2.7× 10⁻¹²), and dorsals (p = 1.2× 10⁻²¹).
For all three places of articulation, subjects responded more slowly to Z ∼ D trials
than they did to T ∼ D trials. The middle graph in figure 4.6 shows the partial
effects of the interaction between Comparison and Place.
There was a significant effect of Trial (p = 4.7× 10⁻⁷) such that subjects got
faster over the course of the experiment. There was also a significant interaction
between Comparison and Trial (p = 3.1× 10⁻³); subjects improved more quickly
on Z ∼ D trials than they did on T ∼ D trials. Finally, there was a marginal
interaction between Place and Trial: subjects improved more quickly for coronals
than they did for either labials (p = .088) or dorsals (p = .034); the difference
between labials and dorsals was not significant (p = .97). Figure 4.6 shows the
partial effects of the interactions between Trial and Comparison (left) and between
Trial and Place (right).
To determine how robust the effect of Comparison is, this model was compared
86

Figure 4.6: Partial effects of the interactions between Trial and Comparison, Com-parison and Place, and Trial and Place in Experiment 2
0 400 800
300
350
400
450
500
550
600
Trial by Comparison
Trial
RT
TD Com
paris
on
ZD 400
450
500
550
Comparison by POA
Comparison
RT
TD ZD
lab
PO
A
cor
PO
A
dor
0 400 800
300
350
400
450
Trial by POA
Trial
RT
lab
PO
A
cor
dor
to one that included an interaction between Subject and Comparison as a random
effect, and one that included an interaction between Talker and Comparison as a
random effect. Either interaction, if significant, would suggest that the effect of
Comparison seen above is particular to this group of subjects or talkers. The like-
lihood ratio test described in Baayen (2008, 253) showed that the improvement in
the model that added an interaction between Subject and Comparison approached
significance (p = .061), while the model that added an interaction between Talker
and Comparison was significantly improved (p = 1.7×10⁻³). However, none of the
by-subject or by-talker interactions reversed the direction of the effect: reaction
times were slower for Z ∼ D comparisons for each individual subject and talker.
Thus, difficulty with Z ∼ D trials is robust across subjects and talkers.
Finally, recall that reaction times were measured from the end of the stimulus.
An alternative method would be to measure reaction time from the end of the con-
sonant, since it is the consonants (not the vowels) that consitute the comparisons
87

of interest. The choice between these options depends on two factors:
1. Does the length of the second vowel vary systematically by consonant (or
talker)?
2. Did subjects use cues from the second vowel in the perceptual task?
If the length of the second vowel varies systematically among the different stim-
uli, then measuring reaction times from a point after the end of the vowel may
artificially increase or decrease reaction times for certain stimuli. On the other
hand, if subjects used cues from the second vowel in the discrimination task, then
measuring from the end of the vowel may be a more accurate representation of
the point at which subjects had enough information to make a decision.
The answer to question 1 is ‘yes’. For example, for every talker except talker
4, the second vowel in the [aZa] stimuli is significantly longer than the second
vowel in the [aDa] stimuli. What is not certain, however, is whether subjects
used this difference in duration – or other cues within the second vowel – to
distinguish the two types of stimuli. In the absence of a clear answer, I built a
second set of models based on the reaction times as measured from the end of the
consonant. The resulting models are nearly identical to those based on reaction
times measured from the end of the stimulus. All of the effects reported above as
significant are also significant in this second set of models, except for the result of
adding by-subject and by-talker interactions with Comparison. The latter models
are not significantly improved by adding such an interaction, either for subjects
(p = .38) or for talkers (p = .39).
88

4.1.3 Discussion
Overall Results
Overall, the results of the experiment are consistent with a perceptual account
of the broad strokes of lenition: listeners are less sensitive to the distinction be-
tween voiced stops and spirants intervocalically than they are to the distinction
between voiced and voiceless stops. This difference was manifested both in sub-
jects’ ‘same’-‘different’ responses (reflected in the d′ scores) and in their reaction
times: subjects were quicker to identify the more salient voicing distinction than
the continuancy distinction.
This effect is highly robust and seems unlikely to be due to the particulars of
the experimental design. The difference in d′ scores was seen for every combination
of talker and place of articulation; this fact indicates that the sensitivity difference
is probably not a peculiarity of a few talkers’ pronunciations. Nor is the effect
likely to depend on particular characteristics of the experimental subjects: the
difference in d′ scores was seen for every combination of subject and place of
articulation, and even with a random effect for the interaction of Subject and
Comparison, every subject responded more slowly on Z ∼ D trials than on T ∼D trials.
Effect of Acoustic Characteristics of Stimuli
Recall that there are at least two ways in which the English talkers’ tokens
might have influenced the main result that the voicing distinction is more salient
than the continuancy distinction: the use of aspiration to cue voiceless stops,
and the difference in length between the initial vowels in the [aDa] and [aZa]
89

stimuli. The aspiration in the [aTa] stimuli might have artificially enhanced the T
∼ D distinction, while the long vowels in the [aZa] stimuli might have artificially
enhanced the Z ∼ D distinction.
It is unlikely that the English talkers’ aspiration is driving the entire difference
in perceptibility between the Z ∼ D and T ∼ D comparisons. The overall effect
holds not only for the English talkers, who produced a significant amount of
aspiration, but also for the Spanish talkers, who produced far less. Indeed, if
anything, we might expect the subjects’ sensitivity to the T ∼ D contrast for the
Spanish talkers to be artificially low – as English speakers, the subjects would
expect to be able to rely on the aspiration cue that was much less pronounced in
the Spanish tokens.
As for vowel length, the effect of the long vowels in the [aZa] tokens should, if
anything, encourage the opposite of the effect found here: by using vowel length as
a cue to the Z ∼ D distinction, subjects should have been better able to distinguish
those stimuli than they otherwise would have been able to. The T ∼ D distinction
was nevertheless more salient, suggesting that this is a robust result.
Effect of the English Consonant Inventory
Finally, it is important to consider whether the main result that the T ∼ D
distinction is more salient than the Z ∼ D distinction is simply an artifact of the
consonant inventory of the English-speaking subjects. For example, since English
has phonemic [k] and [g] but lacks [G], it is only to be expected that English
speakers are better able to tell the difference between phonemic sounds in their
language ([g] and [k]) than between a phonemic and non-phonemic sound ([g]
and [G]) (Boomershine et al. 2008), especially if the unfamiliar [G] was assimilated
90
to the native category [g] (Best et al. 1988; Kuhl and Iverson 1992). A similar
explanation could be put forward for the labials: English has [p] and [b], but not
[B].5
However, it is unlikely that the English segment inventory alone is responsible
for the main result that the voicing distinction is more salient than the contin-
uancy distinction. The result holds for coronals as well: even though all three
consonants tested in the coronal conditions are phonemic in English ([D], [d], and
[t]), English speakers were less sensitive to one distinction than the other. Indeed,
the interaction between Comparison and Place illustrated in figure 4.6 suggests
that coronals suffered more in the Z ∼ D condition than the labials did, despite
their phonemic advantage.
In addition, there is reason to believe that the results for labials and dorsals are
just as relevant to understanding spirantization as those for coronals. As discussed
in chapter 2, the typological survey of Gurevich (2004) shows that spirantization
of voiced stops, like other lenition processes, is usually non-neutralizing. In other
words, if a language spirantizes a voiced stop, the resulting voiced spirant exists
in the language only as an allophone of the stop; the two are not phonemically
contrastive, just as English [g] and [G] do not contrast. On the other hand, many
of these languages do have voiceless stops that contrast with the voiced stops, just
as English [k] and [g] constrast.
There are at least two possible explanations for this state of affairs. One
is that once intervocalic spirantization becomes part of a language’s phonology,
5It is possible that subjects assimilated these [B]s to the native categories [v] or [w]. Tothe extent that subjects were successful in assimilating [B] to a native segment other than [b](an “opposing-category assimilation” in the terminology of Best et al. (1988, 347)), the sameargument applies here that is discussed below for coronals.
91

that language is likely to lose the contrast between stops and spirants in other
environments as well. Another possibility, however, is that spirantization is more
likely to enter a language in the first place if that language does not have a contrast
between voiced stops and spirants. If the latter is true, then the (non-)phonemic
status of [k] ∼ [g] ∼ [G] for English speakers is reflective of the situation for
languages that actually acquire lenition; in that case, the results for dorsals and
labials may represent the very conditions that encourage spirantization in the first
place.
Effect of Place of Articulation
The results of Experiment 2 clearly show that the voicing distinction is per-
ceptually more salient than the continuancy distinction for the relevant segments
and environments. Interestingly, the interaction between Comparison and Place
illustrated in figure 4.6 suggests that this difference in perceptual salience is not
equally large at every place of articulation. Experiment 2 tests whether there are
indeed differences by place, or whether this result was simply an artifact of the
English-speaking subjects’ native consonant inventories.
4.2 Experiment 3: Effect of Place of Articula-
tion
As noted above, Spanish is one language that has a variant of the lenition
process of interest: the voiced stops [b], [d], and [g] become the spirants [B], [D],
and [G] between vowels (among other environments, depending on the dialect). In
92

addition, Spanish contains all three voiceless stops investigated here ([p], [t], and
[k]), which contrast phonemically with the voiced stops/spirants. Thus, native
Spanish speakers cannot provide data on whether the T ∼ D or Z ∼ D distinc-
tion is more salient: since allophonic distinctions are perceived more poorly than
phonemic ones (Boomershine et al. 2008), we expect Spanish-speaking subjects
to be more sensitive to the T ∼ D distinction purely by reason of their native
consonant inventory.
However, the effect of the native segment inventory of Spanish should be the
same at each place of articulation: for each place, the T ∼ D distinction is phone-
mic and the Z ∼ D distinction is allophonic. Therefore, unlike English speakers,
Spanish speakers provide the perfect opportunity to study those perceptual dif-
ferences by place that are inventory-independent.
4.2.1 Design
11 native speakers of Spanish participated in the experiment; all were under-
graduate students at the University of California, Santa Cruz. Subjects received
either monetary compensation or extra credit, depending on which courses they
were recruited from. The procedure was exactly the same as that in Experiment
2, except that all of the instructions were in Spanish. The Spanish instructions
were intended to encourage the subjects to draw on their Spanish resources when
perceiving the stimuli, especially for those subjects who were native bilingual
speakers of both Spanish and English (subjects 2, 3, 6, 7, and 11). Excluding
these subjects from the analyses below does not substantially affect the results.
In the discussion of reaction times below, I report the results for an analysis of
93
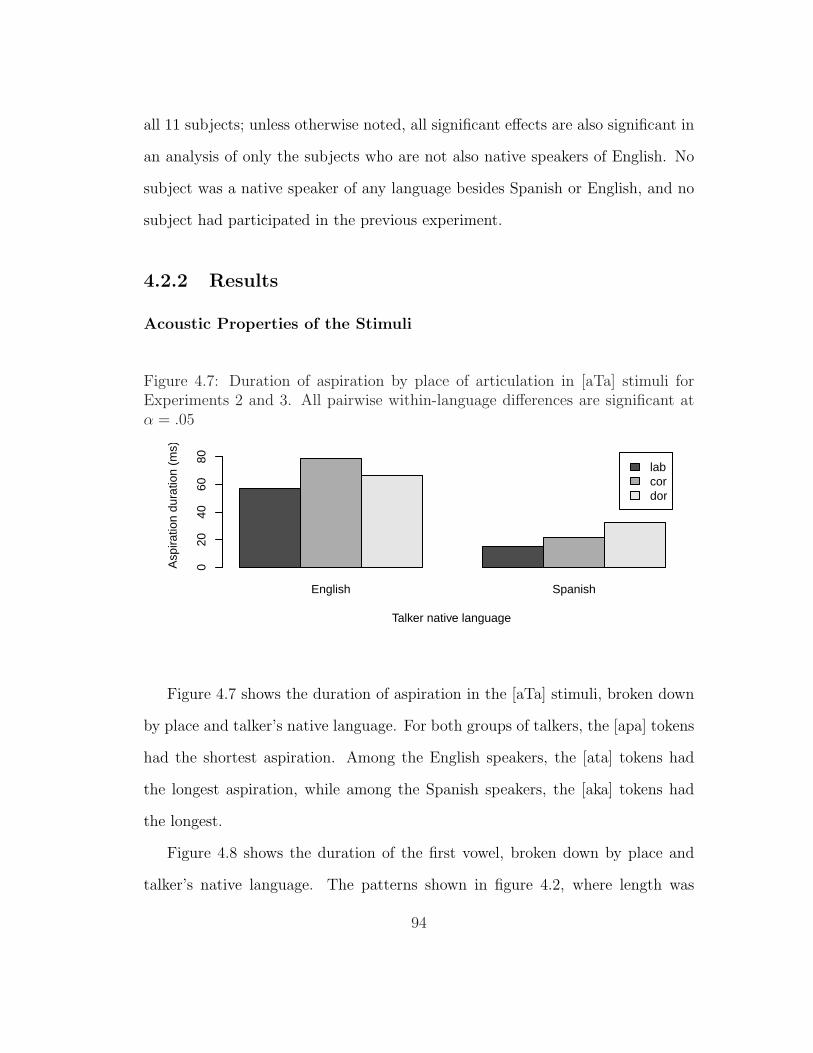
all 11 subjects; unless otherwise noted, all significant effects are also significant in
an analysis of only the subjects who are not also native speakers of English. No
subject was a native speaker of any language besides Spanish or English, and no
subject had participated in the previous experiment.
4.2.2 Results
Acoustic Properties of the Stimuli
Figure 4.7: Duration of aspiration by place of articulation in [aTa] stimuli forExperiments 2 and 3. All pairwise within-language differences are significant atα = .05
English Spanish
labcordor
Talker native language
Asp
iratio
n du
ratio
n (m
s)
020
4060
80
Figure 4.7 shows the duration of aspiration in the [aTa] stimuli, broken down
by place and talker’s native language. For both groups of talkers, the [apa] tokens
had the shortest aspiration. Among the English speakers, the [ata] tokens had
the longest aspiration, while among the Spanish speakers, the [aka] tokens had
the longest.
Figure 4.8 shows the duration of the first vowel, broken down by place and
talker’s native language. The patterns shown in figure 4.2, where length was
94

Figure 4.8: Length of first vowel by place of articulation in stimuli for Experi-ments 2 and 3. Stars mark within-language and within-place differences that aresignificant at α = .05
lab cor dor
TDZ
English talkers
Place
Vow
el le
ngth
(m
s)
010
020
030
0
** *
lab cor dor
TDZ
Spanish talkers
Place
Vow
el le
ngth
(m
s)
050
150
250
* *
pooled across place, are largely preserved here, with some loss of significance. For
both groups of talkers, the difference in vowel length between [aTa] and [aDa]
stimuli is significant only for coronals and dorsals. Among English speakers, the
unusually long vowel durations in the [aZa] stimuli are significant only for tokens
of [aBa].
‘Same’-‘Different’ Responses
Figure 4.9 shows subjects’ sensitivity to the Z ∼ D and T ∼ D differences by
place of articulation, pooled across subjects. The difference is largest for dorsals,
and comparable for labials and coronals. This pattern appears to hold for most
(but not all) of the individual subjects, as shown in figure 4.10. Note that having
an extremely large difference for dorsals does not seem to be correlated with
whether the subject is also a native speaker of English: subjects 6, 7, and 11 all
have especially large differences among the dorsals, but subjects 2 and 3 do not.
Figure 4.11 shows sensitivity by place of articulation and talker. The trend
95

Figure 4.9: Sensitivity to Z ∼ D vs. T ∼ D by place of articulation in Experiment3. All within-place differences are significant at α = .05. For each d′, 5355 ≤ n ≤5727
lab cor dor
Z ~ DT ~ D
d’
0.0
1.0
2.0
Figure 4.10: Sensitivity to Z ∼ D vs. T ∼ D by subject and place of articulationin Experiment 3. Stars mark within-subject and within-place differences that aresignificant at α = .05. For each d′, 198 ≤ n ≤ 216. Within each plot, the threepairs of bars are for labials, coronals, and dorsals (left to right), and the y-axismeasures d′
1
01
23
45 * * *
2
01
23
45
* * *
3
01
23
45
4
01
23
45 * * *
5
01
23
45
* * *
6
01
23
45
* * *
7
01
23
45
* * *
8
01
23
45
* * *
9
01
23
45
** *
10
01
23
45
* * *
11
01
23
45
*
Z ~ DT ~ D
towards larger differences among dorsals is especially pronounced for talkers 1, 3,
and 4.
96

Figure 4.11: Sensitivity to Z ∼ D vs. T ∼ D by talker and place of articulationfor Experiment 3. All within-talker and within-place differences are significant atα = .05. Within each plot, the three pairs of bars are for labials, coronals, anddorsals (left to right), and the y-axis measures d′
1
01
23
4
2
01
23
4
3
01
23
4
40
12
34
5
01
23
4
Z ~ DT ~ D
Reaction Times
Reaction time data was analyzed in exactly the same way as described for Ex-
periment 2. Adding interactions between Comparison and Subject and between
Comparison and Talker resulted in significant improvements to the model of reac-
tion times for Experiment 3; therefore, those interactions were included in the final
model. (For the subset of subjects who are not native speakers of English, only
the addition of an interaction between Comparison and Subject was a significant
improvement.)
For T ∼ D trials, subjects responded more quickly to coronals than to either
labials (p = 7.7 × 10⁻⁴) or dorsals (p = 4.7 × 10⁻³); the difference between
labials and dorsals was not significant (p = .24).6 For Z ∼ D trials, subjects
responded more slowly to dorsals than to either coronals (p = 2.8 × 10⁻⁸) or
6For the subset of subjects who are not native speakers of English, the difference betweencoronals and dorsals was not significant (p = .13), but the difference between labials and dorsalswas (p = 5.7× 10⁻³): subjects responded more quickly to dorsals than to labials.
97
labials (p = 1.7 × 10⁻⁶); the difference between labials and coronals was not
significant (p = .32).7 From these results, we can draw three conclusions about
the size of the effect of Comparison at different places of articulation:
� The difference between the Z ∼ D and T ∼ D comparisons is greater among
coronals than among labials: subjects responded more quickly to coronals
than to labials on T ∼ D trials, but for Z ∼ D trials, the two places were
approximately the same.
� The difference between the two comparisons is greater among dorsals than
among labials: although subjects responded at about the same rate to both
places on T ∼ D trials, subjects responded more slowly to dorsals than to
labials on Z ∼ D trials. For the subset of non-English-speakers, we can
draw the same conclusion in a slightly different way: as with the difference
between coronals and labials, subjects responded more quickly to dorsals
than to labials on T ∼ D trials; for Z ∼ D trials, however, the advantage of
dorsals disappeared, and subjects responded to the two places at about the
same rate.
� Possibly, the difference between the two comparisons is greater among dor-
sals than among coronals: for the subset of non-English-speakers only, re-
sponses were about the same in the T ∼ D trials for coronals and dorsals;
for the Z ∼ D trials, on the other hand, responses were slower for dorsals.
Analyses of reaction times from the end of the consonant produce exactly the
same pattern of significant and non-significant effects, except that responses were
7For the subset of non-English-speakers, the difference between dorsals and labials was notsignificant (p = .18).
98
significantly faster to coronals than to labials in Z ∼ D trials (p = .021).
4.2.3 Discussion
Effect of Place of Articulation
The Spanish-speaking subjects, like the English-speaking subjects, were more
sensitive to (and responded faster to) the voicing distinction than the continu-
ancy distinction. This result was expected on the basis of the Spanish consonant
inventory alone: the voicing distinction, but not the continuancy distinction, is
phonemic for Spanish speakers for these segments.
The new result of Experiment 3 is that the effect of comparison type depends
on place of articulation. The differences in sensitivity by place, and the inter-
actions between place and comparison type in the reaction times, suggest that
the size of the effect is greatest for dorsals and smallest for labials. Thus, the
continuancy distinction may be difficult to perceive in general, but it is especially
difficult for dorsals. This effect is not predicted on the basis of the Spanish con-
sonant inventory; thus, the results of Experiment 3 provide information about
the perceptibility of these different places of articulation independent of segment
inventory.
Effect of Acoustic Properties of the Stimuli
To be confident that the distinction between [aGa] and [aga] is especially poorly
perceived, we must ask whether the differences that were observed for each place
of articulation could be the result of particular acoustic properties of these stimuli.
Recall that two cues might be influencing the relative perceptibility of the T ∼ D
99
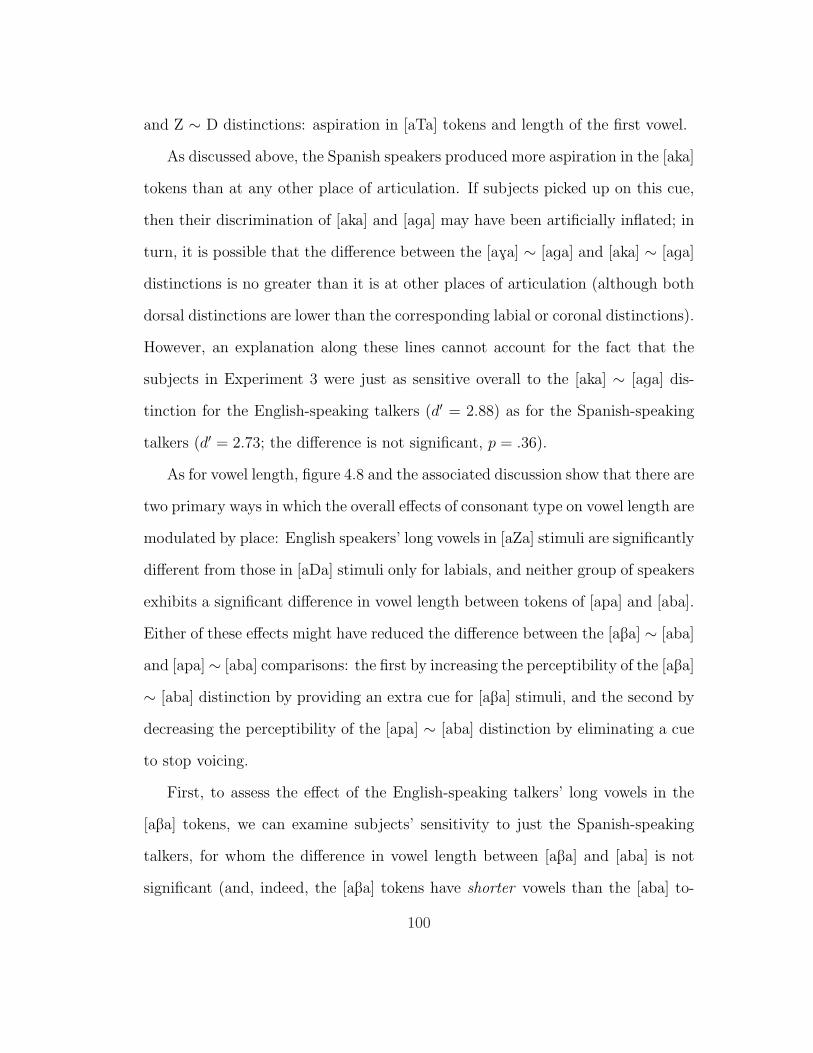
and Z ∼ D distinctions: aspiration in [aTa] tokens and length of the first vowel.
As discussed above, the Spanish speakers produced more aspiration in the [aka]
tokens than at any other place of articulation. If subjects picked up on this cue,
then their discrimination of [aka] and [aga] may have been artificially inflated; in
turn, it is possible that the difference between the [aGa] ∼ [aga] and [aka] ∼ [aga]
distinctions is no greater than it is at other places of articulation (although both
dorsal distinctions are lower than the corresponding labial or coronal distinctions).
However, an explanation along these lines cannot account for the fact that the
subjects in Experiment 3 were just as sensitive overall to the [aka] ∼ [aga] dis-
tinction for the English-speaking talkers (d′ = 2.88) as for the Spanish-speaking
talkers (d′ = 2.73; the difference is not significant, p = .36).
As for vowel length, figure 4.8 and the associated discussion show that there are
two primary ways in which the overall effects of consonant type on vowel length are
modulated by place: English speakers’ long vowels in [aZa] stimuli are significantly
different from those in [aDa] stimuli only for labials, and neither group of speakers
exhibits a significant difference in vowel length between tokens of [apa] and [aba].
Either of these effects might have reduced the difference between the [aBa] ∼ [aba]
and [apa]∼ [aba] comparisons: the first by increasing the perceptibility of the [aBa]
∼ [aba] distinction by providing an extra cue for [aBa] stimuli, and the second by
decreasing the perceptibility of the [apa] ∼ [aba] distinction by eliminating a cue
to stop voicing.
First, to assess the effect of the English-speaking talkers’ long vowels in the
[aBa] tokens, we can examine subjects’ sensitivity to just the Spanish-speaking
talkers, for whom the difference in vowel length between [aBa] and [aba] is not
significant (and, indeed, the [aBa] tokens have shorter vowels than the [aba] to-
100

kens). Unsurprisingly, subjects were more sensitive to the [aBa] ∼ [aba] distinction
for the English talkers (d′ = 1.82) than for the Spanish talkers (d′ = 1.28; the
difference is significant, p = 1.1 × 10⁻⁵). However, even for tokens produced by
the Spanish talkers, the effect of comparison type is greater for dorsals than it is
for labials: a mixed-effects model of reaction times identical to the one described
above but including only Spanish talkers reveals a significant interaction between
Comparison and Place such that subjects responded faster to [aka] ∼ [aga] trials
than to [apa] ∼ [aba] trials, but faster to [aBa] ∼ [apa] trials than to [aGa] ∼ [aga]
trials.
The impact of the lack of a significant difference in vowel duration between
[apa] and [aba] tokens is more difficult to assess, since both groups of talkers have
this property. A closer examination of the individual talkers, however, reveals
that three of the five talkers do in fact exhibit a significant difference: talkers 2
(p = 6.4 × 10⁻³), 3 (p = 3.2 × 10⁻²), and 5 (p = 2.2 × 10⁻⁵). But subjects were
no more sensitive to the [apa] ∼ [aba] distinction for these three talkers (joint
d′ = 2.68) than for the two remaining talkers who do not exhibit a difference
in vowel length (joint d′ = 2.81; the difference is not significant, p = .41). In
addition, the only pair of individual talkers who had significantly different d′s for
the [apa] ∼ [aba] distinction was talkers 1 and 3: for talker 1, who does not have
a significant difference in vowel length, subjects were more sensitive (d′ = 3.13)
than for talker 3, who does (d′ = 2.61; p = 3.8 × 10⁻²). Thus, it seems unlikely
that subjects suffered from insufficient cues to the voicing distinction in the labial
stimuli for some talkers.
101

4.3 Experiment 4: Relative Perceptibility of Voic-
ing and Spirantization for Voiceless Stops
Experiment 4 was designed to test the relative perceptibility of two logically
possible (and attested) repairs for intervocalic voiceless stops: voicing and spiran-
tization. The structure of the experiment is the same as that of Experiment 2,
except that different stimuli were used.
4.3.1 Design
Recording of Stimuli
The stimuli for Experiment 4 included the 9 consonants given in table 4.3; as
in Experiments 2 and 3, the stimuli had the form [a a], with initial stress and
with some consonant from table 4.3 intervocalically.
Table 4.3: Perceptibility comparisons in Experiment 4
[–voi] Spirants [–voi] Stops [+voi] StopsLabials f ∼ p ∼ b
Coronals T ∼ t ∼ dDorsals x ∼ k ∼ g
Cover Symbol S ∼ T ∼ D
Three talkers were recorded for Experiment 4. Talker 1 was a male native
speaker of Bulgarian and second-language speaker of English; talker 2 was a female
native speaker of German and second-language speaker of English; talker 3 was a
male native speaker of English and second-language speaker of German. Thus, for
talkers 1 and 2, [x] was a native phoneme and [T] a non-native phoneme with which
102

Table 4.4: Elicitation of stimuli for Experiment 4
Stimulus Orthography[aba] aba[ada] ada[aga] aga[apa] apa[ata] ata[aka] aka[afa] afa[aTa] aTa[axa] axa
they had some familiarity (as second-language speakers of English); for talker 3, [T]
was a native phoneme and [x] was non-native (but familiar from German). Talker
1 also had linguistic training. All three talkers were naıve to the purposes of the
experiment. Stimuli were presented to the talkers in a single block in IPA (see
table 4.4); before recording, the talkers and experimenter discussed the intended
pronunciation of each type of stimulus.
Selection of Stimuli
As was the case for Experiments 2 and 3, it is possible that the different
native segment inventories of the talkers who produced the stimuli for Experi-
ment 4 introduce bias that might influence the perceptual results. At least three
possibilities come to mind:
1. As in Experiments 2 and 3, the English- (and German-)speaking talkers
make use of a cue to the voicing distinction among stops that the Bulgarian-
speaking talker lacks: aspiration. Thus, the D ∼ T distinction might be
103

easier to discriminate for the English- and German-speaking talkers.
2. All of the consonants that were non-native for at least some talkers were
spirants ([T] and [x]). It is possible that the center of gravity or the intensity
of the frication noise in these segments differed by talker in ways that might
influence the perceptibility of the S ∼ T distinction.
3. As in Experiments 2 and 3, the vowels in the non-native stimuli may have
been distorted, thus introducing artificial cues to the relevant distinctions.
For each talker, 10 tokens of each stimulus were selected (except for talker 3’s
productions of [aTa], where only 8 tokens were viable). Tokens were selected as
follows:
1. All tokens with any obvious abnormality were excluded.
2. For the English and German speakers, the tokens of the [aTa] stimuli were
selected that had the shortest period of aspiration after the stop.
3. The F1 and F2 values of the remaining vowels were measured. For each
talker and place of articulation, the [aDa] and [aSa] tokens were chosen that
were closest to the [aTa] tokens for that speaker and place of articulation (as
measured by the formants of the first vowel), such that the first vowel for
the [aTa] tokens was not systematically closer to either those of the [aDa]
tokens or those of the [aSa] tokens.
Tokens were trimmed and amplitude-normalized as in Experiments 2 and 3.
Further acoustic characteristics of the stimuli are discussed below.
104

Participants
18 native speakers of English participated in the experiment; all were students
in undergraduate linguistics courses at the University of California, Santa Cruz.
Subjects received either monetary compensation or extra credit, depending on the
course. Six subjects were native speakers of a second language besides English:
subjects 2, 9, and 11 were native speakers of Spanish; subject 5 of Japanese;
subject 15 of Mandarin; and subject 17 of Cantonese. Separate analyses were
performed excluding these bilingual subjects; where the results for the subset of
monolingual subjects differs from the group as a whole, this is noted below.
Procedure
The experiment was run with E-Prime version 2.0 and a PST serial response
box. The instructions and procedure were the same as in Experiment 2. There
were three types of ‘same’ trials (D ∼ D, T ∼ T, and S ∼ S) and four types
of ‘different’ trials (D ∼ T, T ∼ D, S ∼ T, and T ∼ S). The practice session
in Experiment 4 lasted 3 minutes for all subjects, rather than terminating after
criterion had been reached as in Experiments 2 and 3. The entire experiment
lasted about 45 minutes.
4.3.2 Results
Acoustic Properties of the Stimuli
Unsurprisingly, as was the case for Experiments 2 and 3, there was a certain
amount of inter-talker variation in the stimuli used in Experiment 4. The follow-
ing discussion documents some differences among talkers that may have affected
105
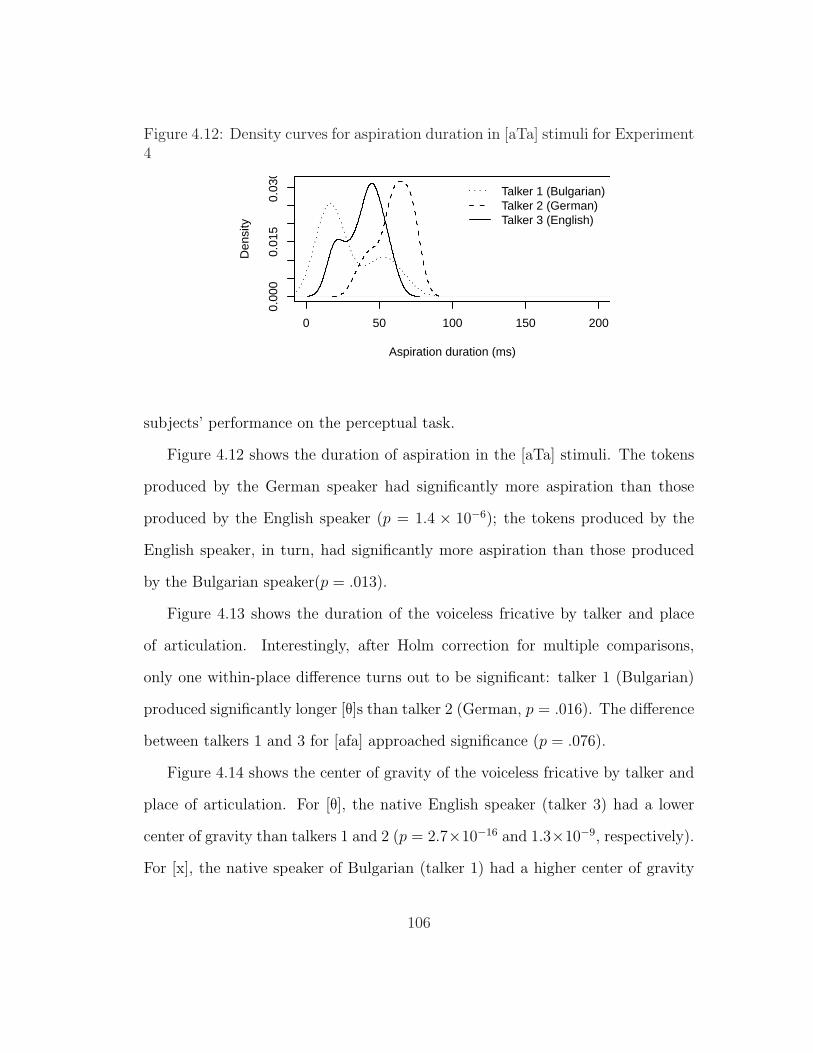
Figure 4.12: Density curves for aspiration duration in [aTa] stimuli for Experiment4
0 50 100 150 200
0.00
00.
015
0.03
0
Aspiration duration (ms)
Den
sity
Talker 1 (Bulgarian)Talker 2 (German)Talker 3 (English)
subjects’ performance on the perceptual task.
Figure 4.12 shows the duration of aspiration in the [aTa] stimuli. The tokens
produced by the German speaker had significantly more aspiration than those
produced by the English speaker (p = 1.4 × 10⁻⁶); the tokens produced by the
English speaker, in turn, had significantly more aspiration than those produced
by the Bulgarian speaker(p = .013).
Figure 4.13 shows the duration of the voiceless fricative by talker and place
of articulation. Interestingly, after Holm correction for multiple comparisons,
only one within-place difference turns out to be significant: talker 1 (Bulgarian)
produced significantly longer [T]s than talker 2 (German, p = .016). The difference
between talkers 1 and 3 for [afa] approached significance (p = .076).
Figure 4.14 shows the center of gravity of the voiceless fricative by talker and
place of articulation. For [T], the native English speaker (talker 3) had a lower
center of gravity than talkers 1 and 2 (p = 2.7×10⁻¹⁶ and 1.3×10⁻⁹, respectively).
For [x], the native speaker of Bulgarian (talker 1) had a higher center of gravity
106
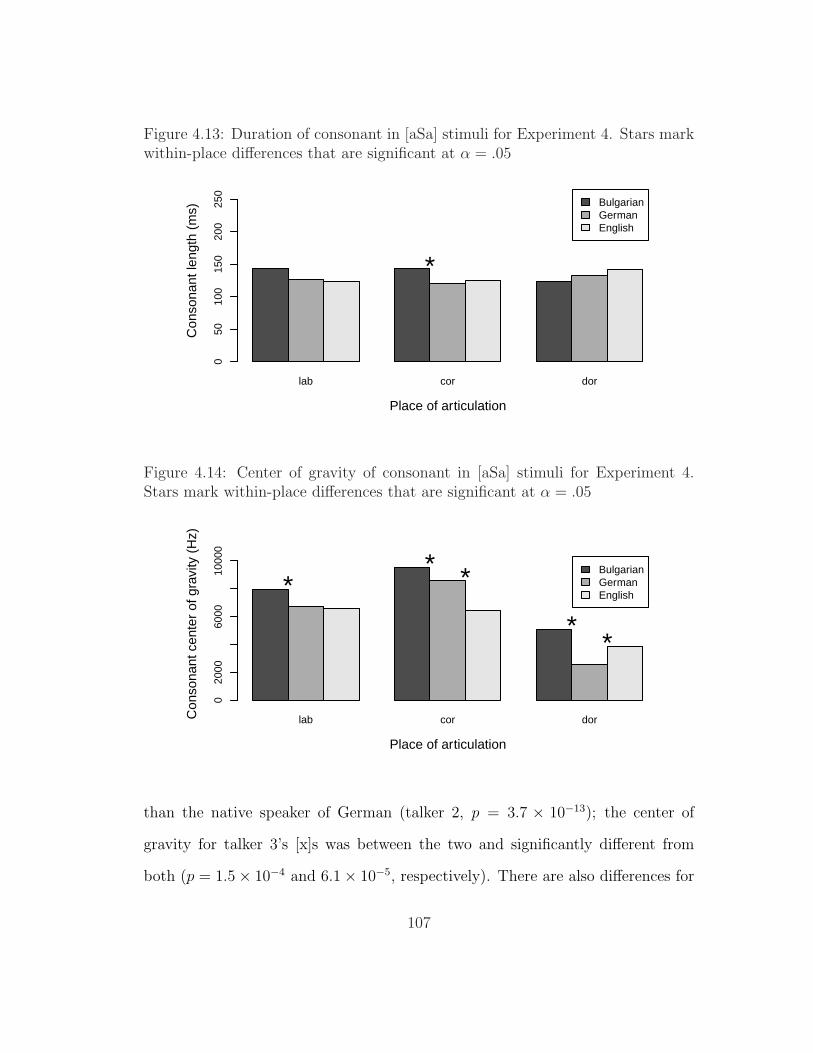
Figure 4.13: Duration of consonant in [aSa] stimuli for Experiment 4. Stars markwithin-place differences that are significant at α = .05
lab cor dor
BulgarianGermanEnglish
Place of articulation
Con
sona
nt le
ngth
(m
s)
050
100
150
200
250
*
Figure 4.14: Center of gravity of consonant in [aSa] stimuli for Experiment 4.Stars mark within-place differences that are significant at α = .05
lab cor dor
BulgarianGermanEnglish
Place of articulation
Con
sona
nt c
ente
r of
gra
vity
(H
z)
020
0060
0010
000
** *
**
than the native speaker of German (talker 2, p = 3.7 × 10⁻¹³); the center of
gravity for talker 3’s [x]s was between the two and significantly different from
both (p = 1.5× 10⁻⁴ and 6.1× 10⁻⁵, respectively). There are also differences for
107
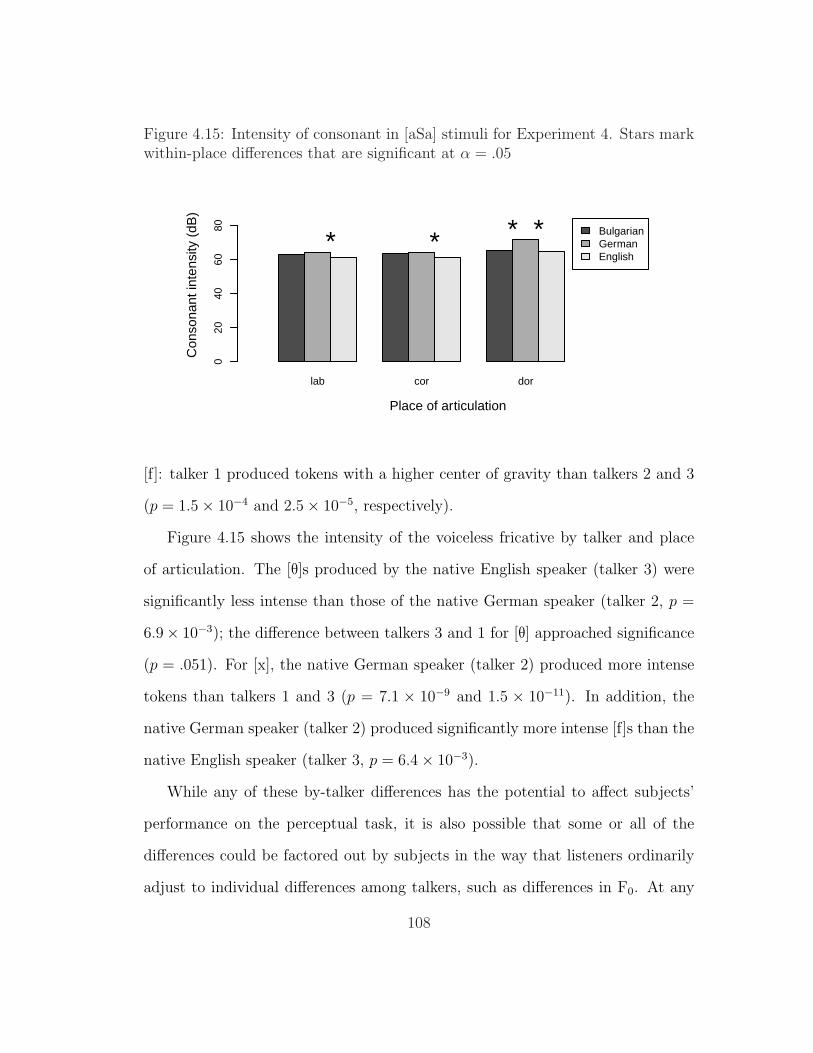
Figure 4.15: Intensity of consonant in [aSa] stimuli for Experiment 4. Stars markwithin-place differences that are significant at α = .05
lab cor dor
BulgarianGermanEnglish
Place of articulation
Con
sona
nt in
tens
ity (
dB)
020
4060
80
* * * *
[f]: talker 1 produced tokens with a higher center of gravity than talkers 2 and 3
(p = 1.5× 10⁻⁴ and 2.5× 10⁻⁵, respectively).
Figure 4.15 shows the intensity of the voiceless fricative by talker and place
of articulation. The [T]s produced by the native English speaker (talker 3) were
significantly less intense than those of the native German speaker (talker 2, p =
6.9× 10⁻³); the difference between talkers 3 and 1 for [T] approached significance
(p = .051). For [x], the native German speaker (talker 2) produced more intense
tokens than talkers 1 and 3 (p = 7.1 × 10⁻⁹ and 1.5 × 10⁻¹¹). In addition, the
native German speaker (talker 2) produced significantly more intense [f]s than the
native English speaker (talker 3, p = 6.4× 10⁻³).
While any of these by-talker differences has the potential to affect subjects’
performance on the perceptual task, it is also possible that some or all of the
differences could be factored out by subjects in the way that listeners ordinarily
adjust to individual differences among talkers, such as differences in F0. At any
108
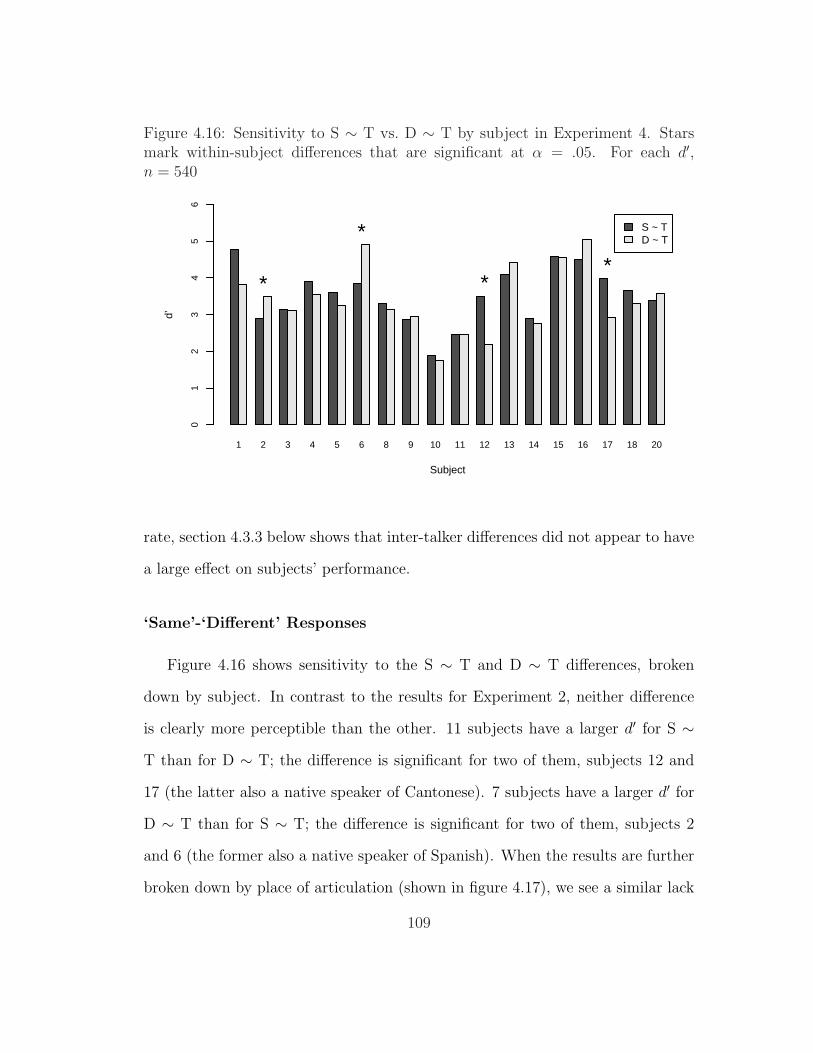
Figure 4.16: Sensitivity to S ∼ T vs. D ∼ T by subject in Experiment 4. Starsmark within-subject differences that are significant at α = .05. For each d′,n = 540
1 2 3 4 5 6 8 9 10 11 12 13 14 15 16 17 18 20
S ~ TD ~ T
Subject
d’
01
23
45
6
*
*
**
rate, section 4.3.3 below shows that inter-talker differences did not appear to have
a large effect on subjects’ performance.
‘Same’-‘Different’ Responses
Figure 4.16 shows sensitivity to the S ∼ T and D ∼ T differences, broken
down by subject. In contrast to the results for Experiment 2, neither difference
is clearly more perceptible than the other. 11 subjects have a larger d′ for S ∼T than for D ∼ T; the difference is significant for two of them, subjects 12 and
17 (the latter also a native speaker of Cantonese). 7 subjects have a larger d′ for
D ∼ T than for S ∼ T; the difference is significant for two of them, subjects 2
and 6 (the former also a native speaker of Spanish). When the results are further
broken down by place of articulation (shown in figure 4.17), we see a similar lack
109

Figure 4.17: Sensitivity to S ∼ T vs. D ∼ T by subject and place of articulationin Experiment 4. Stars mark within-subject and within-place differences that aresignificant at α = .05. For each d′, 194 ≤ n ≤ 213. Within each plot, the threepairs of bars are for labials, coronals, and dorsals (left to right), and the y-axismeasures d′
1
01
23
45
2
01
23
45 *
3
01
23
45
4
01
23
45
5
01
23
45
6
01
23
45
8
01
23
45
9
01
23
45
10
01
23
45
110
12
34
512
01
23
45 *
*
13
01
23
45
14
01
23
45
15
01
23
45
16
01
23
45
17
01
23
45
18
01
23
45
20
01
23
45
S ~ TD ~ T
of an overall pattern, and only three differences are significant. However, it is
interesting to note that for labials, the S ∼ T distinction is more salient than the
D ∼ T distinction for the majority of subjects, although it is significant only for
subject 12.
110
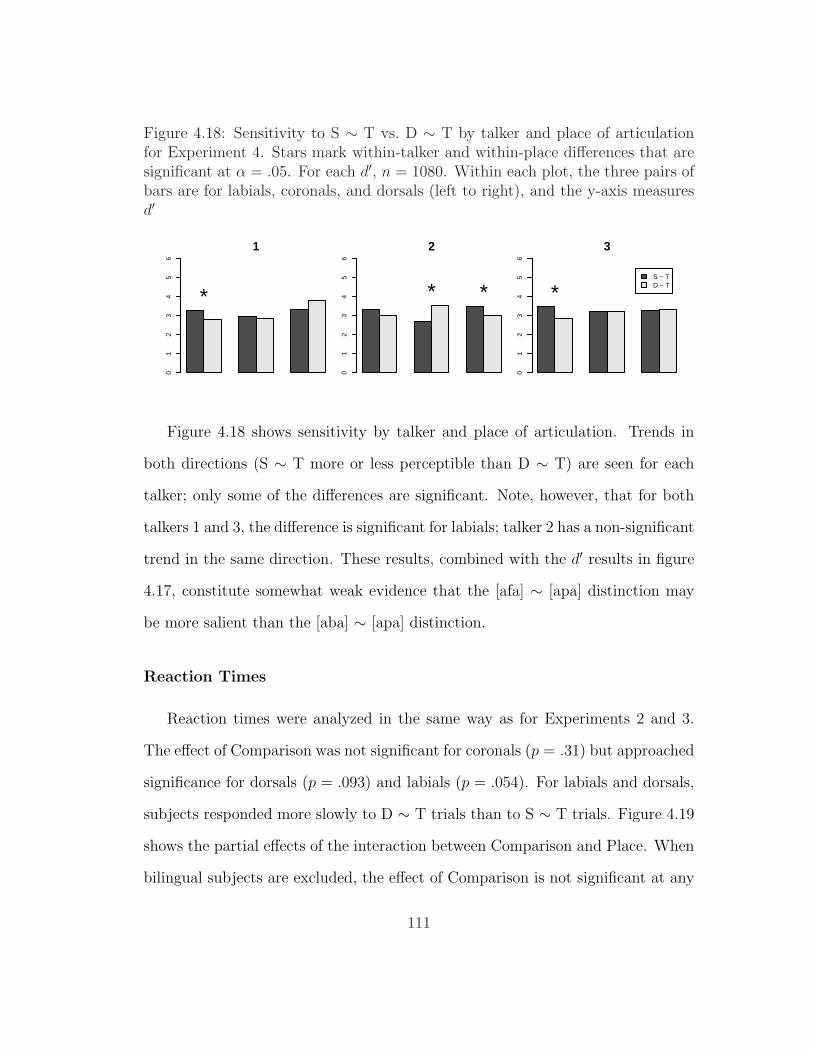
Figure 4.18: Sensitivity to S ∼ T vs. D ∼ T by talker and place of articulationfor Experiment 4. Stars mark within-talker and within-place differences that aresignificant at α = .05. For each d′, n = 1080. Within each plot, the three pairs ofbars are for labials, coronals, and dorsals (left to right), and the y-axis measuresd′
1
01
23
45
6
*
2
01
23
45
6
* *S ~ TD ~ T
3
01
23
45
6
*
Figure 4.18 shows sensitivity by talker and place of articulation. Trends in
both directions (S ∼ T more or less perceptible than D ∼ T) are seen for each
talker; only some of the differences are significant. Note, however, that for both
talkers 1 and 3, the difference is significant for labials; talker 2 has a non-significant
trend in the same direction. These results, combined with the d′ results in figure
4.17, constitute somewhat weak evidence that the [afa] ∼ [apa] distinction may
be more salient than the [aba] ∼ [apa] distinction.
Reaction Times
Reaction times were analyzed in the same way as for Experiments 2 and 3.
The effect of Comparison was not significant for coronals (p = .31) but approached
significance for dorsals (p = .093) and labials (p = .054). For labials and dorsals,
subjects responded more slowly to D ∼ T trials than to S ∼ T trials. Figure 4.19
shows the partial effects of the interaction between Comparison and Place. When
bilingual subjects are excluded, the effect of Comparison is not significant at any
111
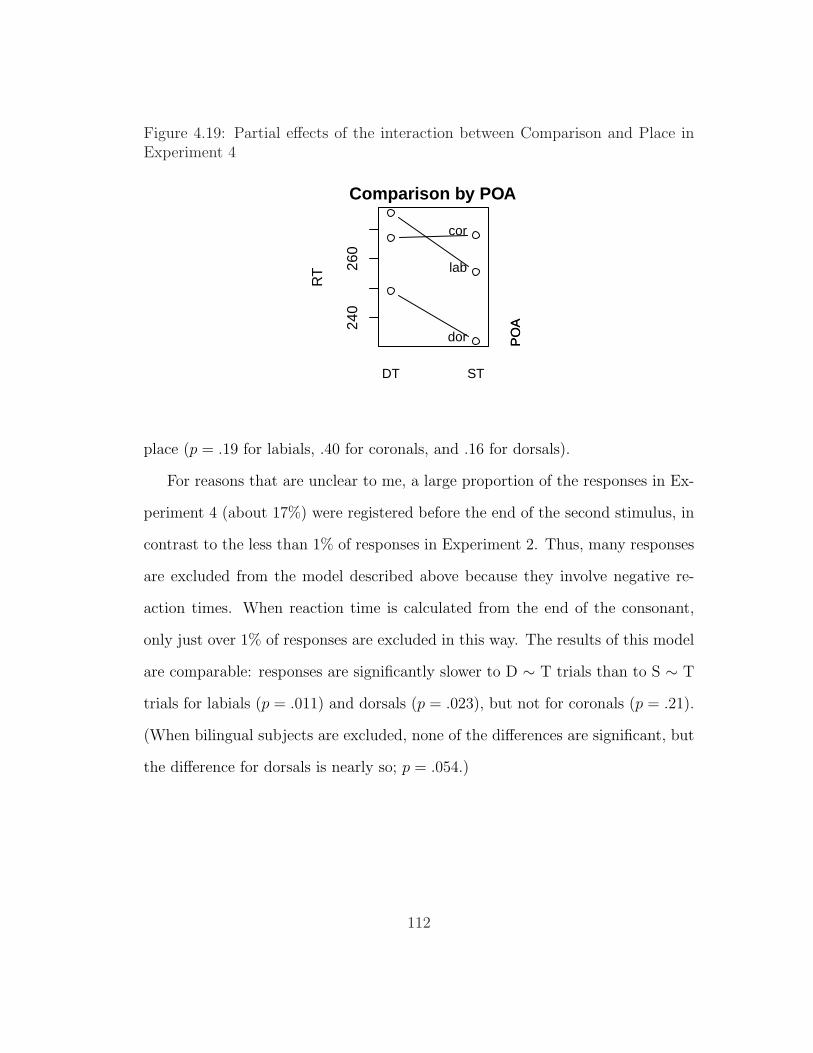
Figure 4.19: Partial effects of the interaction between Comparison and Place inExperiment 4
240
260
Comparison by POA
RT
DT ST
lab
PO
A
cor
PO
A
dor
place (p = .19 for labials, .40 for coronals, and .16 for dorsals).
For reasons that are unclear to me, a large proportion of the responses in Ex-
periment 4 (about 17%) were registered before the end of the second stimulus, in
contrast to the less than 1% of responses in Experiment 2. Thus, many responses
are excluded from the model described above because they involve negative re-
action times. When reaction time is calculated from the end of the consonant,
only just over 1% of responses are excluded in this way. The results of this model
are comparable: responses are significantly slower to D ∼ T trials than to S ∼ T
trials for labials (p = .011) and dorsals (p = .023), but not for coronals (p = .21).
(When bilingual subjects are excluded, none of the differences are significant, but
the difference for dorsals is nearly so; p = .054.)
112

4.3.3 Discussion
Overall Results
Unlike the results of Experiment 2, the results of Experiment 4 do not provide
strong evidence for a large difference in perceptibility by comparison type. Sub-
jects’ sensitivity as measured by d′ does not reveal a consistent difference between
the D ∼ T comparison and the S ∼ T comparison; about half of the subjects
have larger d′s for each comparison, and the differences are significant for only
a handful of subjects (some in each direction). However, there is some evidence
that the S ∼ T comparison is more salient than the D ∼ T comparison for labials;
the difference is significant for two of the three talkers, and 15 of the 18 subjects
have trends in this direction.
The reaction time data suggests that the D ∼ T distinction may have been a
bit more difficult for subjects to perceive than the S ∼ T distinction, especially
for labials and dorsals; reaction times are slightly slower to the former trials than
to the latter. However, the effect is much less robust than the difference by
comparison type for Experiment 2; the differences are sometimes significant and
sometimes not, depending on how reaction time is measured and which subjects
are analyzed – factors that did not affect the main result for Experiment 2.
This constellation of results suggests that although there is a difference in
perceptibility between the Z ∼ D and T ∼ D contrasts, there is no difference of
a comparable magnitude between the S ∼ T and D ∼ T contrasts. However, it is
possible that the lack of a robust result in Experiment 4 is due to its smaller sample
size: for example, the d′s in figure 4.16 are calculated from 540 observations each,
while those in figure 4.3 are calculated from at least 600. To determine whether
113

Figure 4.20: Sensitivity to Z ∼ D vs. T ∼ D by subject in a subset of data fromExperiment 2. Within-subject differences are non-significant at α = .05 only forsubject 1. For each d′, 474 ≤ n ≤ 488
1 3 4 5 6 7 8 9 10 11 12 13 15 16 17 18 19 20 21 22 23 25 26 27
Z ~ DT ~ D
Subject
d’
01
23
45
6
Experiment 4 simply lacked the power to detect a difference in perceptibility
as large as the one found in Experiment 2, I analyzed a random subset of the
data from Experiment 2. For each subject and trial type (Z ∼ Z, D ∼ D, T ∼T, Z ∼ D, and T ∼ D), I randomly selected 180 trials from Experiment 2 to
include in the subset (the same as the number of trials for each subject and trial
type in Experiment 48). Thus, this subset of data represents what the results of
Experiment 2 might have looked like if it had had the same power as Experiment
4. Figure 4.20 shows subjects’ sensitivity in this ‘smaller’ Experiment 2; for every
subject except subject 1, the difference between the Z ∼ D and T ∼ D comparison
types is still significant. I conclude that Experiment 4 had ample power to detect
a difference in perceptibility as large as the one found in Experiment 2.
8In many cases, there were fewer than 180 trials for a given subject and trial type in Exper-iment 2; in those cases, I included all of the relevant trials in the subset.
114
Effect of Acoustic Characteristics of Stimuli
In §4.3.2, I described four between-talker differences among the stimuli that
might have influenced subjects’ perception of the relevant contrasts: aspiration in
the [aTa] stimuli; and consonant duration, center of gravity, and intensity in the
[aSa] stimuli.
Greater aspiration in the [aTa] stimuli provides an extra cue to the voicing
distinction and therefore may increase the perceptibility of the D ∼ T contrast.
As shown in figure 4.12, the German- and English-speaking talkers produced more
aspiration than the Bulgarian-speaking talker. However, subjects do not differ in
sensitivity to the D ∼ T contrast for any of the three talkers (d′ = 3.0 for talker
1, 3.2 for talker 2, and 3.1 for talker 3; none of the differences are significant).
Alternatively, aspiration in the [aTa] stimuli might decrease the perceptibility of
the S ∼ T contrast if subjects are likely to misperceive aspiration as frication
noise or vice versa. However, the three talkers do not differ in sensitivity to the
S ∼ T contrast either (d′ = 3.2 for talker 1, 3.1 for talker 2, and 3.3 for talker
3; none of the differences are significant). Thus, it is unlikely that aspiration
(or lack thereof) among some talkers is masking an effect of comparison type in
Experiment 4.
As shown in figures 4.13 – 4.15, there are a number of differences among talkers
at each place of articulation in the duration, center of gravity, and intensity of the
voiceless fricatives; any of these differences has the potential to influence subjects’
ability to perceive the S ∼ T contrast. Among all three talkers and all three places
of articulation, there are only two cases in which two talkers differ significantly in
subjects’ sensitivity to the S ∼ T contrast at some place of articulation: subjects
115

are significantly less sensitive to the [aTa] ∼ [ata] contrast for talker 2 (d′ = 2.6)
than for either talker 1 (d′ = 3.0; p = .046) or talker 3 (d′ = 3.2; p = 2.0× 10⁻³).
This difference might be attributable to talker 2’s particularly short and intense
[T]s, although we cannot be certain.
It is possible, then, that the significant difference in sensitivity between [aTa]
∼ [ata] and [ada] ∼ [ata] that subjects exhibited for talker 2 is an anomaly.
If so, then the only remaining significant effects in figure 4.18 would be cases
where sensitivity to S ∼ T is smaller than sensitivity to D ∼ T, suggesting that
the latter truly is the more salient distinction. However, even eliminating this
significant effect would not eliminate all of the variability seen in the d′ results,
nor would it render the difference (if real) by comparison type large enough to be of
comparable magnitude to the one found in Experiment 2. Thus, talker-particular
characteristics of the voiceless fricatives in the [aSa] stimuli do not seem to be
masking a large overall effect of comparison type in Experiment 4.
Effect of English Consonant Inventory
On the basis of the English consonant inventory, we would expect there to be
an effect of comparison type among dorsals: subjects should be more sensitive
to the [aga] ∼ [aka] contrast (phonemic in English) than to the [axa] ∼ [aka]
contrast (since English lacks [x]). Interestingly, the results broken down by place
in figures 4.17 and 4.18 show no such effect. This lack of a result suggests that
the experimental task may have influenced subjects to tap into more fine-grained
phonetic differences and to be less influenced by their native inventory.9 Alterna-
9It is also possible that Experiment 4 lacked the power to detect a difference that was ac-tually present among dorsals. As discussed above, this experiment had ample power to detectdifferences of the magnitude found in Experiment 2; thus, any difference among dorsals that did
116

tively, subjects may have assimilated [x] to a native category other than [k] (Best
et al. 1988).
For labials and coronals, however, both comparison types are on equal foot-
ing: [p], [b], [f], [t], [d], and [T] are all phonemic in English. Any difference by
comparison type for labials or coronals must have been due to inherent differ-
ences in perceptibility between the continuancy and voicing contrasts (modulo
talker-specfic effects). No such consistent differences were found.
4.4 Discussion and Implications
The results of Experiment 2 show that the distinction between voiced and
voiceless stops intervocalically is perceptually more salient than the distinction
between voiced stops and spirants in the same environment. This finding suggests
that a perceptual account of the direction of lenition along the lines of the P-map
is viable: we could hypothesize that intervocalic devoicing is unattested because
intervocalic spirantization is perceptually a better (less salient) option.
The results of Experiment 4 show that there is no difference of a comparable
size in perceptibility between voiced and voiceless stops vs. voiceless stops and
fricatives intervocalically. This finding, too, is compatible with the P-map: voice-
less stops may undergo lenition either by voicing or by spirantization, because
neither alternation is perceptually superior to the other. (See §5.1 for a discus-
sion of the implications of a possible small difference in comparison type among
labials.)
The results of Experiment 3 show that for voiced stops, the difference in per-
not show up in the present results must be relatively small.
117

ceptibility between the continuancy and voicing distinctions is modulated by place
of articulation: the effect of comparison type is greater for dorsals, for example,
than it is for labials. If the implications of this perceptual fact for phonological
theory are analogous to those for the facts shown by Experiment 2, then we should
predict that spirantization of labials (a more salient change) implies spirantiza-
tion of dorsals (a less salient change, and therefore to be preferred). However,
as discussed in §2.2, this prediction is not borne out: if anything, spirantiza-
tion of labials is more common than spirantization of dorsals. Table 2.8 shows
that spirantization of labials does not imply spirantization of dorsals; there are
ten languages in the database that spirantize labials only (Apatani, Assamese,
Bashkir, Dahalo, Cardiff English, Kagate, Nepali, Nkore-Kiga, Ayt Seghrouchen
Tamazight Berber, and Chitwan Tharu).
Thus, Experiments 2 – 4 make some correct predictions with respect to phono-
logical typology and some incorrect ones. Chapter 5 discusses the implications of
these results for phonological theory.
118

Chapter 5
Implications for Phonology
This chapter investigates how the results of the previous experiments might
be incorporated into phonological theory. I adopt Optimality Theory (Prince and
Smolensky 2004[1993]) in order to facilitate comparison with the typology: from
its inception, OT has had as one of its explicit goals the ability to generate all and
only attested types of natural languages. Ideally, the ‘factorial typology’ of a given
set of constraints (that is, the set of all language types that can be generated by
some ranking of those constraints) should correspond exactly to the set of attested
language types.
5.1 Perception: Results of Experiments 2 – 4
5.1.1 The P-Map
As discussed in chapter 4, the P-map (Steriade 2001a,b) is a theory of the
relationship between the perceptibility of a given contrast and the ability of the
members of that contrast to alternate in a phonological pattern. Differences in
119

perceptibility are translated into universal rankings of OT faithfulness constraints
via the P-map, a database that encodes the relative perceptibility of various pairs
of contrasts in various environments. Faithfulness constraints are ranked according
to the perceptual distance between the underlying forms that they apply to and
the output forms that would result if they were violated, with constraints against
more perceptible changes to the underlying form ranked above constraints against
less perceptible changes.
In a strict interpretation, the P-map predicts that every difference in per-
ceptibility found in Experiments 2 – 4 should map to a ranking of faithfulness
constraints, and therefore to a gap in the typology (that is, the repairs corre-
sponding to the higher-ranked constraints should be unattested). The following
sections explore whether this prediction is confirmed.
5.1.2 Effects of Voicing and Manner
The main result of Experiment 2 was that the contrast between voiced and
voiceless stops is easier to perceive than the contrast between voiced stops and
voiced spirants. This fact translates into the following constraint ranking:
(1) Ident[+voi]/V[ , –cont]V ÀIdent[–cont]/V[ , +voi]V
Ident[+voi]/V[ , –cont]V requires faithfulness to an underlying [+voi] feature
for intervocalic noncontinuants. Similarly, Ident[–cont]/V[ , +voi]V requires
faithfulness to an underlying [–cont] feature for voiced segments. I use these highly
context-specific constraints in order to limit the domain of discussion to those
contexts for which Experiments 2 – 4 provide evidence; see §5.1.4 for discussion
120
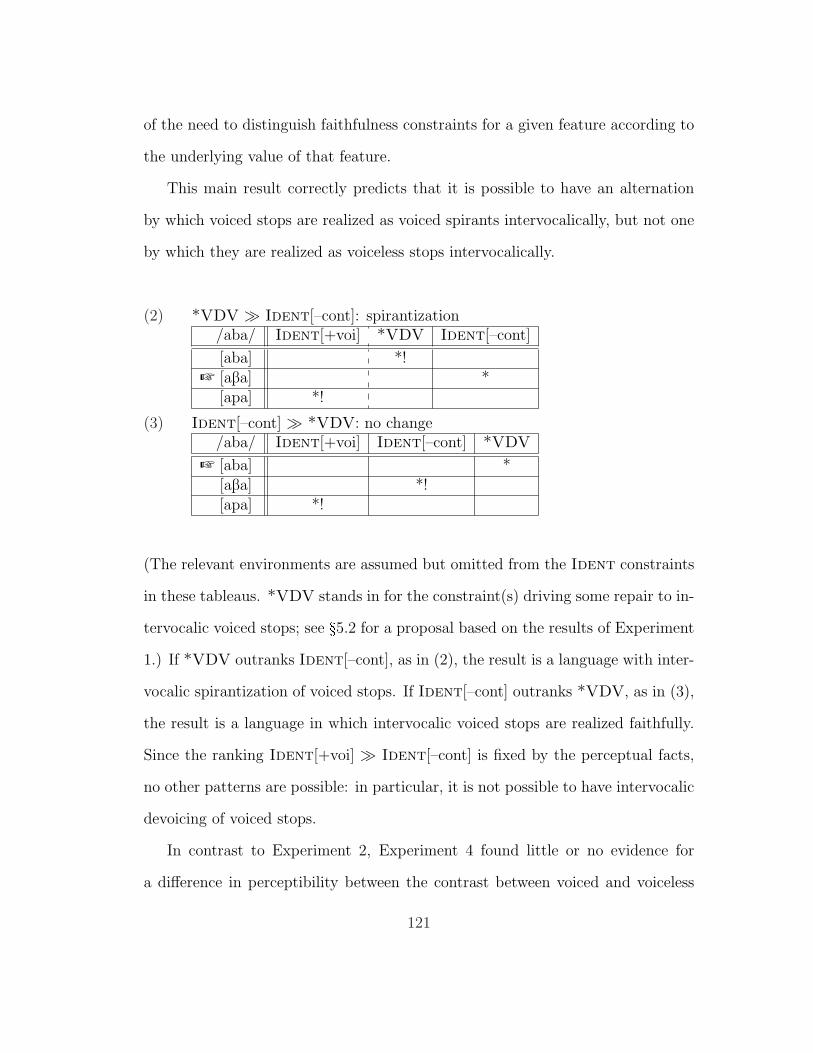
of the need to distinguish faithfulness constraints for a given feature according to
the underlying value of that feature.
This main result correctly predicts that it is possible to have an alternation
by which voiced stops are realized as voiced spirants intervocalically, but not one
by which they are realized as voiceless stops intervocalically.
(2) *VDV À Ident[–cont]: spirantization/aba/ Ident[+voi] *VDV Ident[–cont]
[aba] *!+ [aBa] *
[apa] *!
(3) Ident[–cont] À *VDV: no change/aba/ Ident[+voi] Ident[–cont] *VDV
+ [aba] *[aBa] *![apa] *!
(The relevant environments are assumed but omitted from the Ident constraints
in these tableaus. *VDV stands in for the constraint(s) driving some repair to in-
tervocalic voiced stops; see §5.2 for a proposal based on the results of Experiment
1.) If *VDV outranks Ident[–cont], as in (2), the result is a language with inter-
vocalic spirantization of voiced stops. If Ident[–cont] outranks *VDV, as in (3),
the result is a language in which intervocalic voiced stops are realized faithfully.
Since the ranking Ident[+voi] À Ident[–cont] is fixed by the perceptual facts,
no other patterns are possible: in particular, it is not possible to have intervocalic
devoicing of voiced stops.
In contrast to Experiment 2, Experiment 4 found little or no evidence for
a difference in perceptibility between the contrast between voiced and voiceless
121
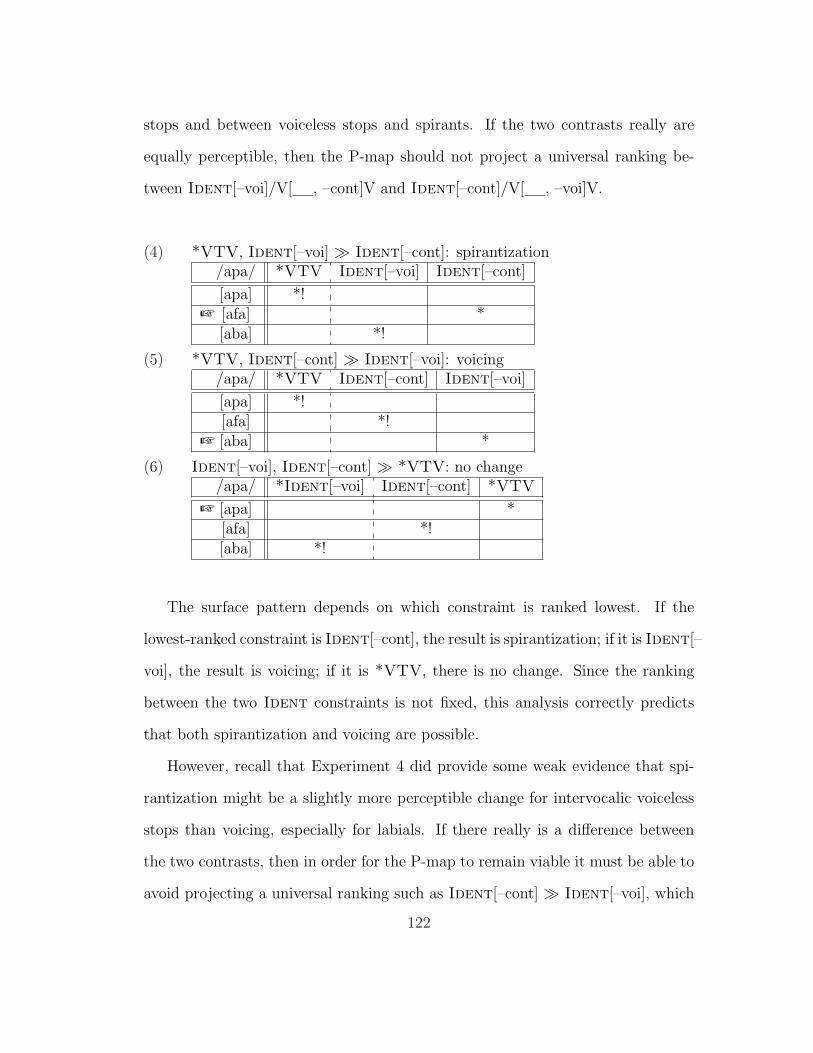
stops and between voiceless stops and spirants. If the two contrasts really are
equally perceptible, then the P-map should not project a universal ranking be-
tween Ident[–voi]/V[ , –cont]V and Ident[–cont]/V[ , –voi]V.
(4) *VTV, Ident[–voi] À Ident[–cont]: spirantization/apa/ *VTV Ident[–voi] Ident[–cont]
[apa] *!+ [afa] *
[aba] *!
(5) *VTV, Ident[–cont] À Ident[–voi]: voicing/apa/ *VTV Ident[–cont] Ident[–voi]
[apa] *![afa] *!
+ [aba] *
(6) Ident[–voi], Ident[–cont] À *VTV: no change/apa/ *Ident[–voi] Ident[–cont] *VTV
+ [apa] *[afa] *![aba] *!
The surface pattern depends on which constraint is ranked lowest. If the
lowest-ranked constraint is Ident[–cont], the result is spirantization; if it is Ident[–
voi], the result is voicing; if it is *VTV, there is no change. Since the ranking
between the two Ident constraints is not fixed, this analysis correctly predicts
that both spirantization and voicing are possible.
However, recall that Experiment 4 did provide some weak evidence that spi-
rantization might be a slightly more perceptible change for intervocalic voiceless
stops than voicing, especially for labials. If there really is a difference between
the two contrasts, then in order for the P-map to remain viable it must be able to
avoid projecting a universal ranking such as Ident[–cont] À Ident[–voi], which
122

would incorrectly predict that intervocalic voiceless stops may voice but not spi-
rantize. One solution might be to appeal to the fact that the difference between
the Z ∼ D and T ∼ D contrasts found in Experiment 2 was much larger than the
difference between S ∼ T and D ∼ T found in Experiment 4. Perhaps faithfulness
constraints are only projected when the difference in perceptibility between two
contrasts crosses some threshold; the difference between Z ∼ D and T ∼ D is
sufficiently large, but the difference between S ∼ T and D ∼ T is not. Although
plausible, this approach remains an ad-hoc solution until we find independent
evidence for such a threshold. The question of how to prevent the P-map from
overgenerating universal rankings among faithfulness constraints is taken up again
in §5.1.4.
For the sake of discussion, I will assume that there is no difference in per-
ceptibility between voicing and spirantization for underlying voiceless stops, but
I acknowledge that the data is somewhat equivocal on this point. Interestingly,
although both voicing and spirantization are attested alternations for intervocalic
voiceless stops, voicing seems to be the more common option: as shown in table
2.1, 26 languages in Gurevich’s (2004) database of lenition have voicing of voice-
less stops, while only 17 have spirantization of voiceless stops. (The difference,
however, is not significant; p = .18.) Perhaps differences in perceptibility that are
too small to be projected as universal rankings among faithfulness constraints are
still able to influence typological frequency. Indeed, it is possible that ‘hard’ typo-
logical patterns such as the absence of intervocalic devoicing are simply extreme
cases of the type of ‘soft’ tendency seen here. I leave this very interesting line of
investigation to future research.
123

5.1.3 Effect of Place of Articulation
Experiment 3 showed that the perceptibility of contrasts involving voiced and
voiceless stops or voiced stops and spirants interacts with place of articulation.
For the voicing contrast, the reaction time data presented in §4.2.2 suggests that
the difference between [b] and [p] intervocalically is the most difficult to perceive,
while the difference between [d] and [t] is the easiest. This fact translates into the
following ranking:
(7) Ident[–voi]/V[ , –cont, cor]V ÀIdent[–voi]/V[ , –cont, dor]V ÀIdent[–voi]/V[ , –cont, lab]V
If universal, this ranking predicts that intervocalic voicing can only apply to cer-
tain combinations of voiceless stops. If *VTV is undominated, then intervocalic
voicing applies across the board:
(8) *VTV ÀIdent[–voi]/V[ , cor]V,Ident[–voi]/V[ , dor]V,Ident[–voi]/V[ , lab]V:intervocalic voicing of labials, coronals, and dorsals
/apa/ /ata/ /aka/ *VTV Ident/[cor] Ident/[dor] Ident/[lab]
+ [aba] [ada] [aga] * * *[aba] [ada] [aka] *! * *[aba] [ata] [aga] *! * *[aba] [ata] [aka] *!* *[apa] [ada] [aga] *! * *[apa] [ada] [aka] *!* *[apa] [ata] [aga] *!* *[apa] [ata] [aka] *!**
124

If *VTV outranks only the Ident constraints for dorsals and labials, then
only /p/ and /k/ are subject to intervocalic voicing:
(9) Ident[–voi]/V[ , cor]V À*VTV ÀIdent[–voi]/V[ , dor]V,Ident[–voi]/V[ , lab]V:intervocalic voicing of labials and dorsals
/apa/ /ata/ /aka/ Ident/[cor] *VTV Ident/[dor] Ident/[lab]
[aba] [ada] [aga] *! * *[aba] [ada] [aka] *! * *
+ [aba] [ata] [aga] * * *[aba] [ata] [aka] **! *[apa] [ada] [aga] *! * *[apa] [ada] [aka] *! **[apa] [ata] [aga] **! *[apa] [ata] [aka] **!*
If *VTV outranks only the Ident constraint for labials, then only /p/ is
subject to intervocalic voicing:
(10) Ident[–voi]/V[ , cor]V,Ident[–voi]/V[ , dor]V À*VTV ÀIdent[–voi]/V[ , lab]V:intervocalic voicing of labials
125
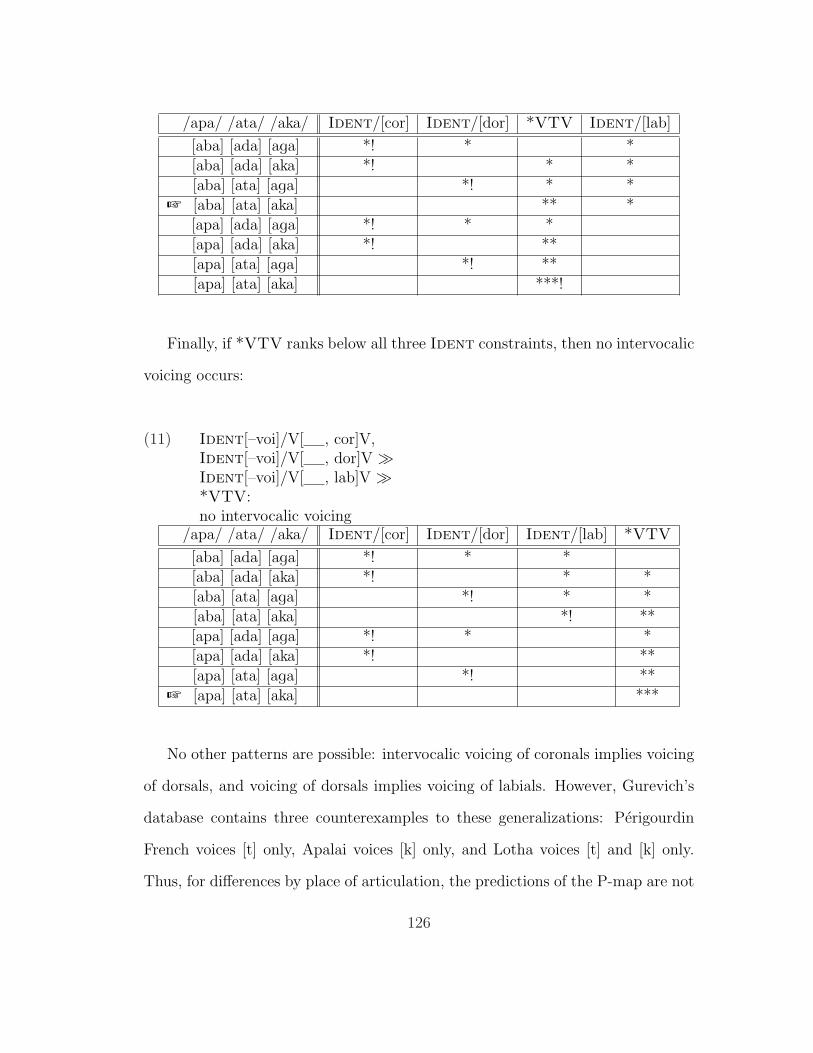
/apa/ /ata/ /aka/ Ident/[cor] Ident/[dor] *VTV Ident/[lab]
[aba] [ada] [aga] *! * *[aba] [ada] [aka] *! * *[aba] [ata] [aga] *! * *
+ [aba] [ata] [aka] ** *[apa] [ada] [aga] *! * *[apa] [ada] [aka] *! **[apa] [ata] [aga] *! **[apa] [ata] [aka] ***!
Finally, if *VTV ranks below all three Ident constraints, then no intervocalic
voicing occurs:
(11) Ident[–voi]/V[ , cor]V,Ident[–voi]/V[ , dor]V ÀIdent[–voi]/V[ , lab]V À*VTV:no intervocalic voicing
/apa/ /ata/ /aka/ Ident/[cor] Ident/[dor] Ident/[lab] *VTV
[aba] [ada] [aga] *! * *[aba] [ada] [aka] *! * *[aba] [ata] [aga] *! * *[aba] [ata] [aka] *! **[apa] [ada] [aga] *! * *[apa] [ada] [aka] *! **[apa] [ata] [aga] *! **
+ [apa] [ata] [aka] ***
No other patterns are possible: intervocalic voicing of coronals implies voicing
of dorsals, and voicing of dorsals implies voicing of labials. However, Gurevich’s
database contains three counterexamples to these generalizations: Perigourdin
French voices [t] only, Apalai voices [k] only, and Lotha voices [t] and [k] only.
Thus, for differences by place of articulation, the predictions of the P-map are not
126

borne out.
Experiment 3 also showed that for the continuancy contrast, the difference
between [g] and [G] intervocalically is the most difficult to perceive. This fact
translates into the following ranking:
(12) Ident[–cont]/V[ , lab]V,
Ident[–cont]/V[ , cor]V ÀIdent[–cont]/V[ , dor]V
As with intervocalic voicing, these differences by place make predictions about
possible patterns of intervocalic spirantization. If *VDV is undominated, then
intervocalic spirantization applies across the board:
(13) *VDV ÀIdent[–cont]/V[ , lab]V,Ident[–cont]/V[ , cor]V,Ident[–cont]/V[ , dor]V:intervocalic spirantization of labials, coronals, and dorsals
/aba/ /ada/ /aga/ *VDV Ident/[lab] Ident/[cor] Ident/[dor]
+ [aBa] [aDa] [aGa] * * *[aBa] [aDa] [aga] *! * *[aBa] [ada] [aGa] *! * *[aBa] [ada] [aga] *!* *[aba] [aDa] [aGa] *! * *[aba] [aDa] [aga] *!* *[aba] [ada] [aGa] *!* *[aba] [ada] [aga] *!**
If *VDV is dominated only by the Ident constraint for labials, then spiran-
tization applies only to /d/ and /g/:
127
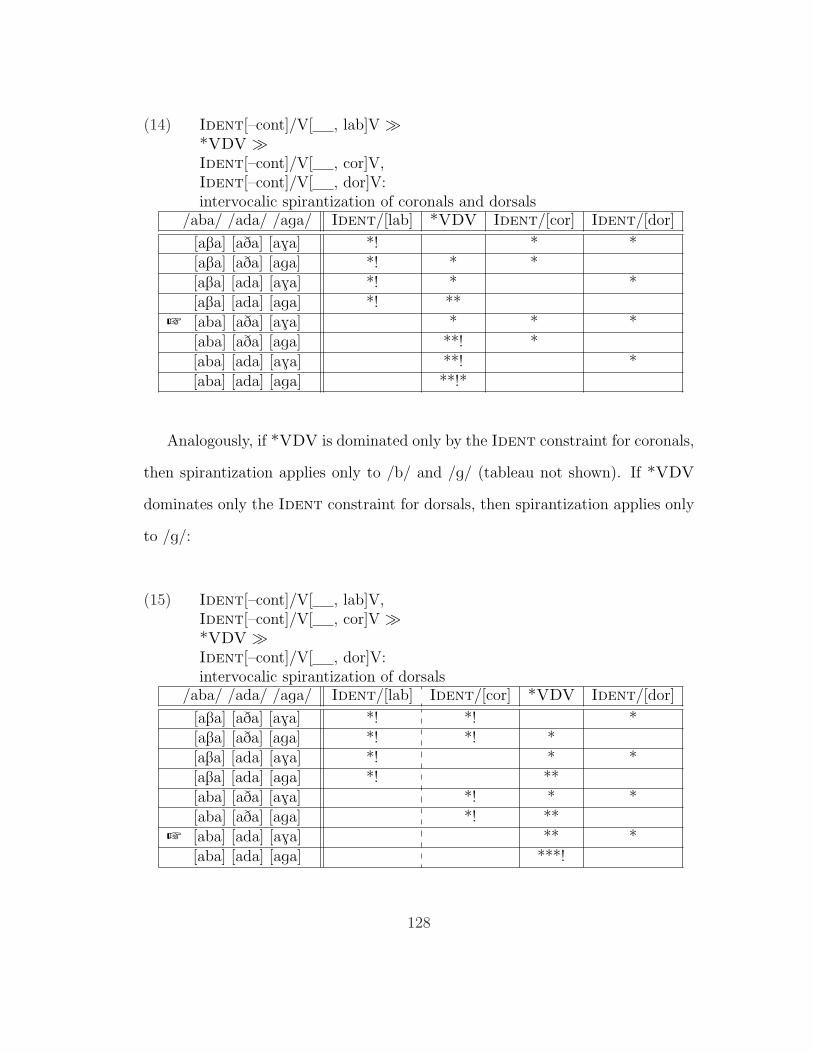
(14) Ident[–cont]/V[ , lab]V À*VDV ÀIdent[–cont]/V[ , cor]V,Ident[–cont]/V[ , dor]V:intervocalic spirantization of coronals and dorsals
/aba/ /ada/ /aga/ Ident/[lab] *VDV Ident/[cor] Ident/[dor]
[aBa] [aDa] [aGa] *! * *[aBa] [aDa] [aga] *! * *[aBa] [ada] [aGa] *! * *[aBa] [ada] [aga] *! **
+ [aba] [aDa] [aGa] * * *[aba] [aDa] [aga] **! *[aba] [ada] [aGa] **! *[aba] [ada] [aga] **!*
Analogously, if *VDV is dominated only by the Ident constraint for coronals,
then spirantization applies only to /b/ and /g/ (tableau not shown). If *VDV
dominates only the Ident constraint for dorsals, then spirantization applies only
to /g/:
(15) Ident[–cont]/V[ , lab]V,Ident[–cont]/V[ , cor]V À*VDV ÀIdent[–cont]/V[ , dor]V:intervocalic spirantization of dorsals
/aba/ /ada/ /aga/ Ident/[lab] Ident/[cor] *VDV Ident/[dor]
[aBa] [aDa] [aGa] *! *! *[aBa] [aDa] [aga] *! *! *[aBa] [ada] [aGa] *! * *[aBa] [ada] [aga] *! **[aba] [aDa] [aGa] *! * *[aba] [aDa] [aga] *! **
+ [aba] [ada] [aGa] ** *[aba] [ada] [aga] ***!
128

Finally, if *VDV is dominated by all three Ident constraints, no intervocalic
spirantization occurs at all:
(16) Ident[–cont]/V[ , lab]V,Ident[–cont]/V[ , cor]V,Ident[–cont]/V[ , dor]V À*VDV:no intervocalic spirantization
/aba/ /ada/ /aga/ Ident/[lab] Ident/[cor] Ident/[dor] *VDV
[aBa] [aDa] [aGa] *! *! *[aBa] [aDa] [aga] *! *! *[aBa] [ada] [aGa] *! * *[aBa] [ada] [aga] *! **[aba] [aDa] [aGa] *! * *[aba] [aDa] [aga] *! **[aba] [ada] [aGa] *! **
+ [aba] [ada] [aga] ***
No other patterns are possible. Because of the rankings fixed by the P-map,
spirantization of either labials or coronals implies spirantization of dorsals. Again,
though, this prediction does not match the typology. Gurevich’s database contains
14 languages with spirantization of labials but not dorsals (Apatani, Assamese,
Bashkir, Dahalo, Cardiff English, Kagate, Nepali, Nkore-Kiga, Ayt Seghrouchen
Tamazight Berber, and Chitwan Tharu) or coronals but not dorsals (Purki Balti,
Dahalo, Perigourdin French, and Purki). For intervocalic spirantization as well,
the predictions of the P-map are not confirmed.
129

5.1.4 Which Faithfulness Constraints Are Projected?
As originally formulated, the P-map appears to be intended to project univer-
sal rankings between faithfulness constraints automatically for every difference in
perceptibility between two contrasts:
For any two P-map cells, x – y/ Ki and w – z/ Kj, if x – y/ Ki
ã w – z/ Kj then any correspondence constraint referring to x –y/ Ki outranks any parallel constraint referring to w – z/ Kj.
Steriade (2001a, 28, emphasis added)
(‘ã’ denotes ‘is more perceptible than’. Parallel correspondence constraints are
faithfulness constraints regulating the relationship between the same two repre-
sentations – IO, OO, BR, etc.) As shown in the previous section, if we project
universal faithfulness constraints from all of the perceptual results of Experiments
2 – 4, the result is a mixed bag: we make some correct predictions (no intervocalic
devoicing) and some incorrect predictions (differences by place of articulation).
There are at least two ways to respond to this constellation of results:
1. Conclude that the theory of the P-map is ultimately incorrect. Those cases
where the P-map appears to make the correct predictions (such as final
devoicing) are due to chance.
2. Allow the database of perceptibility differences to project only rankings of
faithfulness constraints that match typological facts.
The P-map does appear to make correct predictions in a range of cases – in
addition to final devoicing, it has been applied to consonant cluster simplification
130

and epenthesis of [P] and [@] (Steriade 2001a), the directionality of consonant
assimilation (Steriade 2001b), the behavior of voicing in singleton and geminate
stops (Kawahara 2006), and laryngeal co-occurrence restrictions (Gallagher 2009).
Thus, it seems unwise to reject the P-map entirely until it is clear that a better
solution cannot be found.
In addition, restricting the constraint rankings that are projected by the
database of perceptibility differences seems desirable independent of these facts.
It is unlikely that every pair of possible changes to a given input should be asso-
ciated with a universal constraint ranking. For example, if we were to compare
the perceptibility of final devoicing to that of the alternations involved in vowel
harmony, it is entirely possible that we would find a difference – and yet the two
processes may occur independently. But restricting how constraints are projected
is a viable option only if we can find a principled way to do so: simply stipulating
that rankings that do not match the typology are not projected only restates the
problem. Determining what, if any, restrictions should be placed on how con-
straint rankings are projected is a project beyond the scope of this dissertation;
it ultimately requires us to compare the perceptibility of each possible change for
each possible input with every other possible change, and to match those results
to the typological facts. However, I will offer some preliminary discussion here,
based on the data at hand.
One way in which the universal rankings in (7) and (12) (those that yield
problematic predictions for by-place differences in lenition) are different from the
one in (1) (whose predictions are correct) is that the constraints within each of
the former sets do not apply to the same underlying segments. That is, one
constraint in each set applies to labial segments, another to coronal segments,
131

and another to dorsal segments. The original purpose of the P-map, however,
was to explain how languages choose among various possible repairs to the same
marked configuration. The universal ranking in (1) accomplishes this goal: for
a given intervocalic voiced stop, the ranking favors spirantization over voicing.
The rankings in (7) and (12), however, do not: because the segments to which
the constraints in each Ident family apply are disjoint, only one constraint in
each family may apply to a given underlying intervocalic voiced stop. Thus,
the rankings in (7) and (12) entail implicational relationships among repairs to
different marked configurations, rather than determining which repair is chosen
for a single marked configuration.
Therefore, to avoid the undesired rankings of (7) and (12), we might impose
a restriction on the projection of rankings from the P-map: a universal ranking
between two faithfulness constraints may only be projected if the two constraints
regulate competing repairs for the same markedness constraint for some string of
segments. Ident[+voi]/V[ ]V and Ident[–cont]/V[ ]V both regulate poten-
tial repairs to sequences that violate *VDV (devoicing and spirantization); there-
fore, the P-map can licitly project a universal ranking between the two. However,
the situation is different for the place-specific Ident constraints. There is no single
string of segments such that Ident[–cont]/V[ , lab]V and Ident[–cont]/V[ ,
cor]V represent two alternative pairs for the same markedness violation: the for-
mer applies only to intervocalic labials, while the latter applies only to intervocalic
coronals.1 Thus, the P-map cannot licitly project a universal ranking between the
two (or between any of the place-specific constraints considered above), and the
problematic rankings in (7) and (12) are ruled out.
1Leaving aside the treatment of segments with multiple places of articulation, e.g., labiovelars.
132
Clearly, more research is required to determine whether this approach is borne
out when we examine more types of repairs. In the meantime, it has the benefit of
making a principled distinction in this particular case between those predictions
of the P-map that appear to be correct and those that we should avoid.
Note that this restriction on the projection of rankings by the P-map also
requires that we distinguish among faithfulness constraints that regulate a given
feature on the basis of the underlying value of that feature; it is for this rea-
son that I distinguish between constraints such as Ident[+voi] and Ident[–voi].
Ident[+voi] regulates changes in voicing to underlyingly voiced stops (a possible
repair for violations of *VDV), while Ident[–voi] regulates changes in voicing to
underlyingly voiceless stops (a possible repair for violations of *VTV).
5.2 Production: Results of Experiment 1
5.2.1 Previous Models of Articulatory Effort
As noted in chapter 3, attempts to link articulatory effort and phonological
patterns are ubiquitous. This section reviews a sample of research that incorpo-
rates articulatory effort into formal phonological models. Note that the authors
whose work is reviewed here would probably not claim that their particular pro-
posals are the only or even the best way to account for articulatory effort; this
overview is meant only to be representative.
133

Pater, Hayes, and Kirchner
Pater (2004[1999]) documents a range of processes in several languages that
have the effect of eliminating a sequence of a nasal followed by a voiceless stop.
Working within Optimality Theory, he proposes a markedness constraint *NC˚
penalizing such sequences and notes that there is evidence that these sequences
should be articulatorily disfavored; in particular, Ohala and Ohala (1991, 2132)
argue that nasal leakage in the first part of the segment is compatible with voiced
stops but not voiceless ones.
Hayes (2004[1999]) investigates the status of stop voicing in a number of en-
vironments. He derives scores of articulatory effort from Westbury and Keating’s
(1986) aerodynamic model of the vocal tract and proposes an algorithm for gen-
erating markedness constraints that attempts to balance the need for constraints
to penalize difficult configurations with the need for constraints to be general
and maintain formal symmetry. The result is a set of constraints, including con-
straints against post-nasal and -sonorant voiceless stops, that correspond well to
cross-linguistic patterns of favored and disfavored structures.
Kirchner (2001b) develops a mass-spring model of the vocal tract that assigns
a difficulty to a given configuration based on the force exerted throughout the
relevant gestures in order to move the required articulators. He posits a Lazy
constraint penalizing structures that require more force relative to those that
require less force. Among other predictions, the model identifies geminates as more
effortful than singletons; thus, Lazy favors degemination. (Kirchner also identifies
intervocalic voiced stops as more effortful than their voiceless counterparts, using
the same aerodynamic model as Hayes.)
2The page number cited by Pater, 273, appears to be a typographical error.
134
In all three of these accounts, the basic approach involves comparing two mem-
bers of a phonological contrast (in a particular segmental context) and identifying
one member of the contrast as the one that requires more articulatory effort. Con
is assumed to contain at least one markedness constraint penalizing the more ef-
fortful configuration relative to the less effortful one. However, the results of
Experiment 1 do not provide a good match to this type of account. Recall that
the dominant pattern of that experiment was not one in which subjects favored
one member of a constrast over another (voiced vs. voiceless stops or stops vs. spi-
rants); rather, the common denominator across subjects and segment types was
a contraction of the articulatory space such that both members of a given opposi-
tion moved toward each other. Thus, at least for the segments and environments
examined in Experiment 1, articulatory effort minimization does not appear to
favor one member of a contrast over another. This pattern is unlike that of the
analyses of Pater, Hayes, and Kirchner.
Lindblom
Lindblom (1983) makes the case for a general principle of gestural economy
in speech, arguing for a wide range of phonetic and phonological patterns that
they can be viewed as involving articulatory effort reduction. He places a special
emphasis on articulator movement and proposes the mass-spring model developed
further by Kirchner (2001b) as a way of quantifying a positive correlation between
distance moved by a given articulator and effort expended.
In examining vowels, Lindblom reviews experimental evidence that formant
values are related to vowel duration: the shorter the vowel, the less likely it
is that its formants will reach their targets. Lindblom interprets this result as
135

reduction of the relevant gesture; when the vowel is short, there is less time for
the articulator to reach its target, and the result is gestural ‘undershoot’.
The results of Experiment 1 can be interpreted as consistent with Lindblom’s
proposal that effort reduction leads to gestural undershoot. It is a small step to
say that the compression of the articulatory space that was observed across sub-
jects and segment types is a case of undershoot: when subjects are intoxicated,
they are less able to execute the full articulatory movement required for a given
sound; as a result, extreme gestures of all types are reduced, and the differences
between contrasting sounds become smaller. However, the crucial factor deter-
mining the degree of undershoot in Experiment 1 is not duration of the relevant
segment;3 rather, most important is whether the subject was intoxicated. Indeed,
segments were simultaneously longer in the intoxicated condition and exhibited
more undershoot. Thus, while Lindblom’s articulatory undershoot seems to pro-
vide a good match to the pattern observed in intoxicated speech in Experiment
1, the particular factor he examines (segment duration) is clearly not the relevant
one here.
Flemming
Flemming (2002), in his development of Dispersion Theory, proposes three
basic and opposing forces that jointly determine the distribution of sounds in
a language: the desires to maximize the number of contrasts in a phonological
system, to maximize how auditorily distinct those contrasts are from one another,
and to minimize articulatory effort. Because his focus is on the role of perception,
3Lindblom himself acknowledges (1983; 1990) that segment duration is not the sole or eventhe most important determinant of whether undershoot occurs, at least in vowels.
136

he does not formalize any systematic hypotheses as to which segments require
more articulatory effort than others; however, he generally assumes (e.g., pg. 16)
that the closer a segment is to the periphery of the auditory space, the more
effort it requires. Like Lindblom’s (1983) proposal, Flemming’s is consistent with
the results of Experiment 1: intoxicated subjects exhibited contraction of the
articulatory space, avoiding extremes for all members of a given contrast.
Under Flemming’s account, a language will have segments near the edge of
the auditory space only if it must do so in order to maintain a contrast. For
example, if a language has a backness contrast for vowels, then its inventory
will contain both front vowels (like [i]) and back vowels (like [u]). However, if
a language does not have a backness contrast, then its vowels will be neither
front nor back, but central (like [1]), possibly subject to variation depending on
the segmental environment. This account correctly predicts that ‘vertical’ vowel
inventories, as in Kabardian (Gordon and Applebaum 2010), will involve central
vowels rather than front or back ones. Flemming accomplishes this by positing a
family of MinDist constraints that require distinct segments to be separated by
a certain amount in the auditory space. Since MinDist constraints only apply to
phonologically contrastive forms, there is no reason for forms that do not contrast
to occupy anything but the middle of the auditory space. Thus, the dispersion
(or lack thereof) of a given articulatory dimension is related to whether that
dimension is used to signal some phonological contrast.
To apply Dispersion Theory to the present results, we must say that intox-
ication promotes constraints banning ‘extreme’ articulatory gestures over some
MinDist constraints. This account requires that any auditory dimension that
exhibits contraction in the intoxicated condition must be used to signal some con-
137

trast. Otherwise, there would be no reason for segments to be dispersed along
that dimension in the first place; at most, we would see random dispersion due
to noisy implementation of the relevant gestures independent of any particular
contrast. All of the measurements tested in Experiment 1 showed contraction;
therefore, we predict that all of these dimensions are used to signal at least one
phonological constrast.
Table 5.1 shows the relationship in Experiment 1 between compression of var-
ious dimensions in the intoxicated condition and the use of those dimensions to
signal phonological contrast. A gray cell for a given subject and measurement
means that that subject exhibited compression along that dimension. A short
line segment in the cell denotes a significant difference for some contrast along
the dimension in question. A horizontal line means that there is a significant
difference between voiced and voiceless stops for that dimension. A vertical line
indicates some significant difference by place for that dimension: a line on the
left shows a contrast between labials and coronals, a line in the center a contrast
between labials and dorsals, and a line on the right a contrast between coronals
and dorsals.4 For significant differences by voicing or place, Holm’s correction
for multiple comparisons was applied within, but not across, rows (separately for
voicing and for place).
A naıve application of Dispersion Theory to Experiment 1 would expect to see
two types of cells in table 5.1: cells with both compression and a significant cue
to contrast, and cells with neither compression nor a significnat cue to contrast.
Cells with compression but no contrast, or vice versa, are unexpected. However, as
4The position of these lines for place of articulation is meant to be iconic. In a mid-saggitalsection of the oral tract viewed from the left, the front of the mouth is on the left and the backis on the right.
138
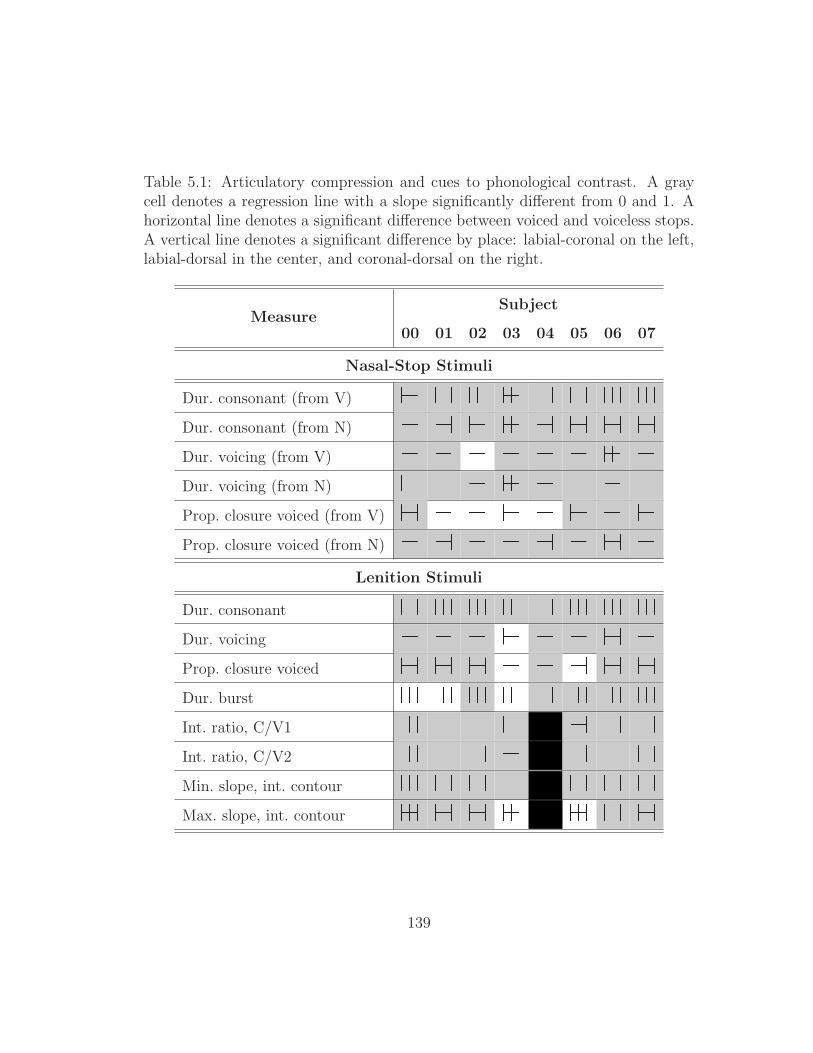
Table 5.1: Articulatory compression and cues to phonological contrast. A graycell denotes a regression line with a slope significantly different from 0 and 1. Ahorizontal line denotes a significant difference between voiced and voiceless stops.A vertical line denotes a significant difference by place: labial-coronal on the left,labial-dorsal in the center, and coronal-dorsal on the right.
MeasureSubject
00 01 02 03 04 05 06 07
Nasal-Stop Stimuli
Dur. consonant (from V) H� HL HM HM� HML HL HML HML
Dur. consonant (from N) � L� H� HM� HL� HL� HL� HL�
Dur. voicing (from V) � � � � � � HM� �
Dur. voicing (from N) H � HM� � �
Prop. closure voiced (from V) HL� � � H� � H� � H�
Prop. closure voiced (from N) � L� � � L� � HL� �
Lenition Stimuli
Dur. consonant HL� HML� HML� HML� HML� HML� HML� HML�Dur. voicing � � � H� � � HL� �Prop. closure voiced HL� HL� HL� � � L� HL� HL�
Dur. burst HML ML� HML� HM� HML� ML� ML� HML�
Int. ratio, C/V1 ML H L� L L
Int. ratio, C/V2 ML L � L HL
Min. slope, int. contour HML� HL� HL� � HL� HL HL�
Max. slope, int. contour HML� HL� HL� HM� HML� HL HL�
139
the table shows, both of these unexpected cases are in fact attested. (In addition,
there are no cells with neither compression nor a significant contrast!) Let us
consider the two types of unexpected cases in turn.
As discussed above, a dimension that shows compression but is not used to
signal phonological contrast is unexpected because, if it is irrelevant to contrast,
there is no reason for values along the dimension to be dispersed in the first place.
There are seven cases of this type in table 5.1, for three auditory dimensions: the
duration of voicing in nasal-stop stimuli as measured from the end of the nasal,
the intensity of the consonant in lenition stimuli relative to the preceding vowel,
and the intensity of the consonant in lenition stimuli relative to the following
vowel. These examples may run counter to the most straightforward implications
of Dispersion Theory, but we should not press them too far: after all, it is en-
tirely possible that the differences in these cases were too small to be detected by
Experiment 1, or that the dimensions in question are in fact used to signal some
contrast other than voice or place. For the intensity of the consonant in lenition
stimuli, it seems quite likely that we would find significant differences between
sonorants and obstruents – a difference not seen here since all of the target conso-
nants in Experiment 1 were obstruents. As for voicing duration in the nasal-stop
stimuli, it is surprising that this dimension does not at least cue the voicing con-
trast! However, statistical power is a real concern for this measure; recall that a
separate nasal could not be identified for all tokens.
A dimension that does not show compression but does signal contrast is unex-
pected because it would show that articulatory effort reduction does not apply to
every dimension, or does not apply to every dimension to the same degree. Table
5.1 shows thirteen such cases, scattered across a range of dimensions and subjects.
140
Certainly, Dispersion Theory is compatible with the idea that the articulatory ef-
fort required to disperse sounds is different along different dimensions; or that
intoxication affects various dimensions differently, interfering with dispersion for
some dimensions but not for others. These cases, then, are like the previous group
in being at least theoretically consistent with a Dispersion-Theoretic model, but
not explained by it.
5.2.2 What Makes a Sound ‘Effortful’?
As discussed in §3.1, and demonstrated by this brief survey, the literature con-
tains many different views on what it is that makes a given segment (or sequence
of segments) articulatorily ‘effortful’. Many proposals appeal to biomechanical
properties of the gestures involved: a sound is more effortful if the relevant articu-
lator moves farther (Lindblom 1983) or faster (Uchanski 2005, 226), if it must be
sustained or is ‘tense’ (Padgett 2009, 440), if it requires precise execution (Lavoie
2001, 166), or if is relatively ‘unstable’ when combined with the other gestures
required for the sequence (Pouplier 2003). Kirchner’s (2001a) mass-spring model
attempts to combine several of these ideas; here, effort is defined as the total
force exerted throughout a gesture; gestures that move faster or farther, that are
longer, or that require several applications of force in order to maintain a precise
position all require more total force than gestures that do not. In addition to these
proposals, which focus primarily on the oral articulators, Westbury and Keating
(1986), Ohala and Ohala (1991), and Hayes (2004[1999]) note the importance of
aerodynamic considerations, especially for voicing.
I emphasize again that the results of Experiment 1 do not shed light on the
141

question of why particular productions are effortful. Rather, the goal of Experi-
ment 1 was to determine, if possible, which productions are more effortful than
others; indeed, this is a necessary first step, since we cannot explain the relative
difficulty of different productions if we do not know for certain what their relative
difficulty is! Since alcohol affects the body in many ways (see §3.2), several of the
above-mentioned hypotheses about articulatory difficulty could explain reduction
induced by intoxication. For example, subjects might not be able to move their
articulators as far or as fast, due to the overall depressive effect of alcohol; cogni-
tive impairment might interfere with subjects’ ability to maintain precise gestures
or coordinate several gestures simultaneously.
5.3 Putting It All Together
This section offers a unified OT analysis of intervocalic spirantization and
voicing that is faithful to the experimental results in the various ways discussed
above. This proposal is not meant to be definitive, but rather illustrative. The
most important result of this dissertation (especially Experiment 1) is that, when
analyzing lenition, we can no longer do ‘phonology as usual’ – that is, Experiment
1 provides no support for constraints that simply favor the lenited form over the
unlenited form. The following discussion illustrates what an analysis might have to
look like in order to account for patterns like these without relying on constraints
that simply say, “Lenite!”
142

5.3.1 Analysis of Intervocalic Lenition
I argued in §5.2.1 that of extant proposals in the literature for modeling artic-
ulatory effort, Dispersion Theory (Flemming 2002; Padgett 2003; Nı Chiosain and
Padgett 2009; Padgett 2009)5 is the closest match to the results of Experiment
1. The following analysis is therefore set within that framework. Dispersion The-
ory makes use of constraints that evaluate entire systems rather than individual
forms; this is necessary because the theory explicitly controls systemic properties
such as the phonetic distance between contrasting categories and the number of
categories that contrast. Thus, the inputs and the candidates in a Dispersion-
Theoretic analysis are idealized sets of forms rather than individuals.
Under my analysis, lenition occurs when effort reduction (represented by a
high-ranking markedness constraint) encourages compression of some phonetic
dimension (such as voicing), but compression is prevented by another markedness
constraint that requires contrasting categories to be sufficiently dispersed along
that dimension. To satisfy both constraints, one of two things must happen:
either the contrast along that dimension collapses, or one of the two categories
lenites by moving along a perpendicular dimension (such as continuancy). In
other words, if articulatory effort reduction squeezes the voicing dimension for
stops enough, either /p/ and /b/ will merge or one of the two will pop out of the
dimension, becoming a spirant. Figure 5.1 sketches how the basic idea applies to
spirantization; the constraints named in the figure are discussed in more detail
below.
Note that this account requires the grammar to be able to refer to, and regu-
5See also Boersma and Hamann (2008) for a similar analysis which assumes that peripheralproductions are articulatorily difficult.
143

Figure 5.1: Sketch of analysis of spirantization
-
*Per
p ¾ -
MinDist
b ¾
*Per
?
B
late, subphonemic differences within categories. For example, if [b] lenites to [B]
because effort reduction encourages its voicing value to decrease just slightly –
bringing it a little too close to [p] but not making it a different category – then
constraints must be able to refer to more fine-grained differences in voicing dura-
tion than are provided by categories that are known to contrast, such as [p] and
[b]. My solution (which, again, I view as preliminary and not definitive) is to
have inputs consist of discrete categories – as a first approximation, the categories
defined by IPA symbols. Outputs, on the other hand, specify those categories
for more fine-grained phonetic detail. Thus, while an input might contain the
segment /b/, an output might contain a segment [b] with 50 ms of voicing.
I also make the simplifying assumption that the boundaries of the phonetic
space, both its extreme edges and its internal category divisions, are determined
by Gen. For example, I assume below that a stop can have between 0 and 60 ms
of voicing, and that a voiceless stop is one with less than 20 ms of voicing and
a voiced stop has more than 20 ms of voicing. (These values correspond roughly
to the behavior of the majority of subjects in Experiment 1.) This is obviously
a simplification: not only is there variation between subjects with respect to the
144
amount of voicing they produce for different stops, but also within subjects the
distributions of voicing values for voiced and voiceless stops overlap. One way to
account for this inter- and intra-subject variation would be to put these boundaries
under the control of constraints.
My analysis uses the following constraints:
� *Merge requires forms that contrast in the input to contrast in the output.
Individual input and output forms are linked by a correspondence relation
separate from the one that links individual segments. In the tableaux below,
corresponding forms are indicated with capital letters when the correspon-
dence is not obvious.
� MinDist constraints require that forms that contrast for a certain feature
be separated on the relevant phonetic dimension by a certain distance. Usual
practice in Dispersion Theory is to divide the phonetic space into a relatively
small number of discrete units, usually corresponding to attested phonemic
categories (Flemming 2002; Nı Chiosain and Padgett 2009), and posit a cor-
responding family of universally ranked MinDist constraints. For example,
suppose F1 is divided into five abstract parts corresponding to the heights
of [i], [I], [e], [E], and [æ]. Then MinDist[F1][4] requires that any two vowels
contrasting in height be separated by at least 4 units in the F1 space; this
constraint would be satisfied by a contrast between [i] and [æ], but by no
other pair of front vowels. MinDist[F1][3] is less strict, requiring a dis-
tance of only 3 units, and is satisfied by pairs such as [i] and [E]. MinDist
constraints are usually assumed to be universally ranked from least to most
strict; however, since these constraints are in a strigency relationship, this
145
is not strictly necessary (de Lacy 2002).
Rather than dividing the phonetic space into a small number of abstract
categories, the MinDist constraints below refer directly to phonetic dimen-
sions. Thus, MinDist[voi][60ms] requires that segments that contrast for
[voice] have voicing durations that are at least 60 ms apart.
� On the basis of the results of Experiment 1, I posit a family of *Periphery
constraints that penalize forms that are too close to the periphery of the
phonetic space. Like the MinDist constraints, *Periphery constraints
refer directly to dimensions; thus, *Periphery[voi][5ms] is violated by any
stop with less than 5 ms or more than 55 ms of voicing.
� Clements (2003) argues that languages tend to prefer inventories in which a
relatively large number of segments is described by a relatively small number
of features; he terms this tendency “feature economy”. Although his pro-
posal is focused on phonological features, he presents some evidence (325-
326) that a similar principle of “gestural economy”, which encourages reuse
of a small number of articulatory gestures, operates independently. In a
related vein, Ussishkin and Wedel (2003) argue that speakers of a given
language have a repertoire of gestural “molecules” which shape the degree
to which loanwords are modified to fit the phonotactics of the borrowing
language.
In the spirit of gestural economy, I posit a family of Match constraints that
require two instances of the same segment in different contexts to have the
same value along a given phonetic dimension (within some margin of error).
For example, Match[voi][3ms] assigns one violation to every candidate in
146
which there are two instances of the same segment (e.g., [p]) with voicing
durations that are different by more than 3 ms.
� The analysis below also uses the Ident constraints discussed in §5.1, which
are evaluated in more or less the usual way. As in §5.1, I restrict these Ident
constraints to intervocalic segments. I also employ Ident[–cont]/# , a
positional faithfulness constraint that applies only word-initially (Beckman
2004[1998]).
The tableau in (17) illustrates how this constraint set can derive intervocalic
spirantization by imposing restrictions on the voicing dimension. The idealized
inventories show the behavior of the full cross-classification of consonants for voic-
ing (voiced vs. voiceless), continuancy (stop vs. spirant), and position (initial vs.
intervocalic). I assume that by richness of the base, the input contains all eight
possibilities.
The winning candidate, (d), has spirantization of voiced stops intervocalically.
The fully faithful candidate (a) loses because it has four violations of *Periph-
ery[voi][5ms]: while (a) has four stops at the edges of the voicing space, (d) has
only three, since [b] does not appear intervocalically on the surface. *Periphery
must outrank both Ident[–cont] and *Merge, or else (d) would lose, either be-
cause it changes the continuancy value of underlying intervocalic /b/ or because
it eliminates the contrast between /aba/ and /aBa/.
147
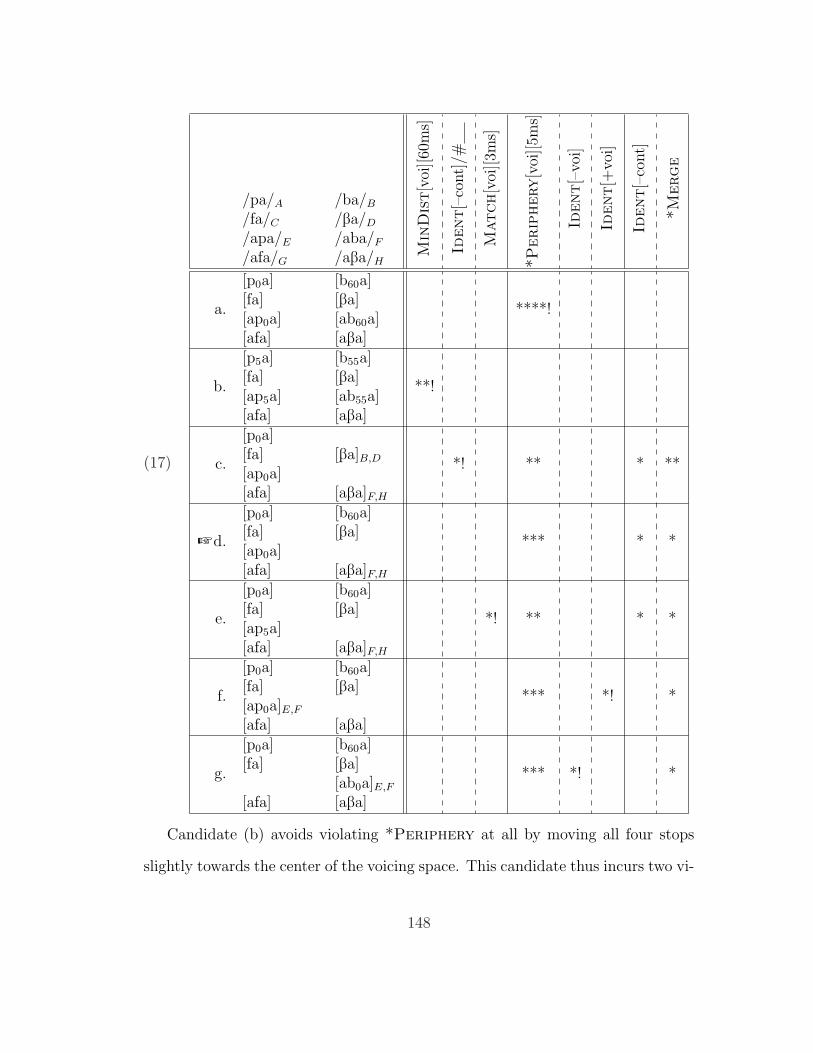
(17)
Min
Dis
t[v
oi][60
ms]
Ident[–
cont]
/#
Match[v
oi][3m
s]
*Perip
hery[v
oi][5m
s]
Ident[–
voi]
Ident[+
voi]
Ident[–
cont]
*M
erge
/pa/A /ba/B
/fa/C /Ba/D
/apa/E /aba/F
/afa/G /aBa/H
a.
[p0a] [b60a]
****![fa] [Ba][ap0a] [ab60a][afa] [aBa]
b.
[p5a] [b55a]
**![fa] [Ba][ap5a] [ab55a][afa] [aBa]
c.
[p0a]
*! ** * **[fa] [Ba]B,D
[ap0a][afa] [aBa]F,H
+d.
[p0a] [b60a]
*** * *[fa] [Ba][ap0a][afa] [aBa]F,H
e.
[p0a] [b60a]
*! ** * *[fa] [Ba][ap5a][afa] [aBa]F,H
f.
[p0a] [b60a]
*** *! *[fa] [Ba][ap0a]E,F
[afa] [aBa]
g.
[p0a] [b60a]
*** *! *[fa] [Ba]
[ab0a]E,F
[afa] [aBa]
Candidate (b) avoids violating *Periphery at all by moving all four stops
slightly towards the center of the voicing space. This candidate thus incurs two vi-
148
olations of MinDist[voi][60ms]: both word-initially and intervocalically, the stops
distinguished by voicing are too close together in the phonetic space. MinDist
must therefore outrank *Periphery (which the winner (d) does violate) in addi-
tion to Ident[–cont] and *Merge. The failure of candidates (a) and (b) demon-
strates the squeezing of the voicing dimension in this analysis: *Periphery re-
quires more compression of the voicing dimension than MinDist will allow.
Candidate (c) avoids two of the four violations of *Periphery incurred by
the fully faithful candidate by spirantizing all of its voiced stops; thus, only [p]
remains to violate *Periphery. However, this candidate is eliminated by a fatal
violation of Ident[–cont]/# : positional faithfulness at the beginning of the
word is more important than avoiding a word-initial [b] at the periphery of the
voicing space. Ident[–cont]/# must outrank *Periphery. (Candidate (c)
also does worse than (d) on *Merge; however, we know from candidates (a) and
(b) that this constraint ranks below *Periphery. Thus, the fatal violation of (c)
must come from Ident[–cont]/# .)
An alternative way to eliminate candidate (c) would be to apply *Periphery
only to intervocalic stops; in that case, candidates (c) and (d) would each vio-
late *Periphery once, and the winner (d) would harmonically bound (c). The
rationale for this restriction would be that Experiment 1, like Experiments 2 –
4, investigated only intervocalic segments; thus, the intervocalic environment is
the only one for which we have evidence of the ‘X-pattern’. However, there are
hints that articulatory compression is not limited to the intervocalic environment;
although final voicing was not systematically manipulated in Experiment 1, §3.3.3
notes that the ‘X-pattern’ seems to be present for the voicing of the [d] of said in
the frame sentence as well. Thus, I apply *Periphery to all segments, regardless
149

of environment; but restricting *Periphery would not affect the main point of
the present analysis.
Candidate (e) attempts to satisfy both *Periphery and MinDist by spi-
rantizing intervocalic /b/ and adding a small amount of voicing to intervocalic
/p/: since intervocalic [b] no longer surfaces, [p] can move towards the middle of
the voicing space without violating MinDist. However, with voicing added to
intervocalic [p], the two [p]s in candidate (e) no longer have the same amount of
voicing, thus violating Match[voi][3ms]. With Match ranked above *Periph-
ery, candidate (e) loses.
Note that without Match, candidate (e) would harmonically bound candi-
date (d): the two candidates perform identically on all other constraints except
*Periphery, where (e) does better. Indeed, if we assume that there is a whole
family of *Periphery constraints requiring various distances from the edge of
the voicing space, then both candidates would be harmonically bounded by one
in which intervocalic [p] has 20 ms of voicing (the closest a voiceless stop can come
to the middle of the voicing space without becoming a voiced stop). It is entirely
possible that some languages have a ‘pull-chain’ pattern of this type, whereby
intervocalic spirantization of voiced stops enables greater voicing in intervocalic
voiceless stops. (Indeed, if a voiceless stop with extra voicing is transcribed in writ-
ten descriptions as a voiced stop, then perhaps some patterns with both voicing
and spirantization intervocalically should be analyzed in exactly this way.) How-
ever, in the absence of sufficient data, I do not want to make the strong prediction
that every language with intervocalic spirantization of voiced stops also has some
intervocalic voicing. The Match constraint, highly ranked, allows candidate (d)
to surface.
150

Like (d), candidate (f) attempts to resolve the conflict between MinDist
and *Periphery by neutralizing intervocalic /b/ with something else. Where
(d) employs spirantization, (f) employs devoicing. The two candidates have the
same violation profiles, except that (d) violates Ident[–cont] where (f) violates
Ident[+voi]. The universal ranking Ident[+voi] À Ident[–cont] established by
the results of Experiment 2 renders candidate (f) unable to win under any ranking.
Finally, candidate (g) neutralizes /apa/ and /aba/ by voicing /p/ rather than
by devoicing /b/. Here, the fatal violation is assigned by Ident[–voi]. If we as-
sume that Ident[–voi] and Ident[–cont] are freely rankable (unlike Ident[+voi]
and Ident[–cont]), then we can reverse this ranking to allow (g), an attested
pattern, to surface. The abbreviated tableau in (18) illustrates.
151

(18)
Min
Dis
t[v
oi][60
ms]
*Perip
hery[v
oi][5m
s]
Ident[+
voi]
Ident[–
cont]
Ident[–
voi]
*M
erge
/pa/A /ba/B
/fa/C /Ba/D
/apa/E /aba/F
/afa/G /aBa/H
a.
[p0a] [b60a]
****![fa] [Ba][ap0a] [ab60a][afa] [aBa]
b.
[p5a] [b55a]
**![fa] [Ba][ap5a] [ab55a][afa] [aBa]
c.
[p0a] [b60a]
*** *! *[fa] [Ba][ap0a][afa] [aBa]F,H
d.
[p0a] [b60a]
*** *! *[fa] [Ba][ap0a]E,F
[afa] [aBa]
+ e.
[p0a] [b60a]
*** * *[fa] [Ba]
[ab0a]E,F
[afa] [aBa]
Thus, squeezing the voicing dimension with MinDist and *Periphery con-
straints can have at least two different results, depending on the ranking of other
constraints: one member of the voicing opposition can move along a perpendicu-
lar dimension by spirantizing (illustrated in (17)), or the voicing distinction itself
can be eliminated (illustrated in (18)). Squeezing the continuancy dimension
has analogous effects: either one member of the contrast changes on a perpen-
152

dicular dimension (voicing), or the continuancy distinction is collapsed through
spirantization. These possibilities are illustrated in the tableaux in (19) and (20),
respectively. In these tableaux, the MinDist and *Periphery constraints eval-
uate only voiceless segments. Since the best measure or combination of measures
for continuancy is not obvious, I leave the relevant phonetic dimension for these
constraints unspecified. For the sake of discussion, I assume a phonetic space
similar to that used for voicing above: a range from 0 (stops) to 60 (spirants).
(19)
Min
Dis
t[c
ont]
[60]
*Perip
hery[c
ont]
[5]
Ident[–
cont]
Ident[–
voi]
*M
erge
/pa/A /ba/B
/fa/C /Ba/D
/apa/E /aba/F
/afa/G /aBa/H
a.
[p0a] [ba]
****![f60a] [Ba][ap0a] [aba][af60a] [aBa]
b.
[p5a] [ba]
**![f55a] [Ba][ap5a] [aba][af55a] [aBa]
+ c.
[p0a] [ba]
*** * *[f60a] [Ba]
[aba]E,F
[af60a] [aBa]
d.
[p0a] [ba]
*** *! *[f60a] [Ba]
[aba][af60a]E,G [aBa]
153
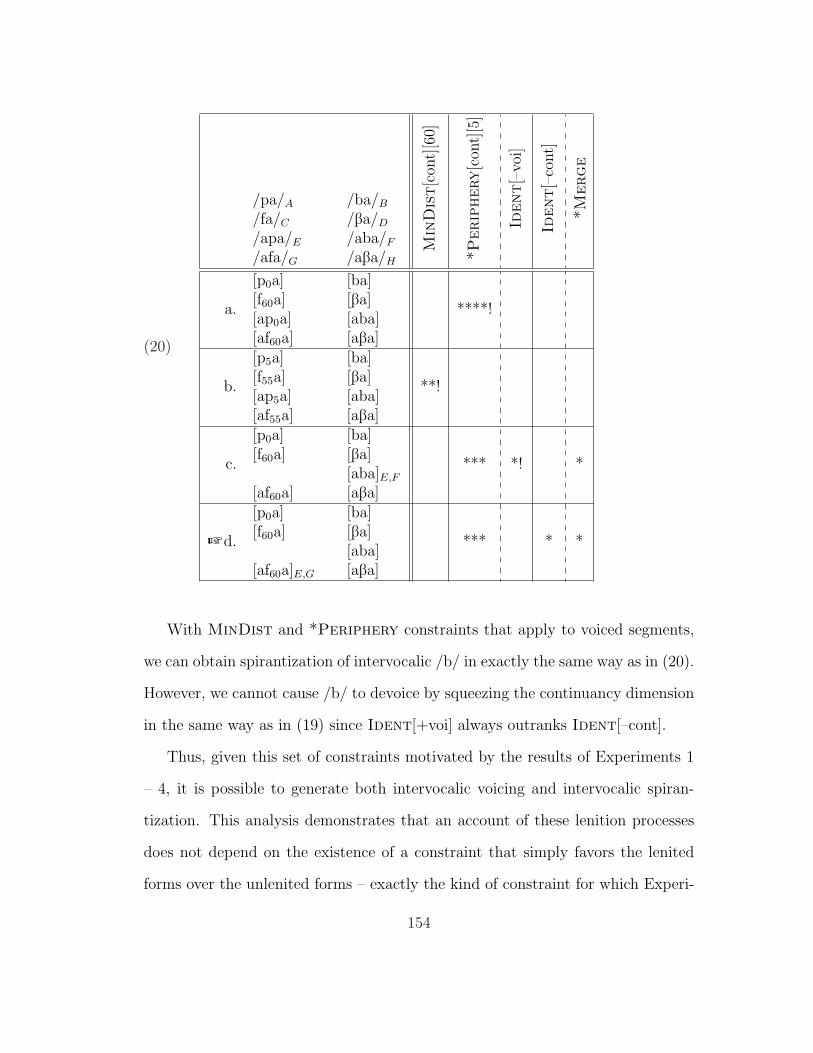
(20)
Min
Dis
t[c
ont]
[60]
*Perip
hery[c
ont]
[5]
Ident[–
voi]
Ident[–
cont]
*M
erge
/pa/A /ba/B
/fa/C /Ba/D
/apa/E /aba/F
/afa/G /aBa/H
a.
[p0a] [ba]
****![f60a] [Ba][ap0a] [aba][af60a] [aBa]
b.
[p5a] [ba]
**![f55a] [Ba][ap5a] [aba][af55a] [aBa]
c.
[p0a] [ba]
*** *! *[f60a] [Ba]
[aba]E,F
[af60a] [aBa]
+d.
[p0a] [ba]
*** * *[f60a] [Ba]
[aba][af60a]E,G [aBa]
With MinDist and *Periphery constraints that apply to voiced segments,
we can obtain spirantization of intervocalic /b/ in exactly the same way as in (20).
However, we cannot cause /b/ to devoice by squeezing the continuancy dimension
in the same way as in (19) since Ident[+voi] always outranks Ident[–cont].
Thus, given this set of constraints motivated by the results of Experiments 1
– 4, it is possible to generate both intervocalic voicing and intervocalic spiran-
tization. This analysis demonstrates that an account of these lenition processes
does not depend on the existence of a constraint that simply favors the lenited
forms over the unlenited forms – exactly the kind of constraint for which Experi-
154
ment 1 failed to find evidence. In addition, the fixed ranking of Ident[+voi] over
Ident[–cont] motived by Experiment 2 correctly rules out the unattested pattern
of intervocalic devoicing.
5.3.2 Intervocalic Despirantization?
Although the constraint set described in the previous section correctly gen-
erates several attested lenition patterns while ruling out intervocalic devoicing,
there is another unattested pattern that is predicted to occur: intervocalic de-
spirantization. If MinDist and *Periphery constraints restrict the continuancy
dimension and the lowest-ranked Ident constraint is Ident[+cont] (a constraint
not considered in the tableaux above), the pattern that emerges as the winner is
one in which intervocalic spirants become stops.
155
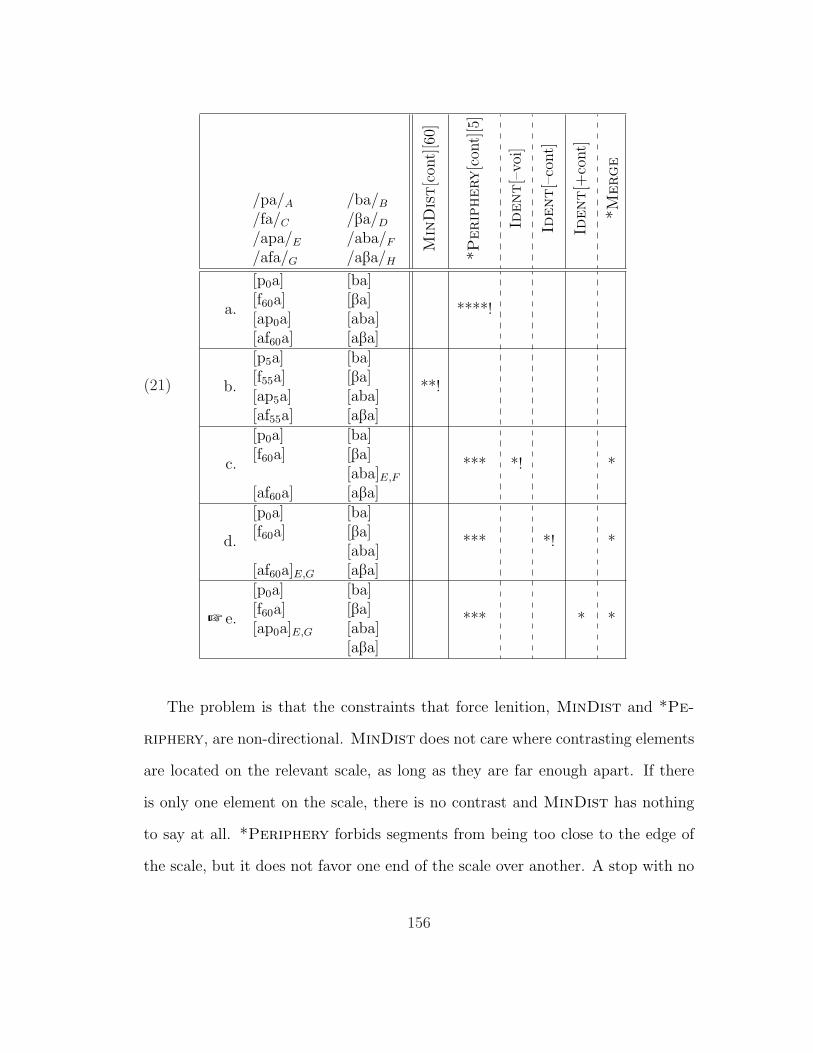
(21)
Min
Dis
t[c
ont]
[60]
*Perip
hery[c
ont]
[5]
Ident[–
voi]
Ident[–
cont]
Ident[+
cont]
*M
erge
/pa/A /ba/B
/fa/C /Ba/D
/apa/E /aba/F
/afa/G /aBa/H
a.
[p0a] [ba]
****![f60a] [Ba][ap0a] [aba][af60a] [aBa]
b.
[p5a] [ba]
**![f55a] [Ba][ap5a] [aba][af55a] [aBa]
c.
[p0a] [ba]
*** *! *[f60a] [Ba]
[aba]E,F
[af60a] [aBa]
d.
[p0a] [ba]
*** *! *[f60a] [Ba]
[aba][af60a]E,G [aBa]
+ e.
[p0a] [ba]
*** * *[f60a] [Ba][ap0a]E,G [aba]
[aBa]
The problem is that the constraints that force lenition, MinDist and *Pe-
riphery, are non-directional. MinDist does not care where contrasting elements
are located on the relevant scale, as long as they are far enough apart. If there
is only one element on the scale, there is no contrast and MinDist has nothing
to say at all. *Periphery forbids segments from being too close to the edge of
the scale, but it does not favor one end of the scale over another. A stop with no
156
voicing at all is just as bad as a stop with the maximum amount of voicing. Leni-
tion, by contrast, is directional. Intervocalic voiceless stops may become voiced,
but not the reverse; stops may become spirants, but not the reverse.
I have argued that we can solve the problem of directionality in the case of
voicing by considering a range of possible alternations for underlying voiced stops.
Spirantization is such a perceptually ‘good’ (that is, non-salient) alternation for
voiced stops that devoicing never occurs: if a voiced stop alternates at all, there is
always a better option than devoicing. The directionality of voicing alternations
emerges from restrictions on how one member of the voicing contrast can alternate,
not from an asymmetry along the voicing dimension itself.
Is a similar solution possible for the case of (de)spirantization? In princi-
ple, yes. We could hypothesize, for example, that spirants never become stops
intervocalically because they could undergo an even less perceptible change by
becoming approximants. If experimental data supported this proposal, we could
posit a universal ranking Ident[–son] À Ident[+cont] and rule out intervocalic
despirantization.
Unfortunately, this explanation reveals an inherent weakness of the approach
of the P-map for a series of unidirectional alternations such as lenition processes,
as illustrated in figure 5.2. The P-map by itself does not provide the needed
directionality: for each segment along the chain, it rules out the possibility of
moving to the left by appealing to the superior perceptual consequences of moving
to the right instead. Once we reach the rightmost element in the chain, this line of
argumentation is no longer possible; and if we simply add another element ot the
chain, the problem has only been pushed back a step. If it is the case (and I know
of no counterexamples) that spirants may lenite to approximants intervocalically
157
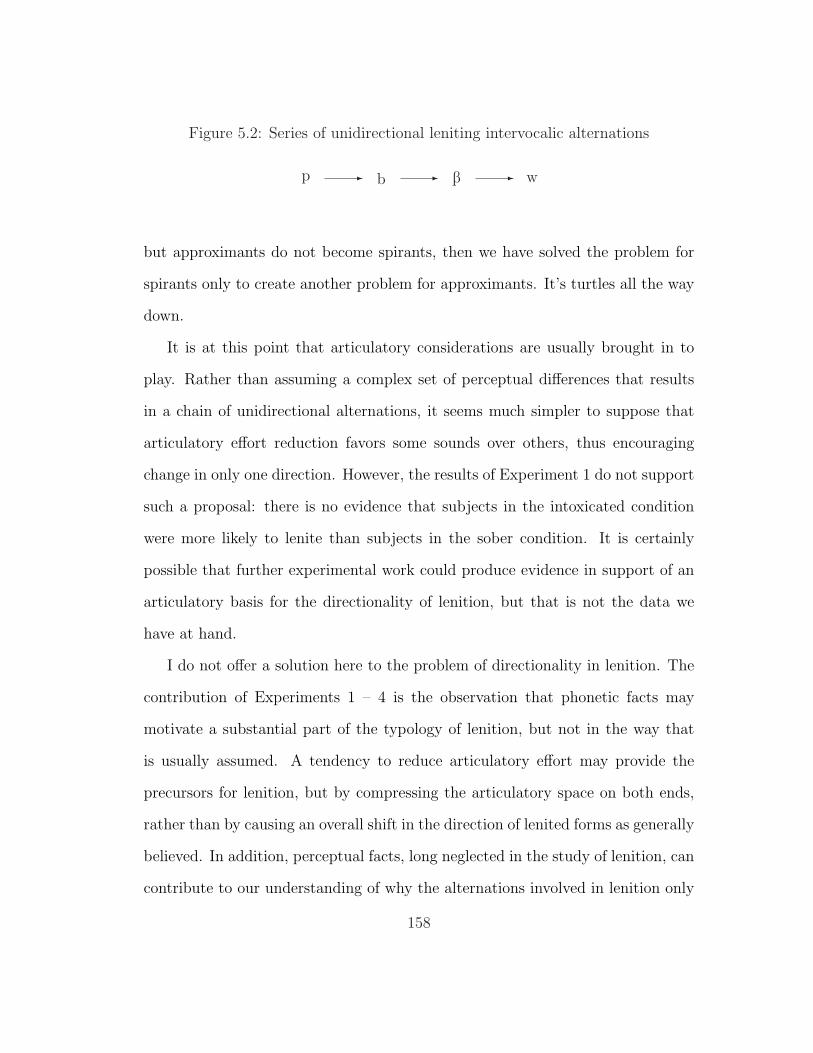
Figure 5.2: Series of unidirectional leniting intervocalic alternations
p - b - B - w
but approximants do not become spirants, then we have solved the problem for
spirants only to create another problem for approximants. It’s turtles all the way
down.
It is at this point that articulatory considerations are usually brought in to
play. Rather than assuming a complex set of perceptual differences that results
in a chain of unidirectional alternations, it seems much simpler to suppose that
articulatory effort reduction favors some sounds over others, thus encouraging
change in only one direction. However, the results of Experiment 1 do not support
such a proposal: there is no evidence that subjects in the intoxicated condition
were more likely to lenite than subjects in the sober condition. It is certainly
possible that further experimental work could produce evidence in support of an
articulatory basis for the directionality of lenition, but that is not the data we
have at hand.
I do not offer a solution here to the problem of directionality in lenition. The
contribution of Experiments 1 – 4 is the observation that phonetic facts may
motivate a substantial part of the typology of lenition, but not in the way that
is usually assumed. A tendency to reduce articulatory effort may provide the
precursors for lenition, but by compressing the articulatory space on both ends,
rather than by causing an overall shift in the direction of lenited forms as generally
believed. In addition, perceptual facts, long neglected in the study of lenition, can
contribute to our understanding of why the alternations involved in lenition only
158

go in one direction, even if perception does not ultimately tell the whole story.
5.4 Conclusion
This chapter has illustrated the implications of Experiments 1 – 4 for any
phonological analysis that takes phonetic facts seriously. First, the results of Ex-
periments 2 and 4, when combined with the P-map, provide a very good match to
the broad typological facts: although voiceless stops may voice or spirantize inter-
vocalically, voiced stops may spirantize but may not devoice. However, applying
the same procedure to the results of Experiment 3 yields incorrect predictions
regarding which voiced stops should be more likely to spirantize. This result
demonstrates that not every difference in perceptibility should be projected by
the P-map into a universal ranking of faithfulness constraints; I have suggested
some ways in which we might constrain the P-map in a principled manner.
Second, the results of Experiment 1 do not support the traditional account
of lenition as effort reduction; that is, Experiment 1 provides no evidence that
reducing articulatory effort makes subjects more likely to produce lenited forms.
Rather, the compressed articulatory space exhibited by subjects in the intoxicated
condition is reminiscent of approaches that penalize productions in the periphery
of the phonetic space, notably Dispersion Theory.
I have also shown that a Dispersion-Theoretic analysis is capable of model-
ing intervocalic lenition even without a constraint that favors lenited forms over
unlenited ones outright. This analysis illustrates the kind of approach phonology
must take in order to account for lenition in a way consistent with the results
of Experiment 1 – 4. Although some questions remain (such as the best way to
159

rule out intervocalic despirantization), I submit that this approach is a step in the
right direction because it adheres more closely to the phonetic facts of lenition
than do previous approaches.
160

Chapter 6
Conclusion
There is nearly universal agreement that intervocalic lenition is driven, at least
in part, by phonetic factors. However, there is less agreement on what exactly the
relevant factors are. A widely accepted view is that lenited forms require less effort
to produce than unlenited forms, but researchers do not agree on what makes one
form more difficult than another, or on the degree to which a given measure of
difficulty is actually relevant to lenition. In this dissertation, I have argued that
the articulatory understanding of lenition must be revised in two substantial ways.
First, Experiment 1 failed to find evidence that lenited forms are easier to
produce than unlenited forms. This experiment involved a novel approach to in-
vestigating articulatory effort: I attempted to observe effort reduction in action
by comparing the speech of intoxicated subjects (hypothesized to use less articu-
latory effort) with that of sober subjects. Although the speech of the two groups
did differ, it was not the case that intoxicated subjects were more likely to produce
lenited forms; rather, intoxicated subjects exhibited an overall contraction of the
articulatory space. Thus, the relationship between lenition and articulatory effort
161

reduction appears to be more complicated than commonly assumed.
Second, perceptual facts – long overlooked in the study of the phonetic basis of
lenition – can help us understand in some cases why lenition is unidirectional. The
change /D/→ [Z] intervocalically is more difficult to perceive than the change /D/
→ [T], while the changes /T/ → [S] and /T/ → [D] are about equally perceptible.
Combined with a framework such as the P-map that posits that more salient
changes to underlying forms are less likely than less salient changes, these facts
provide us with an explanation for the fact that lenition of voiceless stops may
involve changes to either voicing or continuancy, while lenition of voiced stops
may change continuancy but not voicing.
These two results suggest that we can no longer do ‘phonology as usual’ when
analyzing lenition. Chapter 5 illustrated what a phonological analysis would have
to look like in order to be consistent with the results of Experiments 1 – 4. The
analysis presented there shows that it is possible to describe lenition patterns in
the context of Optimality Theory even without a constraint that favors lenited
forms over unlenited forms outright.
I conclude that phonetic factors are relevant to intervocalic lenition, but not
in the way they are usually thought to be. More broadly, this work illustrates
the value of broadening the range of phonetic sources we are willing to consider
for a given phonological phenomenon, and of applying a variety of experimental
paradigms to difficult empirical problems.
162
Chapter 7
Appendices
7.1 Classification of Languages in the Database
of Gurevich (2004)
The following table lists how each language in the database of Gurevich (2004)
is classified along the parameters relevant to the discussion in §2. A total of 16
languages were excluded because segment inventories were not provided in the
database: Cuna; British English; Cockney English; Liverpool English; London,
Leeds, & Fife English; New Zealand English; Haitian Creole; Icelandic; Southern
Italian; Middle Chinese; Northern Corsican; Numic; Proto-Germanic; Mexico City
Spanish; Tigrinya; Yuman.
Each language is classified for each place of articulation at which the language
has either a voiceless stop or a voiced stop. In the broader groupings above,
‘labials’ include labials; ‘coronals’ include dentals, alveolars, and retroflexes; and
‘dorsals’ include velars. ‘Labio-X’ and ‘palato-X’ are classified in the same way as
163

‘X’.
In the field ‘Lenition of T’, I indicate what (if any) lenition processes applies to
the relevant voiceless stop. The possibilities are ‘voicing’, ‘spirantization’, ‘both’,
and ‘other’. ‘NA’ indicates that the language lacks a voiceless stop at the relevant
place of articulation.
In the field ‘Spirantization of D’, I indicate whether the relevant voiced stop
spirantizes or not. If spirantization is rare, this is so indicated in the table, and
the language is considered to spirantize that stop for the purposes of the typology
above. If voiced stops flap, this is also indicated. This information is included
because in some languages (such as Malayalam), there is spirantization of voiced
stops at most places of articulation, but some coronals undergo flapping instead
of spirantization. These coronals are considered to not undergo spirantization for
the purposes of the classification above, except in one case. In Senoufo, there is
also intervocalic voicing of voiced stops; here, flapping clearly allows the language
to avoid neutralization of /t/ and /d/. Thus, Senoufo coronals are counted as
spirantizing in the table that lists spirantizing languages by whether or not they
also have intervocalic voicing (but not in the other tables). Again, ‘NA’ indicates
that the language lacks the relevant voiced stop.
In the field ‘Presence of Z’, I indicate whether the relevant voiced spirant
is phonemically present in the language or not. A second entry in parentheses
accompanies some places of articulation; these entries contain information on
voiced spirants that are not usually the result of spirantization but are sufficiently
similar to warrant investigation. For labials, the ‘extra’ spirant is [v]; for alveolars,
it is [z]; for palatals, it is [Z] (as opposed to [J], the true palatal fricative).
164
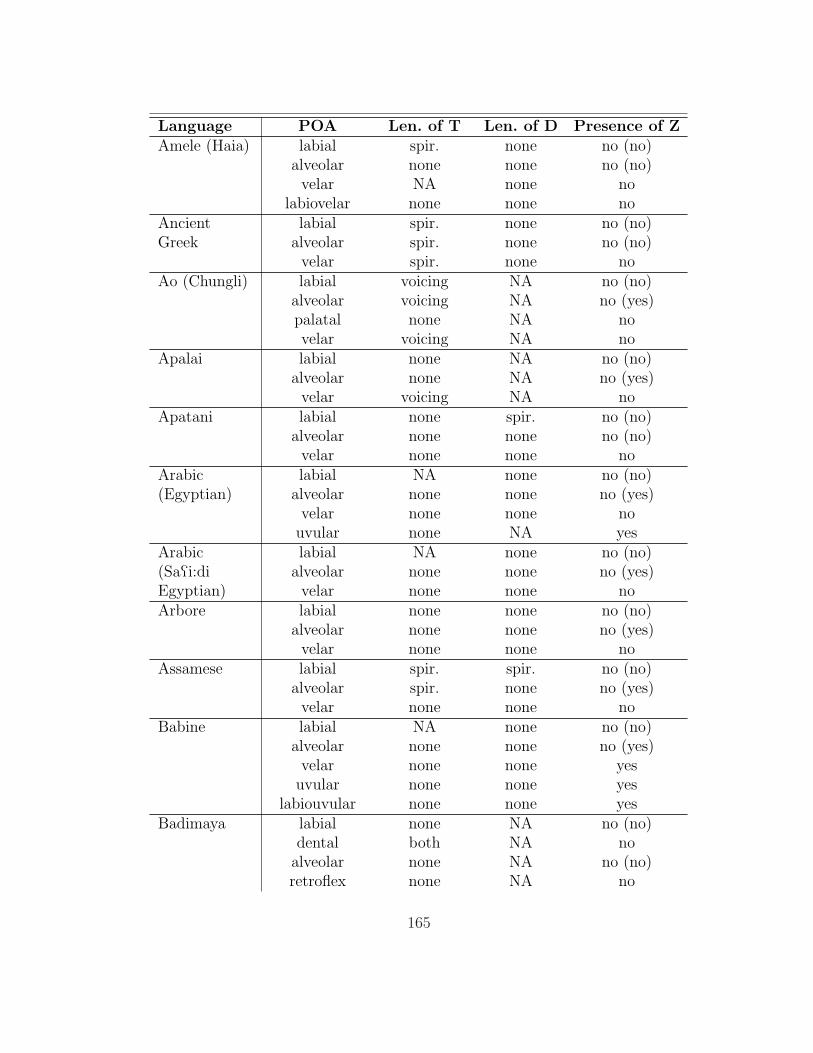
Language POA Len. of T Len. of D Presence of ZAmele (Haia) labial spir. none no (no)
alveolar none none no (no)velar NA none no
labiovelar none none noAncient labial spir. none no (no)Greek alveolar spir. none no (no)
velar spir. none noAo (Chungli) labial voicing NA no (no)
alveolar voicing NA no (yes)palatal none NA novelar voicing NA no
Apalai labial none NA no (no)alveolar none NA no (yes)velar voicing NA no
Apatani labial none spir. no (no)alveolar none none no (no)velar none none no
Arabic labial NA none no (no)(Egyptian) alveolar none none no (yes)
velar none none nouvular none NA yes
Arabic labial NA none no (no)(SaQi:di alveolar none none no (yes)Egyptian) velar none none noArbore labial none none no (no)
alveolar none none no (yes)velar none none no
Assamese labial spir. spir. no (no)alveolar spir. none no (yes)velar none none no
Babine labial NA none no (no)alveolar none none no (yes)velar none none yes
uvular none none yeslabiouvular none none yes
Badimaya labial none NA no (no)dental both NA no
alveolar none NA no (no)retroflex none NA no
165

Language POA Len. of T Len. of D Presence of Zpalatal both NA no (no)velar none NA no
Balti (Purki) labial none none no (no)dental none spir. no
alveolar none none no (yes)velar none none no
uvular none NA yesBashkir labial none spir. no (yes)
alveolar none none yes (yes)velar none none no
uvular none NA yesBasque labial none spir. no (no)(Souletin) alveolar none spir. no (yes)
palatal none spir. yes (yes)velar none spir. no
Blackfoot labial none NA no (no)alveolar none NA no (no)velar none NA no
Bontoc labial none none no (no)alveolar none none no (no)velar none none no
uvular none NA noBulgarian labial none none no (yes)
alveolar none none no (yes)palatal none none no (yes)velar none NA no
Canela-Kraho labial voicing NA no (no)alveolar voicing NA no (no)velar voicing NA no
Car labial none NA no (no)Nicobarese alveolar none none no (no)
retroflex none NA novelar none NA no
Catalan labial none spir. no (no)(Eastern) alveolar none spir. no (yes)
velar none spir. noDahalo labial none spir. no (yes)
dental none none noalveolar none spir. no (no)
166

Language POA Len. of T Len. of D Presence of Zvelar none none no
labiovelar none none noDjabugay labial voicing NA no (no)
alveolar voicing NA no (no)palatal voicing NA no (no)velar voicing NA no
Efik labial NA spir. no (no)(Calabar- alveolar none flapping no (no)Creek) velar both NA no
labiovelar none NA noEnglish labial none none no (yes)(American) alveolar other flapping yes (yes)
velar none none noEnglish labial none spir. no (yes)(Cardiff) alveolar none none yes (yes)
velar none none noEstonian labial voicing NA no (no)(Southern) dental voicing NA no
alveolar voicing NA no (no)velar voicing NA no
Faroese labial voicing NA no (yes)alveolar voicing NA no (no)palatal voicing NA no (no)velar voicing NA no
Finnish labial none none no (no)alveolar none none no (no)velar none none no
French labial none none no (yes)(Perigourdin) alveolar voicing spir. no (yes)
velar none none noGbEya labial none none no (yes)
alveolar none none no (yes)velar none none no
labiovelar none none noGeorgian labial none none no (yes)
alveolar none none no (yes)palatal none none no (yes)velar none none no
uvular none NA yes
167

Language POA Len. of T Len. of D Presence of ZGitksan labial voicing NA no (no)
alveolar voicing NA no (no)velar voicing NA no
labiovelar voicing NA nouvular voicing NA no
Gojri labial none other no (no)alveolar none other no (yes)retroflex none other nopalatal none other no (no)velar none other yes
uvular none NA noGooniyandi labial voicing NA no (no)
dental voicing NA noalveolar voicing NA no (no)retroflex voicing NA nopalatal voicing NA no (no)velar voicing NA no
Gothic labial none spir. no (no)alveolar none spir. no (yes)velar none spir. no
Greenlandic labial none NA no (yes)(West) alveolar none NA no (no)
palatal NA none no (no)velar none none no
uvular spir./both NA noGuayabero labial none none yes (no)
alveolar none none no (no)velar none NA no
Gujarati labial none spir. no (no)alveolar none spir. no (yes)retroflex none spir. no
velar none spir. noHebrew labial spir. spir. no (no)(Tiberian) alveolar spir. spir. no (yes)
velar spir. spir. nouvular none NA no
Kabardian labial none none no (yes)(Terek) alveolar none none no (yes)
palatal none none yes (yes)
168

Language POA Len. of T Len. of D Presence of Zlabiovelar none none no
uvular none NA yeslabiouvular none NA yes
Kagate labial none spir. no (no)alveolar none none no (no)retroflex none none no
velar none other noKaliai-Kove labial none NA yes (no)(Kandoka- alveolar none NA no (no)Lusi) velar none spir. noKanakuru labial other none no (no)
alveolar other none no (no)labioalveolar none none no
palatal NA none no (no)velar other none no
labiovelar none none noKannada labial voicing NA no (no)
alveolar voicing NA no (no)retroflex none NA no
velar voicing NA noKanuri labial none spir. no (no)
alveolar none none no (yes)velar none spir. no
Karao labial spir. none no (no)alveolar spir. other no (no)velar none none no
labiovelar NA other nouvular spir. NA no
Kashmiri labial none none no (no)alveolar none none no (yes)retroflex none flapping no
velar none none noKirghiz labial none none yes (no)
alveolar none none no (yes)velar none none no
Korean labial voicing NA no (no)alveolar voicing NA no (no)velar voicing NA no
Kuna (Paya) labial none spir. no (no)
169

Language POA Len. of T Len. of D Presence of Zalveolar none spir. no (yes)
labioalveolar none none novelar none spir. no
labiovelar none none noKupia labial spir. none no (no)(Sujanakota) alveolar none none no (no)
retroflex other flapping novelar none none no
Ladakhi labial none spir. no (no)(Central) alveolar none spir. no (yes)
retroflex none none novelar none spir. no
Lahaul labial none none no (no)(Pattani) alveolar none none no (yes)
retroflex none flapping nopalatal none none no (no)velar none none no
Lama labial other NA no (no)alveolar none NA no (no)palatal none NA no (no)velar none NA no
labiovelar none NA noLamani labial none none no (no)
alveolar none none no (no)retroflex none flapping no
velar none none noLaotian labial none none no (no)(Vientiane) alveolar none none no (no)
palatal none NA no (no)velar none NA no
labiovelar none NA noLezgian labial voicing none no (no)
alveolar voicing none no (yes)labioalveolar voicing NA no (yes)
velar voicing none nolabiovelar voicing none no
uvular both NA yeslabiouvular both NA yes
Limbu labial voicing other no (no)
170
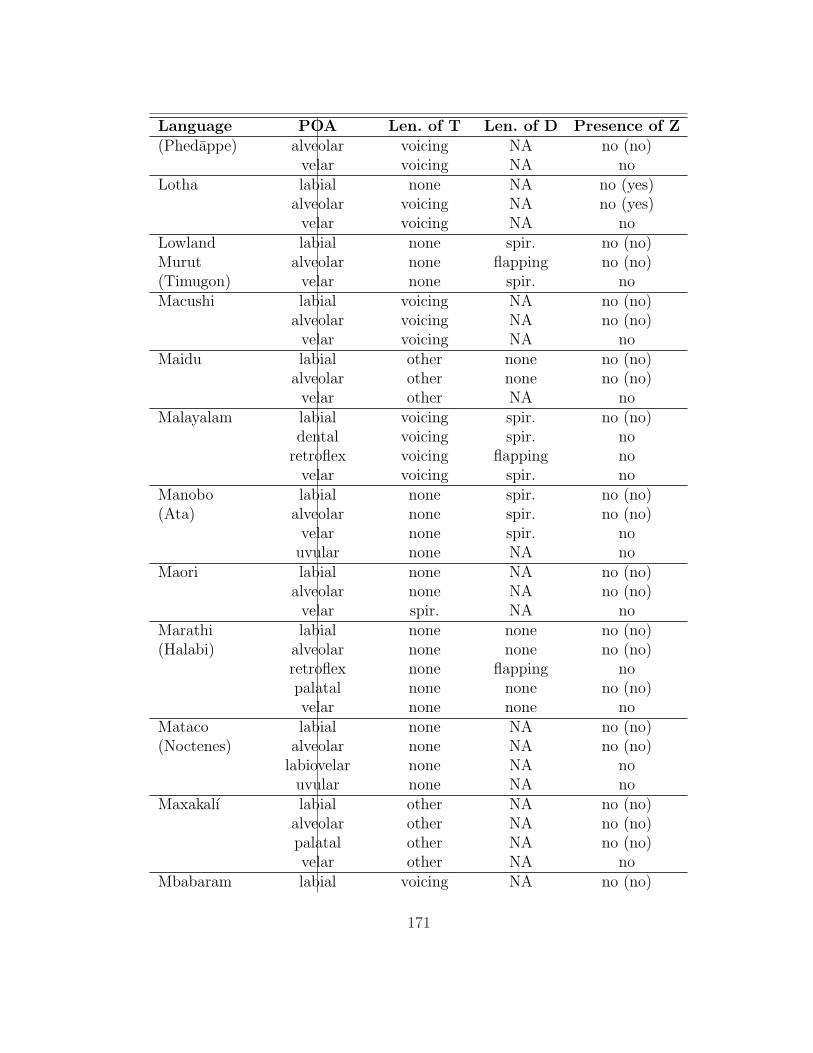
Language POA Len. of T Len. of D Presence of Z(Phedappe) alveolar voicing NA no (no)
velar voicing NA noLotha labial none NA no (yes)
alveolar voicing NA no (yes)velar voicing NA no
Lowland labial none spir. no (no)Murut alveolar none flapping no (no)(Timugon) velar none spir. noMacushi labial voicing NA no (no)
alveolar voicing NA no (no)velar voicing NA no
Maidu labial other none no (no)alveolar other none no (no)velar other NA no
Malayalam labial voicing spir. no (no)dental voicing spir. no
retroflex voicing flapping novelar voicing spir. no
Manobo labial none spir. no (no)(Ata) alveolar none spir. no (no)
velar none spir. nouvular none NA no
Maori labial none NA no (no)alveolar none NA no (no)velar spir. NA no
Marathi labial none none no (no)(Halabi) alveolar none none no (no)
retroflex none flapping nopalatal none none no (no)velar none none no
Mataco labial none NA no (no)(Noctenes) alveolar none NA no (no)
labiovelar none NA nouvular none NA no
Maxakalı labial other NA no (no)alveolar other NA no (no)palatal other NA no (no)velar other NA no
Mbabaram labial voicing NA no (no)
171

Language POA Len. of T Len. of D Presence of Zdental voicing NA no
alveolar voicing NA no (no)labioalveolar voicing NA no
palatal voicing NA no (no)velar voicing NA no
Modern Irish labial none none no (no)alveolar none none no (no)velar none none no
Moghamo labial none none no (no)(Batibo) alveolar none flapping no (no)
velar none spir. noMohawk alveolar voicing NA no (no)(Akwesasne) velar voicing NA noMongolian labial none spir. no (no)(Kalkha) alveolar none none no (no)
velar none spir. noNavajo labial NA none no (no)
alveolar none none no (yes)velar none none yes
Nepali labial spir. spir. no (no)alveolar none other no (no)retroflex none flapping no
velar spir. other noNewari labial none none no (no)
alveolar none none no (no)velar none none no
Nez Perce labial none NA no (no)dental none NA no
alveolar spir. NA no (no)velar spir. NA no
uvular spir. NA noNkore-Kiga labial none spir. no (yes)
alveolar NA none no (yes)velar none none no
Nyawaygi labial NA none no (no)alveolar NA none no (no)palatal NA none no (no)velar NA none no
Paez labial none none yes (no)
172
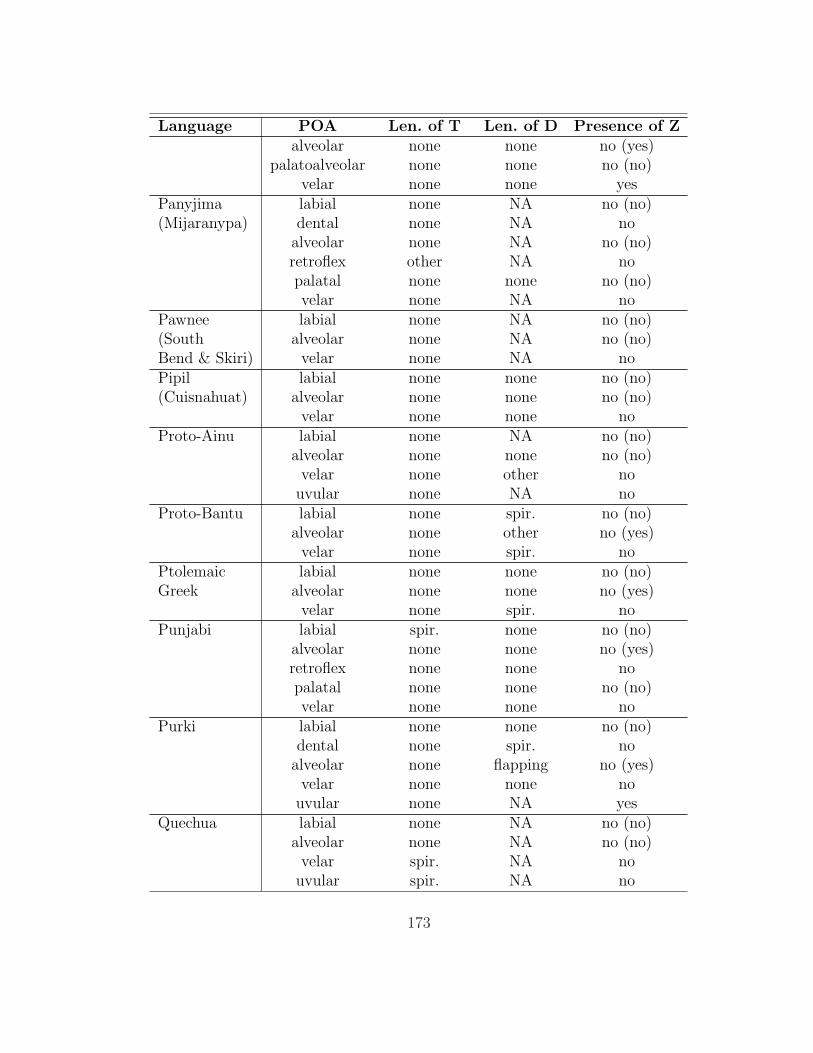
Language POA Len. of T Len. of D Presence of Zalveolar none none no (yes)
palatoalveolar none none no (no)velar none none yes
Panyjima labial none NA no (no)(Mijaranypa) dental none NA no
alveolar none NA no (no)retroflex other NA nopalatal none none no (no)velar none NA no
Pawnee labial none NA no (no)(South alveolar none NA no (no)Bend & Skiri) velar none NA noPipil labial none none no (no)(Cuisnahuat) alveolar none none no (no)
velar none none noProto-Ainu labial none NA no (no)
alveolar none none no (no)velar none other no
uvular none NA noProto-Bantu labial none spir. no (no)
alveolar none other no (yes)velar none spir. no
Ptolemaic labial none none no (no)Greek alveolar none none no (yes)
velar none spir. noPunjabi labial spir. none no (no)
alveolar none none no (yes)retroflex none none nopalatal none none no (no)velar none none no
Purki labial none none no (no)dental none spir. no
alveolar none flapping no (yes)velar none none no
uvular none NA yesQuechua labial none NA no (no)
alveolar none NA no (no)velar spir. NA no
uvular spir. NA no
173
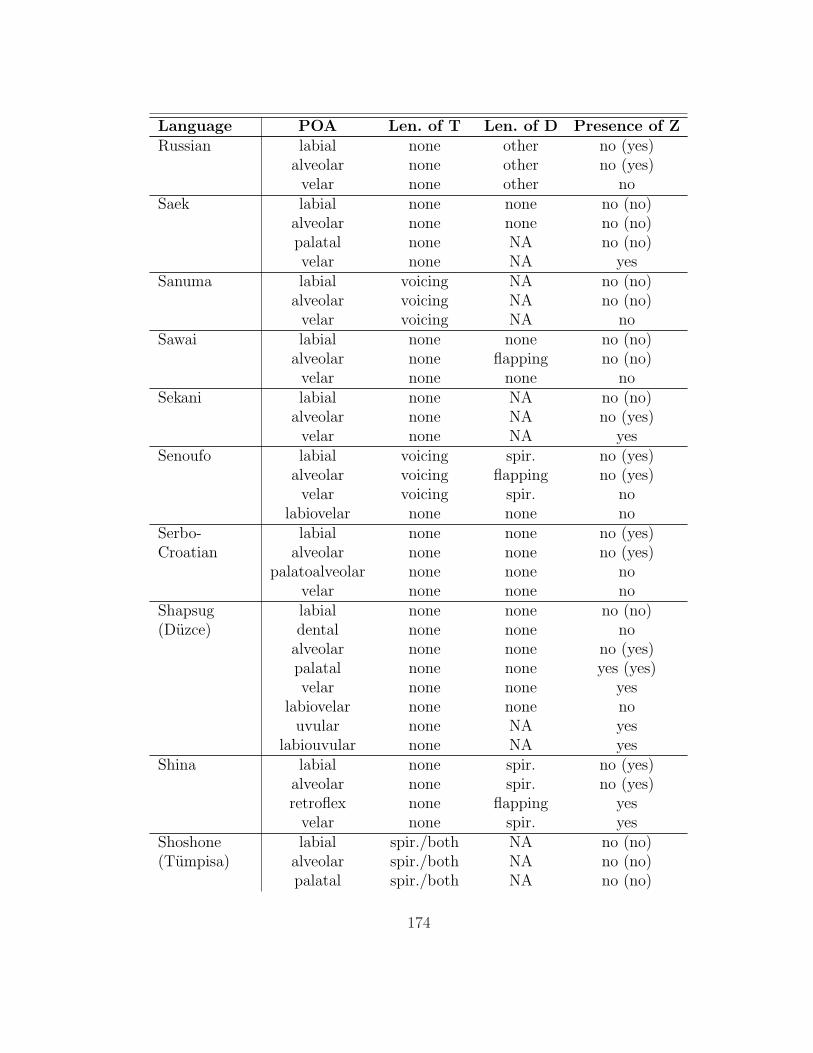
Language POA Len. of T Len. of D Presence of ZRussian labial none other no (yes)
alveolar none other no (yes)velar none other no
Saek labial none none no (no)alveolar none none no (no)palatal none NA no (no)velar none NA yes
Sanuma labial voicing NA no (no)alveolar voicing NA no (no)velar voicing NA no
Sawai labial none none no (no)alveolar none flapping no (no)velar none none no
Sekani labial none NA no (no)alveolar none NA no (yes)velar none NA yes
Senoufo labial voicing spir. no (yes)alveolar voicing flapping no (yes)velar voicing spir. no
labiovelar none none noSerbo- labial none none no (yes)Croatian alveolar none none no (yes)
palatoalveolar none none novelar none none no
Shapsug labial none none no (no)(Duzce) dental none none no
alveolar none none no (yes)palatal none none yes (yes)velar none none yes
labiovelar none none nouvular none NA yes
labiouvular none NA yesShina labial none spir. no (yes)
alveolar none spir. no (yes)retroflex none flapping yes
velar none spir. yesShoshone labial spir./both NA no (no)(Tumpisa) alveolar spir./both NA no (no)
palatal spir./both NA no (no)
174

Language POA Len. of T Len. of D Presence of Zvelar spir./both NA no
labiovelar spir./both NA noSomali labial NA spir. no (no)
alveolar none spir. no (no)retroflex NA flapping no
velar none spir. nouvular none NA no
Sotho labial none spir. no (yes)(Southern) alveolar none none no (no)
velar none NA noSouthern Tati labial none none no (yes)(Chali) alveolar none none no (yes)
velar none none nouvular both NA no
Southern Tati labial none none no (yes)(Eshtehardi) alveolar none none no (yes)
velar none none nouvular none NA no
Southern Tati labial none none no (yes)(Takestani) alveolar none none no (yes)
velar none spir. nouvular none NA no
Southern Tati labial none none no (yes)(Xiaraji) alveolar none none no (yes)
velar none none nouvular none NA no
Spanish labial none spir. no (no)(Andalusian) alveolar none spir. no (no)
velar none spir. noTahltan labial NA none no (no)(Iskut) dental voicing none no
alveolar voicing none yes (yes)retroflex voicing none nopalatal voicing none yes (no)velar voicing none yes
labiovelar voicing none nouvular voicing none yes
Taiwanese labial both none no (no)alveolar other NA no (no)
175

Language POA Len. of T Len. of D Presence of Zvelar both none no
Tamazight labial NA spir. no (no)Berber (Ayt alveolar none none no (yes)Ayache) velar spir. spir. no
uvular none NA yesTamazight uvular none NA yesBerber (AytNdhir)Tamazight labial NA spir. no (no)Berber (Ayt alveolar none none no (yes)Seghrouchen) velar none none no
uvular none NA yesTamil labial both none no (yes)
alveolar both none no (no)retroflex other none no
velar both none noTatar labial none spir. no (yes)
alveolar none spir. no (yes)velar none spir. no
Tauya labial none none no (no)alveolar none NA no (no)velar other none no
Thai labial none none no (no)alveolar none none no (no)palatal none NA no (no)velar none none no
Tharu labial spir. spir. no (no)(Chitwan) alveolar none none no (no)
retroflex none flapping novelar none none no
Toba Batak labial other none no (no)alveolar other none no (no)velar other none no
Tojolabal labial none none no (no)alveolar none none no (no)palatal none NA no (no)velar none spir. no
Totonac labial voicing NA no (no)(Misantla) alveolar voicing NA no (no)
176
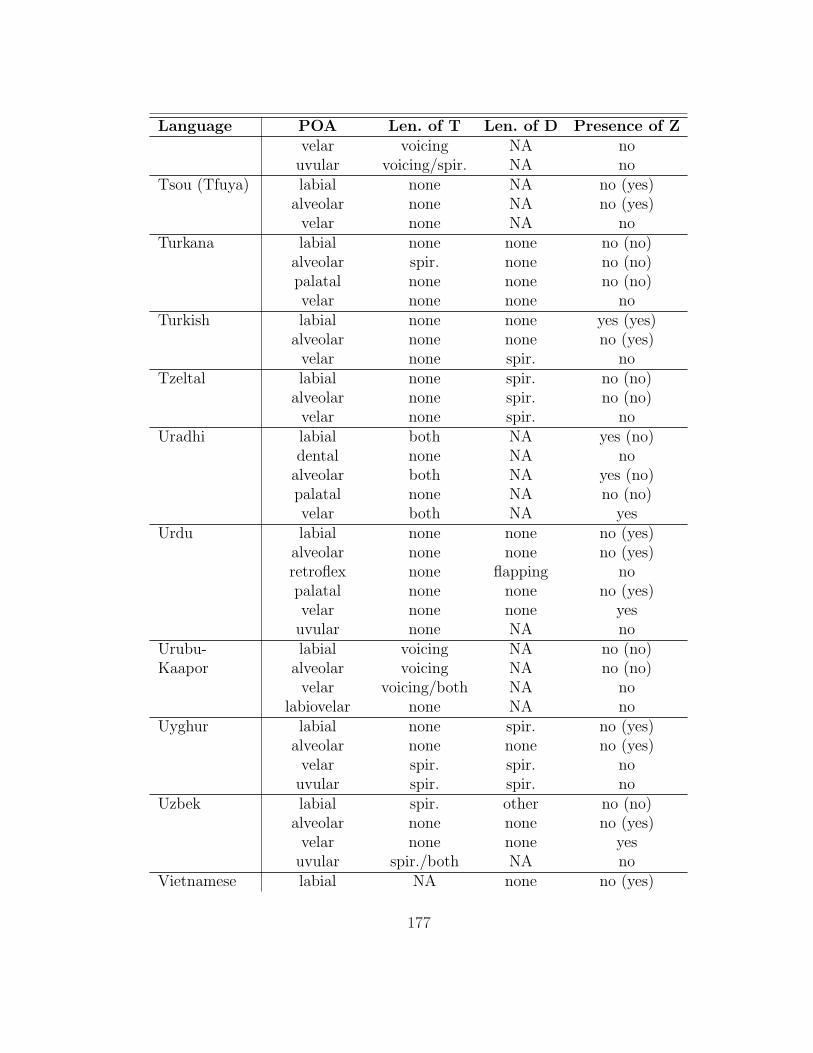
Language POA Len. of T Len. of D Presence of Zvelar voicing NA no
uvular voicing/spir. NA noTsou (Tfuya) labial none NA no (yes)
alveolar none NA no (yes)velar none NA no
Turkana labial none none no (no)alveolar spir. none no (no)palatal none none no (no)velar none none no
Turkish labial none none yes (yes)alveolar none none no (yes)velar none spir. no
Tzeltal labial none spir. no (no)alveolar none spir. no (no)velar none spir. no
Uradhi labial both NA yes (no)dental none NA no
alveolar both NA yes (no)palatal none NA no (no)velar both NA yes
Urdu labial none none no (yes)alveolar none none no (yes)retroflex none flapping nopalatal none none no (yes)velar none none yes
uvular none NA noUrubu- labial voicing NA no (no)Kaapor alveolar voicing NA no (no)
velar voicing/both NA nolabiovelar none NA no
Uyghur labial none spir. no (yes)alveolar none none no (yes)velar spir. spir. no
uvular spir. spir. noUzbek labial spir. other no (no)
alveolar none none no (yes)velar none none yes
uvular spir./both NA noVietnamese labial NA none no (yes)
177

Language POA Len. of T Len. of D Presence of Z(Vinh) alveolar none none no (yes)
palatal none NA no (no)velar none NA yes
Warndarang labial voicing NA no (no)dental none NA no
alveolar voicing NA no (no)retroflex voicing NA nopalatal voicing NA no (no)velar voicing NA no
West labial NA none no (no)Tarangan alveolar none none no (no)
velar other NA noWiyot labial none none no (no)
alveolar none NA no (no)velar none none no
Yakut labial voicing none no (no)alveolar none none no (no)velar spir. none no
Yana labial voicing NA no (no)alveolar voicing NA no (no)velar voicing NA no
Yindjibarndi labial other NA no (no)dental other NA no
alveolar none NA no (no)retroflex other NA nopalatal none NA no (no)velar other NA no
Yolngu labial other NA no (no)(Djapu) dental other NA no
alveolar none NA no (no)retroflex none none nopalatal other NA no (no)velar other NA no
178
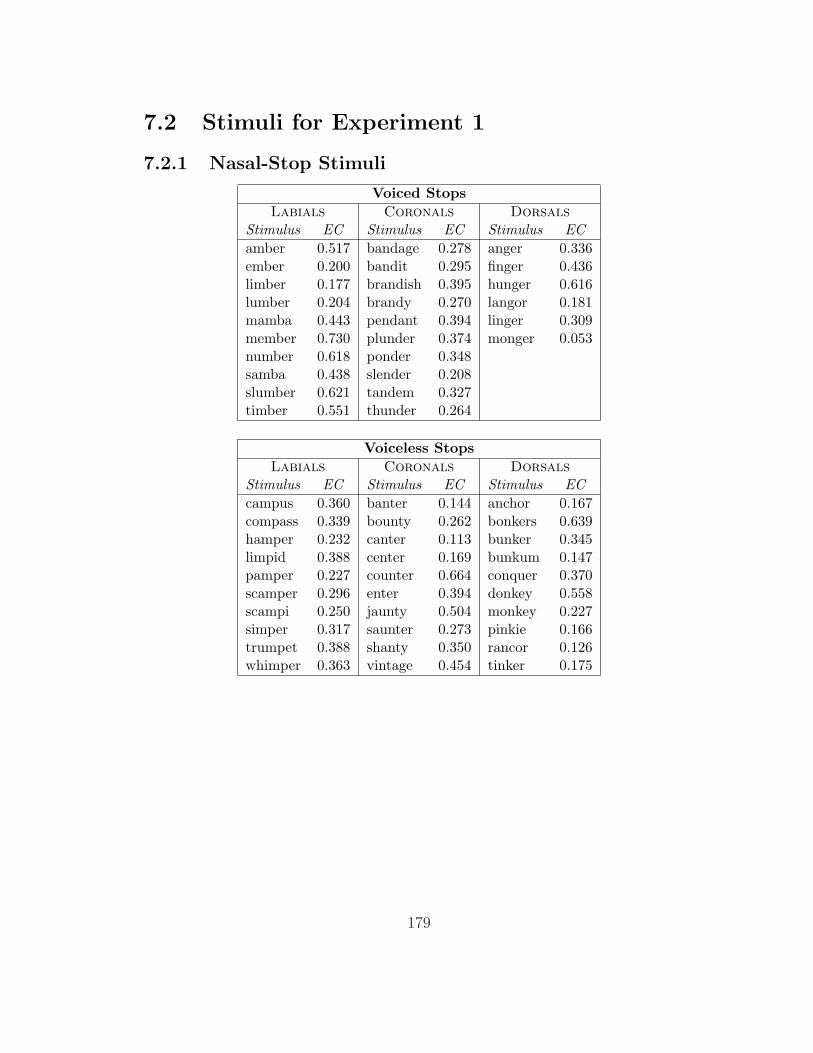
7.2 Stimuli for Experiment 1
7.2.1 Nasal-Stop Stimuli
Voiced StopsLabials Coronals Dorsals
Stimulus EC Stimulus EC Stimulus ECamber 0.517 bandage 0.278 anger 0.336ember 0.200 bandit 0.295 finger 0.436limber 0.177 brandish 0.395 hunger 0.616lumber 0.204 brandy 0.270 langor 0.181mamba 0.443 pendant 0.394 linger 0.309member 0.730 plunder 0.374 monger 0.053number 0.618 ponder 0.348samba 0.438 slender 0.208slumber 0.621 tandem 0.327timber 0.551 thunder 0.264
Voiceless StopsLabials Coronals Dorsals
Stimulus EC Stimulus EC Stimulus ECcampus 0.360 banter 0.144 anchor 0.167compass 0.339 bounty 0.262 bonkers 0.639hamper 0.232 canter 0.113 bunker 0.345limpid 0.388 center 0.169 bunkum 0.147pamper 0.227 counter 0.664 conquer 0.370scamper 0.296 enter 0.394 donkey 0.558scampi 0.250 jaunty 0.504 monkey 0.227simper 0.317 saunter 0.273 pinkie 0.166trumpet 0.388 shanty 0.350 rancor 0.126whimper 0.363 vintage 0.454 tinker 0.175
179
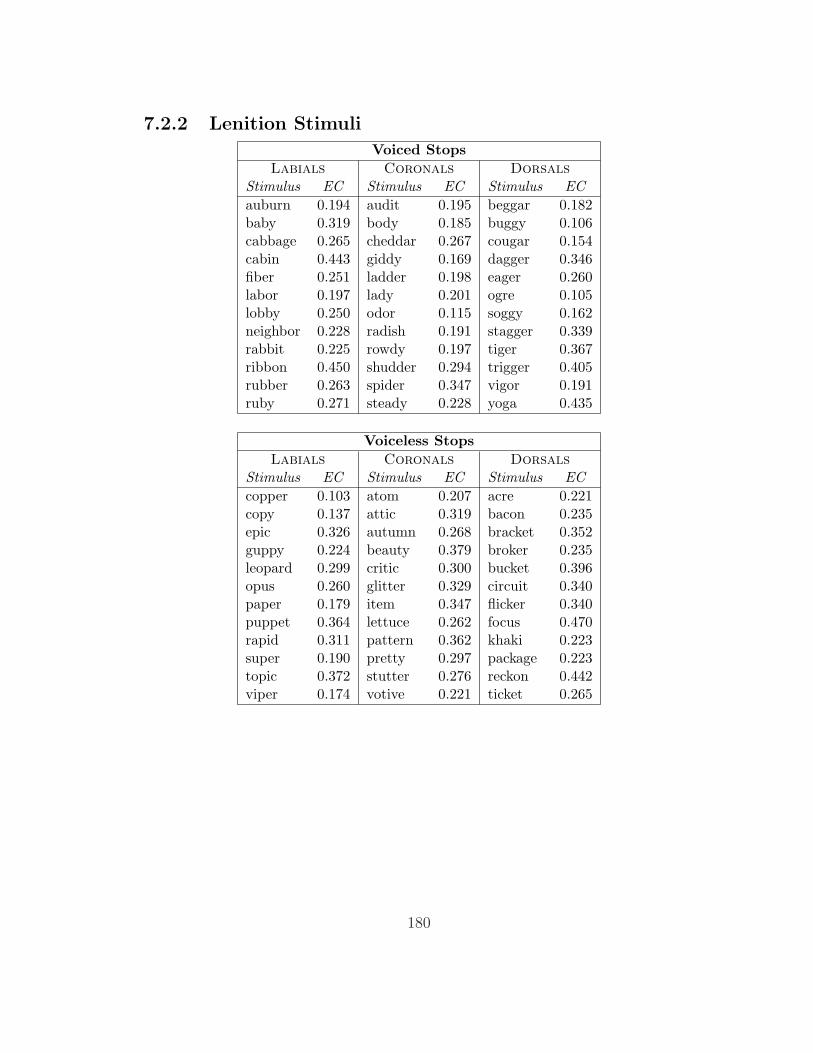
7.2.2 Lenition Stimuli
Voiced StopsLabials Coronals Dorsals
Stimulus EC Stimulus EC Stimulus ECauburn 0.194 audit 0.195 beggar 0.182baby 0.319 body 0.185 buggy 0.106cabbage 0.265 cheddar 0.267 cougar 0.154cabin 0.443 giddy 0.169 dagger 0.346fiber 0.251 ladder 0.198 eager 0.260labor 0.197 lady 0.201 ogre 0.105lobby 0.250 odor 0.115 soggy 0.162neighbor 0.228 radish 0.191 stagger 0.339rabbit 0.225 rowdy 0.197 tiger 0.367ribbon 0.450 shudder 0.294 trigger 0.405rubber 0.263 spider 0.347 vigor 0.191ruby 0.271 steady 0.228 yoga 0.435
Voiceless StopsLabials Coronals Dorsals
Stimulus EC Stimulus EC Stimulus ECcopper 0.103 atom 0.207 acre 0.221copy 0.137 attic 0.319 bacon 0.235epic 0.326 autumn 0.268 bracket 0.352guppy 0.224 beauty 0.379 broker 0.235leopard 0.299 critic 0.300 bucket 0.396opus 0.260 glitter 0.329 circuit 0.340paper 0.179 item 0.347 flicker 0.340puppet 0.364 lettuce 0.262 focus 0.470rapid 0.311 pattern 0.362 khaki 0.223super 0.190 pretty 0.297 package 0.223topic 0.372 stutter 0.276 reckon 0.442viper 0.174 votive 0.221 ticket 0.265
180

7.2.3 CVC Stimuli
Diphthongs[eI] [oÚ] [aI] [aÚ]/[OI]
Stimulus EC Stimulus EC Stimulus EC Stimulus ECbake 0.046 boat 0.054 bike 0.063 bout 0.050base 0.055 coat 0.044 bite 0.044 doubt 0.096cake 0.052 code 0.049 dice 0.069 douse 0.068date 0.051 cope 0.051 fight 0.057 gout 0.047fade 0.059 doze 0.068 height 0.052 pouch 0.085gate 0.055 goat 0.059 hide 0.063 pout 0.044gauge 0.052 hose 0.038 hike 0.053 shout 0.097hate 0.051 poach 0.060 kite 0.035haze 0.042 poke 0.056 sight 0.046 choice 0.243pace 0.041 soak 0.053 site 0.045 poise 0.092pave 0.052 soap 0.069 tide 0.058 voice 0.221shade 0.057 toad 0.057 tight 0.044 void 0.130
Front Vowels[i] [I] [E] [æ]
Stimulus EC Stimulus EC Stimulus EC Stimulus ECbeef 0.060 bid 0.049 bed 0.061 bad 0.051cheat 0.046 bit 0.050 bet 0.038 batch 0.045deed 0.051 dip 0.057 dead 0.069 cat 0.043heap 0.042 fit 0.045 deaf 0.072 chat 0.055heat 0.045 hip 0.043 deck 0.053 fad 0.052peak 0.042 hit 0.039 head 0.068 gash 0.043piece 0.076 kick 0.052 jet 0.057 hat 0.045seize 0.046 pick 0.056 pet 0.038 hatch 0.057sheep 0.048 pitch 0.048 set 0.051 pack 0.047sheet 0.042 sip 0.044 shed 0.055 pad 0.051tease 0.050 sit 0.047 tech 0.047 patch 0.055teeth 0.054 zip 0.058 vet 0.045 vat 0.052
181

Non-Front Vowels[u] [Ú] [2] [a]
Stimulus EC Stimulus EC Stimulus EC Stimulus ECboot 0.051 book 0.091 budge 0.056 botch 0.044chute 0.042 cook 0.092 bug 0.042 cod 0.039coop 0.032 hood 0.066 cub 0.049 cop 0.039goof 0.065 hook 0.090 cuff 0.056 dock 0.056goose 0.086 soot 0.051 cut 0.062 dot 0.039hoop 0.040 duck 0.046 hawk 0.048hoot 0.028 fuss 0.060 hop 0.055pooch 0.018 huff 0.036 hot 0.060poof 0.063 hut 0.051 jog 0.062shoot 0.084 tub 0.063 pop 0.052soup 0.070 tuck 0.052 shot 0.057suit 0.061 tug 0.064 sock 0.056
7.3 Instructions for Experiments 2 – 4
7.3.1 Instructions for Experiments 2 and 4
Welcome Screen
Welcome!
During this experiment, you will listen to pairs of words. For each pair, you
will indicate whether you heard the same word repeated twice, or two different
words.
The words you will hear are not words from any particular language. Each word
has the form “aCa”, where “C” is some consonant. So the vowels in each word
are the same, but the consonant in the middle will change.
This experiment has five parts: a practice session, one long block, and three
182

short blocks. You will have the option to take a break before each block.
Press the red button to begin the practice session.
Practice Instructions
During this session, you will practice responding to the types of words you will
hear during the experiment.
After each pair of words, press the red button if you believe you heard two dif-
ferent words. Press the blue button if you believe you heard two repetitions of
the same word. The experimental software will record your responses and let you
know whether your answer was correct.
Please try to respond promptly to each pair. Although you should try your best,
you’re not expected to respond correctly to every pair of words, either in the
practice session or during the experiment. If you find yourself frequently pausing
while you try to decide on your answer, you’re thinking too much!
The practice session will end once you have responded correctly to a certain num-
ber of pairs, or after five minutes, whichever comes first.
Press the red button to begin.
183

7.3.2 Instructions for Experiment 3
Welcome Screen
¡Bienvenido!
En este experimento, usted escuchara varios pares de palabras. Despues de cada
par, debera senalar si ha escuchado la misma palabra repetida dos veces, o dos
palabras distintas.
Las palabras que oira no son palabras de ningun idioma en particular. Cada
palabra tiene la forma “aCa”, siendo “C” una consonante. Es decir, las vocales
de cada palabra son siempre las mismas, pero la consonante del centro cambia.
El experimento consta de cinco partes: una sesion de practica, una parte larga,
y tres partes breves. Antes de cada parte, tendra la oportunidad de tomar un
descanso.
Para empezar con la primera parte (la sesion de practica), por favor, pulse la
tecla roja.
Practice Instructions
En esta sesion, usted practicara como responder a los pares de palabras que es-
cuchara en el experimento.
Despues de cada par de palabras, pulse la tecla roja si cree que escucho dos
184

palabras distintas. Pulse la tecla azul si cree que escucho la misma palabra dos
veces. El experimento registrara su respuesta y le informara de si era la correcta.
Por favor, intente responder con rapidez. Aunque debe concentrarse lo mejor
que pueda, no se espera que de la respuesta correcta para cada par (ni en la sesion
de practica ni en el experimento). Si se da cuenta de que se toma demasiado
tiempo para decidir que tecla pulsar, ¡se lo esta usted pensando demasiado!
La sesion terminara bien despues de que haya respondida correctamente a un
numero suficiente de pares, bien tras cinco minutos, lo que suceda antes.
Pulse la tecla roja para empezar.
185

Bibliography
R. H. Baayen. Analyzing Linguistic Data: A Practical Introduction to Statistics.Cambridge University Press, Cambridge, 2008.
R. H. Baayen, R. Piepenbrock, and H. van Rihn. The CELEX lexical database.Philadelphia, PA: Linguistic Data Consortium, 1995. Release 2 (CD-ROM).
Laurie Bauer. Lenition revisited. Journal of Linguistics, 44:605–624, 2008.
Jill Beckman. Positional faithfulness. In McCarthy (2004), chapter 16, pages310–342.
Catherine T. Best, Gerald W. McRoberts, and Nomathemba B. Sithole. Exami-nation of perceptual reorganization for nonnative speech contrasts: Zulu clickdiscrimination by English-speaking adults and infants. Journal of ExperimentalPsychology: Human Perception and Performance, 14(3):345–360, 1988.
Juliette Blevins. Evolutionary Phonology. Cambridge University Press, Cam-bridge, 2004.
Paul Boersma and Silke Hamann. The evolution of auditory dispersion in bidirec-tional constraint grammars. Ms., Universiteit van Amsterdam and UniversitatDusseldorf, May 2008.
Paul Boersma and David Weenink. Praat: Doing phonetics by computer, 2007.Version 5.0.03.
Amanda Boomershine, Kathleen Currie Hall, Elizabeth Hume, and Keith John-son. The impact of allophony versus contrast on speech perception. In PeterAvery and B. Elan Dresher, editors, Contrast in Phonology: Theory, Perception,Acquisition, pages 145–171. Mouton de Gruyter, Berlin, 2008.
Lyle Campbell. Historical Linguistics: An Introduction. MIT Press, Cambridge,MA, second edition, 2004.
186
Steven B. Chin and David B. Pisoni. Alcohol and Speech. Academic Press, NewYork, NY, 1997.
G. N. Clements. Feature economy in sound systems. Phonology, 20:287–333, 2003.
Katherine Crosswhite. Vowel Reduction in Optimality Theory. Outstanding Dis-sertations in Linguistics. Routledge, New York, NY, 2001.
Terry Crowley. An Introduction to Historical Linguistics. Oxford University Press,Oxford, third edition, 1997.
Paul V. de Lacy. The Formal Expression of Markedness. PhD thesis, Universityof Massachusetts Amherst, Amherst, MA, 2002.
Edward S. Flemming. Auditory Representations in Phonology, chapter 2: TheDispersion Theory of Contrast, pages 15–51. Outstanding Dissertations in Lin-guistics. Routledge, New York, NY, 2002.
James Foley. Foundations of Theoretical Phonology. Cambridge University Press,Cambridge, 1977.
Gillian Gallagher. Perceptual similarity in laryngeal cooccurrence restrictions. Pa-per presented at the Northeast Linguistics Society 40, Cambridge, MA, Novem-ber 2009.
Matthew Gordon and Ayla Applebaum. Acoustic correlates of stress in TurkishKabardian. Journal of the International Phonetic Association, 40(1):35–58,2010.
Vivian Gourevitch and Eugene Galanter. A significance test for one parameterisosensitivity functions. Psychometrika, 32(1):25–33, 1967.
Naomi Gurevich. Lenition and Contrast: The Functional Consequences of Cer-tain Phonologically Conditioned Sound Changes. Outstanding Dissertations inLinguistics. Garland Publishing, New York, NY, 2004.
John Harris. Segmental complexity and phonological government. Phonology, 7(2):255–300, 1990.
Bruce Hayes. Phonetically driven phonology: The role of Optimality Theory andinductive grounding. In McCarthy (2004), chapter 15, pages 290–309.
Bruce P. Hayes. Phonetically driven phonology: The role of Optimality Theoryand inductive grounding. In Michael Darnell, Frederick J. Newmeyer, MichaelNoonan, Edith Moravczik, and Kathleen Wheatley, editors, Functionalism and
187
Formalism in Linguistics, volume I: General Papers, pages 243–285, Milwaukee,WI, 1999. John Benjamins Publishing Company.
Goran Hellekant. The effect of ethyl alcohol on non-gustatory receptors in thetongue of the cat. Acta Physiologica Scandinavica, 65:243–250, 1965.
Hans Henrich Hock. Principles of Historical Linguistics. Mouton de Gruyter,Berlin, 1986.
Harry Hollien and Camilo A. Martin. Conducting research on the effects of intox-ication on speech. Forensic Linguistics, 3(1):107–128, 1996.
Elizabeth Hume. Predicting metathesis: The ambiguity/attestation model. Ms.,The Ohio State University, January 2003.
Keith Johnson, David B. Pisoni, and Robert H. Bernacki. Do voice recordingsreveal whether a person is intoxicated? Phonetica, 47:215–237, 1990.
Barıs Kabak and William J. Idsardi. Speech perception is not isomorphic tophonology: The case of perceptual epenthesis. Ms., Universitat Konstanz andUniversity of Delaware, 2007.
Shigeto Kawahara. A faithfulness ranking projected from a perceptibility scale:The case of [+voice] in Japanese. Language, 82(3):536–574, September 2006.
Eun-Sook Kim and Douglas Pulleyblank. Glottalization and lenition in Nuu-chah-nulth. Linguistic Inquiry, 40(4):567–617, 2009.
John Kingston. Lenition. In Laura Colantoni and Jeffrey Steele, editors, Se-lected Proceedings of the 3rd Conference on Laboratory Approaches to SpanishPhonology, pages 1–31, Somerville, MA, 2008. Cascadilla Proceedings Project.
John Kingston and Randy L. Diehl. Phonetic knowledge. Language, 70(3):419–454, 1994.
Robert Kirchner. Phonological contrast and articulatory effort. In Linda Lom-bardi, editor, Segmental Phonology in Optimality Theory: Constraints and Rep-resentations, chapter 3. Cambridge University Press, Cambridge, 2001a.
Robert Kirchner. An Effort Based Approach to Consonant Lenition. OutstandingDissertations in Linguistics. Routledge, New York, NY, 2001b.
Patricia K. Kuhl and Paul Iverson. Linguistic experience and the “perceptualmagnet effect”. In Winifred Strange, editor, Speech Perception and LinguisticExperience: Issues in Cross-Language Research, chapter 4, pages 121–154. YorkPress, Baltimore, MD, 1992.
188
Hermann J. Kunzel. Produktion und Perzeption der Sprache alkoholisierterSprecher. In Phonetik und Dialektologie: Joachim Goschel zum 60. Geburt-stag, volume 64 of Schriften der Universitatsbibliothek Marburg, pages 27–53.Universitatsbibliothek Marburg, Marburg, 1992.
Lisa M. Lavoie. Consonant Strength: Phonological Patterns and Phonetic Mani-festations. Outstanding Dissertations in Linguistics. Garland Publishing, NewYork, NY, 2001.
Leland Lester and Royal Skousen. The phonology of drunkenness. In AnthonyBruck, Robert A. Fox, and Michael W. La Galy, editors, Papers from theParasession on Natural Phonology, pages 233–239, Chicago, IL, 1974. ChicagoLinguistic Society.
B. Lindblom. Explaining phonetic variation: A sketch of the H&H theory.In William J. Hardcastle and Alain Marchal, editors, Speech Production andSpeech Modelling, volume 55 of NATO Advanced Science Institute Series D:Behavioural and Social Sciences, pages 403–439. Kluwer Academic Press, Dor-drecht, 1990.
Bjorn Lindblom. Economy of speech gestures. In MacNeilage (1983), chapter 10,pages 217–246.
Bjorn F. Lindblom and Johan E. F. Sundberg. Acoustical consequences of lip,tongue, jaw, and larynx movement. Journal of the Acoustical Society of Amer-ica, 50(4):1166–1179, 1971.
Conxita Lleo and Martin Rakow. Markedness effects in the acquisition of voicedstop spirantization by Spanish-German bilinguals. In James Cohen, Kara T.McAlister, Kellie Rolstad, and Jeff MacSwan, editors, Proceedings of the 4thInternational Symposium on Bilingualism, pages 1353–1371. Cascadilla Press,Somerville, MA, 2005.
Peter MacNeilage, editor. The Production of Speech. Springer Verlag, Berlin,1983.
John J. McCarthy, editor. Optimality Theory in Phonology: A Reader. Blackwell,Oxford, 2004.
Hosung Nam, Louis Goldstein, and Elliot Saltzman. Self-organization of syllablestructure: A coupled oscillator model. In Francois Pellegrino, Egidio Marisco,Ioana Chitoran, and Christophe Coupe, editors, Approaches to PhonologicalComplexity, pages 299–328. Mouton de Gruyter, Berlin, 2009.
189

Maire Nı Chiosain and Jaye Padgett. Contrast, comparison sets, and the per-ceptual space. In Steve Parker, editor, Phonological Argumentation: Essays onEvidence and Motivation, chapter 4. Equinox, London, January 2009.
John J. Ohala. The listener as a source of sound change. In Carrie S. Masek,Roberta A. Hendrick, and Mary Frances Miller, editors, Proceedings of the 17thRegional Meeting of the Annual Meeting of the Chicago Linguistic Society, Uni-versity of Chicago, pages 178–203, Chicago, IL, 1981. Chicago Linguistic Society.
John J. Ohala. The origin of sound patterns in vocal tract constraints. In Mac-Neilage (1983), chapter 9, pages 189–216.
Manjari Ohala and John J. Ohala. Nasal epenthesis in Hindi. Phonetica, 48:207–220, 1991.
Jaye Padgett. Systemic contrast and Catalan rhotics. The Linguistic Review, 26:431–463, 2009.
Jaye Padgett. Contrast and post-velar fronting in Russian. Natural Language andLinguistic Theory, 21(1):39–87, 2003.
Joe Pater. Austronesian nasal subsitution and other NC˚
effects. In McCarthy(2004), chapter 14, pages 271–289.
David B. Pisoni, Moshe Yuchtman, and Susan N. Hathaway. Effects of alcoholon the acoustic-phonetic properties of speech. In Society of Automotive Engi-neers, Inc., editor, Alcohol, Accidents, and Injuries, pages 131–149. Society ofAutomotive Engineers, Inc., Warrendale, PA, 1986.
Marianne Pouplier. The dynamics of error. In Maria-Josep Sole, Daniel Re-casens, and Joaquın Romero, editors, Proceedings of the 15th InternationalCongress of the Phonetic Sciences, pages 2245–2248, Barcelona, 2003. Inter-national Congress of the Phonetic Sciences.
Alan Prince and Paul Smolensky. Optimality Theory: Constraint interaction ingenerative grammar. In McCarthy (2004), chapter 1, pages 3–76.
Thomas Purnell. Cognitive control of vowel space: Evidence from intoxicatedspeech. Paper presented at the Linguistic Society of America Annual Meeting,Baltimore, MD, January 2010.
Daniel Silverman. A Critical Introduction to Phonology: Of Sound, Mind, andBody, chapter 6: The Pull of Phonetics; The Push of Phonology, pages 158–187. Continuum Critical Introductions to Linguistics. Continuum InternationalPublishing Group, London, 2006.
190
Jennifer L. Smith. Making constraints positional: Toward a compositional modelof Con. Lingua, 114:1433–1464, 2004.
Donca Steriade. The phonology of perceptibility effects: The P-map and itsconsequences for constraint organization. Ms., University of California, LosAngeles, 2001a.
Donca Steriade. Directional asymmetries in place assimilation. In Elizabeth Humeand Keith Johnson, editors, The Role of Speech Perception in Phonology, chap-ter 9, pages 219–250. Academic Press, New York, NY, 2001b.
Gregory T. Stump. Non-local spirantization in Breton. Journal of Linguistics, 24(2):457–481, 1988.
Bradford L. Swartz. Resistance of voice onset time variability to intoxiation.Perceptual and Motor Skills, 73:415–424, 1992.
Brian Tiplady, Robin Baird, Henry Lutcke, Gordon Drummond, and Peter Wright.Effects of ethanol on kinaesthetic perception. Journal of Psychopharmacology,19(6):627–632, 2005.
Rosalie M. Uchanski. Clear speech. In David Pisoni and Robert Remez, edi-tors, The Handbook of Speech Perception, Blackwell Handbooks in Linguistics,chapter 9, pages 207–235. Blackwell, Oxford, 2005.
Adam Ussishkin and Andrew Wedel. Lexical access, effective contrast, and pat-terns in the lexicon. Ms., University of Arizona, 2009.
Adam Ussishkin and Andrew Wedel. Gestural motor programs and the nature ofphonotactic restrictions: Evidence from loanword phonology. In Gina Gardingand Mimu Tsujimura, editors, Proceedings of the 22nd West Coast Conferenceon Formal Linguistics, pages 505–518, Somerville, MA, 2003. Cascadilla Pro-ceedings Project.
Mary Ann Walter. Repetition leads to lenition in consonant sequences. In RudolphSock, Susanne Fuchs, and Yves Laprie, editors, Proceedings of the 8th Interna-tional Seminar on Speech Production, pages 209–212, Villiers-les-Nancy, France,2008. INRIA.
Min Qi Wang, Mary E. Nicholson, Beverly S. Mahoney, Yuhua Li, and Mike A.Perko. Proprioceptive responses under rising and falling BACs: A test of theMellanby effect. Perceptual and Motor Skills, 77:83–88, 1993.
191

Hiroshi Watanabe, Takemoto Shin, Hiromichi Matsuo, Fumio Okuno, TsutomuTsuji, Midori Matsuoka, Junichi Fukaura, and Hisashi Matsunaga. Studies onvocal fold injection and changes in pitch associated with alcohol intake. Journalof Voice, 8(4):340–346, 1994.
John R. Westbury and Patricia A. Keating. On the naturalness of stop consonantvoicing. Journal of Linguistics, 22(1):145–166, March 1986.
192