phillips carbon black limited phillips carbon black - at a glance largest cb capacity of 4,72,000 mt...
TRANSCRIPT

Phillips Carbon Black Limited
Power(ful) Growthwww.pcblltd.com May 2014
1

2
RP- Sanjiv Goenka Group
Power & Natural
Resources Carbon Black Retail
Media & Entertainment
InfrastructureIT &
Education

Power & NaturalResources
Retail
Carbon Black
Infratructure
Media & Entertainment
IT & Education
CESC - 4th largest Private Power Utility
Noida Power *- Private Discom in Noida
Integrated Coal Mining * - Pioneer in private sector Coal Mining
Harrisons Malayalam – Largest Plantation company in South India
Spencer`s Retail *- Pioneer in organized food retailing in India
Phillips Carbon Black - Largest in India & 8th largest in world
CESC Properties*- Showcasing East India’s 1st Specialty Mall
Saregama India - Biggest collection of Indian Music
Open* – Weekly current affairs magazine
Firstsource Solutions - Among the top 3 pure play BPO companies in India
Business Sectors Companies
RevenueRs. 140 billion+
* unlisted
RP- Sanjiv Goenka Group – Business Sectors
3
Power & Natural Reources
51%
Media & Entertainment
1%
Carbon Black19%
IT & Education19%
Retail10%

(Rs. bn )
*market cap as on 31st December 2013
Gross
Revenues
(FY`13)
EBIDTA
(FY`13)
Net Profit
(FY`13)
Current
Market cap*
Promoter
Holding
Institutional
Holding
CESC 53.20 14.20 6.18 58.20 52% 35%
Firstsource Solutions 28.20 2.80 1.47 14.51 57% 22%
Phillips Carbon Black 22.80 1.10 (0.20) 2.13 52% 21%
Spencer`s Retail 13.50 (0.78) (2.10) - 100% -
Noida Power Company 8.00 2.73 1.33 - 73% -
Saregama India 1.75 0.28 0.11 1.44 55% 24%
Harrisons Malayalam 3.47 0.25 0.02 0.93 50% 5%
Integrated Coal Mining 3.70 0.36 0.22 - 100% -
Crescent Power 1.24 0.62 0.20 - 100% -
Financials of RP- Sanjiv Goenka Group companies
4

5
Phillips Carbon Black - at a Glance
Largest CB Capacity of 4,72,000 MT p.a. across four locations in India Co –Generation Green Power Plant at each location
Capacity
Largest producer of Carbon Black in India and 7th largest in the World Second fastest growing CB company in the world
Business
Leading tyre companies around the globeCustomers
Exports to 20 countriesExports
Stock Listed on BSE (Code – 506590); NSE (PHILIPCARB)
Rs. 1.9 bn
CB – Overseas (Ba Ria Vung Tau Province in Vietnam) CPP – 8 MW in Mundra Carbo Chemicals Plant in Orissa
Expansion Plans
Cochin unit has been awarded Best Environment Management Co. by
Kerala state Government in 2011 PCBL received “Top Exports” awards for 2011-12
Awards
CRISIL Equities has assigned a valuation grade of 3/5 & fundamental
grade of 3/5 as on Feb’14Ratings
Market Cap As on Mar’14

6
PCBL receives “Top Exports” awards for 2011-12

7
Business Profile
Market Leadership
– Largest producer of CB in India for many
years
- Ranks 7th globally
High quality of R&D setup
- Manufactures all grades for tyre
industry, all four soft grades for plastic
industry
Value creating business model
– Power plants based on tail gas
- Now going for backward integration and
extension to Carbo Chemical business
Being a market leader, PCBL enjoys economies
of scale
Domestic Market Share in FY13
Sl.No Location CB (MT) CPP (MW)
1 Durgapur, W.Bengal 1,52,000 30.00
2 Palej, Gujarat 90,000 12.00
3 Mundra, Gujarat 140,000 24.00
4 Kochi, Kerala 90,000 10.00
Total 4,72,000 76.00
Current installed capacity for CB & CPP
PCBL38%Hi-Tech
38%
Others24%

8
High quality investors in the Company
Business Profile..contd
Shareholding Pattern as on Mar’13
Leading institutional investors include:
National WestMinster Bank PLC
Reliance Capital Trustee Co. Ltd
ACACIA
Birla Sun Life Trustee Company Pvt Ltd
Jupiter South Asia Investment Company Ltd
Max New York Life Insurance Co. Ltd
ICICI Prudential Emerging Star
The Dai – Ichi Life Insurance Company Limited
India Optima Fund
Promoter, 52%
Domestic institutions,
19%
Public, 19%
FII, 10%

9
Business Profile..contd
CB Revenue Split : FY14
Exports – 34%
Domestic – 66%
Increasing Power revenues and export of Carbon Black is improving PCBL’s business model
Carbon Black, 94%
Power,6%
Revenue Split : FY14

Strategic plant locations nearer to customers
Chennai
Apollo, JK, Michelin, MRF
JK
Bridgestone
MRF
Birla
Ceat
Mundra140,000 MT +24 MW
Palej90,000 MT +12 MW
Kochi90,000 MT + 10 MW
Durgapur1,52,000 MT + 30 MW
Head Office,Kolkata
JV for CB Plant in Vietnam
10
Vietnam
Under Execution210,000 MT
Orissa ( Carbo Chemicals)
MRF
Apollo
JK
Ceat
New TyreCapacities
Our CB Plants
Our CarboChemical
Plants

11
Exports to 20 Countries
IRAN
VIETNAM
JAPAN
S. KOREA
TAIWAN
PHILIPPINES
CHINA
AUSTRALIA
NEW ZEALAND
INDONESIA
MALAYSIA
TURKEY
UAE
KENYA
SPAIN
ISRAEL
SRILANKA
BANGLADESH
SINGAPORE
USA

12
Forward Integration - Green Power Generation
Waste gases from plants being used
to produce electricity, Surplus power
sold to grid
CPP at Palej is registered as a CDM
Project with UNFCCC
Waste Gas generated at
the CB Plant
Waste Gas Electricity
Internal plant
requirement
Surplus power
sold to grid
Incineration
Waste Gas Co-
generation plant
earlier
now
Sl.No Location CPP (MW) Year of
Commission
1 Palej, Gujarat 12.00 Mar’05
2 Durgapur, W.Bengal 30.00 Apr’08
3 Mundra, Gujarat 16.00 Dec’09
4 Kochi, Kerala 10.00 Apr’11
5 Mundra, Gujarat 08.00 Jun’12
Total 76.00

Key Milestones
PCBL’s strength lies in both Greenfield & Brownfield expansion
13
Capacity increase:
Mundra : 50,000 MT and 8MW CPP
Durgapur : 12,000 MT
1960 - 2004
Aggressive Growth : Total CB Capacity is 4,72,000 MT and 76 MW CPP
2005 2007 2008 2009 2010 2011 2012 2013
30 MW
CPP at
Durgapur
Golden
Jubilee
Year
MOU for Plant in
Vietnam90,000 MT at
Mundra
16 MW CPP
at Mundra
10 MW CPP
at Kochi
12 MW CPP
at Palej
• Started with Phillips Petroleum Co, USA at Durgapur with 14,000 MT.
• Collaboration with Columbian Chemical; Total Capacity was 78,000 MT
• Acquisition of CB division of Gujarat Carbon Ltd, 25,000 MT; Total Capacity was 1,03,000 MT
• Amalgamation with Carbon & Chemicals, Ltd , Kochi, 40,000 MT; Total Capacity increased to 143,000 MT
Total Capacity by 2004 was 270,000 MT
Capacity Increase:
Cochin: 50,000 MT

14
Tyre capacities coming up in Asia incl. India
High earnings stability due to Backward &
Forward integration, different geographies &
customers
Cost advantages in Asia – CB capacities
shifting to emerging markets
Capacity Consolidation – Smaller players
shutting down plants
Entrepreneurial management team with 50
years experience
High Crude and CBFS prices
Dumping by China and Korea,
At times difficult to pass on 100% price
increase of raw materials to customers
Fluctuation in power prices
Exchange Fluctuations
Growth Drivers Key Risks
Growth Drivers & Risks

15
Tyre Capacity Expansion
Company Location Investment [` bn] Completion by
Apollo Tyres Limited
Tamilnadu and Gujarat
21
Mar-12
Chennai, Tamil Nadu
Vadodara, Gujarat
Balkrishna Industries LimitedBhuj, Gujarat 12 Jun-12
Rajasthan & Maharashtra 2 Sep-11
Bridgestone India P Limited
Chakan, Pune 26 Jan-13
3 Aug-13
Pithampur 1
3 Sep-11
Ceat Limited Halol 7 Jun-11
Ambarnath, Maharashtra 3 Dec-12
Dunlop India Limited Guwahati, Assam 5 Dec-11
Falcon Tyres Limited Haridwar, Uttarakhand 6 Mar-12
JK Tyre & Industries LimitedMysore, Karnataka 3 Aug-11
Sriperumbudur, Tamil Nadu 15 Oct-12
Kesoram Industries Limited
Haridwar, Uttarakhand 10 Dec-12
Haridwar, Uttarakhand 4 Sep-11
Balasore, Orissa 5 Sep-11
MRF Limited
Ankampaly, Andhra Pradesh
38
Sep-11
Trichy Sep-11
Pondicherry Dec-12
Michelin 40 Mar-12
Total 202Source: CMIE, Company

16
Global Carbon Black Demand Break-Up
2010 Forecast (‘000 tonnes)
-
2,000
4,000
6,000
8,000
10,000 Non Tires
Tires
-
2,000
4,000
6,000
8,000
10,000
12,000
14,000
2015 Forecast (‘000 tonnes)

17
Carbon Black-Grades & Uses
The hard grades are used in the tyre surface, which
comes in contact with the road and are subject to
higher friction.
The soft grades are used for the side wall of tyres &
also for plastic industry
Tyre, 65%
Rubber,15%
Belts & Hoses,
10%
Printing Ink & Other
Speciality, 10%
Utilization of carbon black (Sector-wise)

18
Key Investment Highlights
2
1
5
3
4
Forward integration with Green Power generation - improving
value chain for investors
Global leadership in Technological Innovation
Strong customer relationship
Efficient cost management and rationalization process in place
Backward integration with Carbo Chemicals Project

19
Power Generation mitigates commodity risk ₹ mn
9,881 10,182 11,478 11,780
16,141
22,675 21,921 22,122 106 149
155 545
760
894 886
652
-
3,000
6,000
9,000
12,000
15,000
18,000
21,000
24,000
FY07 FY08 FY09 FY10 FY11 FY12 FY13 FY14
Carbon Black Power

20
Efficient Cost Management & Rationalization
Contribution Trend
EBITDA & PAT Margin Trend
( ₹ Bln) FY09 FY10 FY11 FY12 FY13 FY14
Sales Volume (MT) 210,553 255,777 308,605 314,348 293,309 287,838
Revenue - CB 10.60 11.78 16.14 22.68 21.92 22.12
Revenue - Power 0.16 0.54 0.76 0.89 0.89 0.65
Contribution 1.00 2.69 2.94 3.87 2.13 2.40
Contribution (₹ /MT) 4,751 10,531 9,541 9,633 7,248 8,352
-10%
-5%
0%
5%
10%
15%
20%
FY07 FY08 FY09 FY10 FY11 FY12 FY13 FY14
EBITDA (%) PAT(%)

Strong Customer Relationship
Domestic Customers International Customers
21

22
Financial Overview
₹ mn FY09 FY10 FY11 FY12 FY13 FY14
Profit & Loss Statement
Net Sales 11,633 12,350 16,901 21,867 22,849 22,775
EBITDA 245 1,907 2,345 2,339 1,097 461
Depreciation 196 312 386 486 508 537.4
Interest 294 289 316 582 721 802.3
PBT -973 1,310 1,643 1034 (400) -879.1
Tax -325 79 481 160 (194) -13.1
PAT -648 1,230 1,163 874 (206) -866
Balance Sheet
Sources of Funds
Net Worth 2,182 3,244 5,223 5,223 5,891 5,025
Debt 4,256 5,555 5,014 5,081 8,767 6,671
Deferred Tax 17 96 569 520 527 299
Capital Employed 6,455 8,895 10,806 10,824 14,656 11,995
Application of Funds
Net Block 2,280 5,932 5,783 5,783 7,528 8,576
CWIP 3,828 923 2,058 2,059 1,590 674
Investments 378 378 576 582 724 724
Net Working Capital -38 1,662 2,389 2,400 (2,646) 2,022
Miscellaneous Expenditure 7 0 0 0 0 0
Total Assets 6,455 8,895 10,806 10,824 23,025 11,995
Debt/Equity 1.95 1.71 0.96 1.16 1.48 1.328

23
Return to the ShareholdersEPS (Rs) ROCE (%)
Debt – Equity Ratio Debt – EBITDA Ratio
35.37
-24.12
43.43
35.43
25.82
-5.99-25.12-30.00
-10.00
10.00
30.00
50.00
70.00
FY08 FY09 FY10 FY11 FY12 FY13 FY14
1.20
1.95
1.70
0.96
1.16
1.48
1.33
0.50
1.00
1.50
2.00
FY08 FY09 FY10 FY11 FY12 FY13 FY14
1.91
-8.40
2.91 2.14 2.39
13.1614.48
-9
-6
-3
0
3
6
9
12
15
FY08 FY09 FY10 FY11 FY12 FY13 FY14
26%
-12%
21% 20%22%
-3% -0.64%-20%
-10%
0%
10%
20%
30%
FY08 FY09 FY10 FY11 FY12 FY13 FY14

24
Performance Summary
Particulars Q4FY14 Q3FY14 %Change (QoQ) Q4FY13 %Change
(YoY)
Production (MT) 73,867 71,564 3% 66,775 11%
Capacity Utilization(%) 80% 78% - 73% -
Total Sales Volume (MT) 77,298 66,842 16% 69,600 11%
Domestic (MT) 50,635 46,113 10% 48,375 5%
Export (MT) 26,663 20,729 29% 21,225 26%
Rs Crs Rs Rs Crs Rs Rs Crs
Net Sales 594 560 6% 535 11%
EBITDA (before forex) 43 44 -4% 33 27%
EBITDA% 7.2% 7.9% - 6.2% -
PBT 2 -17 - 1.5 -32%
PAT 2 -15 - 4.9 -59%

25
Performance Summary
Particulars FY14 FY13 % Change
Production (MT) 288,676 296,555 -3%
Capacity Utilization(%)78% 83%
Total Sales Volume (MT) 287,839 293,309 -2%
Domestic (MT) 199,100 208,136 -4%
Export (MT) 88,739 85,173 4%
Rs Crs Rs Crs
Net Sales 2277 2285
EBITDA (before forex) 155 119 30%
EBITDA% 6.8% 5.2%
PBT -88 -40
PAT -87 -21

Power Sales
Power Sales (KwH in lacs) Net Sales (` Crs) Net Realization
Q1FY13 792 24.39 3.08
Q2FY13 725 21.04 2.90
Q3FY13 657 19.19 2.92
Q4FY13 550 18.73 3.41
Q1FY14 488 15.54 3.18
Q2FY14 527 17.09 3.24
Q3FY14 528 17.67 3.35
Q4FY14 484 13.68 2.82
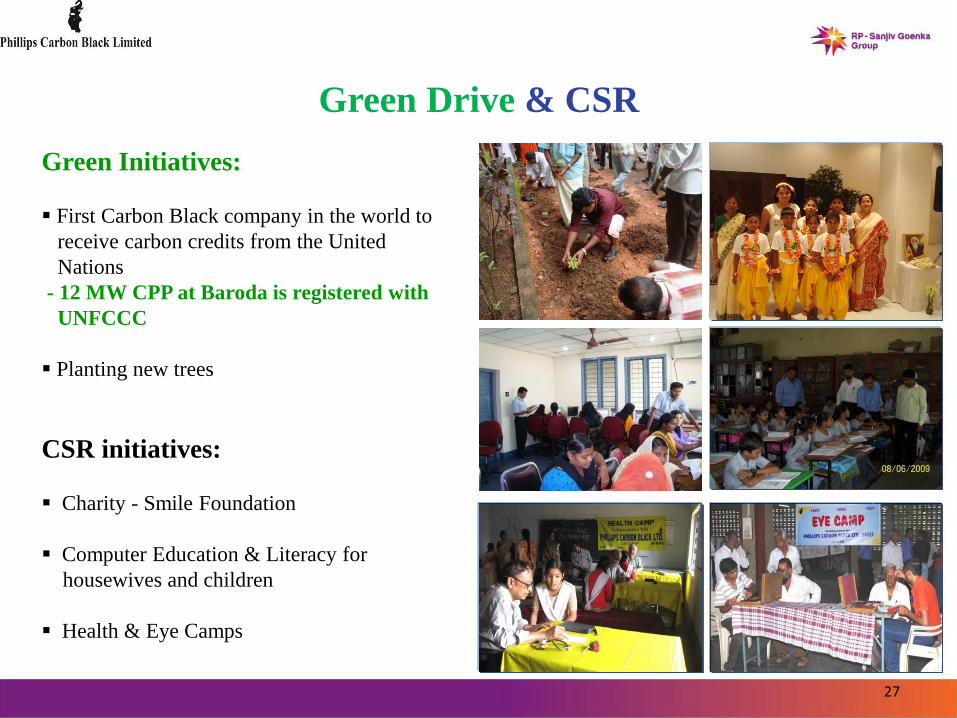
Green Drive & CSR
Green Initiatives:
First Carbon Black company in the world to
receive carbon credits from the United
Nations
- 12 MW CPP at Baroda is registered with
UNFCCC
Planting new trees
CSR initiatives:
Charity - Smile Foundation
Computer Education & Literacy for
housewives and children
Health & Eye Camps
27

28
Thank You