philippines - international university of japan profile 2000 philippines this country profile is a...
TRANSCRIPT
COUNTRY PROFILE 2000
PhilippinesThis Country Profile is a reference tool, which providesanalysis of historical political, infrastructural and economictrends. It is revised and updated annually. The EIU’s CountryReports analyse current trends and provide a two-yearforecast
The full publishing schedule for Country Profiles is nowavailable on our website at http://www.eiu.com/schedule
The Economist Intelligence Unit15 Regent St, London SW1Y 4LRUnited Kingdom

The Economist Intelligence UnitThe Economist Intelligence Unit is a specialist publisher serving companies establishing and managingoperations across national borders. For over 50 years it has been a source of information on businessdevelopments, economic and political trends, government regulations and corporate practice worldwide.
The EIU delivers its information in four ways: through our digital portfolio, where our latest analysis isupdated daily; through printed subscription products ranging from newsletters to annual referenceworks; through research reports; and by organising conferences and roundtables. The firm is a memberof The Economist Group.
LondonThe Economist Intelligence Unit15 Regent StLondonSW1Y 4LRUnited KingdomTel: (44.20) 7830 1000Fax: (44.20) 7499 9767E-mail: [email protected]
New YorkThe Economist Intelligence UnitThe Economist Building111 West 57th StreetNew YorkNY 10019, USTel: (1.212) 554 0600Fax: (1.212) 586 1181/2E-mail: [email protected]
Hong KongThe Economist Intelligence Unit25/F, Dah Sing Financial Centre108 Gloucester RoadWanchaiHong KongTel: (852) 2802 7288Fax: (852) 2802 7638E-mail: [email protected]
Website: http://www.eiu.com
Electronic deliveryThis publication can be viewed by subscribing online at http://store.eiu.com/brdes.html
Reports are also available in various other electronic formats, such as CD-ROM, Lotus Notes, onlinedatabases and as direct feeds to corporate intranets. For further information, please contact your nearestEconomist Intelligence Unit office
London: Jan Frost Tel: (44.20) 7830 1183 Fax: (44.20) 7830 1023New York: Alexander Bateman Tel: (1.212) 554 0643 Fax: (1.212) 586 1181Hong Kong: Amy Ha Tel: (852) 2802 7288/2585 3888 Fax: (852) 2802 7720/7638
Copyright© 2000 The Economist Intelligence Unit Limited. All rights reserved. Neither this publication norany part of it may be reproduced, stored in a retrieval system, or transmitted in any form or by anymeans, electronic, mechanical, photocopying, recording or otherwise, without the prior permissionof The Economist Intelligence Unit Limited.
All information in this report is verified to the best of the author's and the publisher's ability. However,the EIU does not accept responsibility for any loss arising from reliance on it.
ISSN 0269-5979
Symbols for tables“n/a” means not available; “–” means not applicable
Printed and distributed by Redhouse Press Ltd, Unit 151, Dartford Trade Park, Dartford, Kent DA1 1QB, UK

EIU Country Profile 2000 © The Economist Intelligence Unit Limited 2000
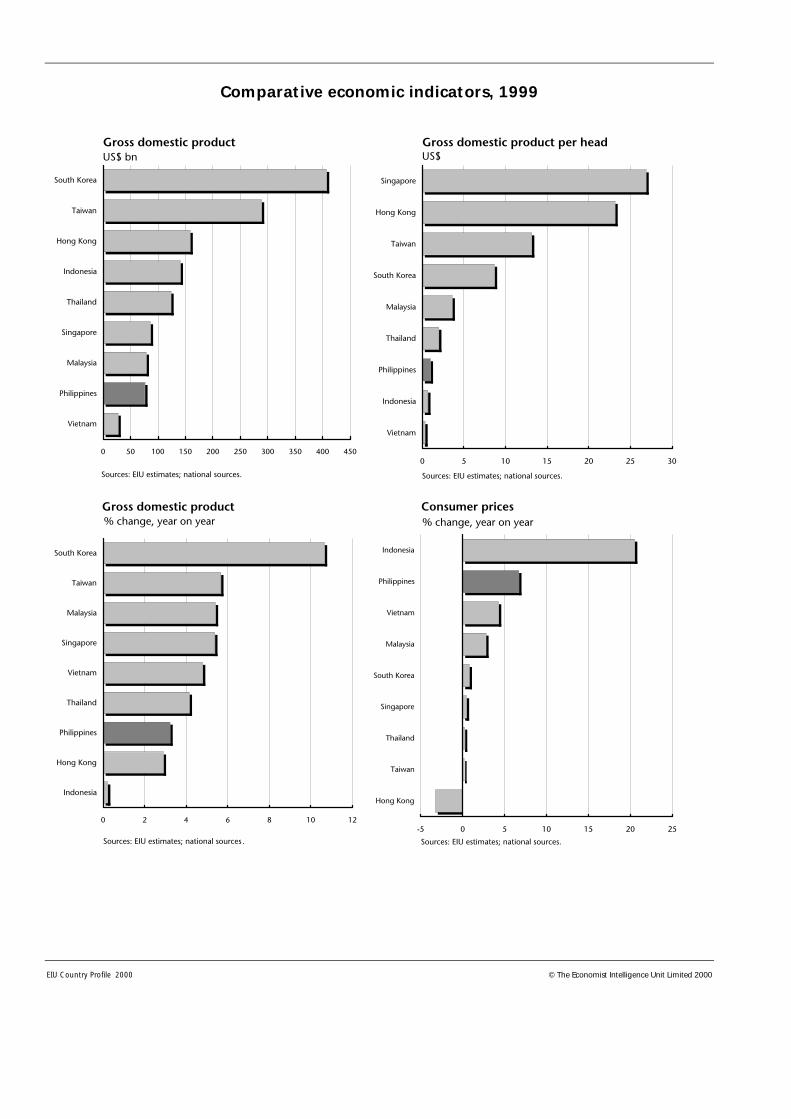
Comparative economic indicators, 1999

1
EIU Country Profile 2000 © The Economist Intelligence Unit Limited 2000
Contents
3 Basic data
4 Political background4 Historical background9 Political forces
12 Constitution and institutions13 International relations and defence
14 Resources and infrastructure14 Population16 Health16 Education16 Natural resources and the environment18 Transport and communications19 Energy provision
20 The economy20 Economic structure21 Economic policy25 Economic performance27 Regional trends
28 Economic sectors28 Agriculture, forestry and fishing30 Mining and semi-processing31 Manufacturing32 Construction33 Financial services34 Other services
35 The external sector35 Trade in goods38 Invisibles and the current account40 Capital flows and foreign debt42 Foreign reserves and the exchange rate
44 Appendices44 Sources of information45 Reference tables45 Population45 Labour force45 Structure of employment46 Transport statistics46 Energy consumption by source47 Trend of government revenue and expenditure47 Outstanding internal public debt47 Money supply and credit48 Interest rates48 Gross domestic product48 Gross domestic product by expenditure49 Gross domestic product by sector
August 1st 2000
2
EIU Country Profile 2000 © The Economist Intelligence Unit Limited 2000
49 Prices and earnings50 Production of major crops50 Meat production50 Output of wood products50 Fishing production51 Minerals production51 Manufacturing production52 Structure of manufacturing industry, 199552 Private construction53 Assets of financial system53 Philippines Stock Exchange indicators53 Visitor arrivals by country of residence54 Exports54 Imports55 Key commodity exports55 Main trading partners56 Direction and composition of trade, 199857 Balance of payments, IMF estimates57 Balance of payments, national estimates58 Foreign equity investment inflows by major country of origin and by sector59 External debt60 Net official development assistance60 Foreign reserves60 Exchange rates

Philippines 3
© The Economist Intelligence Unit Limited 2000 EIU Country Profile 2000
Philippines
Basic data
300,176 sq km, of which 53% is classified as forest (although only 21% isunder forest cover) and 34% is under agricultural cultivation
76.37m (average for first half of 1999: official estimate)
Population in ‘000, 1995
Metropolitan Manila Davao 1,007(National Capital Region) 9,454 Cebu 662 of which: Zamboanga 511Manila (capital) 1,655 Cagayan de Oro 428Quezon City 1,989 Las Pinas 413Kalookan 1,023 Bacolod 402Makati 484 Pasay 368Pasig 471 Iloilo 335Valenzuela 437
Tropical
Hottest month, May, 24-34°C; coldest month, January, 21-30°C (average dailyminimum and maximum); driest month, February, 13 mm average rainfall;wettest month, July, 432 mm average rainfall
Tagalog, English and Spanish; many local dialects
Metric system; also some local units including the picul (63 kg) for sugar andfibres, and the cavan (75 litres) for cereals
Peso (P)=100 centavos. Average exchange rate in 1999: P39.09:US$1. Exchangerate on August 1st 2000: P44.80:US$1
8 hours ahead of GMT
January-December
January 1st; February 25th (Freedom Day); Maundy Thursday; Good Friday;May 1st (Labour Day); May 6th (Araw ng Kagitingan); June 12th(Independence Day); August 27th (National Heroes’ Day); September 11th(Barangay Day); September 21st (National Thanksgiving Day); November 1st(All Saints’ Day); November 30th (Bonifacio Day); December 25th, 30th, 31st
Land area
Population
Main towns
Climate
Languages
Weights and measures
Currency
Time
Fiscal year
Public holidays
Weather in Manila(altitude 14 metres)
4 Philippines
EIU Country Profile 2000 © The Economist Intelligence Unit Limited 2000
Political background
The Philippines is a pluralist democracy modelled on that of the US, with anexecutive presidency, a bicameral Congress and a Supreme Court that can ruleon the constitutionality of government actions. Joseph Estrada was electedpresident in May 1998 for a single six-year term. A pro-administration coalitionhas an overall majority in both the Senate and the House of Representatives.
Historical background
A Spanish expedition led by Ferdinand Magellan first reached the Philippinearchipelago in 1521. European settlement did not begin until more than 40years later, at Cebu (in the central Philippines), but within ten years Spanishcontrol had extended over most of the Visayas and central Luzon, encounteringlittle effective resistance from the indigenous Malay population, which lackedany unified political authority. The principal motivation for Spanish colonialsettlement was religious conversion, and little effort was made to exploit theislands’ economic resources. Only at the beginning of the 19th century wereother Europeans permitted to engage in economic activity. Sugar, coconuts,abaca and tobacco were developed as export crops and became the foundationsof the economy, while a Chinese entrepreneurial class evolved, marrying intothe indigenous population and providing an elite based on land ownership.
Members of the elite took over leadership of a popular rebellion against Spanishrule that broke out in 1896. The struggle continued into early 1898, when theUS intervened. In December 1898 Spain ceded the Philippines to the US.
The new republic inaugurated a month later expected Washington to grantindependence, and when this failed to happen open conflict broke out betweenthe new republic’s army and the occupying forces. A year of fierce resistance bythe Filipinos came to an end in April 1901. Under US colonial rule democraticinstitutions were introduced, Filipinos increasingly took over all political andbureaucratic positions, and English-language education was extended through-out the country. However, the social and economic structure was little changed.In 1934 the Philippines was made an internally self-governing commonwealth,with full independence scheduled for July 4th 1946.
This transition was interrupted by the Japanese invasion in December 1941.The Japanese occupation and the battle for liberation destroyed much of thecountry’s physical infrastructure—Manila was devastated—and left a bitterresidue of charges and countercharges of collaboration. The country resumedits path to full independence, which was achieved on schedule in 1946.
The newly independent republic initially maintained preferential economicrelations with the US. Goods from the Philippines (subject to quota) had duty-free access to the US until 1954, followed by a gradual move to full tariffs by1974. US citizens had parity with Filipinos in the exploitation of the country’snatural resources until 1974. In 1947 the US was granted a 99-year lease on23 bases, including the two major bases at Clark Field and Subic Bay in Luzon.
The colonial andcommonwealth period
An independent republicclosely tied to the US

Philippines 5
© The Economist Intelligence Unit Limited 2000 EIU Country Profile 2000
The new republic had a constitution modelled on that of the US and, as inWashington, power tended to alternate between two parties, the Nacionalistasand the Liberals. The fairly peaceful alternation in power within the politicalelite was interrupted in September 1972 as the president, Ferdinand Marcos,neared the end of his second term. Citing the threat from “subversive forces”,the president imposed martial law.
For the next 13 years, until 1986, the Philippines experienced “constitutionalauthoritarianism”. In a series of elections the president and the party he hadcreated, the New Society Movement (Kilusan Bagong Lipunan, KBL), con-sistently recorded overwhelming popular support, whether or not theopposition participated in the exercise. This owed something to the virtualmonopoly of the media by the president and his close associates, but more tomanipulation and outright cheating at the polls. Opposition, which was neverabsent, was growing throughout Mr Marcos’s rule, but with many of its leadersin detention or voluntary exile the moderate opposition seemed unable tomobilise feeling against the administration and its abuses. The most effectiveopposition came from the communist New People’s Army (NPA), which wasactive in rural areas, and from the southern areas, where a secessionist Muslimmovement had been active since before the beginning of martial law.
The situation changed radically in August 1983, when Benigno Aquino, theopposition leader regarded as the most credible alternative to Mr Marcos, wasassassinated minutes after his return from exile and while under military escort.A series of massive demonstrations followed in which the disenchantment ofthe urban middle class, and notably the business community, was expressed forthe first time. This disenchantment owed much to the “crony” system: thegranting of massive privileges (such as monopoly control of coconut and sugarmarketing) to individuals whose main qualifications were their closeness anddevotion to the interests of the Marcos family.
To reassert his own supremacy, Mr Marcos called an early presidential electionfor February 1986. In a close-run contest he was narrowly defeated by thecandidate of a temporarily united opposition, Corazon Aquino, Mr Aquino’swidow. Mr Marcos’s attempt to hold on to power set off a coup attempt in themilitary, backed by the deputy chief-of-staff, Fidel Ramos, and the defenceminister. This received critically important backing from Mrs Aquino’s People’sPower movement and the local Catholic Church. Under pressure from the US,Mr Marcos went into voluntary exile in Hawaii, where he died in 1989.
Under the new regime civil liberties were restored, political prisoners werereleased and an attempt was made to negotiate with the NPA. A new con-stitution, drawn up by a convention appointed by Mrs Aquino, largely restoredthe set-up abolished by President Marcos in 1972 but with new controls on thepresidency based on the experience of the Marcos years.
The newly restored democracy had a difficult initial period. President Aquinohad been brought to power by a coalition of forces—People’s Power and themilitary—in which deep tensions were inherent. Moreover, Mr Marcos persistedin using his still substantial reserves of money and personal loyalty to destabilise
The Marcos autocracy
The return to a freedemocracy

6 Philippines
EIU Country Profile 2000 © The Economist Intelligence Unit Limited 2000
the regime. From July 1986 there was a series of attempted coups and rumoursof coups, more or less credible, in which elements of the military were involved.In all cases the loyalty of the then chief-of-staff, Mr Ramos, was critical.
Meanwhile, the reform hopes of the early days faded. The much-vaunted landreform was stalled by bureaucratic delay and landlord opposition, widespreadcorruption continued (although the president was not touched by allegationsof misconduct herself), and the government was perceived as ineffectual.
However, the Aquino presidency did achieve a fundamental objective: thetransfer of presidential power at the end of the constitutional term, bydemocratic means and in a comparatively peaceful manner (for thePhilippines). Moreover, the election of Mr Ramos in May 1992 ensured thecontinuation of the political and economic policies of the Aquino admin-istration and was well received by the country’s main foreign creditors and thelocal business community. Within months of coming to office Mr Ramos hadbuilt up a large pro-government majority in Congress, secured a cessation ofhostilities by dissident military groups and begun the process of peacenegotiations with both communist and Muslim secessionist rebels. A ceasefirewas agreed with the Muslim rebels in late 1993, while the communistinsurgency began to weaken, as fissures in the leadership emerged and activemembership fell. Although deep-rooted economic and social problemsremained largely unresolved, the resumption of economic growth and theprospect of its maintenance at more robust levels enhanced the president’spopularity. An electoral pact between the president’s party, Lakas, and the pro-government party of the Aquino period, the Laban ng Demokratikong Pilipino(Laban), delivered a strong majority for the president in the mid-termcongressional election in May 1995.
Important recent events
September 1996: Peace agreement signed with the main Muslim secessionistmovement in Mindanao.
November 1996: Congress approves the most controversial component ofthe comprehensive tax reform package, on excise taxation.
November 1997: Congress approves income tax reform.
May 1998: The anti-administration candidate, Joseph Estrada, comfortablywins the presidency out of a field of ten.
August 1998: Eduardo Cojuangco, the Marcos “super-crony” and founder ofthe main party backing Mr Estrada, regains control of the country’s leadingfood conglomerate.
September-October 1999: Lucio Tan, reputedly the biggest financial backerof the Estrada candidacy, gains a 48% stake in a leading commercial bank,largely through buying up the government’s share option.
April 2000: Breakdown of peace negotiations with the main remaining activesecessionist movement in Mindanao.
Political stability
Philippines 7
© The Economist Intelligence Unit Limited 2000 EIU Country Profile 2000
With his dominance in Congress thus reconfirmed, the president came underincreasing pressure from some of his supporters to stand for a second term in1998. However, this would have required a revision of the 1987 constitution (seeConstitution and institutions), and was strongly opposed by the CatholicChurch, opposition politicians and some prominent members of the businesscommunity, all of whom were alive to the dangers of another president abusingthe spirit of the constitution as Mr Marcos had done. The persistent speculationabout the president’s intentions (he had consistently stated that he planned tostep down in 1998) was finally put to rest when he endorsed Jose de Venecia, thesecretary-general of Lakas, as his nominee in November 1997.
Despite the inherent advantage of being the administration’s candidate, Mr deVenecia was beaten by a wide margin by the very popular vice-president andformer film star, Mr Estrada. Mr Estrada, who was backed by an alliance of thetwo opposition parties, the Nationalist People’s Coalition (NPC) and Laban(which had broken away from its pact with Lakas), won 40% of the votecompared with 16% for Mr de Venecia. The Lakas candidate for the vice-presidency, Gloria Macapagal Arroyo, won even more resoundingly, with 50%support. The coalition backing Mr Estrada won only around 60 of the 208directly elected seats in the House of Representatives, but as the party of thepresidential incumbent, renamed Laban ng Masang Pilipino (LAMP), it attractedenough defections from Lakas to build a majority in the lower house by the endof 1998.
The worst fears of a lurch towards populist policies were not borne out in thefirst 18 months of the Estrada administration as it maintained the macro-economic targets and liberalising stance of its predecessor (see Economic policy).But there have been adverse developments. Policy formulation andimplementation are often incoherent and unco-ordinated, as Mr Estrada’shands-off style gives scope for competition between members of his innercircle—including people with no formal responsibility in government.Cronyism has shown signs of revival (see box on page 8). Unease wascompounded by the president’s proposal that the constitution be amended,exclusively—he claimed—to change those clauses that restrict the scope forforeign investment. There was a widespread suspicion that the president—or hisallies—would use the opportunity to change the political clauses that set termlimits on elective office. These factors, plus the inevitable disappointment afterthe very high expectations raised by an avowedly pro-poor president, caused asharp fall in the president’s popularity in the second half of 1999. Whereas hisapproval rating was 78% in June in one respected poll, by December this wasdown to 44%: those expressing dissatisfaction had risen from only 12% in Juneto 38% in December. In a bid to halt this slide, in January 2000 the presidentshelved his proposal to amend the constitution. To improve the consistency ofpolicy formulation, an Economic Coordinating Council was set up, headed byMr Estrada and including the governor of the Bangko Sentral ng Pilipinas (BSP,the central bank) and leading economic ministers and presidential advisers.
President Ramos stepsdown
The new president wins thepopular mandate
His position slips by late1999

8 Philippines
EIU Country Profile 2000 © The Economist Intelligence Unit Limited 2000
Cronyism: a spectre returns
The patronage system pervades the Philippine political, economic and socialstructure; a favour granted merits a favour in return. At a moderate level thiscan be a benign feature, preserving social stability. But in the recent past thePhilippines has experienced a very extreme case, in the form of the cronycapitalism exercised by the president, Ferdinand Marcos, over a period of morethan 20 years. Ownership and control of the economy were concentrated in thehands of the president’s family and a coterie of cronies. Government mono-polies were exercised by a few friends of the president. Subsidies andpreferential access to bank credit and government guarantees were extended tocompanies controlled by crony interests.
This structure was dismantled when Corazon Aquino took power in February1986, but the system was never eliminated and the Philippines retained itsplace high up in the international league table of corruption. But since JosephEstrada took office in July 1998 there have been clear signs that cronycapitalism is coming back—in complete opposition to the trend in a number ofother countries in the region.
A number of very wealthy individuals—some of them former Marcos cronies—are doing extremely well out of their financial backing for Mr Estrada’s campaignfor the presidency. Eduardo Cojuangco was allowed to exercise the voting rightsof shares sequestrated by the government and so regain control of the country’sleading food conglomerate, the San Miguel Corporation. He is now trying tosecure the title to assets acquired by a fund drawn from a levy on coconut farmersduring the Marcos administration. The tax authorities have effectively aban-doned a multibillion peso tax evasion suit against another prominent backer ofMr Estrada, Lucio Tan. Mr Tan’s attempts to restore the fortunes of PhilippineAirlines (PAL), of which he is the majority owner, are aided by the government’srevocation of its air agreement with Taiwan, whose airlines have been cuttinginto PAL’s market share. New cronies have also emerged. Mark Jimenez, abusinessman who fled the US after he was indicted on charges of making illegalcampaign contributions, tax evasion and fraud, has been acting as adviser toPresident Estrada while brokering very large business deals (out of which hereportedly did very well) and being “consulted” by a state pension fund.
As early as July 1999 a survey of 104 leading business executives citedcorruption and influence peddling as the most negative feature of the Estradaadministration. The situation has deteriorated since.
In September-October 1999 Mr Tan acquired the government’s share option ina leading commercial bank, Philippine National Bank (PNB), giving him a near-50% stake, which put him in pole position to acquire the residual governmentstake that is due to be sold off in April 2000. Both the World Bank, which haslinked the release of funding for structural banking reform to the privatisationof PNB, and the IMF have demanded transparency in the disposal process. Thejustice minister who insisted on pursuing the tax suit against Mr Tan andrecommended meeting the US request for Mr Jimenez’s extradition wasremoved in the cabinet change in January 2000. Most damaging of all,President Estrada has intervened in a recent investigation by the US Securities
Philippines 9
© The Economist Intelligence Unit Limited 2000 EIU Country Profile 2000
& Exchange Commission (SEC) of alleged insider trading and sharemanipulation by another close friend and campaign financier, Dante Tan.According to the head of the SEC, the president contacted him on fouroccasions urging him to clear Mr Tan. This episode sends out extremelynegative signals to potential investors, domestic and foreign, when thePhilippines is lagging behind the recovery in other economies in the region.
Political forces
Political parties in the Philippines are based on personalities rather thanideologies. All those represented in Congress support the existing political andsocial structures, espouse a market economy (until it threatens sectoralinterests), and are nationalistic, to varying degrees. There are thus constantshifts of allegiance. The president tends to attract a greater following inCongress than the election results would indicate, at least in the early years ofthe term. In the final years of a presidential term of office the parties tend tosplinter as presidential hopefuls emerge and the president has only limitedpatronage to offer.
As of mid-2000 there was one dominant, pro-administration party in Congress(based on two established parties) and the remnants of older parties, includingthe pro-administration party under the previous presidency.
Laban ng Masang Pilipino (LAMP) is the pro-administration coalitionformally created in August 1998 out of the parties which backed Mr Estrada’scandidacy. LAMP candidates won 60 seats in the election, but its membership inthe lower house had reached a reported 195 by the end of 1998. As of early 2000its following there was put at around 170, while in the Senate (where partylabels are of little significance) LAMP had 12 supporters and no cohesiveopposition. The two parties that form the core of LAMP are the following.
The Nationalist People’s Coalition (NPC), originally formed to support thepresidential candidacy of Mr Cojuangco in 1992. The NPC initially teamed upwith Lakas in support of President Ramos, but became the official oppositionafter Laban agreed an electoral pact with the pro-administration party, Lakas,in 1994. It backed Mr Estrada’s presidential candidacy and its former leader inthe lower house, Ronaldo Zamora, was given the key post of executivesecretary in the new administration.
Laban ng Demokratikong Pilipino (Laban), formed in 1988 to back theAquino presidency. After the 1992 elections its position as the largest party inthe House of Representatives soon collapsed owing to defections to the newadministration party, Lakas. The May 1995 poll left it with only 27 members inthe lower house, while its majority in the Senate split into pro-government andopposition blocs. In December 1997 the party gave its support to Mr Estradaafter its leader, Edgardo Angara, abandoned his own presidential ambitions torun as the vice-presidential candidate of the opposition. Mr Angara did verybadly, and Laban did not recover ground in the lower house. It has nowvirtually lost its separate identity in LAMP.

10 Philippines
EIU Country Profile 2000 © The Economist Intelligence Unit Limited 2000
Now the opposition, Lakas ng Edsa-National Union of ChristianDemocrats (Lakas) was formed in 1992 to support the candidacy ofMr Ramos. Its strength in the House of Representatives rose from 50 membersin the May 1992 congressional elections to a peak of 155 by late 1997. Itsfollowing in the House eroded very rapidly after the May 1998 elections, fallingfrom 112 members following the vote to fewer than 20 by the end of the year.In the Senate, where it had always been in a minority, its representation in late1999 was down to three.
Outside the mainstream of congressional politics are political forces for whichideology is the determining factor.
The National Democratic Front (NDF) is the umbrella organisation for theMaoist Communist Party and its military wing, the New People’s Army(NPA). The Philippines has a long tradition of rural rebellion, and the NPA,founded in 1969, took up the fight waged by the Hukbalahap rebel movementin Luzon in the mid-1950s. The NPA expanded rapidly under martial law, thenumber of its regulars rising to an estimated 25,000 by mid-1985. It was thenthought to control one-fifth of the country’s villages and to be active in 60 ofthe 75 provinces, as well as in the Manila region. Its attachment to the Maoistdogma that revolution must come from the countryside meant that it playedno role, as an organisation, in the overthrow of Mr Marcos. The post-Marcosregimes eroded its popular base by offering amnesties, legalisation of theCommunist party (in late 1992), and land and jobs to surrendered rebels, whilemaintaining an active military campaign. In mid-1999 its numbers wereestimated at some 8,000. The movement is now riven by disputes on strategyand tactics, but its roots are likely to remain strong as long as income and landdistribution are so grossly uneven.
Another, more heavily armed but less cohesive, rebel movement is the Muslimsecessionist rebellion in Mindanao. The main group is the Moro NationalLiberation Front (MNLF), which was estimated by military sources to have17,000 active members in late 1995. Vying with it for primacy is the MoroIslamic Liberation Front (MILF), which has a religious appeal and isthought to have a smaller following (of 6,000-10,000), more widely dispersedthroughout the region. Unlike the NPA, the Muslim rebels have receivedsupport from foreign sources. The secessionist movement has a historystretching back several centuries. There is no easy solution since immigrationfrom Luzon and the Visayas in the 1950s and 1960s has created a Christianmajority—or near parity—in a number of Mindanao’s provinces. Thus a pro-posal to grant regional autonomy to Mindanao found favour in a referendumin 1989 in only four of the 13 provinces.
One of the major achievements of the Ramos administration was the peacesettlement agreed with the MNLF in September 1996. It provides for atransition to an autonomous entity within an integral Philippines, setting upan administrative body, the Southern Philippines Council for Peace andDevelopment (SPCPD), covering the whole of Mindanao and advised by a con-sultative assembly of local officials and representatives of non-governmentalorganisations. After the SPCPD had operated for three years (until September1999), the whole region was due to vote on whether the council should
Philippines 11
© The Economist Intelligence Unit Limited 2000 EIU Country Profile 2000
become its autonomous government. This poll has been postponed, at theurging of the MNLF leader, governor of the four autonomous provinces andhead of the SPCPD, Nur Misuari, because peace has not yet delivered the eco-nomic benefits that might induce the other provinces to opt for autonomyunder his aegis. The situation is complicated, moreover, by the refusal of theMILF to recognise the validity of the 1996 peace settlement and its continuingdemand for an independent Islamic state. Technical-level discussions betweenthe government and the MILF started in late 1998 against the background of ade facto, though frequently breached, ceasefire. This ceasefire seemed to havebroken down definitively in April 2000 after government forces sought toremove MILF checkpoints on a stretch of highway leading to the rebels’ mainbase at Camp Abubakar in Maguindanao. The MILF called off the negotiationsthat were due to resume in mid-May. The situation was complicated by asimultaneous upsurge in activity by a much smaller, more extremist, group,Abu Sayyaf, involving two sets of kidnappings: one of a group from a localschool and the other of foreign tourists from a Malaysian resort, whose purposeseems to be to win both publicity and ransom money.
Another important political force is that represented by the Catholic Church. Itplayed an active part in the civilian opposition to the Marcos regime andhelped the military rebellion to victory by bringing the population out on tothe streets of Manila in its support. Although it was compromised when itshead in the Philippines, Cardinal Jaime Sin, overtly supported an unsuccessfulcandidate in the 1992 presidential election, the Catholic Church was asignificant force in opposition to any extension of President Ramos’s term inoffice. It avoided endorsing any specific candidate in 1998, although itsdistaste for Mr Estrada was evident, and it took the lead in opposition to hisproposal for constitutional change.
Main political figures
Joseph Estrada: President, elected in May 1998 for a six-year term, withstrong popular backing that was sharply eroded over the second half of 1999.
Gloria Macapagal Arroyo: Vice-president, elected with more than 50% ofthe vote as the candidate of the previous administration. Appointed to thesecond-rank portfolio of social welfare, she has maintained a studiously loyalstance, while tacitly distancing herself from the defects of the Estrada regime.She is seen to have strong potential in the next presidential election.
Ronaldo Zamora: Executive secretary to the president, former head of theNationalist People’s Coalition (NPC) in the House of Representatives andbrother of the president’s campaign manager in 1998. One of the main playersin an administration marked by a lack of presidential direction. Member of theEconomic Coordinating Council (ECC).
Rafael Buenaventura: Governor of the Bangko Sentral ng Pilipinas (BSP, thecentral bank), who has assumed a high-profile role in economic policy sincetaking up the post in July 1999. He clashed with the finance minister of thetime, Edgardo Espiritu, on interest rate policy. Member of the ECC.

12 Philippines
EIU Country Profile 2000 © The Economist Intelligence Unit Limited 2000
Jose Pardo: Former trade minister, who replaced Mr Espiritu in a cabinetreshuffle in January 2000, and is thought to be closer in thinking to the centralbank governor. Now ex officio deputy head of the ECC.
Edgardo Angara: Unsuccessful running mate to Mr Estrada and former headof Laban, with a strong background in economic policy formulation. Aftercompleting one year out of governmental office, in May 1999 he wasappointed agricultural secretary. Member of the ECC.
Eduardo Cojuangco: Extremely wealthy former crony of Ferdinand Marcos,founder of the NPC as his vehicle for a presidential bid in 1992 and a criticallyimportant political and financial backer of Mr Estrada’s presidential campaignin 1998.
Lucio Tan: Another former Marcos crony and Estrada campaign backer, whohas seen a tax evasion case effectively abandoned and his corporate interestsflourish under the present administration.
Cardinal Jaime Sin: Head of the Catholic Church in the Philippines. Caninfluence, but not direct, the vote of the 85% of the population who areCatholic.
Organised labour has little power. Only around one in five workers was in atrade union in the late 1990s, although the rate is significantly higher in multi-national firms, where around one in three was unionised. A tiny proportion(only 4% of the 11.8m salaried workers in the mid-1990s) has collectivebargaining agreements. This reflects the weak bargaining position of workers ina labour surplus economy.
Constitution and institutions
The constitution introduced in 1987 provides for a single six-year presidentialterm. The president is chief executive, head of state and commander-in-chief.The legislature is bicameral, with a Senate of 24 members elected “at large” (ona nationwide ballot) and a House of Representatives composed of 208 membersdirectly elected by district and up to 52 members chosen by party list. Senatorshave six-year terms and representatives three-year terms. The president mayimpose martial law for no longer than 60 days, and the decree proclaiming itcan be revoked by Congress. The president may not abolish Congress and hisveto can be overridden by a two-thirds majority in the legislature. Thejudiciary, which is independent of the executive, rules on the constitutionalityof presidential decrees. A permanent, independent commission oversees com-pliance with a bill of rights contained in the constitution.
The president selects the members of the cabinet but, in line with the separationof powers, they must be outside Congress. All cabinet appointments require con-gressional approval, but, once approved, the incumbent can be removed only bythe president. Areas of policy that straddle departmental responsibility tend to betreated in cabinet committee; privatisation and infrastructure projects areleading examples. This does not, however, eliminate interdepartmental conflictsof interest, such as that between the Department of Finance and the Department

Philippines 13
© The Economist Intelligence Unit Limited 2000 EIU Country Profile 2000
of Trade and Industry on the issue of tax incentives for investment or thatbetween the environment and energy departments on the siting of power plants.The National Economic Development Authority (NEDA), headed ex officio by theplanning secretary, is intended to co-ordinate policy and decisions in all areasrelevant to the economic development plan. The planning secretary also sits onthe Economic Coordinating Council (ECC), set up in January 2000, withresponsibility in “urgent matters relating to the country’s economic recovery”and power to overrule decisions in any other government agency.
Traditionally, government in the Philippines has been highly centralised.However, the 1987 constitution made provision for the establishment ofautonomous regions in two areas with distinctive historical and culturalheritages—the Cordillera region of northern Luzon and Mindanao—if the localpopulation voted by referendum for this status. Both autonomous regions havenow been established, although the autonomous region in Mindanao islimited to the four, out of 13, provinces that voted for it. The autonomousauthorities have powers in the areas of personal and property relations,regional and urban planning, education, and economic and social develop-ment. The Local Government Code of 1991 also devolved some fiscal powers,in the form of the oversight and control of government spending, to localgovernments.
International relations and defence
A continuing foreign policy priority has been the strengthening of relationswith fellow members of the Association of South-East Asian Nations (ASEAN).Membership of this organisation gives the Philippines an Asia-Pacific identityindependent of the US umbrella.
Another priority for the Philippine government is participation in a regionalforce to counterbalance China, which is seen as a threat, most recently in thedispute over the Spratly Islands in the South China Sea. Relations with the USadministration retain a special character and significance, even as thePhilippines seeks to diversify its relations, notably with Europe.
The US has retained a special relationship, both political and economic, withthe Philippines since independence. The US administration has on a numberof occasions played a pivotal role in domestic political affairs in recent years,inducing Mr Marcos to leave the country in February 1986 and backing theAquino administration against coup attempts (on one occasion with militaryaircraft). The Philippines was home to two of the US’s most important militarybases outside US territory, the naval facility at Subic Bay and the nearby airbase at Clark Field. The non-renewal of the lease on the military bases when itexpired in 1991 was the most open sign of the Philippines’ emerging “Asian”identity. Nevertheless, the US remains a leading source of private investment inthe Philippines, reflecting links forged during the colonial period and the earlydecades of independence; it has by far the largest Filipino community outsidethe Philippines; and its culture remains dominant. A special militaryrelationship remains in place by virtue of the Mutual Defence Treaty, under
Relations with the US
14 Philippines
EIU Country Profile 2000 © The Economist Intelligence Unit Limited 2000
which the US administration pledges to defend the territorial integrity of thePhilippines; and military equipment is almost wholly of US origin, althoughthis may change.
Although the support of the military was one of the pillars of the Marcosregime, and its discontent helped to foster serious instability under hissuccessor, the defence forces have traditionally accounted for a small share ofgovernment budget spending. Their numbers are fairly small compared withthose of other countries in the region. Their equipment is outdated andinappropriate to the country’s real needs. In 1995 the Ramos administrationinitiated a programme of modernisation and re-equipment, shifting the focusof the security forces from counter-insurgency—which has tended to be a low-technology, high-manpower activity—to external defence. The first five yearsof the P332bn (US$12.9bn at the 1995 exchange rate of P25.71:US$1) 15-yearprogramme envisaged buying a fighter squadron, naval patrol boats and anindependent nationwide radar system, and reducing military personnel fromaround 110,000 to 100,000. However, the depreciation of the peso since mid-1997 has raised the local cost of a programme initially expected to absorbP50bn in its first five years, and the deterioration in the fiscal balance in 1998has brought both the targets and the schedule into question. As of late 1999only P9.1bn had been allocated to this programme.
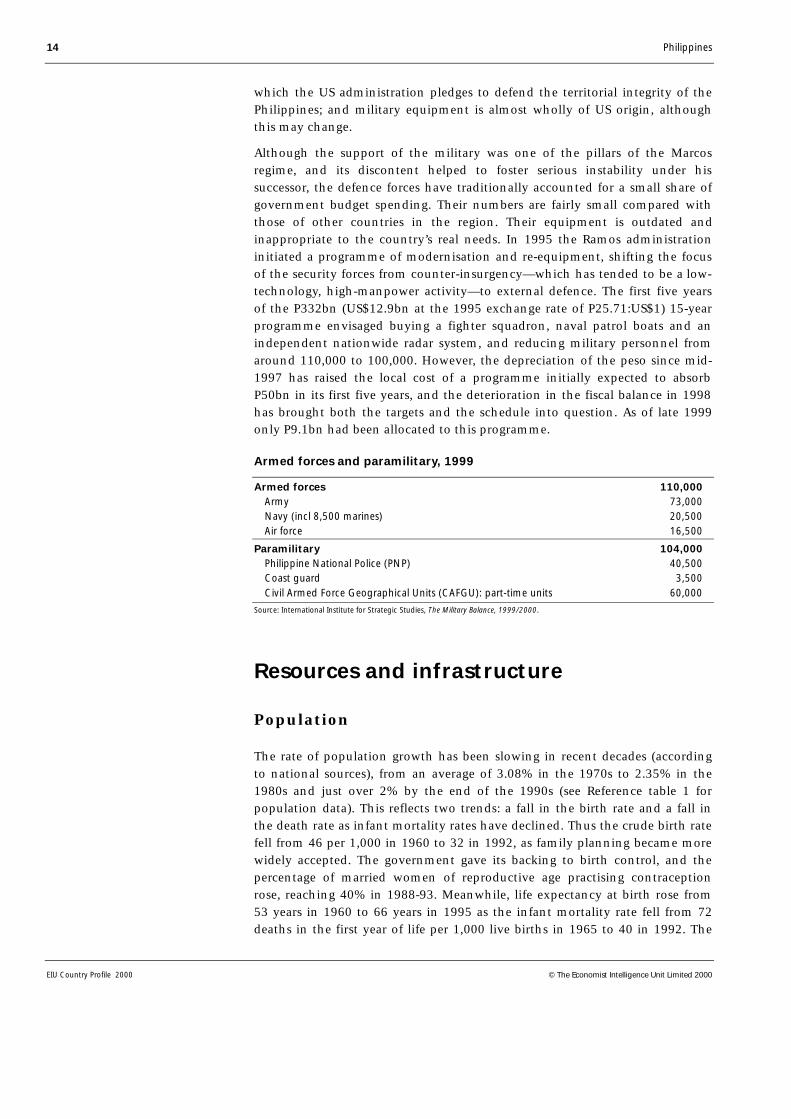
Armed forces and paramilitary, 1999
Armed forces 110,000 Army 73,000 Navy (incl 8,500 marines) 20,500 Air force 16,500
Paramilitary 104,000 Philippine National Police (PNP) 40,500 Coast guard 3,500 Civil Armed Force Geographical Units (CAFGU): part-time units 60,000
Source: International Institute for Strategic Studies, The Military Balance, 1999/2000.
Resources and infrastructure
Population
The rate of population growth has been slowing in recent decades (accordingto national sources), from an average of 3.08% in the 1970s to 2.35% in the1980s and just over 2% by the end of the 1990s (see Reference table 1 forpopulation data). This reflects two trends: a fall in the birth rate and a fall inthe death rate as infant mortality rates have declined. Thus the crude birth ratefell from 46 per 1,000 in 1960 to 32 in 1992, as family planning became morewidely accepted. The government gave its backing to birth control, and thepercentage of married women of reproductive age practising contraceptionrose, reaching 40% in 1988-93. Meanwhile, life expectancy at birth rose from53 years in 1960 to 66 years in 1995 as the infant mortality rate fell from 72deaths in the first year of life per 1,000 live births in 1965 to 40 in 1992. The

Philippines 15
© The Economist Intelligence Unit Limited 2000 EIU Country Profile 2000
comparatively high rate of population growth means that the Philippines has ayoung population, 51% being under the age of 20 in 1990.
Population density is high in metropolitan Manila and neighbouring areas ofcentral Luzon, whereas Mindanao, Negros and the other southern islands aresparsely populated. There have been two significant trends in populationmovement in the past 30 years. First, the proportion of the population livingin rural areas has decreased, from 70% in 1960 to 56% in 1992, while theurban population has grown by just under 4% per year on average during theperiod. The second trend is the migration to the agricultural frontier areas inMindanao, despite the unrest in that region. Competition from migrants forland has significantly contributed to the unrest.
Population by region
Annual average1995 % change
(‘000) 1990-95
LuzonNational Capital Region 9,454 3.52Cordillera Administrative Region 1,255 –2.00Ilocos 3,804 1.38Cagayan Valley 2,536 1.60Central Luzon 6,933 2.24South Tagalog 9,941 3.69Bicol 4,325 2.02
VisayasWestern Visayas 5,777 1.38Central Visayas 5,015 1.76Eastern Visayas 3,367 1.94
MindanaoWestern Mindanao 2,795 2.55Northern Mindanao 2,483 2.45Southern Mindanao 4,604 2.78Central Mindanao 2,360 3.28Autonomous Region of Muslim Mindanao 2,021 1.91Caraga 1,942 1.92
Total 68,612 2.32
Source: Census reports.
There has also been significant migration out of the country—both permanentand temporary (in the form of overseas employment under contract), whichhas held down both the population resident in the Philippines and the rate ofunemployment (see Reference tables 2 and 3 for data on employment). Thismovement has been made feasible by the population’s familiarity with Englishand the comparatively high standard of education. Registered emigration hasbeen running at around 63,000 per year since 1990, with the US by far theleading destination, accounting for around two-thirds of the number. Overseasemployment represents an important outlet for the excess labour force and is amajor source of income for Philippine households. The number of contractworkers deployed each year fluctuates with conditions in host countries, butthe annual average was some 644,000 in the decade of 1989-98, or ten timesthe number emigrating each year. The great majority of placements (74% of
16 Philippines
EIU Country Profile 2000 © The Economist Intelligence Unit Limited 2000
the total of 755,684 in 1998) are for land-based employment. The Middle Eastwas traditionally the leading destination by a wide margin, with openings inboth construction work and private services. From the beginning of the 1990s,however, Asia grew in significance as a destination, and in 1997 it briefly edgedahead of the Middle East, with 42% of land-based placements compared with39.5%. The contraction in regional economies brought Asia’s share back tosecond place in 1998.
Health
Overall healthcare provision is inadequate for the needs of the country, andWorld Bank data indicate a deterioration since the mid-1980s in terms of thenumbers of doctors and nurses per 10,000 of the population (to 1.5 and 3.6respectively in 1989-90). To some extent, as in the case of education, thisreflects budgetary constraints. Spending on public health in the Philippinesaveraged only 1.3% of GDP in 1990-95, a smaller proportion than in most othercountries in the region. But the situation is worsened by the skewed distributionof health facilities throughout the country. About half of all doctors are in theNational Capital Region (NCR), where each health centre covers an average of14,200 people, compared with 21,000-44,000 in other regions. Moreover, thepoor road infrastructure in the rural areas of the poorer provinces limits theaccess of large numbers of the population to such facilities as exist.
Education
Education standards are fairly high. Of the population aged over 15, 90% areliterate. In 1990 some 99% of children of the relevant age were enrolled inprimary and 73% in secondary schools. There is a fairly high level of tertiaryeducation: 27% of the relevant group were enrolled in 1990.
However, the situation is not as good as these figures indicate. About one-fifthof the adult population is thought to be functionally illiterate (they cannot reador write with any fluency) because, although there has been universal enrol-ment at the primary level for over two decades now, nearly one-third of primaryschool pupils do not complete their education. This national figure alsoconceals the familiar disparity between Manila and the poorer provinces: in theformer nearly 100% complete their primary education, in the latter only around30% do so. This reflects factors including general underinvestment in educationas this sector has fallen victim to the squeeze on government spending. Inaddition, the state’s percentage contribution to primary education costs hasfallen in recent years whereas its contribution to tertiary education has risen.
Natural resources and the environment
The Philippines is one of the largest island groups in the world, numberingmore than 7,100 islands and extending 1,851 km north to south and 1,107 kmeast to west. The topography is very varied and includes two mountain rangesin Luzon and several volcanoes, 21 of them active, throughout the country.
Philippines 17
© The Economist Intelligence Unit Limited 2000 EIU Country Profile 2000
The climate is tropical, with some variation in the extent and duration of thedry season. In the western parts of Luzon, Mindoro, Negros and Palawan (thewestern rim) there are two pronounced seasons: dry from November to Apriland wet for the rest of the year. Other regions have rainfall more or less evenlydistributed throughout the year. All are exposed to typhoons, which occurmost frequently across the middle latitudes of the country. Southern Mindanaois almost typhoon-free.
The area under crops expanded markedly in the 1970s and reached 12.25m hain 1979/80, mainly as a result of the clearing of virgin forest, particularly inMindanao, which has more than half the commercial acreage. Since 1979/80the area under crops has stabilised at about 13m ha and land availability isnow a serious constraint in Luzon and some parts of the Visayas.
Forests were in the past one of the Philippines’ main resources. An area of some15.88m ha was classified as forest land in 1996, of which around half was inproductive use. But these forest resources have been rapidly depleted, mainlyowing to shifting cultivation, illegal cutting and inadequate reforestation. The1987-92 and 1993-98 development plans had a reforestation target of100,000 ha per year, but the rate averaged only 70,800 ha per year, whereas thetarget should in fact be 120,000 ha per year merely to balance deforestation.Only 5.5m ha was forested in 1998, with just 700,000 ha virgin forest. There isa real possibility that forests could be virtually eliminated before the end of thisdecade. Logging in virgin forest has been banned since 1991 (although suchprohibitions are notoriously difficult to enforce) and the number of timberlicences had been cut to 30 by the beginning of 1996, down from around 100in the early 1990s.
The country has extensive fishing resources, both marine and inland, with thelargest area of developed estuarine fishponds in South-east Asia and anexclusive fishing zone of 1.89m sq km. While neither freshwater fishponds normost of the marine waters have been fully developed, the productivity of someresources has been deteriorating as rising demand and the use of destructivemethods of exploitation have resulted in overfishing.
Mineral resources are widely scattered throughout the islands, but around one-quarter of the land area has not been surveyed. At the end of 1996 there wereestimated reserves of copper of 4.79m tonnes, nickel of 1.09m tonnes,chromite of 36,667 tonnes, gold of 226,852 tonnes and iron of 484,696 tonnes.The picture is mixed for energy resources. There are large deposits of coal andlignite, with proven reserves of 369m tonnes, of which close to 40% are onSemirara Island, and potential reserves estimated at 1.59bn tonnes. Commer-cial deposits of oil off Palawan Island are very small (estimated at 16.3m barrelsin 1985) and have proved technically difficult to exploit and operate. Reservesof gas in the same region are substantial, estimated at 2.8trn-3.5trn cu ft (othergas reserves are estimated at 1.82trn cu ft). The offshore deposits are to bedeveloped to fuel three power plants with a total installed capacity of 2,700mw and possibly also to serve as the basis for petrochemicals industries.Geothermal resources are large and not yet fully developed.

18 Philippines
EIU Country Profile 2000 © The Economist Intelligence Unit Limited 2000
Transport and communications
The transport and communications infrastructure is inadequate for thecountry’s requirements, having suffered decades of underinvestment. Now,however, in the liberalised investment environment, some of the most seriousshortcomings are being or are due to be tackled.
The transport system is essentially bimodal, roads carrying 60% of freight and80% of passenger traffic, and water 40% of freight and 10% of passenger traffic.Air transport is oriented towards carrying passengers on long-distance inter-island travel. The rail network (see below) is limited. (See Reference table 4 fortransport statistics.)
The road network covers some 161,000 km. More than 26,000 km of roads areclassified as national and more than 28,000 km as provincial (mainlysecondary roads); the rest are feeder and village roads. Although average roaddensity is comparatively high, at 2.35 km per 1,000 people, there is a very widedisparity between regions, the NCR having the highest density and parts ofMindanao the lowest. Moreover, less than half the network is all-weather, avery important consideration in view of the country’s climate, and only 17% ofall roads are paved with concrete or asphalt. The condition of the feeder roadsis generally very poor, the result of substandard construction, inadequatemaintenance and use by overloaded vehicles. Bridges are often weak, if notaltogether absent, and some remote areas have very few access roads. Currentprojects provide for the improvement of roads in Luzon, including the con-struction of an elevated expressway in Manila and the rehabilitation andmodernisation of the North Luzon highway and its extension to the SubicSpecial Economic Zone. Both are under build-operate-transfer (BOT) terms,bringing in private capital and expertise.
The railway system is limited to 740 km of single-line track in the Bicol-Manila-La Union corridor in Luzon. It is in urgent need of rehabilitation, since onlyone-fifth of the track is in operation. In addition, there is a modern, elevatedrail system in Manila, which is currently being expanded within the metro-politan area. In 1997 this system registered 134m passenger journeys.
Given the country’s geography, shipping services and port facilities are ofcritical importance. In all there are more than 400 ports in operation, but six—Manila, Cebu, Iloilo, Cagayan de Oro, Zamboanga and Davao—handle over80% of public port traffic. The inter-island fleet is old, safety regulations arepoor and maritime navigational aids, in particular lighthouses, are inadequate.However, more operators have entered the port and shipping sector as a resultof liberalisation by the Ramos administration, and the domestic fleet has grownrapidly, generating a 30% rise in passenger traffic between 1992 and 1995.
There are 89 national airports, of which three—Manila, Cebu and GeneralSantos—are international. The provision of domestic services has beenimproving as the aviation sector has been liberalised. One result has been thatthe privatised national carrier, Philippine Airlines (PAL), has started to operatein competition with new airlines. However, a financial crisis at PAL resulted in
Transport

Philippines 19
© The Economist Intelligence Unit Limited 2000 EIU Country Profile 2000
a sharp cutback in services (both domestic and international) in mid-1998, andthe airline’s future remained problematic at the beginning of 2000.
The telecommunications system used to be inadequate and unreliable, andtelephone density was only 1.02 per 100 persons in the mid-1980s. Thederegulation of the sector in 1993 has transformed the situation. Presidentialdecrees mandated interconnections between networks and required that inter-national gateway operators and cellular telephone companies install telephonesystems in urban and rural areas. The changes ended the monopoly enjoyed bythe Philippines Long Distance Telephone Company (PLDT).
Telephone density had risen to 4.09 per 100 of the population in 1996, asPLDT implemented a programme to install 1m lines by the end of the year andother operators entered the field. Some 4.8m telephone lines were due to beinstalled in 1995-2000, of which PLDT would provide about 2.42m, to bringtelephone density to 7-8 per 100. In fact, this density was achieved by 1997.
Under the Marcos regime the mass media, with the exception of a few small-circulation and often short-lived newspapers, were controlled by interests closeto the president, and press censorship was exercised by the government. Nowthat the sector has opened up again, there is a multiplicity of newspapers andthe Philippines press is a byword for freewheeling comment and speculation.This has not been to President Joseph Estrada’s taste, and in 1999 there weresigns of some attempt to intimidate the press, for example by an orchestratedadvertising boycott of one daily newspaper.
There are some 270 broadcasting radio stations, commercial and non-commercial. There are five main television networks, 19 carrier and sevenrelay stations.
Energy provision
The Philippines depends to a fairly high degree on foreign energy, but since theoil price rises of the 1970s the government has sought to bring down the deficitin national supply. (Reference table 5 gives statistics on energy consumption bysource.) The contribution of domestic energy sources has been rising—reflectinginvestment in geothermal and hydroelectric capacity and the availability of awider range of non-conventional sources—and covered 41% of consumption in1998, but imported oil still accounted for the largest share, at 54%.
The contribution of indigenous commercial sources is due to rise markedlyonce gas production from the Malampaya reserves, offshore of Palawan, comeson stream as from October 2001 and as geothermal output rises. Domestic oil isnot at present expected to make a significant contribution, and coal will needto be supplemented by imports.
Power generation was previously a state preserve but severe shortcomings ininfrastructure have been remedied by bringing in the private sector. When FidelRamos became president in May 1992 the Luzon grid (on which Maniladepends) had a supply deficit of 1,000 mw. This was because a plan for 620 mwin nuclear capacity to come on stream in 1986 had lapsed. The new government
Communications
Energy generationand usage
20 Philippines
EIU Country Profile 2000 © The Economist Intelligence Unit Limited 2000
launched a fast-track programme of electricity expansion, which eliminated thepower shortage by the end of 1993. At end-1998 power-generating capacity was12,068 mw, up from 6,695 mw at the end of 1992. Much of the increase camefrom plants built under BOT contracts, and the use of such arrangements, aswell as build-own-operate (BOO) agreements, has become common, includingfor the development of capacity using offshore gas. But the greatest potential forexpansion in power generation capacity, in the long term, lies in geothermalenergy. Geothermal power generation on a commercial scale began in 1979 andcapacity, at 1,907 mw in 1998, was second in the world only to that of the US.
The liberalisation of the energy sector is due to take a major step forward withthe privatisation of the state-owned utility, the National Power Corporation(Napocor). This will occur in two stages, starting with its generating capacityand moving on to its distribution network. Originally scheduled to start in1996, this process was still awaiting congressional approval of the enablinglegislation in April 2000.
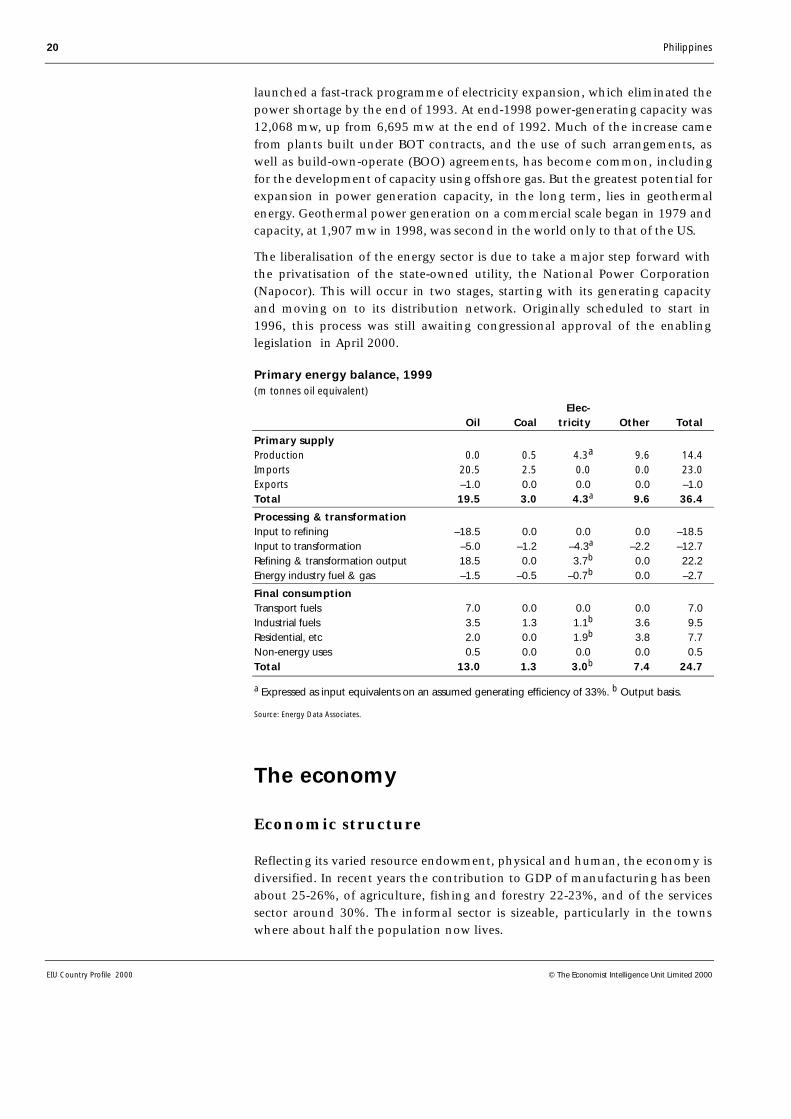
Primary energy balance, 1999(m tonnes oil equivalent)
Elec- Oil Coal tricity Other Total
Primary supplyProduction 0.0 0.5 4.3a 9.6 14.4Imports 20.5 2.5 0.0 0.0 23.0Exports –1.0 0.0 0.0 0.0 –1.0Total 19.5 3.0 4.3a 9.6 36.4
Processing & transformationInput to refining –18.5 0.0 0.0 0.0 –18.5Input to transformation –5.0 –1.2 –4.3a –2.2 –12.7Refining & transformation output 18.5 0.0 3.7b 0.0 22.2Energy industry fuel & gas –1.5 –0.5 –0.7b 0.0 –2.7
Final consumptionTransport fuels 7.0 0.0 0.0 0.0 7.0Industrial fuels 3.5 1.3 1.1b 3.6 9.5Residential, etc 2.0 0.0 1.9b 3.8 7.7Non-energy uses 0.5 0.0 0.0 0.0 0.5Total 13.0 1.3 3.0b 7.4 24.7
a Expressed as input equivalents on an assumed generating efficiency of 33%. b Output basis.
Source: Energy Data Associates.
The economy
Economic structure
Reflecting its varied resource endowment, physical and human, the economy isdiversified. In recent years the contribution to GDP of manufacturing has beenabout 25-26%, of agriculture, fishing and forestry 22-23%, and of the servicessector around 30%. The informal sector is sizeable, particularly in the townswhere about half the population now lives.
Philippines 21
© The Economist Intelligence Unit Limited 2000 EIU Country Profile 2000
Main economic indicators, 1999
GDP (US$ bn) 76.5
Real GDP growth (at constant 1985 prices; %) 3.3
Population (mid-year; m) 76.8
Current-account balance (US$ m) 7,188
Foreign debt (US$ bn) 52.2
Exchange rate (av; P:US$) 39.09
Sources: Bangko Sentral ng Pilipinas (BSP); EIU.
The economy is marked by great disparities: in the ownership of assets, inincome, in levels of technology in production and in the geographicalconcentration of activity. The National Capital Region (NCR), the regioncentred on Manila, accounts for 14% of the population and produces one-thirdof GDP. Income per head in 1998 in the NCR, the richest region, was almostnine times the level in the poorest, the four provinces forming the Muslimautonomous region in Mindanao. An even greater disparity is evident nation-wide between the richest and the poorest households. As of 1997 the richest10% of the population had an income 24 times that of the poorest 10%. Thoseliving at or below the poverty line were estimated at 32% of the population inthe same year—an improvement on the 59% registered at the height of theeconomic crisis in 1985 but still a high proportion, and one that will have beenrising as economic growth has slowed since mid-1997.
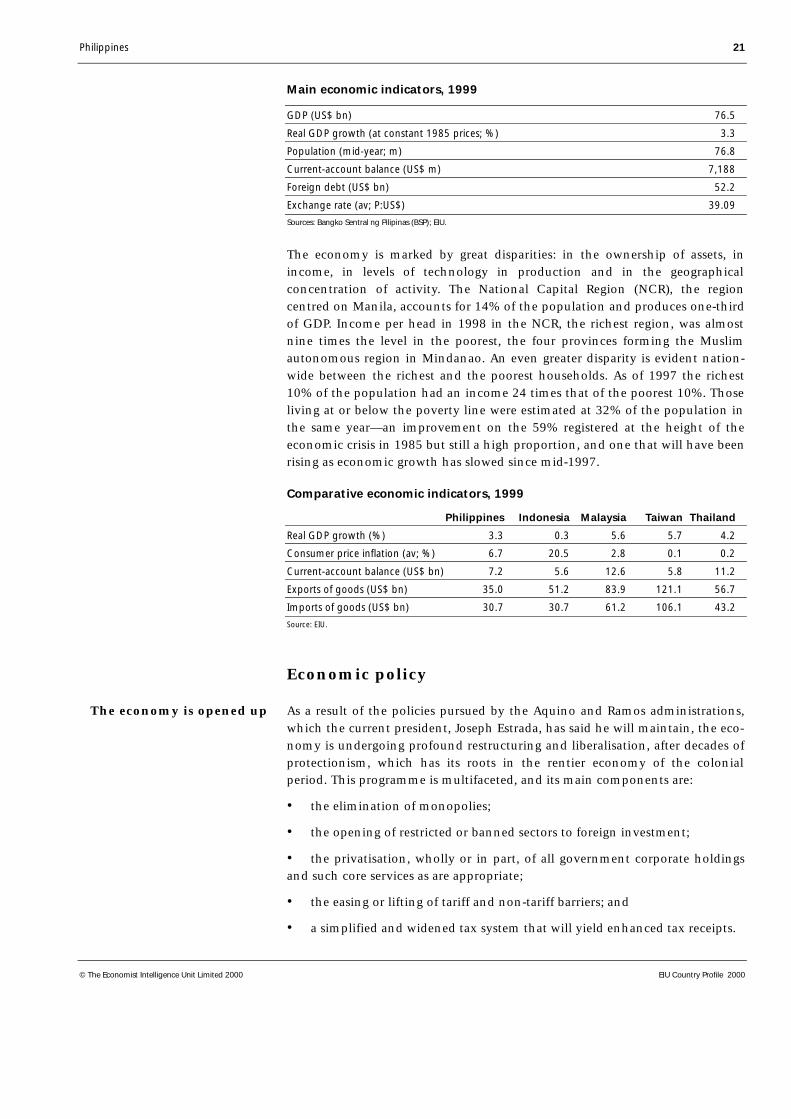
Comparative economic indicators, 1999
Philippines Indonesia Malaysia Taiwan Thailand
Real GDP growth (%) 3.3 0.3 5.6 5.7 4.2
Consumer price inflation (av; %) 6.7 20.5 2.8 0.1 0.2
Current-account balance (US$ bn) 7.2 5.6 12.6 5.8 11.2
Exports of goods (US$ bn) 35.0 51.2 83.9 121.1 56.7
Imports of goods (US$ bn) 30.7 30.7 61.2 106.1 43.2
Source: EIU.
Economic policy
As a result of the policies pursued by the Aquino and Ramos administrations,which the current president, Joseph Estrada, has said he will maintain, the eco-nomy is undergoing profound restructuring and liberalisation, after decades ofprotectionism, which has its roots in the rentier economy of the colonialperiod. This programme is multifaceted, and its main components are:
• the elimination of monopolies;
• the opening of restricted or banned sectors to foreign investment;
• the privatisation, wholly or in part, of all government corporate holdingsand such core services as are appropriate;
• the easing or lifting of tariff and non-tariff barriers; and
• a simplified and widened tax system that will yield enhanced tax receipts.
The economy is opened up
22 Philippines
EIU Country Profile 2000 © The Economist Intelligence Unit Limited 2000
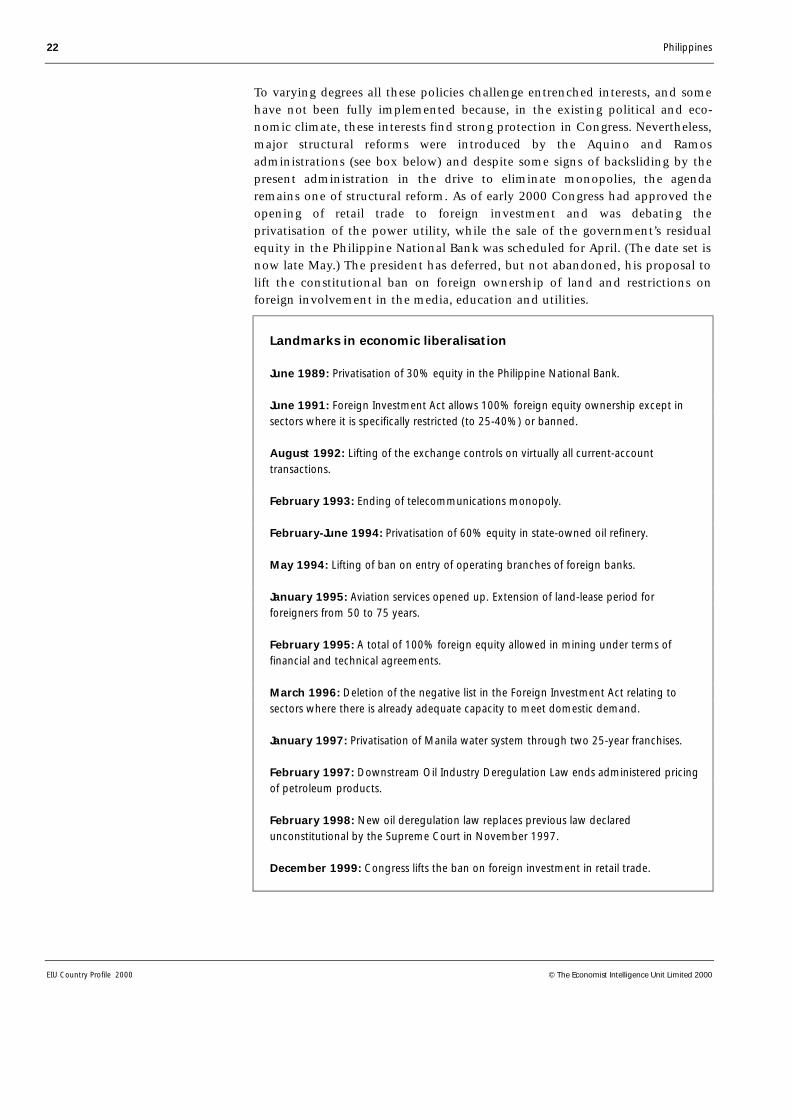
To varying degrees all these policies challenge entrenched interests, and somehave not been fully implemented because, in the existing political and eco-nomic climate, these interests find strong protection in Congress. Nevertheless,major structural reforms were introduced by the Aquino and Ramosadministrations (see box below) and despite some signs of backsliding by thepresent administration in the drive to eliminate monopolies, the agendaremains one of structural reform. As of early 2000 Congress had approved theopening of retail trade to foreign investment and was debating theprivatisation of the power utility, while the sale of the government’s residualequity in the Philippine National Bank was scheduled for April. (The date set isnow late May.) The president has deferred, but not abandoned, his proposal tolift the constitutional ban on foreign ownership of land and restrictions onforeign involvement in the media, education and utilities.
Landmarks in economic liberalisation
June 1989: Privatisation of 30% equity in the Philippine National Bank.
June 1991: Foreign Investment Act allows 100% foreign equity ownership except insectors where it is specifically restricted (to 25-40%) or banned.
August 1992: Lifting of the exchange controls on virtually all current-accounttransactions.
February 1993: Ending of telecommunications monopoly.
February-June 1994: Privatisation of 60% equity in state-owned oil refinery.
May 1994: Lifting of ban on entry of operating branches of foreign banks.
January 1995: Aviation services opened up. Extension of land-lease period forforeigners from 50 to 75 years.
February 1995: A total of 100% foreign equity allowed in mining under terms offinancial and technical agreements.
March 1996: Deletion of the negative list in the Foreign Investment Act relating tosectors where there is already adequate capacity to meet domestic demand.
January 1997: Privatisation of Manila water system through two 25-year franchises.
February 1997: Downstream Oil Industry Deregulation Law ends administered pricingof petroleum products.
February 1998: New oil deregulation law replaces previous law declaredunconstitutional by the Supreme Court in November 1997.
December 1999: Congress lifts the ban on foreign investment in retail trade.

Philippines 23
© The Economist Intelligence Unit Limited 2000 EIU Country Profile 2000
The underlying aim of the restructuring programme is to improve resourcemobilisation. One means of achieving this is the build-operate-transfer (BOT)type of contract, where the Philippines has been a ground-breaker. Thismechanism shifts the capital and management burden from the public to theprivate sector, and was initially employed to remedy the critical power shortagein Luzon in 1992-93. It has been extended to other forms of physicalinfrastructure (such as roads and commuter rail services) where gaps alreadyconstrain economic growth and the government’s budget resources areinsufficient.
The liberalisation programme made a significant contribution to achieving oneof the main macroeconomic targets—the elimination of the fiscal deficit. Theproceeds of the sale of government assets, both corporate and physical,enabled the budget to move into a P16.3bn (US$617m) surplus in 1994(equivalent to 1% of GDP) and remain in surplus through to 1997. A newfeature in 1996 was a small surplus before privatisation proceeds, which owedmuch to the fact that interest payments—the largest single expenditure item—had been eroded by the fall in the government’s debt stock. The public-sectordeficit (as opposed to the government’s budget balance) was nearly zero inboth 1994 and 1995, and there was even a small surplus in 1996.
At the same time, the Ramos administration, taking up the baton from theAquino presidency, made a concerted effort to strengthen the tax base. Value-added tax (VAT) was extended at the beginning of 1996, while a com-prehensive tax reform package, approved in two stages in 1996 and 1997,tackled a range of defects in the tax structure. It simplified the system ofpersonal and corporate tax, raising thresholds for the former and reducing therange of allowances in both, and rebased the excise system from ad valorem tospecific levy. The underlying aim was to reduce both the scope and theincentive for corruption and evasion, and thereby increase the tax take fromthe present inadequate 15-16% of GDP.
The financial crisis that hit the Asian region in 1997 had a immediate andsevere impact on the budget. The depreciation in the peso and the steep rise ininterest rates pushed up the cost of servicing the government’s debt, at thesame time as the downturn in economic growth hit the revenue side. The fiscalsurplus in 1997 was only around one-tenth the original target, at P1.56bn,while the slip into recession in mid-1998 ended all hope of maintainingequilibrium. The target deficit agreed with the IMF in February, under a newprecautionary stand-by agreement for US$1.37bn, had to be revised upwardstwice, with the final outturn just below the P50bn ceiling. As the economywent into recession (GDP fell year on year from the second quarter to thefourth quarter of 1998) the government adopted an expansionary budget for1999: spending was set to rise by 16% and revenue by 13%. This would haveproduced a deficit of P68.4bn. In the event the recovery in GDP growth in1999 was slower, and more fitful, than scheduled, with the result that internaltax receipts fell well below expectations. Despite some trimming on theexpenditure side, the deficit exceeded the target, at P111.7bn (latest estimate).(Reference table 6 provides data on government revenue and expenditure in
Fiscal targets were metby 1997
There was a sharpdeterioration in 1998-99

24 Philippines
EIU Country Profile 2000 © The Economist Intelligence Unit Limited 2000
1994-98, and Reference table 7 gives figures for outstanding internal publicdebt in the same period.)
The higher than expected fiscal deficit in 1999 meant that the targets forsubsequent years have had to be revised. The six-year fiscal programme drawnup at the beginning of the Estrada administration had envisaged a rapidreduction in the fiscal deficit from P40bn in 1998 to P17.9bn in 1999,stabilising in 2000, and then replaced by a marginal surplus in 2001, of P7.4bn,with a sustained and strong improvement thereafter, to P75.6bn in 2004. Thedraft budget for 2000 drawn up in mid-1999 had projected a P40bn deficit. Therevised figure in December was P62.5bn. Even this will prove overoptimisticunless the deepening in the economic recovery in 2000 is accompanied byincreased effort on the tax collection front. The government’s target forprivatisation proceeds, at P22bn-30bn, looked in early 2000 to be too high,given rather bearish investor sentiment. Even if the 2000 target is met, there isno expectation of a return to fiscal surplus until late in the president’s term, andeven then only at modest levels.
Budget results for 1999 and government proposals for 2000(P bn)
2000 20001999 Original (Jul 1999) Revised (Dec 1999)
Revenue 478 551.8 518.6
Expenditure 585 591.8 581.1
Balance –112 –40.0 –62.5
Source: Press reports.
Whereas the Philippines had achieved its fiscal and other macroeconomictargets by 1997 (money growth was broadly in line with the agreed targets andinflation, with some blips, had moved down to an average of 6% in that year),the deterioration in the fiscal position and the Supreme Court ruling against oilderegulation (one of the core policy commitments agreed with the IMF) meantthat the Philippines did not make the hoped-for graduation from its IMF pro-gramme by the end of 1997. However, the prospect of a complete break withthe IMF had become less attractive as the regional financial crisis deepened.Consequently, a “precautionary stand-by arrangement” was negotiated inMarch 1998, to follow on from the extended funding facility that expired inthat month. The facility, for up to US$1.37bn, covered a two-year period andaccompanied a set of GNP growth targets, which had to be revised downwardslater in the year as the economy moved into recession. Inflation targets—7.5-8.5% for 1998 and 4-5% in 1999—were maintained, but proved ambitious. (SeeReference table 8 for money supply data for 1995-99 and Reference table 9 forinterest-rate data for 1995-99.) Against the background of the regional financialcrisis there was a renewed focus on reform and strengthening of the bankingsector, with four broad policy objectives and promises:
• increasing banks’ capitalisation and encouraging consolidation;
• tightening provisioning requirements and strengthening regulatoryoversight;
The planned return toequilibrium is postponed
IMF tutelage is maintained

Philippines 25
© The Economist Intelligence Unit Limited 2000 EIU Country Profile 2000
• dealing “expeditiously” with any problem bank while safeguarding thesoundness of the system; and
• levelling the playing field between different types of institutions andinstruments.
As of early 2000 the government had not revised its economic growth targetsin the Medium-Term Philippine Development Plan for 1999-2004. Drawn up atthe beginning of the Estrada presidency, this had modest expectations for GDPand GNP growth over the period, starting from a range of 2.6-3.2% and 3-3.7%respectively in 1999 to a peak of 6.1-6.6% and 6.6-7.1% in 2003. Theperformance in the first year was just under the low end of the target (seeEconomic performance) and the government has kept its target for 2000 at thelow end—while hoping for more.
Medium-Term Philippine Development Plan(target range for % annual growth)
1999 2000 2001 2002 2003 2004
Agriculture 3.0-3.5 3.5-4.1 0.5-1.5 3.5-4.3 4.0-4.6 1.0-2.0
Industry 1.4-2.0 5.0-5.6 4.8-5.4 6.0-6.6 6.8-7.5 6.6-7.2
Services 3.5-4.0 5.3-5.8 4.7-5.3 5.6-6.0 6.4-6.7 5.8-6.4
GDP 2.6-3.2 4.8-5.4 3.9-4.6 5.8-5.9 6.1-6.6 5.2-5.9
GNP 3.0-3.7 5.3-5.9 4.6-5.1 5.9-6.4 6.6-7.1 5.7-6.4
Note. The growth dips in 2001 and 2004 flow from the assumption of a recurrence of the El Niño climatic phenomenon.
Source: National Economic & Development Agency (NEDA) as reported in press.
Economic performance
Gross domestic product(% real change at constant 1985 prices)
Annual average1999 1995-99
Private consumption 2.6 3.9
Government consumption 5.3 3.5
Fixed capital formation –2.0 2.6
Exports of goods & services 3.6 4.4
Imports of goods & services –2.8 5.0
GDP 3.3 3.7
Source: National Statistical Co-ordination Board (NSCB).
Economic growth until 1998 was based on the buoyancy of exports and theinvestment this in turn stimulated. With an initial boost from the ending ofthe power shortfall in 1993, the rate of GDP growth was rising in every year toa peak of 5.8% in 1996, before a modest deterioration in 1997, to 5.2%, as theregional crisis hit. In each year exports were rising at double-digit rates (in bothnational accounts terms and on the US dollar-denominated merchandisemeasure), while the real growth in gross fixed investment reached 12-14% peryear in 1996 and 1997.
Medium-term growthtargets are maintained
Exports and investmenttwin pillars of growth
26 Philippines
EIU Country Profile 2000 © The Economist Intelligence Unit Limited 2000
The sharp fall in fixed capital formation in 1998, of 11.2%, owing to thecombination of a steep rise in interest rates and import costs since mid-1997and slackening domestic demand, brought economic growth to a halt. GDP fellby 0.6% while GNP was stagnant. The 21% contraction in exports (nationalaccounts measure) was also significant, as the percentage rise on this side of theforeign account exceeded the fall in imports (of 14.7%), which meant that thenet foreign balance improved slightly. Meanwhile, on the supply side, agricul-tural output fell sharply owing to drought damage to the rice and corn crops.
These demand trends were broadly maintained in 1999. Figures from theNational Statistical Coordination Board (NSCB) for 1999 published in May 2000showed a modest recovery in exports, with a further—if much slower—fall inimports. Capital formation also continued to contract though at a much slackerpace. The most dynamic demand component was government consumptionspending, which recorded its fastest growth in the first quarter (7.6% year onyear) and then slackened in each successive quarter, but still registered growth of5.3% for the full year. On the supply side, agriculture made up the ground lost in1998, while industry remained in the doldrums with only 0.9% growth. (ForGDP and GNP growth in 1995-99 see Reference tables 10, 11 and 12.)
One important factor in the rate of economic growth, which is not directlyregistered in the GDP measure, is the inflow of remittances from Filipinos over-seas, both contract workers and emigrants. The World Bank has estimated thatsuch remittances were in the range of 2.2-4.5% of GDP in 1991, and thepercentage has risen substantially since then (see The external sector). Trendsin these inflows consequently have an impact on the pace of overall economicgrowth, as they represent a significant source of income for Filipino house-holds and generate demand for Filipino assets.
The recovery in economic performance after 1991 was accompanied by asteadying in the rate of consumer price inflation. An important contributingfactor until mid-1997 was the stability of the peso against the US dollar, withthe annual average fluctuating within a narrow band, of 2-7%, in 1992-96 andin the first half of 1997. The steep fall in the peso’s value in the second half of1997 added to the pressure from a much lower rice crop to push up the rate ofinflation to 10-11% in May-December 1998.
But strong deflationary pressures began to be felt in early 1999, from the eco-nomic recession, the weakness in world oil prices and—as from October 1998—the slight appreciation in the peso’s value against the US dollar. With therebound in the rice crop in the second quarter of 1999, and despite the recoveryin oil prices, the rate of consumer price inflation was falling in virtually everymonth in 1999. By January 2000 it was down to a 13-year low of 2.6%.
Over most of the 1990s real wages have tended to decline. Wages tend to lagbehind the rise in prices, with sudden catch-up increases that owe most toessentially political pressures (such as a surge in food prices or an imminentnational election). The measure used is the minimum wage, which varies withthe type of work (agricultural or non-agricultural) and the region. It is an
Until 1998
Overseas remittances play asignificant role
An inflationary blipin 1998
A slowdown in 1999
Wages tend to lagprice inflation

Philippines 27
© The Economist Intelligence Unit Limited 2000 EIU Country Profile 2000
imperfect measure for a number of reasons. Many sectors are excluded from itsoperation—the whole of the public sector, as well as export-oriented andlabour-intensive manufacturing—and many companies ignore it because of thelimited bargaining power of organised labour. (See Reference table 13 for dataon consumer and wholesale prices and the minimum wage in 1995-99.)
Inflation and the minimum wage(% change, year on year)
Annual average1999 1995-99
Consumer prices 6.7 7.9
Minimum non-agricultural wage in National Capital Region (incl allowances) 6.4 6.2
Source: Bangko Sentral ng Pilipinas.
Regional trends
The figures for overall GDP of P2.99trn and for GDP per head of P38,919(US$996) in 1999 conceal a wide disparity in wealth between different regionsof the country. The NCR accounts for one-third of the economy’s output andits GDP per head is close to three times the national average. Only two otherregions—South Tagalog and Cordillera Administrative Region—have incomeper head that is above the national average, while four register around half thatfigure and the four autonomous provinces in Mindanao only one-third. Thisreflects the concentration of manufacturing activities in the Manila area.However, growth points have been developing in other regions, whereindustrial parks have been the focus for much investment, both domestic andforeign, in recent years.
Gross domestic product by region, 1998
% of Per % of % realTotal national head national change,
(P bn) total (P) average 1998/93
LuzonNational Capital Region 925.4 34.7 95,709 269.7 14.0Cordillera Administrative Region 59.7 2.2 41,838 117.9 24.7Ilocos 86.0 3.2 20,190 56.9 20.5Cagayan Valley 54.5 2.0 18,816 53.0 7.8Central Luzon 206.2 7.7 26,982 76.0 –1.8South Tagalog 372.4 14.0 35,531 100.1 5.9Bicol 77.7 2.9 16,276 45.3 3.4
VisayasWestern Visayas 180.0 6.8 27,547 77.6 0.7Central Visayas 176.7 6.6 31,433 88.6 14.3Eastern Visayas 68.8 2.1 18,227 51.4 4.5
MindanaoWestern Mindanao 66.4 2.5 21,278 60.0 7.2Northern Mindanao 127.2 4.8 28,678 80.1 1.6Southern Mindanao 172.4 6.5 30,173 85.0 3.3Central Mindanao 69.3 2.6 26,887 75.8 0.2Autonomous Region of Muslim Mindanao 24.5 0.9 10,974 30.9 11.9National 2,670 100.0 35,486 100.0 9.4Source: NSCB.
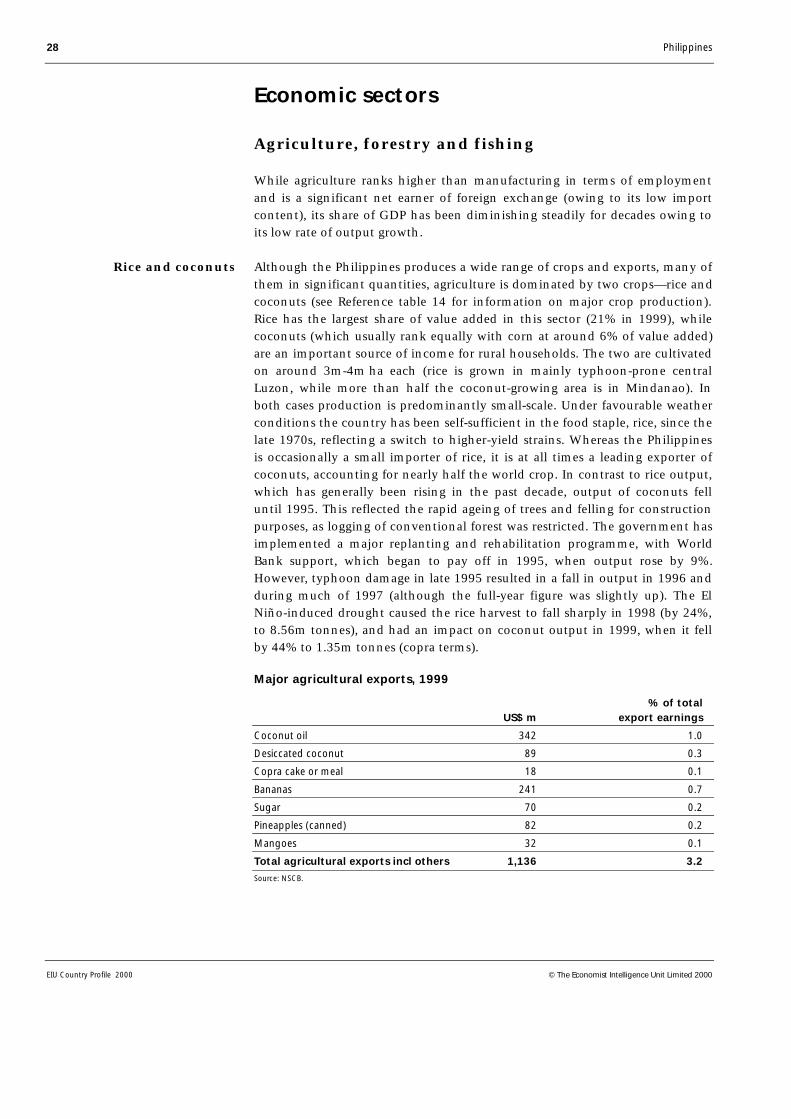
28 Philippines
EIU Country Profile 2000 © The Economist Intelligence Unit Limited 2000
Economic sectors
Agriculture, forestry and fishing
While agriculture ranks higher than manufacturing in terms of employmentand is a significant net earner of foreign exchange (owing to its low importcontent), its share of GDP has been diminishing steadily for decades owing toits low rate of output growth.
Although the Philippines produces a wide range of crops and exports, many ofthem in significant quantities, agriculture is dominated by two crops—rice andcoconuts (see Reference table 14 for information on major crop production).Rice has the largest share of value added in this sector (21% in 1999), whilecoconuts (which usually rank equally with corn at around 6% of value added)are an important source of income for rural households. The two are cultivatedon around 3m-4m ha each (rice is grown in mainly typhoon-prone centralLuzon, while more than half the coconut-growing area is in Mindanao). Inboth cases production is predominantly small-scale. Under favourable weatherconditions the country has been self-sufficient in the food staple, rice, since thelate 1970s, reflecting a switch to higher-yield strains. Whereas the Philippinesis occasionally a small importer of rice, it is at all times a leading exporter ofcoconuts, accounting for nearly half the world crop. In contrast to rice output,which has generally been rising in the past decade, output of coconuts felluntil 1995. This reflected the rapid ageing of trees and felling for constructionpurposes, as logging of conventional forest was restricted. The government hasimplemented a major replanting and rehabilitation programme, with WorldBank support, which began to pay off in 1995, when output rose by 9%.However, typhoon damage in late 1995 resulted in a fall in output in 1996 andduring much of 1997 (although the full-year figure was slightly up). The ElNiño-induced drought caused the rice harvest to fall sharply in 1998 (by 24%,to 8.56m tonnes), and had an impact on coconut output in 1999, when it fellby 44% to 1.35m tonnes (copra terms).
Major agricultural exports, 1999
% of totalUS$ m export earnings
Coconut oil 342 1.0
Desiccated coconut 89 0.3
Copra cake or meal 18 0.1
Bananas 241 0.7
Sugar 70 0.2
Pineapples (canned) 82 0.2
Mangoes 32 0.1
Total agricultural exports incl others 1,136 3.2
Source: NSCB.
Rice and coconuts

Philippines 29
© The Economist Intelligence Unit Limited 2000 EIU Country Profile 2000
Sugar, which was once a leading export crop and is still produced on largeplantations, is now of minor importance. This reflects both the long-termdecline in the preferential market in the US and a lengthy period of world priceweakness, which prompted a switch to higher-value crops and fish farming inthe early and mid-1980s. In recent years the Philippines has had to importsugar to meet its US quota. In the case of another traditional export crop,coffee, the rise in domestic demand has in most recent years eliminatedsupplies for export. Earnings from both bananas and pineapples recordedrapid growth in the 1970s, reflecting investment by US companies, and havestabilised since. Mangoes recorded strong export growth in the 1990s.
All livestock production is for domestic consumption. The country is self-sufficient in pork and poultry but needs to import beef and dairy products (seeReference table 15 for data on meat production).
One of the fundamental reasons for the failure of the Philippines economy totake off along with similar economies in East Asia lies in the distribution ofland—or rather the failure to redistribute land. As the rise in the area undercultivation has failed to keep pace with population growth, the average farmsize has fallen, to 2.6 ha in 1980, and the number of landless has risen.Moreover, within this average size of landholding there is, as ever, a very widedisparity: in 1988 some 86% of landowners held 23% of agricultural land,while 2% controlled 36% of the land. The result has been deep-rooted povertythat affects around half the rural population.
Since the first years of independence there have been attempts at land reform,which initially took the form of allocating virgin land for settlement as well aspartitioning some large estates. The scope for the former was soon exhausted,and a programme introduced under the Marcos presidency was related only toexisting share tenancies in land planted to rice or corn. As support services(both financial and material) were inadequate and the semi-feudal socialstructure remained essentially unchanged, land reform had had relatively littleimpact by the time Corazon Aquino came to power. She initiated theComprehensive Agrarian Reform Programme, which was intended toredistribute all agricultural land (above a retention limit of 5 ha per landownerand 3 ha per direct heir) over a ten-year period, beginning with large holdings.Beneficiaries, defined as farmers or “regular farm workers” on the land covered,were to receive plots of 3 ha each.
The programme was in theory the most comprehensive to date, providing forthe redistribution of about 55% of existing agricultural land. But it had a newexclusion: corporate landholdings were deemed to comply through a transferof stock, rather than land, and so landowners could use incorporation as ameans of avoiding the break-up of their estates. But the underlying problemremains: the new generation of small, poor farmers will need appropriatelytargeted and flexible back-up services, if they are to secure more than a sub-sistence livelihood out of their holdings. The provision of such servicesrequires both budget capacity and political will.
Meanwhile, the transfer of so fundamental an asset as land in a society aslitigious as the Philippines has inevitably taken longer than scheduled. By the
Minor crops
Land distribution: anunresolved problem

30 Philippines
EIU Country Profile 2000 © The Economist Intelligence Unit Limited 2000
end of 1998 a total of 4.63m ha had been redistributed, 2.26m ha below targetby that date. Completion is now expected in 2004.
Resource depletion has resulted in a continuous decline in forestry productionsince the early 1970s. (See Reference table 16 for 1994-98 output of woodproducts.) The sector accounted for less than 0.5% of GDP in the early 1990sbut as little as 0.001% in 1999, when total export earnings from forestryproducts were only US$21m, compared with US$261m 11 years earlier.However, there is a high level of illegal logging, particularly in remote areas ofMindanao, and in the late 1980s earnings from smuggling were thought to beclose to US$800m per year.
Fishing is an important sector, contributing around three times as muchas mining to GDP, employing some 1.8m people (mostly at near-subsistencelevel) and providing an important and growing source of foreign earnings. (SeeReference table 17 for data on 1994-98 fishing production.) However, whilecommercial fishing and fish farming have recorded strong growth in output(14% and 21% respectively between 1993 and 1998), representing an overallincrease of some 280,000 tonnes, sustenance fishing registered a decline ofsome 123,000 tonnes in the five-year period. This reflects the overfishing ofinshore waters as the commercial fleet encroaches within this area and thepopulation dependent on sustenance activity expands. Since the fish takenfrom the coastal area are normally the progeny of those caught further off-shore, there are adverse implications for commercial fishing. Meanwhile, thecoral reef has been seriously reduced, mainly because of dynamiting and otherdestructive fishing practices. Moreover, there is no doubt that foreign fleets aredepleting the Philippines’ waters.
Mining and semi-processing
The Philippines is a minor producer of copper, accounting for only 0.4% ofworld production in 1997 (much below its share in the preceding decade), and,partly as a by-product, gold (0.5%). Both are traditional, but second-rank,exports. Other metallic minerals produced include silver, nickel and chromite(see Reference table 18 for data on minerals production). The sector has beenin overall decline since the mid-1980s, with fairly wide year-to-yearfluctuations, mainly because world prices have not been high enough to coverthe operating and financing costs of most producers. Moreover, crude oilproduction has been affected by the natural depletion of reserves and frequentshutdowns of wells for repairs and maintenance. The sector currently accountsfor less than 1% of GDP, and this share is unlikely to change much in the nearfuture. High hopes were raised with the passage of a mining law in 1995,which allows 100% foreign ownership (under the terms of a financing andtechnical assistance agreement). However few such agreements had beenfinalised by early 2000, and they are prone to challenge in the courts onenvironmental grounds.
Forestry
Fishing

Philippines 31
© The Economist Intelligence Unit Limited 2000 EIU Country Profile 2000
Output of leading minerals, 1999(‘000 tonnes unless otherwise indicated)
Copper (ores & concentrates) 34.0
Gold (tonnes) 6.7
Silver (tonnes) 18.8
Nickel (ores & concentrates) 20.7
Chromite (refractory ore) 19.7a
a 1998.
Sources: World Bureau of Metal Statistics, World Metal Statistics Yearbook; NSCB.
Manufacturing
Manufacturing output, 1999(gross value added)
% change,year on year % of total
Food manufacturing 5.8 33.8
Clothing & footwear –15.0 4.4
Chemicals & products –4.7 5.5
Petroleum & coal –0.9 15.1
Electrical machinery 15.0 9.0
Total value added in manufacturing incl others 1.4 100.0
Source: NSCB.
The manufacturing sector is the single most important production sector in theeconomy (Reference tables 19 and 20 give data on output and structure ofmanufacturing industry). It developed rapidly during the 1950s and 1960sessentially for import substitution, a process aided by high levels of protectionfor domestic industry. There was also marked growth in industries assemblingconsumer goods, which were initially heavily dependent on imported com-ponents. In response to the second oil shock and the less favourable externalenvironment, the government launched a programme in the early 1980s todevelop the country’s intermediate and heavy industrial base by means of anumber of industrial projects in which it was prepared to participate. A coppersmelter, a coco-chemicals complex, a phosphate fertiliser plant and a low-rangediesel-engine factory were set up by groups with government participation, andthe cement industry was expanded. Nevertheless, the structure of manu-facturing is still heavily weighted towards the production of consumer goods. Italso remains oriented towards the domestic market despite the development oflabour-intensive export manufacturing since the 1970s, in particular ofelectronics and automotive parts.
The expansion of the manufacturing sector was stimulated by the floating ofthe currency in 1970, special tax incentives and duty exemptions, and thecreation of export-processing zones (EPZs) where companies were grantedadditional incentives. The first such zone was set up at Mariveles (in Bataan).Other zones have been developed at Mactan Island near Cebu city, at Baguio,

32 Philippines
EIU Country Profile 2000 © The Economist Intelligence Unit Limited 2000
north-east of Manila, and at Cavite, south of Manila. In addition, a total of 54special economic zones and industrial estates, mainly focusing on theelectronics and semiconductor industry, had been set up by the private sectorand were in operation by the end of 1998, in a surge of investment that beganin 1995. Two newcomers were the Subic Special Economic and Freeport Zone,which is rising from the former US naval base along Subic Bay on the mainisland of Luzon, and Clark, at the former air force base in the central Luzonprovince of Pampanga.
Detailed official statistics on manufacturing do not cover the very importantcontribution of small enterprises. These are numerous (total manufacturingestablishments in 1982 numbered 83,292, of which around 90% had fewerthan ten employees) and are an important source of employment. It isestimated that firms employing five or fewer people (classified as informalsector) provide work for up to twice as many people as the formal sector.
At the end of 1998 the private industrial estates and other special economiczones were still lagging behind the four government-run export-processingzones in terms of employment (100,791 compared with 119,000). However,they were far ahead of them in export earnings in that year, at US$8.54bncompared with US$4.73bn. Against a background of positive expectations,investment had been rising very rapidly, from P65.3bn (US$2.5bn) in 1996 toP159.8bn in 1997. In 1998, however, the regional crisis dampened investmentin the economic zones, with a fall of 40% to P95.8bn. The indications are thatthere was another decline in 1999. Nevertheless, over the long term theprospect remains one of growth in this sector, as the Philippines benefits fromthe “hollowing out” of Japan’s and Taiwan’s economies and attractsinvestment geared to transborder production in the Association of South-EastAsian Nations (ASEAN) region.
Construction
Growth in the construction sector (see Reference table 21 for data on privateconstruction) was strong and accelerated during the mid-1990s, to averagenearly 10% per year in GDP terms in 1993-97, despite sluggish capital spendingby the government. The private sector was tapped to finance improvements inthe physical infrastructure, which in the past would have depended on publicfunds. Meanwhile, sustained economic growth generated private-sectordemand in both residential and non-residential segments of the propertymarket such as luxury apartment complexes, offices and shopping complexes inthe National Capital Region (NCR) and in other growth centres. The sector wentinto decline in 1998, however, owing to the sharp rise in interest rates in thewake of the regional financial crisis and the downturn in investment spending.Construction GDP fell by 8.5% in that year and by 2.8% in 1999, despite thesustained fall in interest rates since mid-1998. In both years the private sectorregistered the steepest fall, at 13.5% in 1998 and 14.5% in 1999.
The export-processing andspecial economic zones

Philippines 33
© The Economist Intelligence Unit Limited 2000 EIU Country Profile 2000
Financial services
The financial sector is backward compared with other countries in the region.(See Reference table 22 for banking and financial statistics.) The ratio of totalassets of the banking system to GNP is the lowest in East Asia, and individualcommercial banks are small compared with those in other countries. In 1996,before countries in the region were hit by the economic crisis, the depth of thePhilippines’ financial system, as measured by the ratio of M2 to GNP, was low,at 51.8% compared with 101.1% in Malaysia and 81.5% in Thailand.
However, all these values have been improving in the past decade (in 1984 theM2/GNP ratio was only 20.9%), as the financial sector has developed. Animportant stimulus to further real growth has come from the liberalisation ofthis sector: the 44-year ban on the establishment of foreign banks was lifted inMay 1994; full operating licences are being accorded to foreign insurancecompanies in line with commitments to the World Trade Organisation (WTO);and legislation in 1997 eased restrictions on foreign investment in financecompanies and investment houses.
In late 1994 there were 38 commercial banks, of which only four werebranches of foreign banks (Citibank, Bank of America, Hongkong & ShanghaiBank and Standard Chartered). Two banks were wholly or partly government-owned, including the largest in terms of assets, the Philippine National Bank(PNB). Majority equity in PNB passed to the private sector in 1995, and thegovernment plans to divest its remaining 30% stake in April 2000.
A more profound change has been the entry of ten more foreign banks, towhich licences were granted in 1995. They are Fuji Bank, the Bank of Tokyo,ING Bank, ANZ Bank, Development Bank of Singapore, Korea Exchange Bank,Bangkok Bank, Commercial Bank of China, Deutsche Bank and ChemicalBank. Initially, these banks are concentrating on wholesale corporate services,but the entry of such large players is stimulating mergers among domesticentities. The government has for some time been encouraging the establish-ment of “unibanks”, which are allowed to engage in the full range of financingactivities and have a higher minimum paid-up capital than normal commercialbanks. Three major mergers occurred in 1999, the last one—which wasfinalised in early 2000—allowing two leading banks, the Bank of the PhilippineIslands and Far East Bank and Trust, to take over the top position in terms ofassets from Metrobank. The consolidation process is being encouraged by thehigher capitalisation demanded of all banks in the wake of the regionalfinancial crisis. However, there is still some way to go; at the end of 1999 therewere 51 domestic commercial banks, a number of them small and family-controlled operations. The governor of the Bangko Sentral ng Pilipinas (BSP,the central bank) who took up the post in July 1999 has opposed the entry ofmore fully-owned foreign banks until the consolidation process hasgone further.
There are ten investment houses. The biggest is the Private DevelopmentCorporation, followed by the Bank of the Philippine Islands InvestmentCorporation (formerly the Ayala Investment Corporation). The government-
The banking system

34 Philippines
EIU Country Profile 2000 © The Economist Intelligence Unit Limited 2000
owned Development Bank of the Philippines is an important source ofinvestment for agriculture and small and medium-scale industry. In addition,there is an offshore banking and foreign-currency deposit system. Offshorebanking licences are available only to foreign banks, but all commercial banksare permitted to operate foreign-currency deposit units (FCDUs).
Assets of the top ten commercial banks, 1998(P m; year-end)
Metrobank 282,598
Bank of the Philippine Islands 218,259
Philippine National Bank 208,673
Land Bank of the Philippinesa 171,505
Philippine Commercial International Bank 150,383
Citibankb 144,447
Far East Bank & Trust 135,217
Rizal Commercial Banking Corporation 112,303
Development Bank of the Philippinesa 110,978
United Coconut Planters’ Bank 110,349
Total assets of commercial banking system incl others 2,638,275
a Government-owned.. b Foreign.
Source: Press reports.
The Philippines Stock Exchange (PSE) received a double boost in the early andmid-1990s from the overall international interest in emerging markets and theprogramme of investment liberalisation and privatisation in the country. (SeeReference table 23 for stock exchange indicators.) The market capitalisation ofthe stockmarket rose from only P353bn at the end of 1992 to P2.12trn by theend of 1996. As in other stock exchanges in the region, however, the index fellsharply in 1997, by 41%, while the market capitalisation was reduced by nearlyhalf to P1.25trn. A slight, and partial, recovery in the first quarter of 1998proved short-lived, and this small market remained highly vulnerable topersistent worries about the region (including the prospects for Japan’seconomy) and the nervousness about international equity markets. The PSEindex consequently reached a seven-year low in September 1998, at 1,082. Itwas subsequently buoyed up by the strengthening in the peso’s value and thesteady decline in both domestic interest rates and inflation, to reach new highsin June 1999, when it hit 2,487 at the end of the month. But deterioratingperceptions of the quality of the Estrada administration and the sluggish paceof economic recovery served to push down the index once more, to 2,143 atthe end of 1999.
Other services
The financial crisis that set in from mid-1997 and the knock-on effect ondomestic demand led to a slowdown in the rate of growth of value added inretail trade from 12.7% (real terms) in 1996 to a low of 3.6% in 1998. A verymodest improvement appeared in 1999, with value added up by 4.1%. The
The retail sector
The securities market
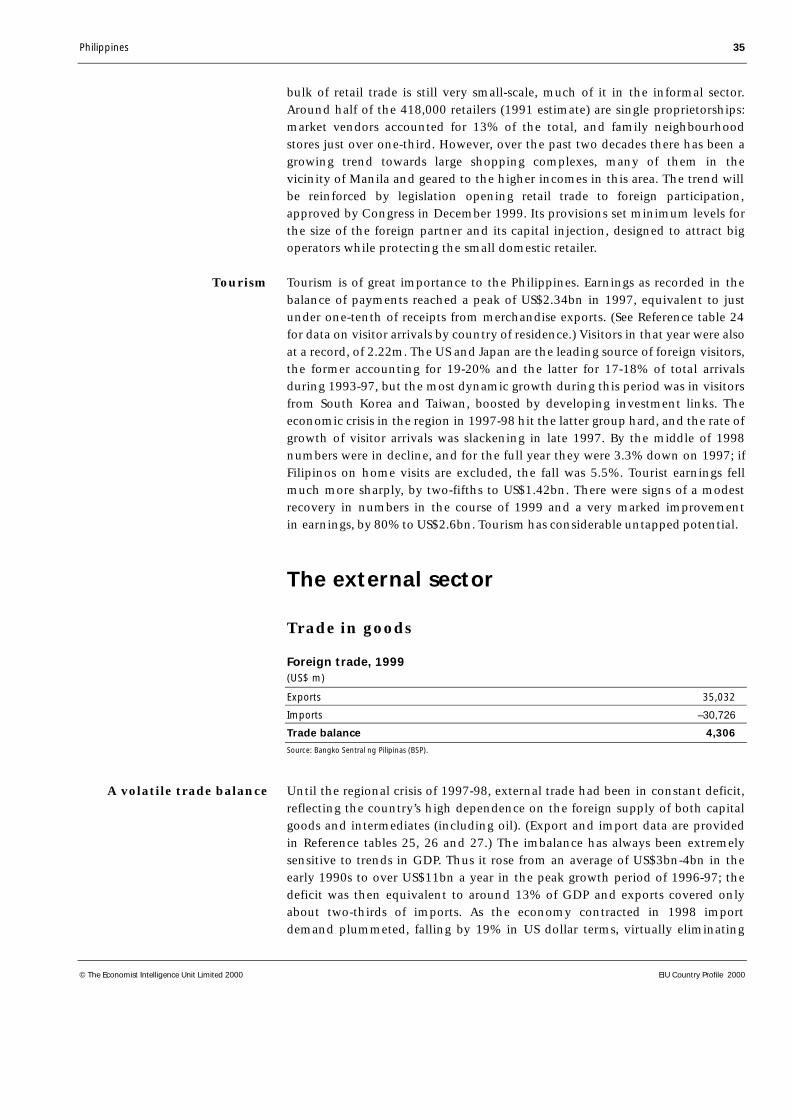
Philippines 35
© The Economist Intelligence Unit Limited 2000 EIU Country Profile 2000
bulk of retail trade is still very small-scale, much of it in the informal sector.Around half of the 418,000 retailers (1991 estimate) are single proprietorships:market vendors accounted for 13% of the total, and family neighbourhoodstores just over one-third. However, over the past two decades there has been agrowing trend towards large shopping complexes, many of them in thevicinity of Manila and geared to the higher incomes in this area. The trend willbe reinforced by legislation opening retail trade to foreign participation,approved by Congress in December 1999. Its provisions set minimum levels forthe size of the foreign partner and its capital injection, designed to attract bigoperators while protecting the small domestic retailer.
Tourism is of great importance to the Philippines. Earnings as recorded in thebalance of payments reached a peak of US$2.34bn in 1997, equivalent to justunder one-tenth of receipts from merchandise exports. (See Reference table 24for data on visitor arrivals by country of residence.) Visitors in that year were alsoat a record, of 2.22m. The US and Japan are the leading source of foreign visitors,the former accounting for 19-20% and the latter for 17-18% of total arrivalsduring 1993-97, but the most dynamic growth during this period was in visitorsfrom South Korea and Taiwan, boosted by developing investment links. Theeconomic crisis in the region in 1997-98 hit the latter group hard, and the rate ofgrowth of visitor arrivals was slackening in late 1997. By the middle of 1998numbers were in decline, and for the full year they were 3.3% down on 1997; ifFilipinos on home visits are excluded, the fall was 5.5%. Tourist earnings fellmuch more sharply, by two-fifths to US$1.42bn. There were signs of a modestrecovery in numbers in the course of 1999 and a very marked improvementin earnings, by 80% to US$2.6bn. Tourism has considerable untapped potential.
The external sector
Trade in goods
Foreign trade, 1999(US$ m)
Exports 35,032
Imports –30,726
Trade balance 4,306
Source: Bangko Sentral ng Pilipinas (BSP).
Until the regional crisis of 1997-98, external trade had been in constant deficit,reflecting the country’s high dependence on the foreign supply of both capitalgoods and intermediates (including oil). (Export and import data are providedin Reference tables 25, 26 and 27.) The imbalance has always been extremelysensitive to trends in GDP. Thus it rose from an average of US$3bn-4bn in theearly 1990s to over US$11bn a year in the peak growth period of 1996-97; thedeficit was then equivalent to around 13% of GDP and exports covered onlyabout two-thirds of imports. As the economy contracted in 1998 importdemand plummeted, falling by 19% in US dollar terms, virtually eliminating
Tourism
A volatile trade balance
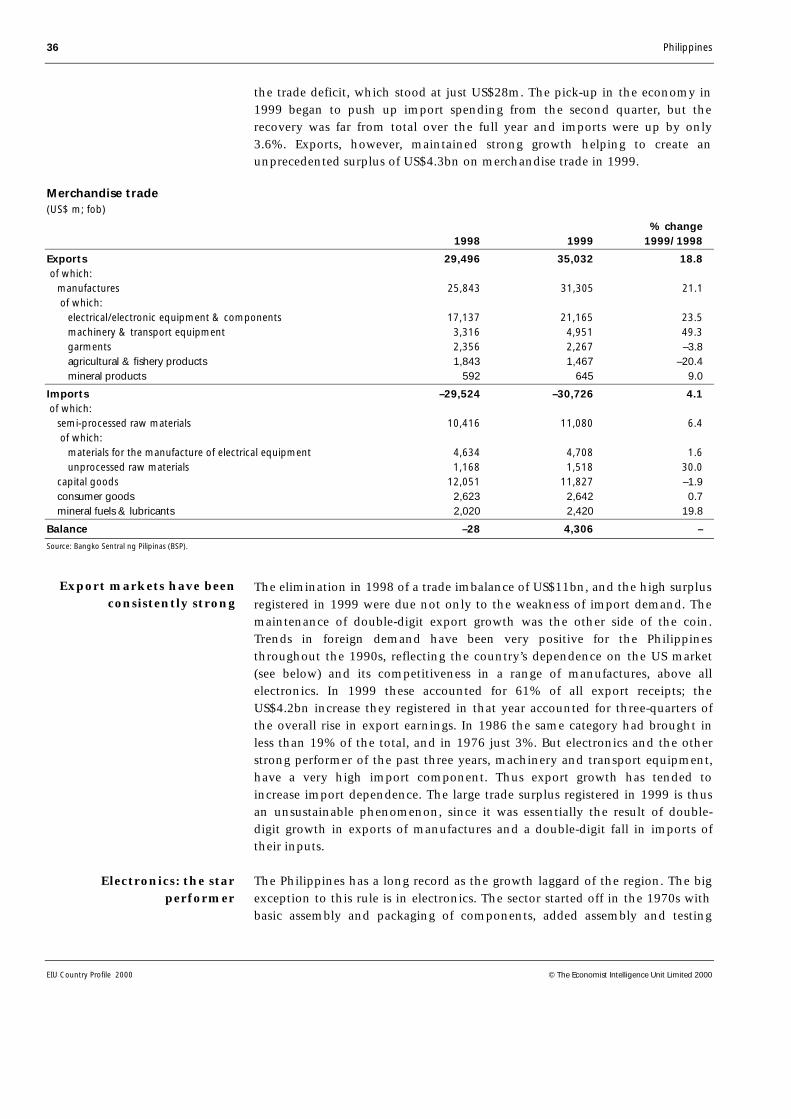
36 Philippines
EIU Country Profile 2000 © The Economist Intelligence Unit Limited 2000
the trade deficit, which stood at just US$28m. The pick-up in the economy in1999 began to push up import spending from the second quarter, but therecovery was far from total over the full year and imports were up by only3.6%. Exports, however, maintained strong growth helping to create anunprecedented surplus of US$4.3bn on merchandise trade in 1999.
Merchandise trade(US$ m; fob)
% change1998 1999 1999/1998
Exports 29,496 35,032 18.8 of which: manufactures 25,843 31,305 21.1 of which: electrical/electronic equipment & components 17,137 21,165 23.5 machinery & transport equipment 3,316 4,951 49.3 garments 2,356 2,267 –3.8 agricultural & fishery products 1,843 1,467 –20.4 mineral products 592 645 9.0
Imports –29,524 –30,726 4.1 of which: semi-processed raw materials 10,416 11,080 6.4 of which: materials for the manufacture of electrical equipment 4,634 4,708 1.6 unprocessed raw materials 1,168 1,518 30.0 capital goods 12,051 11,827 –1.9 consumer goods 2,623 2,642 0.7 mineral fuels & lubricants 2,020 2,420 19.8
Balance –28 4,306 –
Source: Bangko Sentral ng Pilipinas (BSP).
The elimination in 1998 of a trade imbalance of US$11bn, and the high surplusregistered in 1999 were due not only to the weakness of import demand. Themaintenance of double-digit export growth was the other side of the coin.Trends in foreign demand have been very positive for the Philippinesthroughout the 1990s, reflecting the country’s dependence on the US market(see below) and its competitiveness in a range of manufactures, above allelectronics. In 1999 these accounted for 61% of all export receipts; theUS$4.2bn increase they registered in that year accounted for three-quarters ofthe overall rise in export earnings. In 1986 the same category had brought inless than 19% of the total, and in 1976 just 3%. But electronics and the otherstrong performer of the past three years, machinery and transport equipment,have a very high import component. Thus export growth has tended toincrease import dependence. The large trade surplus registered in 1999 is thusan unsustainable phenomenon, since it was essentially the result of double-digit growth in exports of manufactures and a double-digit fall in imports oftheir inputs.
The Philippines has a long record as the growth laggard of the region. The bigexception to this rule is in electronics. The sector started off in the 1970s withbasic assembly and packaging of components, added assembly and testing
Export markets have beenconsistently strong
Electronics: the starperformer
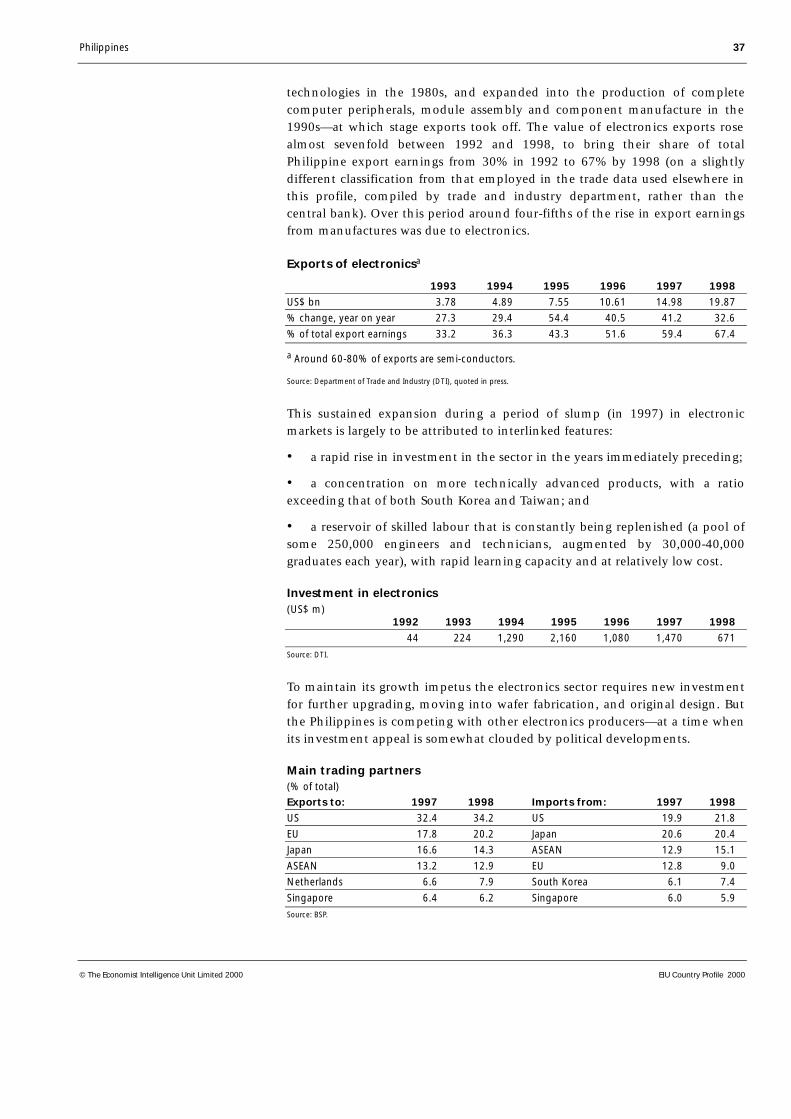
Philippines 37
© The Economist Intelligence Unit Limited 2000 EIU Country Profile 2000
technologies in the 1980s, and expanded into the production of completecomputer peripherals, module assembly and component manufacture in the1990s—at which stage exports took off. The value of electronics exports rosealmost sevenfold between 1992 and 1998, to bring their share of totalPhilippine export earnings from 30% in 1992 to 67% by 1998 (on a slightlydifferent classification from that employed in the trade data used elsewhere inthis profile, compiled by trade and industry department, rather than thecentral bank). Over this period around four-fifths of the rise in export earningsfrom manufactures was due to electronics.
Exports of electronicsa
1993 1994 1995 1996 1997 1998
US$ bn 3.78 4.89 7.55 10.61 14.98 19.87
% change, year on year 27.3 29.4 54.4 40.5 41.2 32.6
% of total export earnings 33.2 36.3 43.3 51.6 59.4 67.4
a Around 60-80% of exports are semi-conductors.
Source: Department of Trade and Industry (DTI), quoted in press.
This sustained expansion during a period of slump (in 1997) in electronicmarkets is largely to be attributed to interlinked features:
• a rapid rise in investment in the sector in the years immediately preceding;
• a concentration on more technically advanced products, with a ratioexceeding that of both South Korea and Taiwan; and
• a reservoir of skilled labour that is constantly being replenished (a pool ofsome 250,000 engineers and technicians, augmented by 30,000-40,000graduates each year), with rapid learning capacity and at relatively low cost.
Investment in electronics(US$ m)
1992 1993 1994 1995 1996 1997 1998
44 224 1,290 2,160 1,080 1,470 671
Source: DTI.
To maintain its growth impetus the electronics sector requires new investmentfor further upgrading, moving into wafer fabrication, and original design. Butthe Philippines is competing with other electronics producers—at a time whenits investment appeal is somewhat clouded by political developments.
Main trading partners(% of total)Exports to: 1997 1998 Imports from: 1997 1998
US 32.4 34.2 US 19.9 21.8
EU 17.8 20.2 Japan 20.6 20.4
Japan 16.6 14.3 ASEAN 12.9 15.1
ASEAN 13.2 12.9 EU 12.8 9.0
Netherlands 6.6 7.9 South Korea 6.1 7.4
Singapore 6.4 6.2 Singapore 6.0 5.9
Source: BSP.
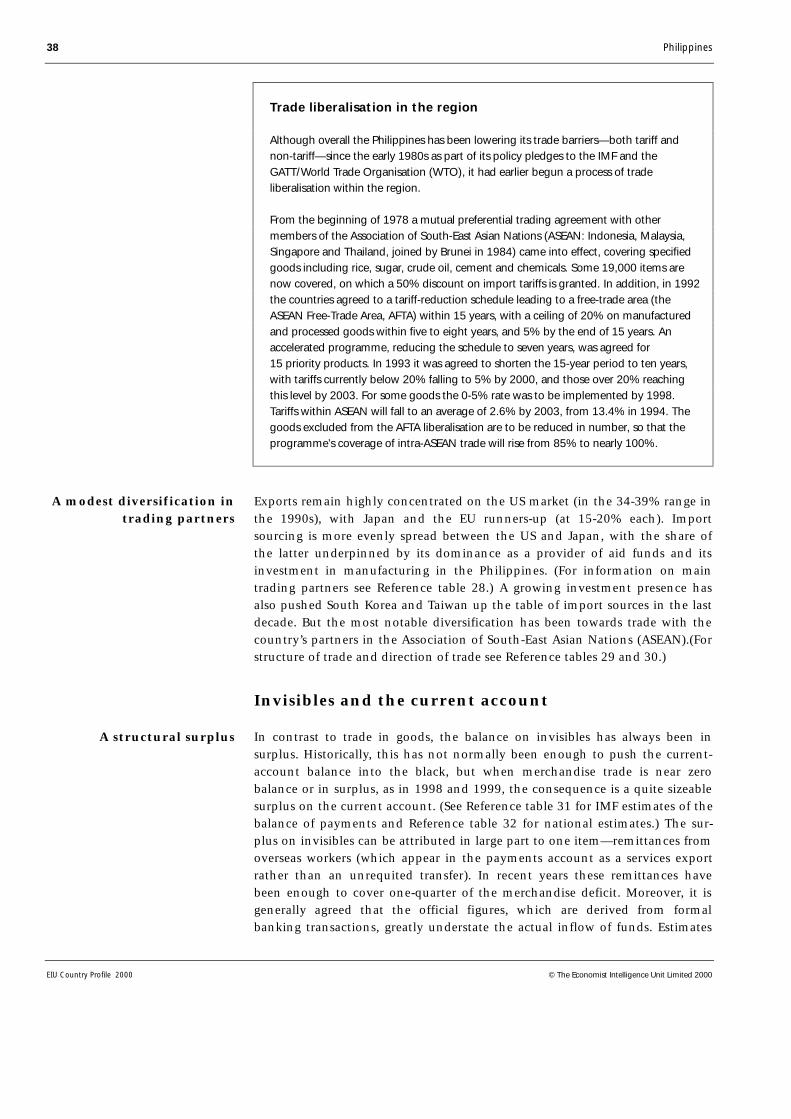
38 Philippines
EIU Country Profile 2000 © The Economist Intelligence Unit Limited 2000
Trade liberalisation in the region
Although overall the Philippines has been lowering its trade barriers—both tariff andnon-tariff—since the early 1980s as part of its policy pledges to the IMF and theGATT/World Trade Organisation (WTO), it had earlier begun a process of tradeliberalisation within the region.
From the beginning of 1978 a mutual preferential trading agreement with othermembers of the Association of South-East Asian Nations (ASEAN: Indonesia, Malaysia,Singapore and Thailand, joined by Brunei in 1984) came into effect, covering specifiedgoods including rice, sugar, crude oil, cement and chemicals. Some 19,000 items arenow covered, on which a 50% discount on import tariffs is granted. In addition, in 1992the countries agreed to a tariff-reduction schedule leading to a free-trade area (theASEAN Free-Trade Area, AFTA) within 15 years, with a ceiling of 20% on manufacturedand processed goods within five to eight years, and 5% by the end of 15 years. Anaccelerated programme, reducing the schedule to seven years, was agreed for15 priority products. In 1993 it was agreed to shorten the 15-year period to ten years,with tariffs currently below 20% falling to 5% by 2000, and those over 20% reachingthis level by 2003. For some goods the 0-5% rate was to be implemented by 1998.Tariffs within ASEAN will fall to an average of 2.6% by 2003, from 13.4% in 1994. Thegoods excluded from the AFTA liberalisation are to be reduced in number, so that theprogramme’s coverage of intra-ASEAN trade will rise from 85% to nearly 100%.
Exports remain highly concentrated on the US market (in the 34-39% range inthe 1990s), with Japan and the EU runners-up (at 15-20% each). Importsourcing is more evenly spread between the US and Japan, with the share ofthe latter underpinned by its dominance as a provider of aid funds and itsinvestment in manufacturing in the Philippines. (For information on maintrading partners see Reference table 28.) A growing investment presence hasalso pushed South Korea and Taiwan up the table of import sources in the lastdecade. But the most notable diversification has been towards trade with thecountry’s partners in the Association of South-East Asian Nations (ASEAN).(Forstructure of trade and direction of trade see Reference tables 29 and 30.)
Invisibles and the current account
In contrast to trade in goods, the balance on invisibles has always been insurplus. Historically, this has not normally been enough to push the current-account balance into the black, but when merchandise trade is near zerobalance or in surplus, as in 1998 and 1999, the consequence is a quite sizeablesurplus on the current account. (See Reference table 31 for IMF estimates of thebalance of payments and Reference table 32 for national estimates.) The sur-plus on invisibles can be attributed in large part to one item—remittances fromoverseas workers (which appear in the payments account as a services exportrather than an unrequited transfer). In recent years these remittances havebeen enough to cover one-quarter of the merchandise deficit. Moreover, it isgenerally agreed that the official figures, which are derived from formalbanking transactions, greatly understate the actual inflow of funds. Estimates
A modest diversification intrading partners
A structural surplus

Philippines 39
© The Economist Intelligence Unit Limited 2000 EIU Country Profile 2000
vary widely as to the volume of the unrecorded remittances, but a World Bankstudy put funds received from overseas Filipinos (both emigrants and contractworkers) at nearly US$6bn in 1994, that is, close to three-quarters of the tradedeficit and equivalent to some 9% of GDP in that year.
There is another large positive item on the invisibles account that is peculiar tothe Philippines—inflows through the conversion to pesos of foreign-currencydeposits. These are balances held by emigrant Filipinos for investmentpurposes by their families in the Philippines, and by exporters. Under theliberalised foreign-exchange system, since 1992 exporters have been free toplace all their US dollar earnings in these accounts, which they do when theyexpect the peso to depreciate, and then convert them to pesos when thecurrency is strengthening or when there are attractive peso assets in which toinvest. The latter response predominated in 1994-96 when conversionsincreased by an average 54% per year, to exceed recorded personal incomeinflows by 1995. However, the combined effect of the currency depreciation inthe second half of 1997 and of the deterioration in expectations was thatcurrency conversions rose by only 2.4% in that year and were down by 42.8%in 1998. Changes in measurement since the beginning of 1999 mean that pesoconversions are no longer separately identified, but other evidence wouldindicate a further, less marked, slackening during 1999.
Most other inflows on the invisibles account pale into insignificance againstthese, although tourism makes a useful contribution, at US$2.3bn in 1997,US$1.4bn in 1998 and US$2.6bn in 1999. By far the most important outflowon invisibles is interest, arising from the Philippines’ substantial and con-tinually rising external borrowing. Interest payments have, however, tended tostabilise in recent years, partly because of debt rescheduling and restructuringagreements since the mid-1980s, culminating in two deals, in 1990 and 1991,for debt buyback and the conversion of some commercial bank debt to long-term bonds.
Current account(US$ m)
1998 1999
Merchandise exports fob 29,496 35,032
Merchandise imports fob –29,524 –30,726
Trade balance –28 4,306
Exports of services 13,917 12,854 of which: personal income 4,926 6,794a
net conversions of foreign-currency deposits 3,437 n/a
Imports of services –12,778 –10,453 of which: interest payments –2,257 –2,465
Net transfers 435 481
Current-account balance 1,546 7,188
a Contains flows previously classified as peso conversions.
Source: BSP.

40 Philippines
EIU Country Profile 2000 © The Economist Intelligence Unit Limited 2000
Transfers other than workers’ remittances make a minor positive contribution,but the official component has changed little in most recent years as thecountry’s middle-income status makes it ineligible for much in the way ofgrant funding.
Capital flows and foreign debt
The Philippines’ large current-account financing requirement in the past hastraditionally been met mainly by borrowing, from both official and privatesources, and aid (see Reference tables 33 and 34). The country’s foreign debt,according to World Bank statistics, rose from US$24.4bn at the end of 1984 toUS$47.8bn in 1998. For most of this period the maturity profile of the debt wasshifting away from short-term debt, whose share fell from an average of 37.6%of the total in 1983-85 to an average of 13.7% in 1994-95. This reflected themajor funding support given to the Aquino administration by multilaterallending institutions and the country’s bilateral official creditors. As a result,official creditors accounted for 58% of total external debt at the end of 1995,compared with 26% in 1985. The trend towards greater long-term debt wasinterrupted in 1996-97 by an increase in short-term debt mainly to financetrade. With the onset of the financial crisis in mid-1997 and in tandem withfalling imports, short-term trade debt had eased down to US$2.1bn bySeptember 1999 but other short-term debt rose from US$3.1bn (figures fromthe Bangko Sentral ng Pilipinas, BSP, the central bank) at the end of 1996 toUS$4.5bn in September 1999. At that date short-term liabilities represented13% of total external indebtedness of US$51.17bn, down from 26% at the endof 1997.
There has been a marked change in the character of long-term borrowing fromprivate sources, which is now overwhelmingly in the form of bonds, ratherthan commercial bank loans. As recently as 1990 commercial bank creditsaccounted for 79% of all long-term borrowing from private sources whereas in1997 the proportion was only 16.5%. The change reflected the improved creditrating of corporate entities and the debt-restructuring agreement of 1992,under which US$1.3bn in commercial bank debt was bought back and anotherUS$3.3bn converted to long-term bonds.
Summary of foreign debt, 1998(end-period)
US$ m % of total
Long-term debt 39,063 81.6 Public & publicly guaranteed 28,189 58.9 Official creditors 20,209 42.2 Private creditors 7,980 16.7 of which: bonds 6,357 13.3 Private non-guaranteed 10,875 22.7
Use of IMF credit 1,568 3.3
Short-term debt 7,185 15.0
Total external debt 47,900 100.0
Source: World Bank, Global Development Finance.
A long-term fall in short-term liabilities
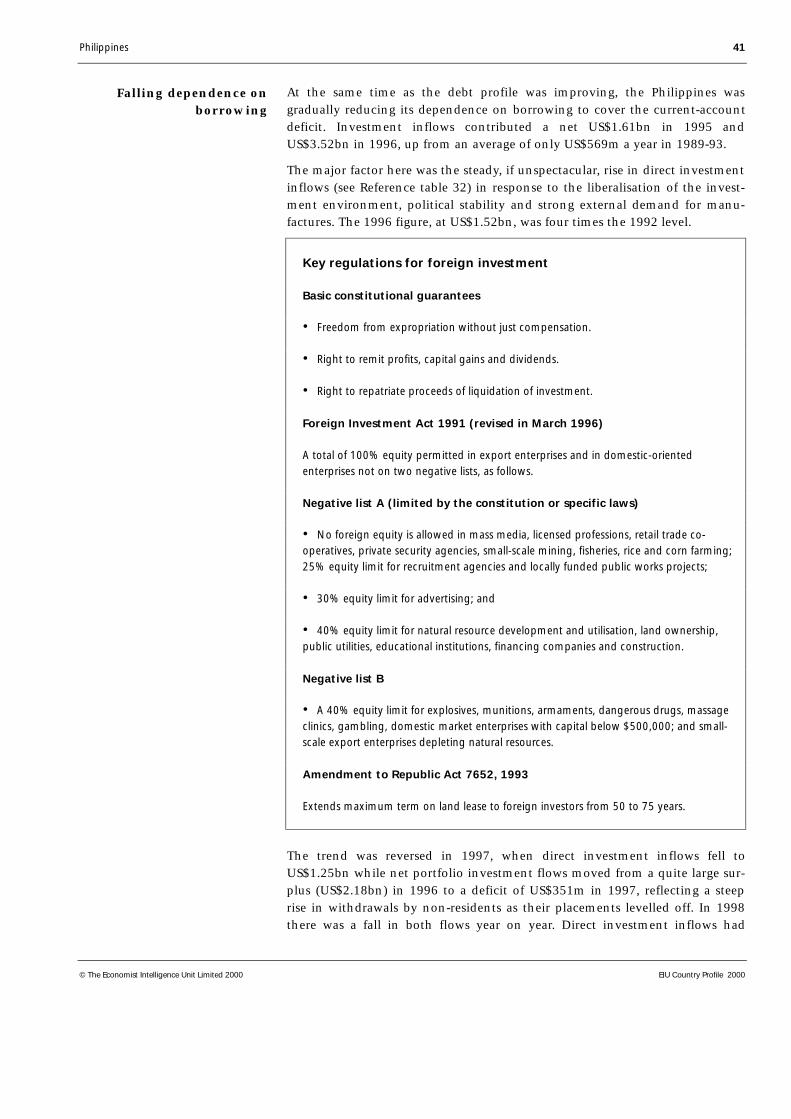
Philippines 41
© The Economist Intelligence Unit Limited 2000 EIU Country Profile 2000
At the same time as the debt profile was improving, the Philippines wasgradually reducing its dependence on borrowing to cover the current-accountdeficit. Investment inflows contributed a net US$1.61bn in 1995 andUS$3.52bn in 1996, up from an average of only US$569m a year in 1989-93.
The major factor here was the steady, if unspectacular, rise in direct investmentinflows (see Reference table 32) in response to the liberalisation of the invest-ment environment, political stability and strong external demand for manu-factures. The 1996 figure, at US$1.52bn, was four times the 1992 level.
Key regulations for foreign investment
Basic constitutional guarantees
• Freedom from expropriation without just compensation.
• Right to remit profits, capital gains and dividends.
• Right to repatriate proceeds of liquidation of investment.
Foreign Investment Act 1991 (revised in March 1996)
A total of 100% equity permitted in export enterprises and in domestic-orientedenterprises not on two negative lists, as follows.
Negative list A (limited by the constitution or specific laws)
• No foreign equity is allowed in mass media, licensed professions, retail trade co-operatives, private security agencies, small-scale mining, fisheries, rice and corn farming;25% equity limit for recruitment agencies and locally funded public works projects;
• 30% equity limit for advertising; and
• 40% equity limit for natural resource development and utilisation, land ownership,public utilities, educational institutions, financing companies and construction.
Negative list B
• A 40% equity limit for explosives, munitions, armaments, dangerous drugs, massageclinics, gambling, domestic market enterprises with capital below $500,000; and small-scale export enterprises depleting natural resources.
Amendment to Republic Act 7652, 1993
Extends maximum term on land lease to foreign investors from 50 to 75 years.
The trend was reversed in 1997, when direct investment inflows fell toUS$1.25bn while net portfolio investment flows moved from a quite large sur-plus (US$2.18bn) in 1996 to a deficit of US$351m in 1997, reflecting a steeprise in withdrawals by non-residents as their placements levelled off. In 1998there was a fall in both flows year on year. Direct investment inflows had
Falling dependence onborrowing

42 Philippines
EIU Country Profile 2000 © The Economist Intelligence Unit Limited 2000
meanwhile strengthened to a new high of US$1.75bn. This meant thatinvestment flows contributed a net US$1.67bn in 1998—back to their 1995level. The contribution of net inflows of long-term credit rose sharply in thecrisis year of 1997, to US$4.82bn from US$2.84bn in 1996, more than coveringthe deficit on the current account. In the following year, as drawings fell byUS$2bn, the net figure was back to the 1996 level.
Year on year there was a major improvement in the capital account in 1999.Net inflows of both medium- and long-term loans and total investment wererising during the year. But while volumes of portfolio transactions in bothdirections were up, placements of direct investment stagnated.
Capital account(US$ m; national figures)
1998 1999
Inflows of direct investment 1,752 1,077
Outflows of direct investment –160 –206
Inflows of portfolio investment 264 512
Outflows of portfolio investment –184 –165
Inflows of medium- & long-term capital 6,025 9,279
Outflows of medium- & long-term capital –3,285 –4,563
Short-term capital (net) –1,521 –3,610
Change in net foreign assets of commercial banks –1,330 –1,836
Trading of bonds in secondary market –1,083 102
Capital-account balance 478 590
Source: BSP.
Foreign reserves and the exchange rate
Reserves rose during 1991-96, as comparatively high interest rates, anappreciating currency (between 1993 and 1995) and foreign-exchangeliberalisation (in August 1992) pushed up capital inflows to more than com-pensate for the current-account deficit. In the first half of 1997 they werehovering around the US$10bn mark (excluding gold). The currency and fin-ancial crisis that set in during July 1997 hit foreign reserves hard. Initialattempts by the BSP to defend the peso pulled reserves down to US$8.3bn inthat month, and persistent pressure to meet repayment obligations meant thatdespite concessional funds from the IMF and Japan and the BSP’s sale of one-year notes, by the end of 1997 foreign-exchange reserves were down toUS$7.3bn (according to the IMF’s International Financial Statistics figure). Theyhave since recovered strongly to record levels, despite the sharp fall in thesurplus on the capital payments account in 1998, because of the rising surpluson the current account. By end-1999 total reserves (excluding gold) were put atUS$13.2bn by the IMF; the central bank estimate including gold was US$15bn(see Reference table 36).
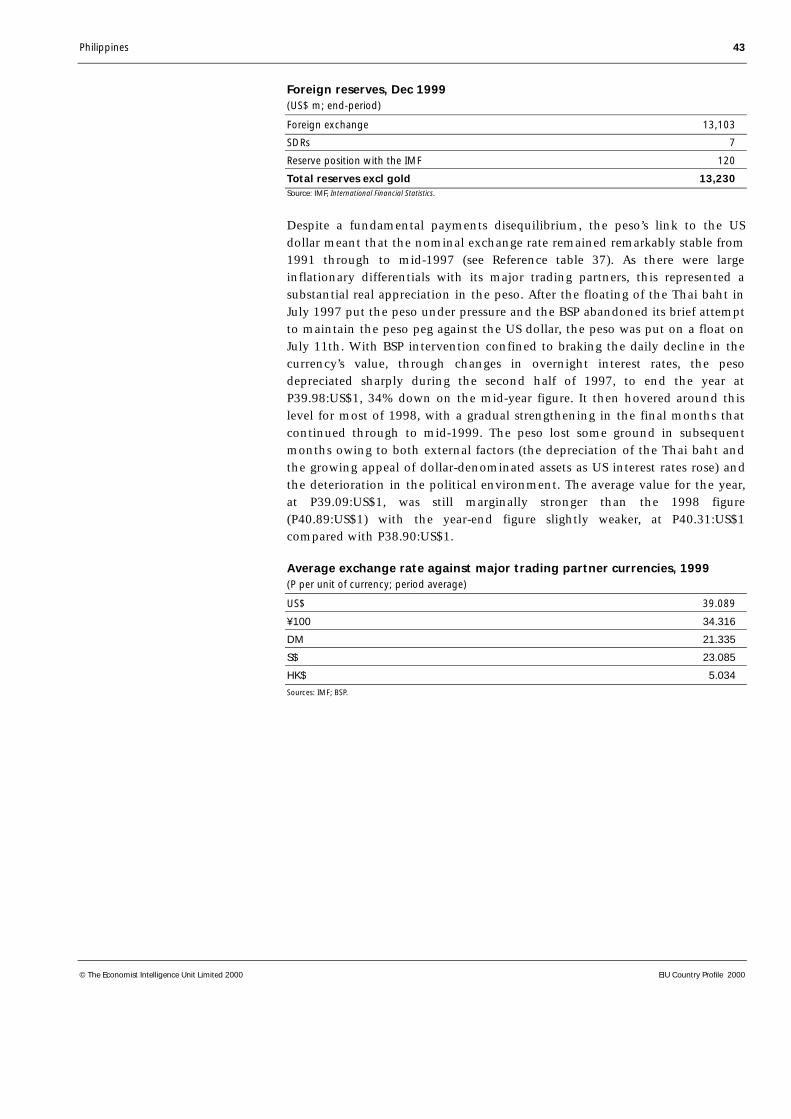
Philippines 43
© The Economist Intelligence Unit Limited 2000 EIU Country Profile 2000
Foreign reserves, Dec 1999(US$ m; end-period)
Foreign exchange 13,103
SDRs 7
Reserve position with the IMF 120
Total reserves excl gold 13,230Source: IMF, International Financial Statistics.
Despite a fundamental payments disequilibrium, the peso’s link to the USdollar meant that the nominal exchange rate remained remarkably stable from1991 through to mid-1997 (see Reference table 37). As there were largeinflationary differentials with its major trading partners, this represented asubstantial real appreciation in the peso. After the floating of the Thai baht inJuly 1997 put the peso under pressure and the BSP abandoned its brief attemptto maintain the peso peg against the US dollar, the peso was put on a float onJuly 11th. With BSP intervention confined to braking the daily decline in thecurrency’s value, through changes in overnight interest rates, the pesodepreciated sharply during the second half of 1997, to end the year atP39.98:US$1, 34% down on the mid-year figure. It then hovered around thislevel for most of 1998, with a gradual strengthening in the final months thatcontinued through to mid-1999. The peso lost some ground in subsequentmonths owing to both external factors (the depreciation of the Thai baht andthe growing appeal of dollar-denominated assets as US interest rates rose) andthe deterioration in the political environment. The average value for the year,at P39.09:US$1, was still marginally stronger than the 1998 figure(P40.89:US$1) with the year-end figure slightly weaker, at P40.31:US$1compared with P38.90:US$1.
Average exchange rate against major trading partner currencies, 1999(P per unit of currency; period average)
US$ 39.089
¥100 34.316
DM 21.335
S$ 23.085
HK$ 5.034
Sources: IMF; BSP.

44 Philippines
EIU Country Profile 2000 © The Economist Intelligence Unit Limited 2000
Appendices
Sources of information
Bangko Sentral ng Pilipinas (BSP), Selected Philippine Economic Indicators, Manila
National Statistical Co-ordination Board (NSCB), Philippines Statistical Yearbook,Manila
National Statistics Office (NSO), Monthly Bulletin of Statistics, Manila
National Statistics Office (NSO), Philippines Yearbook, Manila
Energy Data Associates, Bishops Walk House, 19-23 High Street, Pinner,Middlesex HA5 5PJ
Bank for International Settlements, International Banking and Financial MarketDevelopments (quarterly)
Food and Agriculture Organisation, Quarterly Bulletin of Statistics, Rome
IMF, International Financial Statistics (monthly)
International Finance Corporation, Emerging Stockmarkets Factbook (annual)
International Institute for Strategic Studies, The Military Balance (annual),London
OECD, Geographical Distribution of Financial Flows to Aid Recipients (annual)
World Bank, Global Development Finance (annual)
World Bank, World Development Report (annual)
World Bureau of Metal Statistics, World Metal Statistics Yearbook
John Bresnan (ed), Crisis in the Philippines: The Marcos Era and Beyond, PrincetonUniversity Press, Princeton, 1987
Department of Energy, Philippines Energy Plan 1994-2010, Manila, 1997
Roland E Dolan (ed), The Philippines: A Country Study, Federal ResearchDivision, Library of Congress, Washington, 1993
E Gutierrez, I Torrente and N Narza, All in the Family: A Study of Elites and PowerRelations in the Philippines, Institute for People’s Democracy, Quezon City, 1992
Erika Jorgensen, A Strategy to Fight Poverty, World Bank, Washington, 1996
National Economic Development Authority (NEDA), Updated Medium-TermPhilippine Development Plan 1996-1998, Manila, 1997
James Putzel, A Captive Land, Catholic Institute for International Relations,London, 1992
National statistical sources
International statisticalsources
Select bibliography
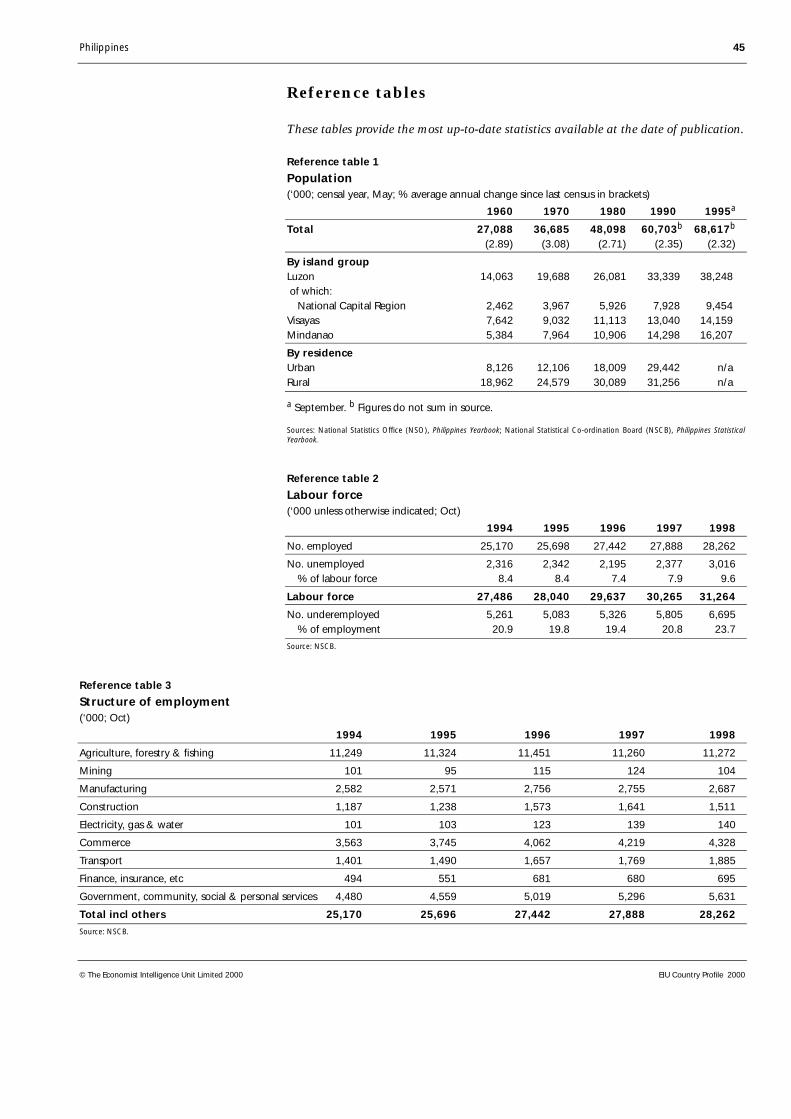
Philippines 45
© The Economist Intelligence Unit Limited 2000 EIU Country Profile 2000
Reference tables
These tables provide the most up-to-date statistics available at the date of publication.
Reference table 1
Population(‘000; censal year, May; % average annual change since last census in brackets)
1960 1970 1980 1990 1995a
Total 27,088 36,685 48,098 60,703b 68,617b
(2.89) (3.08) (2.71) (2.35) (2.32)
By island groupLuzon 14,063 19,688 26,081 33,339 38,248 of which: National Capital Region 2,462 3,967 5,926 7,928 9,454 Visayas 7,642 9,032 11,113 13,040 14,159 Mindanao 5,384 7,964 10,906 14,298 16,207
By residenceUrban 8,126 12,106 18,009 29,442 n/a Rural 18,962 24,579 30,089 31,256 n/a
a September. b Figures do not sum in source.
Sources: National Statistics Office (NSO), Philippines Yearbook; National Statistical Co-ordination Board (NSCB), Philippines StatisticalYearbook.
Reference table 2
Labour force(‘000 unless otherwise indicated; Oct)
1994 1995 1996 1997 1998
No. employed 25,170 25,698 27,442 27,888 28,262
No. unemployed 2,316 2,342 2,195 2,377 3,016 % of labour force 8.4 8.4 7.4 7.9 9.6
Labour force 27,486 28,040 29,637 30,265 31,264
No. underemployed 5,261 5,083 5,326 5,805 6,695 % of employment 20.9 19.8 19.4 20.8 23.7
Source: NSCB.
Reference table 3
Structure of employment(‘000; Oct)
1994 1995 1996 1997 1998
Agriculture, forestry & fishing 11,249 11,324 11,451 11,260 11,272
Mining 101 95 115 124 104
Manufacturing 2,582 2,571 2,756 2,755 2,687
Construction 1,187 1,238 1,573 1,641 1,511
Electricity, gas & water 101 103 123 139 140
Commerce 3,563 3,745 4,062 4,219 4,328
Transport 1,401 1,490 1,657 1,769 1,885
Finance, insurance, etc 494 551 681 680 695
Government, community, social & personal services 4,480 4,559 5,019 5,296 5,631
Total incl others 25,170 25,696 27,442 27,888 28,262
Source: NSCB.

46 Philippines
EIU Country Profile 2000 © The Economist Intelligence Unit Limited 2000
Reference table 4
Transport statistics
1994 1995 1996 1997 1998
RoadsLength (km) 161,036 161,009 n/a n/a n/a of which: concrete/asphalt 26,790 26,849 n/a n/a n/a Motor vehicles registered (‘000) 2,342 2,581 2,905 3,194 3,317 of which: private cars 537 582 642 667 667
RailPhilippine National Railways Passengers (‘000) 426 589 300 614 578 Freight (‘000 tonnes) 12.3 14.1 n/a n/a n/aMetro Manila Rail Commuter passengers (‘000) 2,845 4,055 3,007 3,077 4,702
PortsTotal cargo handled (m tonnes) 124.0 127.3 140.1 145.1 137.9 Domestic shipping fleet (‘000 grt) 1,534 1,646 1,095 1,596 1,866 of which: cargo & container ships 562 566 451 441 544
AirPhilippine Airlines Passenger-km (m) 13,967 14,372 15,132 15,735 9,428 Tonne-km (m) 1,776 1,798 1,893 1,972 1,210
Source: NSCB.
Reference table 5
Energy consumption by source(m barrels oil equivalent)
1994 1995 1996 1997 1998
Indigenous 42.51a 92.25 97.13 97.11 97.66 Oil 0.55 0.03 0.45 0.16 0.27 Coal 6.59 6.09 5.06 4.05 4.84 Hydroelectricity 10.11 10.71 12.17 10.84 8.77 Geothermal 10.90 10.58 11.30 12.48 15.36 Non-conventional (bagasse etc) 14.03b 64.84 66.39 68.15 68.38
Imported 104.34 117.51 125.73 144.61 142.12 Oil 102.19 113.98 117.40 132.76 128.93 Coal 2.16 3.53 8.34 13.19 13.19
Total 146.85 209.75 222.86 241.72 239.78
a Does not sum in source. b Excludes agricultural and wood waste subsequently recorded.
Source: NSCB.

Philippines 47
© The Economist Intelligence Unit Limited 2000 EIU Country Profile 2000
Reference table 6
Trend of government revenue and expenditure(P bn unless otherwise indicated; cash operations)
1995 1996 1997 1998 1999
Revenue 361.2 410.5 471.8 462.5 478.5 of which: tax 310.5 367.9 412.2 416.6 431.7
Expenditure 350.1 404.2 470.3 512.5 590.2 of which: current 289.1 319.1 419.4 467.9 n/a of which: interest 72.7 76.5 78.0 99.8 106.3 capital 61.1 42.2 47.9 43.5 n/a
Balance 11.1 6.3 1.6 –50.0 –111.7 % of GDP 0.6 0.3 0.1 –1.8 –3.7
FinancingDomestic borrowing (net) 24.3 49.3 –20.3 76.6 98.9 Foreign borrowing (net) –13.3 –6.0 –6.8 12.3 82.8 Non-budgetary accounts, use of cash balances & miscellaneous –22.0 –49.6 25.5 38.9 70.0
Memorandum itemConsolidated public-sector balance –4.1 7.3 –24.1 –83.2 –102.8
Sources: NSCB, Economic Indicators; BSP, Selected Philippine Economic Indicators.
Reference table 7
Outstanding internal public debt(P bn; end-period)
1994 1995 1996 1997 1998
National government 613.7 669.9 714.2 716.5 797.0
Government corporations 6.4 7.3 6.9 9.1 10.1
Total incl others 624.6 677.9 721.3 725.7 807.2
Source: NSCB, Philippines Statistical Yearbook.
Reference table 8
Money supply and credit(P bn unless otherwise indicated; end-period)
1995 1996 1997 1998 1999
Currency in circulation 110.89 122.95 143.64 146.06 218.48
Demand deposits 72.04 96.41 111.92 134.09 180.89a
M1 incl others 194.63 233.12 266.33 285.95 338.31a
% change, year on year 21.7 19.8 14.2 7.4 30.8
Time, saving & foreign-currency deposits 765.20 949.71 1,225.32 1,332.79 1,418.65a
M2 959.83 1,182.83 1,491.65 1,618.74 1,756.95 % change, year on year 24.2 23.2 26.1 8.5 13.8
Domestic credit 1,036.60 1,454.32 1,893.28 1,859.57 1,843.19b
Claims on central & local
government (net) 271.11 305.60 409.99 405.54 436.00b
Claims on non-financial public enterprises 16.80 21.92 28.58 44.77 56.15a
Claims on private sector 715.34 1,063.80 1,370.08 1,277.76 1,256.06a
Claims on other financial institutions 33.35 66.73 84.63 131.49 146.77a
Net foreign assets 117.90 70.24 –48.93 104.63 238.40a
a End-November. b End-August.
Source: IMF, International Financial Statistics.

48 Philippines
EIU Country Profile 2000 © The Economist Intelligence Unit Limited 2000
Reference table 9
Interest rates(% annual rate; period averages)
1995 1996 1997 1998 1999
Manila reference ratea 10.0 11.8 13.1 15.4 10.4
91-day Treasury bills 11.3 12.4 13.1 15.3 10.2
Bank average lending rate 14.6 14.8 16.2 18.4 11.8
a All maturities.
Source: BSP, Selected Philippine Economic Indicators.
Reference table 10
Gross domestic product1995 1996 1997 1998 1999
Total (P bn)At current prices 1,906.0 2,171.9 2,423.6 2,667.1 2,989.1At constant (1985) prices 802.2 849.1 893.2 887.9 917.4 % change, year on year 4.7 5.8 5.2 –0.6 3.3
Per head (P)At current prices 27,124 30,207 32,929 35,490 38,919At constant (1985) prices 11,425 11,810 12,147 11,815 11,945 % change, year on year 2.4 3.3 2.9 –2.7 1.1
Source: NSCB, National Accounts of the Philippines.
Reference table 11
Gross domestic product by expenditure(P m at constant 1985 prices; % change year on year in brackets)
1995 1996 1997 1998 1999
Private consumption 622,985 651,790 684,316 707,904 726,578(3.8) (4.6) (5.0) (3.4) (2.6)
Government consumption 65,680 68,527 71,703 70,305 74,065(5.4) (4.3) (4.6) (–1.9) (5.3)
Fixed capital formation 184,667 206,854 230,589 204,829 200,698(4.7) (12.0) (11.5) (–11.2) (–2.0)
Change in stocks 2,464 3,586 4,463 –8,035 –7,279
Exports of goods & services 344,181 397,201 465,322 367,447 380,755(12.0) (15.4) (17.2) (–21.0) (3.6)
Imports of goods & services 428,475 500,194 567,672 484,235 470,673(16.0) (16.7) (13.5) (–14.7) (–2.8)
GDPa 802,224 849,121 893,151 888,905 917,382(4.7) (5.8) (5.2) (–0.6) (3.3)
Net factor income from abroad 22,301 35,105 37,507 46,481 51,174(12.8) (57.4) (6.8) (24.0) (10.1)
GNP 824,525 884,226 930,658 934,386 968,556(4.9) (7.2) (5.3) (0.4) (3.7)
a Including statistical discrepancy.
Source: NSCB.

Philippines 49
© The Economist Intelligence Unit Limited 2000 EIU Country Profile 2000
Reference table 12
Gross domestic product by sector(P m at constant 1985 prices; % change year on year in brackets)
1995 1996 1997 1998 1999
Agriculture, forestry & fishing 172,848 179,451 185,004 173,106 183,407(0.8) (3.8) (3.1) (–6.4) (6.0)
Mining 10,035 10,166 10,338 10,624 9,736(–7.8) (1.3) (1.7) (2.8) (–8.4)
Manufacturing 203,271 214,613 223,672 221,151 224,667(6.8) (5.6) (4.2) (–1.1) (1.6)
Construction 44,492 49,339 57,322 51,791 50,988(6.5) (10.9) (16.2) (–9.6) (–1.6)
Utilities 26,060 28,008 29,357 30,315 31,259(13.0) (7.5) (4.8) (3.3) (3.1)
Transport & communications 47,366 50,878 55,067 58,640 61,726(5.8) (7.4) (8.2) (6.5) (5.3)
Commerce 123,430 130,247 135,326 138,641 145,406(5.6) (5.5) (3.9) (2.4) (4.9)
Finance 33,852 38,513 43,509 45,445 46,311(7.3) (13.8) (13.0) (4.4) (1.9)
Ownership of housing & real estate 43,765 45,576 47,297 48,065 48,350(3.0) (4.1) (3.8) (1.6) (0.6)
Private services 55,461 58,231 61,040 63,880 67,582(4.3) (5.0) (4.8) (4.7) (5.8)
Government services 41,644 44,099 45,219 46,405 47,950(3.7) (5.9) (2.5) (0.6) (3.3)
GDP (incl statistical discrepancy) 802,224 849,121 893,151 887,905 917,382(4.7) (5.8) (5.2) (–0.6) (3.3)
Source: NSCB, National Accounts of the Philippines.
Reference table 13
Prices and earnings(period averages)
1995 1996 1997 1998 1999
Consumer prices (1995=100) 100.0 109.0 115.5 126.7 135.2 % change, year on year 8.0 9.0 6.0 9.7 6.7
Wholesale prices (1995=100) 100.0 109.1 109.7 122.5 n/a % change, year on year 3.3 9.1 0.5 11.7 n/a
Minimum daily non-agricultural wage in National Capital Region (P)a 157.08 175.86 199.07 214.50 228.32 % real change –6.3 3.6 8.1 3.5 1.4
a Including allowances.
Sources: IMF, International Financial Statistics; BSP.

50 Philippines
EIU Country Profile 2000 © The Economist Intelligence Unit Limited 2000
Reference table 14
Production of major crops(‘000 tonnes unless otherwise indicated)
1994 1995 1996 1997 1998
Rice 10,538 10,541 11,284 11,269 8,555
Maize (unshelled) 4,519 4,128 4,151 4,332 3,823
Coconuts (m tonnes) 11.21 12.18 11.37 12.05 10.91
Sugar 1,793 1,562 1,894 1,954 1,549
Bananas 3,193 3,490 3,304 3,774 3,561
Pineapples 1,324 1,443 1,542 1,638 1,495
Mangoes 542 595 625 987 932
Coffee 133 134 119 130 121
Rubber 179 181 192 221 228
Tobacco 57 64 65 65 71
Abaca 66 65 70 67 71
Sources: NSCB; International Sugar Organisation.
Reference table 15
Meat production(‘000 tonnes)
1994 1995 1996 1997 1998
Pork 997 1,050 1,037 1,037 1,100
Beef & buffalo 118 120 161 177 176a
Poultry 380 403 474 516 525a
a Estimates.
Source: UN Food and Agriculture Organisation (FAO), Production Yearbook.
Reference table 16
Output of wood products(’000 cu metres)
1994 1995 1996 1997 1998
Lumber 407 286 313 351 216
Logs 957 758 771 556 570
Plywood 258 290 508 484 246
Veneer 39 19 82 62 58
Source: NSCB.
Reference table 17
Fishing production(‘000 tonnes)
1994 1995 1996 1997 1998
Commercial fishing 859 893 879 885 941
Aquaculture 869 919 981 957 960
Municipal & sustenance fishinga 993 972 909 924 891
Total 2,721 2,784 2,769 2,767 2,791
a Fishing with boats of 3 grt or less, or without boats.
Source: NSCB.

Philippines 51
© The Economist Intelligence Unit Limited 2000 EIU Country Profile 2000
Reference table 18
Minerals production(‘000 tonnes unless otherwise indicated)
1995 1996 1997 1998 1999
Golda (tonnes) 12.8 8.1 11.2 8.7 6.7
Silver (tonnes) 31.1 25.1 19.6 18.8 18.8
Nickela 17.2 14.7 17.4 23.7 20.7
Coppera 108.1 61.6 42.5 46.5 34.0
Copper (refined) 158.1 155.8 146.6 152.4 149.6
Chromite (refractory ore) 66.8 62.9 54.2 19.7 n/a
Coal 1,322 1,047 1,077 1,154 n/a
Crude oil 151.0 47.0 43.0 41.6 n/a
a Ores and concentrates.
Sources: World Bureau of Metal Statistics, World Metal Statistics Yearbook; NSCB.
Reference table 19
Manufacturing production(% volume change, year on year)
1995 1996 1997 1998 1999
Food –6.2 8.1 5.7 5.3 14.3
Beverages –1.1 4.7 24.8 3.4 –7.7
Tobacco 0.5 5.4 –10.6 5.2 11.4
Textiles 10.8 –6.7 –10.0 –11.0 –23.5
Garments & footwear –8.9 –36.8 –16.0 –31.0 –19.1
Wood & products –12.7 –6.0 0.2 –8.0 –12.4
Furniture & fixtures 141.2 1.7 9.8 2.1 –6.2
Paper & products 23.0 –16.3 –30.3 8.3 –13.5
Chemicals, plastics & products 9.9 –0.9 3.6 –2.9 6.1
Petroleum refineries 37.6 18.6 –12.2 –10.9 –18.4
Rubber products –15.3 –22.2 –46.5 –8.5 4.4
Glass & products 6.7 8.0 –4.6 35.1 –9.5
Cement 6.5 4.8 2.8 –21.6 –17.5
Non-metallic mineral products 21.1 1.0 32.3 –24.1 –13.7
Iron & steel 8.5 6.7 –1.6 –32.1 –29.5
Non-ferrous metal 60.1 –21.6 –1.2 0.6 –5.1
Electrical machinery 22.5 27.5 50.1 5.2 8.5
Transport equipment 32.3 0.6 –11.8 –48.5 18.2
Total incl others 13.1 4.2 5.0 –11.5 3.0
Source: BSP.

52 Philippines
EIU Country Profile 2000 © The Economist Intelligence Unit Limited 2000
Reference table 20
Structure of manufacturing industry, 1995a
Total average CensusNo. of employment value added
establishments (‘000) (P m)
Food 2,508 162.5 74,448
Beverages 88 25.0 33,132
Tobacco 20 11.1 18,563
Textiles 491 55.9 12,394
Wearing apparel 1,612 144.6 18,632
Leather products (excl footwear) 84 8.1 739
Leather footwear 370 14.6 1,060
Wood & cork products (excl furniture) 351 23.8 2,871
Furniture 470 23.5 2,241
Paper & paper products 205 19.0 8,003
Printing & publishing 632 23.4 5,420
Industrial chemicals 189 12.0 9,724
Other chemical products 293 32.4 36,417
Petroleum refining 4 2.6 40,819
Miscellaneous petroleum & coal products 16 0.6 467
Rubber products 175 19.9 5,149
Plastics products 359 25.0 7,268
Pottery & china 59 8.4 1,387
Glass & glass products 46 5.2 3,848
Cement 18 7.0 9,502
Other non-metallic mineral products 249 12.4 3,379
Iron & steel 196 22.9 14,101
Non-ferrous metal 40 4.2 6,496
Fabricated metal products (excl machinery & equipment) 548 33.3 6,078
Non-electric machinery & equipment 451 28.9 8,075
Electrical machinery & apparatus 287 127.1 43,504
Transport equipment 253 25.3 15,625
Professional & scientific equipment 18 6.9 990
Total incl others 10,219 911.3 394,019
a Establishments employing ten or more workers.
Source: NSCB.
Reference table 21
Private construction
1994 1995 1996 1997 1998
Building permitsTotal (no.) 50,931 76,073 93,631 115,566 82,971 of which: residential 50,277 53,777 67,251 85,541 n/a
continued

Philippines 53
© The Economist Intelligence Unit Limited 2000 EIU Country Profile 2000
1994 1995 1996 1997 1998
Value (P m) 56,072 68,066 102,185 123,453 69,163 of which: National Capital Region 26,937 33,065 57,784 71,962 25,245 residential 21,523 24,594 31,167 33,403 n/a
Sources: NSCB; NSO, Monthly Statistical Bulletin..
Reference table 22
Assets of financial systema
(P m; end-period)
1995 1996 1997 1998 1999b
Commercial banks 1,347.4 1,876.2 2,513.0 2,528.0 2,641.1
Thrift banks 143.3 185.1 208.4 216.4 220.3
Rural banks 36.6 48.0 57.6 60.0 61.5c
Specialised government banksd 68.2 0.3 – – –
Non-bank financial institutions 453.9 527.7 590.3 648.2 650.1e
Total 2,049.4 2,637.3 3,369.3 3,452.6 n/a
a Excluding central bank. b November. c September. d Consolidated with commercial banks during1996. e October.
Source: BSP.
Reference table 23
Philippines Stock Exchange indicators
1995 1996 1997 1998 1999
Market capitalisation (P bn; year-end) 1,544 2,120 1,251 1,374 1,939
Composite index (year-end) 594 3,171 1,869 1,969 2,143
No. of companies listed 205 216 221 221 226
Total turnover (P bn) 380.3 666.7 586.3 408.7 770.0
Source: International Finance Corporation, Emerging Stockmarkets Review.
Reference table 24
Visitor arrivals by country of residence(‘000)
1995 1996 1997 1998 1999
US 342 374 427 469 463
Japan 323 350 377 362 388
Hong Kong 107 149 160 163 160
Taiwan 190 207 246 186 144
South Korea 122 174 170 82 133
UK 71 84 95 98 n/a
Australia 76 88 94 86 90
Canada 46 57 64 67 n/a
Germany 51 60 63 64 n/a
Overseas Filipinos 150 143 135 174 199
Total incl others 1,760 2,049 2,223 2,149 2,170
Sources: NSCB; press reports.

54 Philippines
EIU Country Profile 2000 © The Economist Intelligence Unit Limited 2000
Reference table 25
Exports(customs statistics, fob; US$ m)
1995 1996 1997 1998 1999
Electrical & electronic equipment & components 7,413 9,988 13,028 17,137 21,165
Machinery & transport equipment 741 1,294 2,685 3,316 4,951
Garments 2,570 2,423 2,349 2,356 2,267
Coconut oil 826 571 673 706 342
Chemicals 343 353 383 340 294
Processed food & beverages 292 334 346 306 256
Furniture & fixtures 276 293 322 323 353
Textile yarns & fabrics 208 253 299 242 219
Petroleum products 171 273 257 129 216
Copper metal 341 297 232 178 236
Bananas 224 237 216 217 241
Toys, games & sporting goods 231 224 203 169 157
Shrimps & prawns 215 150 126 129 126
Footwear 207 171 194 147 86
Sugar 77 139 99 100 70
Pineapples (canned) 81 93 86 79 82
Copper concentrates 134 52 44 25 42
Gold 62 55 49 34 48
Total incl others 17,447 20,543 25,228 29,496 35,032
Source: BSP.
Reference table 26
Imports(US$ m; fob)
1995 1996 1997 1998 1999
Telecommunications equipment & electrical machinery 3,211 4,211 6,437 6,870 6,891
Materials & accessories for the manufacture of electrical equipment 3,772 5,130 5,407 4,634 4,708
Semi-processed manufactured goods 3,572 3,948 3,983 2,807 3,175
Power-generating & specialised machines 2,874 3,647 3,804 2,568 2,396
Consumer goods 2,784 3,331 3,091 2,623 2,642
Crude oil 1,931 2,458 2,458 1,433 1,998
Total incl others 26,391 31,885 36,355 29,524 30,726
Source: BSP.

Philippines 55
© The Economist Intelligence Unit Limited 2000 EIU Country Profile 2000
Reference table 27
Key commodity exports(‘000 tonnes unless otherwise indicated)
1994 1995 1996 1997 1998
Coconut oil 849 1,339 793 1,108 1,178
Desiccated coconut 75 73 70 77 72
Copra meal & cake 574 756 475 n/a 540
Copper concentrates 293 282 159 121 101
Copper metal 137 120 126 98 102
Gold (‘000 oz) 176 169 202 149 114
Bananas 1,155 1,213 1,253 1,154 1,140
Fresh fish 79 70 61 70 89 of which: shrimps & prawns 22 18 13 14 12
Sugar 182 153 318 198 185
Pineapples (canned) 215 192 203 185 169
Lumber (‘000 cu m) 89 41 87 146 44
Source: NSCB.
Reference table 28
Main trading partners(% of total value)
1994 1995 1996 1997 1998
Exports fob to:US 38.1 35.3 33.9 32.4 34.2Japan 15.1 15.7 17.9 16.6 14.3Netherlands 3.8 4.6 5.4 6.6 7.9UK 4.7 5.3 4.6 4.3 6.0Taiwan 3.4 3.3 3.2 4.6 6.0Hong Kong 4.8 4.7 4.2 4.6 4.5Germany 4.9 4.0 4.1 4.2 3.5South Korea 2.2 2.5 1.8 1.9 1.7ASEAN 9.7 12.8 14.4 13.2 12.9 of which: Singapore 5.3 5.7 6.0 6.4 6.2 Thailand 2.7 4.6 3.8 3.4 2.1 Malaysia 1.7 1.8 3.3 2.5 3.9
Imports fob from:US 18.5 18.9 22.0 19.9 21.8Japan 24.3 22.4 19.6 20.6 20.4South Korea 5.2 5.1 5.2 6.1 7.4Taiwan 5.7 5.4 4.9 5.0 4.8Hong Kong 5.2 4.8 4.2 4.3 4.4Germany 3.6 3.5 3.7 3.3 2.9Australia 2.8 2.8 2.5 2.7 2.3Saudi Arabia 4.4 6.2 5.2 2.9 1.9ASEAN 11.6 11.7 12.3 12.9 15.1 of which: Singapore 6.8 5.9 5.4 6.0 5.9 Malaysia 2.0 1.8 2.5 2.6 3.2
Source: NSCB.

56 Philippines
EIU Country Profile 2000 © The Economist Intelligence Unit Limited 2000
Reference table 29
Direction and composition of trade, 1998(US$ m)
Exports fob US Japan Netherlands Singapore Total
Fish 55.8 160.5 0.5 3.7 305.9Fruit & vegetables & preparations 124.4 205.5 16.0 8.0 571.5Sugar & preparations 80.9 1.9 0.2 0.5 114.0Ores, slag & ash 9.8 119.1 0.0 0.5 148.1Mineral fuels 6.0 53.0 1.3 0.2 168.1Coconut oil 266.2 19.4 316.1 4.1 705.6Chemicalsa 52.8 77.3 3.8 16.3 430.0Wood & manufactures 34.7 52.5 2.8 1.3 152.6Textile fibres, yarn, cloth & manufactures 98.0 26.5 1.2 13.5 307.6Copper & manufacturesb 0.8 50.5 0.1 43.7 220.7Machinery 6,612.2 2,950.8 1,852.9 1,622.7 20,817.3Transport equipment 66.7 86.4 1.5 10.7 438.8 of which: road vehicles 50.0 70.0 1.3 1.7 386.3Furniture 218.1 35.5 12.8 2.7 365.1Clothing 1,697.6 95.5 38.8 18.8 2,297.7Scientific instruments, etc 167.5 63.0 6.5 6.8 410.8Total incl others 10,144.6 4,233.9 2,319.2 1,832.3 29,496.4
Imports cif US Japan South Korea Singapore Total
Food, beverages & tobacco 673.2 20.5 16.8 51.5 2,635.5 of which: cereals & preparations 301.0 0.4 1.5 8.7 1,160.8Ores, slag & ash 0.0 5.3 0.3 3.4 330.8Mineral fuels 13.9 20.3 124.8 145.5 2,230.0Chemicalsa 395.8 379.3 232.7 250.2 2,717.3Paper etc & manufactures 90.4 31.2 22.2 8.5 334.8Textile fibres, yarn, cloth & manufactures 98.1 103.3 200.7 11.3 1,354.0Iron & steel & manufacturesb 74.3 215.7 159.1 39.0 1,109.9Other metals & manufacturesb 38.9 74.7 64.9 27.2 473.4Machinery 4,948.7 4,703.7 1,295.6 1,108.2 17,059.2Transport equipment 142.9 408.6 78.4 51.0 1,096.3 of which: road vehicles 59.2 383.1 36.2 9.0 634.6 aircraft 82.4 1.9 0.0 38.6 328.0Scientific instruments etc 162.1 261.8 6.6 48.6 683.8Total incl others 6,886.6 6,370.6 2,293.2 1,824.3 31,529.9
a Including crude fertilisers and manufactures of plastics. b Including scrap.
Source: UN, External Trade Statistics, series D.

Philippines 57
© The Economist Intelligence Unit Limited 2000 EIU Country Profile 2000
Reference table 30
Balance of payments, IMF estimates(US$ m)
1995 1996 1997 1998 1999
Goods: exports fob 17,447 20,543 25,228 29,496 34,207
Goods: imports fob –26,391 –31,885 –36,355 –29,524 -29,245
Trade balance –8,944 –11,342 –11,127 –28 4,962
Services: credit 9,348 12,947 15,137 7,477 4,802
Services: debit –6,926 –9,429 –14,122 –10,107 -7,515
Income: credit 6,067 6,059 7,698 6,440 8,081
Income: debit –2,405 –2,777 –3,017 –2,671 -2,911
Current transfers: credit 1,147 1,185 1,670 758 610
Current transfers: debit –267 –596 –590 –323 -118
Current-account balance –1,980 –3,953 –4,351 1,546 7,911
Direct investment abroad –399 –182 –136 –160 -128
Direct investment in the Philippines 1,478 1,517 1,222 2,287 564
Portfolio investment assets –1,429 191 –9 –603 -275
Portfolio investment liabilities 2,619 5,126 600 –325 5,088
Other investment assets 0 –1,745 425 809 -5,998
Other investment liabilities 3,040 6,370 4,396 –1,525 -441
Financial-account balance 5,309 11,277 6,498 483 -1,190
Net errors & omissions –2,094 –2,986 –5,241 –750 -3,054
Overall balance 1,235 4,338 –3,094 1,279 3,659
Memorandum itemsTotal change in reserves and related items (– indicates inflow) –873 –4,037 2,610 –1,938 -3,947 Use of IMF credit & loans –362 –301 485 659 288
Source: IMF, International Financial Statistics.
Reference table 31
Balance of payments, national estimates(US$ m)
1995 1996 1997 1998 1999
Merchandise exports fob 17,447 20,543 25,228 29,496 35,032
Merchandise imports fob –26,391 31,885 –36,355 –29,524 –30,726
Trade balance –8,944 –11,342 –11,127 –28 4,306
Non-merchandise trade inflows 14,374 19,006 22,835 13,917 12,854 of which: travel 1,124 1,546 2,341 1,418 2,553 personal income 3,869 4,306 5,742 4,926 6,794 net conversions of foreign-currency deposits 4,827 5,863 6,006 3,437 n/a
Non-merchandise trade outflows –9,609 –12,206 –17,139 –12,778 –10,453 of which: interest payments –2,179 –2,206 –2,567 –2,257 –2,465 Inflows of unrequited transfers 1,147 1,185 1,670 758 645 of which: government 449 447 414 408 399
Outflows of unrequited transfers –265 –596 –590 –323 –164
continued

58 Philippines
EIU Country Profile 2000 © The Economist Intelligence Unit Limited 2000
1995 1996 1997 1998 1999
Current-account balance –3,297 –3,953 –4,351 1,546 7,188
Inflows of direct investment 1,459 1,520 1,249 1,752 1,077
Outflows of direct investment –98 –182 –136 –160 –206
Inflows of portfolio investment 1,485 2,101 –406 264 512
Outflows of portfolio investment –1,237 78 55 –184 –165
Inflows of medium- & long-term capital 3,927 6,540 7,724 6,025 9,279 of which: multilateral 687 756 808 801 427 bilateral 1,291 1,494 1,629 1,395 1,700
Outflows of medium- & long-term capital –2,651 –3,699 –2,900 –3,285 4,563
Short-term capital (net) –56 540 495 –1,521 –3610
Change in commercial banks’ net foreign assets 1,564 4,214 1,188 –1,330 –1,836
Trading of bonds in secondary markets – –37 –676 –1,083 102
Capital-account balance 4,393 11,075 6,593 478 590
Monetisation of gold 177 198 105 118 198
Revaluation adjustment –96 –203 –465 –22 82
Overall balancea 631 4,107 –3,363 1,359 3,839
a Including unclassified items.
Source: BSP.
Reference table 32
Foreign equity investment inflows by major country of origin and by sector(US$ m)
1995 1996 1997 1998 1999
By countryNetherlands 29.77 52.89 41.08 85.24 384.58Japan 244.49 471.50 330.96 150.37 303.27US 55.82 292.72 116.75 243.39 84.42Singapore 75.48 19.59 67.39 51.30 36.31Hong Kong 235.65 76.26 59.80 21.27 19.89South Korea 8.16 29.34 18.16 12.31 13.94UK 52.69 62.94 17.56 12.55 8.96British Virgin Islands 9.76 105.77 176.47 53.84 2.45
By sectorAgriculture, fishery & forestry 0.16 1.45 0.14 0.30 0.82Mining 41.90 3.21 2.84 161.26 27.34 of which: geothermal n/a 0.50 0.00 141.76 18.06 petroleum & gas 23.06 0.95 0.00 18.58 8.94Manufacturing 337.88 477.69 172.19 245.48 1,049.16 of which: machinery, appliances & supplies 132.91 157.47 68.89 53.46 81.72 petroleum & coal 43.69 0.22 0.08 13.30 0.06 chemicals & products 36.16 52.64 25.40 43.15 15.55 transport equipment 53.03 35.70 23.31 6.53 21.44 food 10.52 19.40 13.99 31.29 852.32
continued
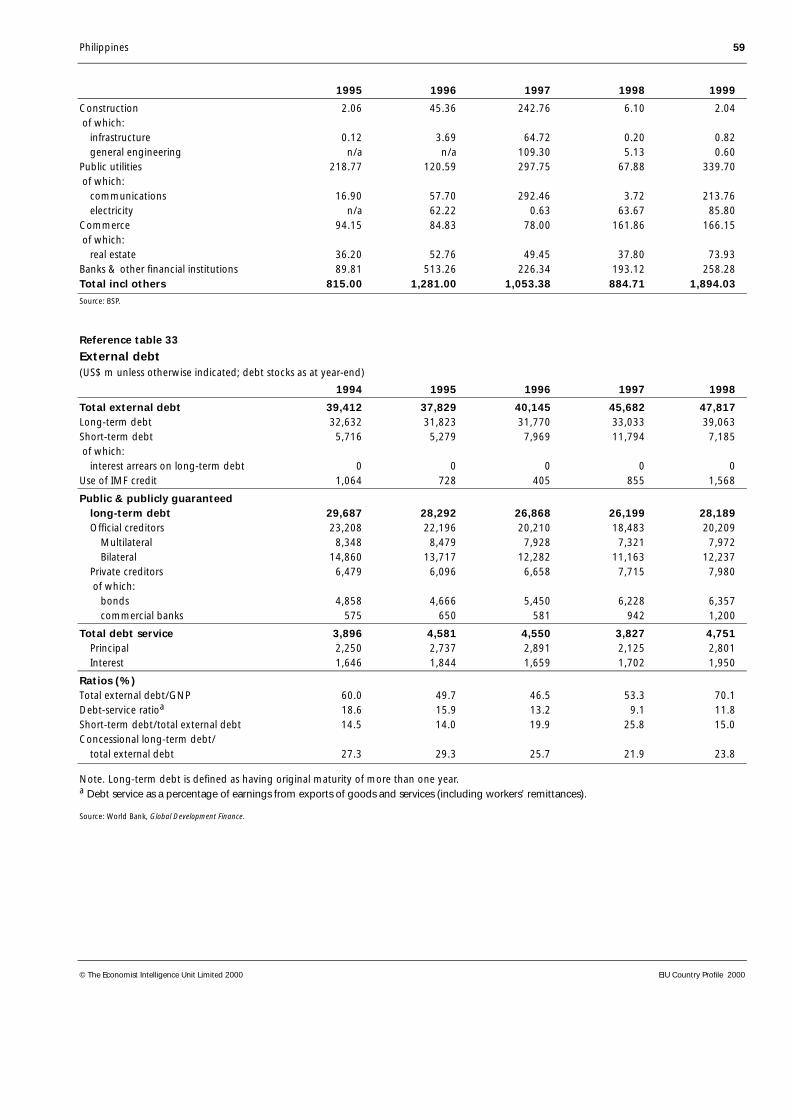
Philippines 59
© The Economist Intelligence Unit Limited 2000 EIU Country Profile 2000
1995 1996 1997 1998 1999
Construction 2.06 45.36 242.76 6.10 2.04 of which: infrastructure 0.12 3.69 64.72 0.20 0.82 general engineering n/a n/a 109.30 5.13 0.60Public utilities 218.77 120.59 297.75 67.88 339.70 of which: communications 16.90 57.70 292.46 3.72 213.76 electricity n/a 62.22 0.63 63.67 85.80Commerce 94.15 84.83 78.00 161.86 166.15 of which: real estate 36.20 52.76 49.45 37.80 73.93Banks & other financial institutions 89.81 513.26 226.34 193.12 258.28Total incl others 815.00 1,281.00 1,053.38 884.71 1,894.03
Source: BSP.
Reference table 33
External debt(US$ m unless otherwise indicated; debt stocks as at year-end)
1994 1995 1996 1997 1998
Total external debt 39,412 37,829 40,145 45,682 47,817Long-term debt 32,632 31,823 31,770 33,033 39,063Short-term debt 5,716 5,279 7,969 11,794 7,185 of which: interest arrears on long-term debt 0 0 0 0 0Use of IMF credit 1,064 728 405 855 1,568
Public & publicly guaranteed long-term debt 29,687 28,292 26,868 26,199 28,189 Official creditors 23,208 22,196 20,210 18,483 20,209 Multilateral 8,348 8,479 7,928 7,321 7,972 Bilateral 14,860 13,717 12,282 11,163 12,237 Private creditors 6,479 6,096 6,658 7,715 7,980 of which: bonds 4,858 4,666 5,450 6,228 6,357 commercial banks 575 650 581 942 1,200
Total debt service 3,896 4,581 4,550 3,827 4,751 Principal 2,250 2,737 2,891 2,125 2,801 Interest 1,646 1,844 1,659 1,702 1,950
Ratios (%)Total external debt/GNP 60.0 49.7 46.5 53.3 70.1Debt-service ratioa 18.6 15.9 13.2 9.1 11.8Short-term debt/total external debt 14.5 14.0 19.9 25.8 15.0Concessional long-term debt/ total external debt 27.3 29.3 25.7 21.9 23.8
Note. Long-term debt is defined as having original maturity of more than one year.a Debt service as a percentage of earnings from exports of goods and services (including workers’ remittances).
Source: World Bank, Global Development Finance.

60 Philippines
EIU Country Profile 2000 © The Economist Intelligence Unit Limited 2000
Reference table 34
Net official development assistancea
(US$ m unless otherwise indicated)
1994 1995 1996 1997 1998
Bilateral 942.6 748.8 748.2 567.3 528.0 of which: Japan 591.6 416.1 414.5 319.0 297.6 Germany 56.4 67.6 106.6 56.6 45.4 Australia 33.8 56.0 55.9 42.9 45.0 Spain 16.8 11.8 4.4 22.7 15.4 Netherlands 17.9 18.9 22.8 22.4 19.8 Canada 24.1 19.5 16.4 16.5 14.5 US 116.0 112.0 46.0 15.0 27.3 France 15.4 35.8 27.4 12.2 24.4 Italy 4.5 3.0 8.7 2.1 2.1
Multilateral 110.8 132.6 131.7 115.0 79.6 of which: ADB 55.0 54.8 47.2 49.0 21.3
Total 1,057.2 882.96.5 879.2 681.4 606.6
a Disbursements by OECD and OPEC members and multilateral agencies. Official developmentassistance is defined as grants and loans, with at least a 25% grant element, administered with theaim of promoting economic or social development.
Source: OECD, Development Assistance Committee, Geographical Distribution of Financial Flows to Aid Recipients.
Reference table 35
Foreign reserves(US$ m unless otherwise indicated; year-end)
1995 1996 1997 1998 1999
Foreign exchange 6,235 9,902 7,147 9,101 13,103
SDRs 8 2 2 2 7
Reserve position in the IMF 129 125 118 123 120
Total reserves excl gold 6,372 10,030 7,266 9,226 13,230
Golda 1,035 1,312 1,147 1,190 1,833
Total reserves incl gold 7,407 11,342 8,413 10,416 15,063
Memorandum itemGold (m fine troy oz) 3.580 4.651 4.988 5,432 6,199
a Year-end holdings valued at 75% of fourth-quarter London cash price.
Source: IMF, International Financial Statistics.
Reference table 36
Exchange rates(period averages)
1995 1996 1997 1998 1999
P:US$ 25.714 26.216 29.471 40.893 39.089
P:¥100 28.401 24.100 24.340 34.596 34.316
Source: IMF, International Financial Statistics.
Editor: Sophie LewisohnAll queries: Tel:(44.20) 7830 1007 Fax: (44.20) 7830 1023