phase i final report for doe award: de-fc36-03ch11161
TRANSCRIPT
Phase I Final Report for DE-FC36-03CH11161
1
Phase I Final Report For
DOE Award: DE-FC36-03CH11161
Advanced Communication and Control of Distributed Energy Resources at Detroit Edison
Recipient: Detroit Edison 2000 2nd Avenue Detroit, MI 48226
Principal Investigator:
Haukur (Hawk) Asgeirsson, Detroit Edison 313-235-9371 [email protected] Project Team: Dr. Robert Broadwater, Electric Distribution Design, Inc. 540-951-2753 [email protected] Murray Davis, DTE Energy Technologies 248-427-2221 [email protected] Herbert Falk, Systems Integration Specialists Company, Inc. 586-254-0020 [email protected] John J O’Donnell, DTE Energy 313-235-9276 [email protected] Richard Seguin, Detroit Edison 313-235-9598 [email protected]
Subcontractors: DTE Energy Technologies 37849 Interchange Dr Farmington Hills, MI 48335 Electric Distribution Design, Inc. 311 Cherokee Dr Blacksburg, VA 24060 Systems Integration Specialists Company, Inc. 6605 19 ½ Mile Road Sterling Heights, MI 48314
June 2003 – January 2004

Phase I Final Report for DE-FC36-03CH11161
2
Executive Summary The project objective was to create the communication and control system, the process and the economic procedures that will allow owners (e.g., residential, commercial, industrial, manufacturing, etc.) of Distributed Energy Resources (DER) connected in parallel to the electric distribution to have their resources operated in a manner that protects the electric utility distribution network and personnel that may be working on the network. The Distribution Engineering Workstation (a power flow and short circuit modeling tool) was modified to calculate the real-time characteristics of the distribution network based on the real-time electric distribution network information and provide DER operating suggestions to the DECo system operators so that regional electric stability is maintained. Part of the suggestion algorithm takes into account the operational availability of DER’s, which is known by the Energy Aggregator, DTE Energy Technologies. The availability information will be exchanged from DTE Energy Technologies to DECo. For the calculated suggestions to be used by the DECo operators, procedures were developed to allow an operator to operate a DER by requesting operation of the DER through DTE Energy Technologies (see Appendix A). Prior to issuing control of a DER, the safety of the distribution network and personnel needs to be taken into account. This information will be exchanged from DECo to DTE Energy Technologies. Once it is safe to control the DER, DTE Energy Technologies will issue the control signal. The real-time monitoring of the DECo system will reflect the DER control. Multi-vendor DER technologies’ representing approximately 4 MW of capacity was monitored and controlled using a web-based communication path. The DER technologies included are a photovoltaic system, energy storage, fuel cells and natural gas/diesel internal combustion engine generators. This report documents Phase I result for the Detroit Edison (DECo) (Utility) led team, which also includes: DTE Energy Technology (DER provider & Aggregator), Electrical Distribution Design (Virginia Tech company supporting EPRI’s DEW); Systems Integration Specialists Company (real-time protocol integrator); and OSIsoft (software system for managing real-time information). This work was performed in anticipation of being selected for Phase II of the Advanced Communication and Control of Distributed Energy Resources project.

Phase I Final Report for DE-FC36-03CH11161
3
Table of Contents
Executive Summary ___________________________________________________________ 2
SUMMARY of ACCOMPLISHMENTS ___________________________________________ 4 Phase I Accomplishments __________________________________________________________ 4 Progress Demonstrated ____________________________________________________________ 4 Extension ________________________________________________________________________ 5
TECHNICAL DISCUSSION ___________________________________________________ 6
INTRODUCTION ____________________________________________________________ 6 Project Objective:_________________________________________________________________ 6 Background and Vision ____________________________________________________________ 6
Phase I Work Completed _______________________________________________________ 9 DER Site Preparation_____________________________________________________________ 10 PI to PI Installation ______________________________________________________________ 10 ICCP Installation ________________________________________________________________ 10 DEW Modifications and Control Algorithm __________________________________________ 11 DEW Testing____________________________________________________________________ 14 DER Monitoring and Control Models _______________________________________________ 15 Control Strategy & Testing ________________________________________________________ 17 Operating Procedures ____________________________________________________________ 19
OBSERVATIONS & LEASONS LEARNED ______________________________________ 20 Information Technology Issues _____________________________________________________ 20 Security ________________________________________________________________________ 20 System Latencies_________________________________________________________________ 21 Data Validity ____________________________________________________________________ 21 Lessons Learned _________________________________________________________________ 22
Appendix A - Tagging and Operating Procedures __________________________________ 24
Appendix B - Circuit & DER 1-Line Diagrams & Pictures ___________________________ 74
Appendix C – DER Process Book Displays________________________________________ 83
Appendix D - DEW Examples Outputs of DER Control Algorithm ____________________ 91

Phase I Final Report for DE-FC36-03CH11161
4
SUMMARY of ACCOMPLISHMENTS Phase I Accomplishments Installed and tested a PI to PI Link between DECo (DECo) Systems Operation Center (SOC) and DECo Regional Operations Center (DECo ROC) making SCADA data available for both monitoring and control. Installed and tested an ICCP link between DECo, the utility, and DTE Energy Technologies (D|Tech), the aggregator, making DER data available to the utility for both monitoring and control. Installed and tested PI process book with circuit & DER operational models for DECo ROC operator’s use for monitoring of both utility circuit as well as customer DER parameters. The PI Process Book models also included DER control for the DECo ROC operators, which was tested and demonstrated control, within less than a 10 minute window, for each of the DERs chosen for Phase I. Tagging and operating procedures were developed and refined during the control demonstration, which allowed that control to be done in a safe manor. These tagging and operating procedures were enforced through software and electronic exchanges via ICCP. The Distribution Engineering Workstation (DEW) was modified for real-time calculations, allowing both planning and real-time modeling of both the utility circuit as well as the DER within that circuit. Developed and tested, within DEW, a DER analysis program that will make DER operational suggestions both in a planning and real-time modes. Progress Demonstrated This project extended the remote control and monitoring of distributed generation beyond what had been previously seen. Some of the key new items demonstrated with actual systems and field equipment are listed below: • ICCP Link Reduces Complexity – The ICCP link allowed DECo to integrate distributed
generation without having to manage the extreme complexities and diversity of control and monitoring technology. This simplified the integration of distributed generation and allowed many more types of devices to be installed.
• Operating Procedures – The developed procedures were the most extensive procedures for the coordinated operation by a utility and a distributed generation system provider.
• Control Strategy – A new control strategy was developed for this project to meet the unique needs of operating with multiple parties.
• New Equipment Integration – This project allowed several new types of equipment to be integrated with the systems. The solar cell and battery system were the primary examples of this.

Phase I Final Report for DE-FC36-03CH11161
5
Extension While tremendous progress was made in the control and monitoring of distributed generation, the project schedule and resources limited the work that was planned. Next steps for extending the work are listed below: • Allow Analog Control through the ICCP Link - During the course of this project, start and
stop control using the ICCP link was demonstrated but the control of a unit’s output (kW) was left to the local controls.
• Electronic Tagging System – Field and server sided procedures are currently used for safety concerns. The integration of an electronic tagging system would enhance the ease of use of the system.
• Integrated Utility Interfaces – At the DECo ROC, there are presently numerous systems with which operators have to interact. Integration could make the system easier to use. Also, control requires user interaction. A more integrated system would allow the system to operate without operator involvement. DEW suggestion could be used as the control input and the only operator involvement would be if this did not work correctly or the system were put in an abnormal condition e.g. shutdown or outage.
.

Phase I Final Report for DE-FC36-03CH11161
6
TECHNICAL DISCUSSION The technical discussion will be organized into three major headings INTRODUCTION, PHASE I WORK COMPLETED, and OBSERVATIONS & LESSONS LEARNED. The first section is INTRODUCTION, which will include the sections: Project Objective and Background and Vision information. The next section will be PHASE I WORK COMPLETED which will include the following subsections DR Site Preparation; PI to PI Installation; ICCP Installation; DEW Modifications; DER Process Book Models for Aggregation, Monitoring, and control; Control Strategy & Testing; and Operating Procedures. The final section is OSERVATIONS & LESSONS LEARNED, in completing the Phase I work. INTRODUCTION Project Objective: The project objective was to create the communication and control system, the process and the economic procedures that will allow owners (e.g., residential, commercial, industrial, manufacturing, etc.) of Distributed Energy Resources (DER) connected in parallel to the electric distribution to have their resources operated in a manner that protects the electric utility distribution network and personnel that may be working on the network. The Distribution Engineering Workstation (a power flow and short circuit modeling tool) was modified to calculate the real-time characteristics of the distribution network based on the real-time electric distribution network information and provide DER operating suggestions to the DECo system operators so that regional electric stability is maintained. Part of the suggestion algorithm takes into account the operational availability of DER’s, which is known by the Energy Aggregator, DTE Energy Technologies. The availability information will be exchanged from DTE Energy Technologies to DECo. For the calculated suggestions to be used by the DECo operators, procedures were developed to allow an operator to operate a DER by requesting operation of the DER through DTE Energy Technologies (see Appendix A). Prior to issuing control of a DER, the safety of the distribution network and personnel needs to be taken into account. This information will be exchanged from DECo to DTE Energy Technologies. Once it is safe to control the DER, DTE Energy Technologies will issue the control signal. The real-time monitoring of the DECo system will reflect the DER control. Multi-vendor DER technologies’ representing approximately 4 MW of capacity was monitored and controlled using a web-based communication path. The DER technologies included are a photovoltaic system, energy storage, fuel cells and natural gas/diesel internal combustion engine generators. Background and Vision Today’s electric distribution system is primarily a radial system that was designed to have energy flow from the source to the load (the end-user). The distribution system was not designed to accept multiple DER’s feeding energy on to the electric system. A certain amount of electrical energy can normally be accepted by the distribution system with the amount dependant on
Phase I Final Report for DE-FC36-03CH11161
7
electric system protection, configuration of the electric circuit and circuit loading. For DER’s to be readily acceptable by an electric utility industry, the electric system needs to be modeled to determine how much electrical energy the distribution circuit can accept and what type of system protection is needed. The electric system and DER status is also required for DER’s to be safely operated on the electric utility system. The aggregation of many DER’s can provide a reliable means of managing electric utilities system peaks, meeting our economic challenges for infrastructure, satisfying environmental pressures, and serving our future energy needs. To manage multiple DER units from multiple vendors, the communication and control architectures need to encompass combination of software and hardware components, including: sensors, data acquisition and communication systems, remote monitoring systems, metering (interval revenue, real-time), local and wide area networks, Web-based systems, smart controls, energy management/information systems with control and automation of building energy loads, and demand-response management with integration of real-time market pricing. The most likely operating scenario is for the DERs to be owned, operated, and economically dispatched by different entities. In this deployment, one of the entities has knowledge of the operating conditions of the local electric utility distribution network while the other entity has knowledge about the status of the DER owned by a third entity. This scenario has the most complicated requirements for aggregation and information exchange. Addressing such a scenario will produce technologies, processes, procedures that would be easily applicable to the other deployment scenarios. If these distributed generation systems were not aggregated and integrated, their individually small power capacities would have limited applications to impact on the overall electricity supply and consumption, resulting in a small market size not viable for mass commercialization. When multiple DER units are aggregated to achieve seamless, integrated operation, the aggregated power will achieve levels that provide support to the grid. This can include a range of markets and applications such as the sale of electricity to wholesale markets, peak shaving, and demand-side management for large customers (including data centers, power parks, manufacturing plants, commercial and institutional buildings, etc.). Additionally, the ability to scale up DER aggregation to respond to changing load demands offers flexibility not readily achievable by central power generation plants. Thus, through aggregation, a viable marketplace will evolve from many DER applications for both off and on grid operations. Growth of the DER marketplace will not only broaden customer choice for electricity services, but will also enable customer participation in energy transactions to meet individual expectations. It should be noted that a listing of known customer generation, above 100kW, was completed as part of DECo’s peak load preparedness. The aggregate knows customer generation totaled 1400MW or 13% of our current annual peak. If harnessed this could be of great value to the utility. One of the important aspects of the project was to develop a methodology for information integration that was scalable and based upon standards. The project dealt with two sources of information: an internal DECo Energy Management System (EMS) and an external Distributed Energy Resource (DER) operator’s control center. It is the combination of this information that was used for the EDD DEW dispatch calculation.
The Phase I aggregation server, and DEW calculation engine, was located at the DECo’s Northern Regional Operation Center (N ROC) which is located at 15600 19 Mile Road, Clinton Township, Michigan.

Phase I Final Report for DE-FC36-03CH11161
8
The EMS information provides the project with the DTE power distribution network Supervisory Control and Data Acquisition (SCADA) information reflecting the current state of the distribution network. The EMS is located at 2000 2nd Avenue, Detroit, Michigan. The EMS is located twenty-six (26) miles from the North ROC. Communication between the North ROC and the EMS location is over a DTE Intranet. The EMS system has an established PI server that houses the SCADA circuit data. It should be noted that the ROCs do not have direct access to PI. The DER operator information provides the monitoring and control capability of the actual DER. The operator, for the Phase I was DECo Technologies (henceforth referred to as D|Tech) and is located at 37849 Interchange Drive, Farmington Hills, Michigan. D|Tech is located thirty-five (35) miles from the N ROC. Communication between the N ROC and D|Tech is via the public Internet. The use of the Internet raised security concerns. These concerns will be addressed in another section of this report.
The Universal Protocol Converter and Site Controller (UPC/SC) at DTE Energy Technologies (D|Tech) were developed before the start of this project and is a key element of the project architecture. This device communicates with and controls electrical generation equipment from numerous manufacturers and technologies. This device has been commercially used with fuel cells, solar panels, battery systems, internal combustions engines, external combustion engines, microturbines and other technologies. A similarly large number of manufacturers can be listed. The UPC/SC is installed on-site and provides a common interface for DTE Energy Technologies energy|now System Operations CenterTM (D|Tech SOC) to interact with field equipment. The data from the field and commands to the equipment are coordinated by server side gateways and stored in databases for use by trained operations personnel and server side applications. All of this traffic is protected by strong encryption and authentication using secured socket layers (SSL).

Phase I Final Report for DE-FC36-03CH11161
9
Final Architecture
The following will be a discussion of Phase I work indicated in the final Architecture: o DER site modifications o PI to PI installation o ICCP Gateway installation o DEW Real-Time and DR application updates o PI Process Book DER models for monitoring and control Phase I Work Completed The first task of this project was to select and complete all seven DER installation and site proposals, the control proposal and the Distribution Engineering Workstation (DEW) real-time operating program proposal. The DER units selected for this project represents a broad range of
DECo Distribution System
DER DE
DEC
RTU
Modbus Lonworks or Other Protocols
Internet Connectio
D|Tech SOC
Gateways and
Application Server
ICCP Gateway
D|Tech UPC/SC
DER Data to DECo Control from DECo
Operating Agent
DECo ROC DECRT
Distribution Operating Authority
Internet
Internet
SSL
VPN
DEW Applications - Real-Time Power flow - DR Control
PI for DoE
DECo SOC DECRT
PI Ckt Data Transmission
Operating Authority ICCP
Gateway
PI Process Book- DER Monitoring- DER Control - DEW’s DER operating suggestion
@ DECo ROC
Circuit
Identifies Phase I work Identifies D|Tech Identifies DECo
DECo intranet

Phase I Final Report for DE-FC36-03CH11161
10
technologies such as natural gas and diesel driven engine generators, photovoltaic system and an energy storage system. Table 1 lists the DER types and sites selected for Phase I project. DER Site Preparation Site controllers were updated or installed then tested on all DER sites. The Photovoltaic has a site controller that performs only monitoring because the site is not controllable. Field personnel can only do On/Off control. The Solar will be modified as part of its inclusion as part of the Hydrogen power park and also included in Phase II. All energy produced by the PV site is absorbed by the distribution system. The energy storage site (ZBB Energy Corporation zinc/bromine flow battery) is also set up for monitoring with control being initiated from ZBB Energy Corporation via phone connection. All other site controllers perform monitoring and control. It should be noted that control will be added during Phase II.
Table 1. DER Types and Site Locations
PI to PI Installation The communication between the ROC and EMS center is performed via a PI-to-PI link. The use of PI-to-PI was chosen since it allowed easy integration between internal DTE systems. The use of this link allowed Phase I to demonstrate that internal system information could be integrated with external information. It is worthy to note, that this is the trend of the utility industry. Internal systems are integrated with the “best” or “easiest” mechanism available. However, the same mechanism is typically not available for two different utilities. Thus the use of standards based protocols to exchange external information is a likely objective in the DER industry. ICCP Installation The communication paths, database development and hardware procurement followed with the OSI Soft PI Data Historian installed at DECo North Regional Operation Center (NROC). The communication path between NROC, DTE Energy technologies and the DER is all web-based.
DER Type Location Size in kW DER Site Work Protocol/Communication Media
Nat Gas Recip Adair Substation 1000 Field Software Upgraded Modbus/Broadband Satellite
Nat Gas ICRedford - Glendale Circuit 150 New Field Equipment
Modbus/Broadband Cable
Nat Gas ICWestern Wayne SC Zachery 450
Pre-Project Status Acceptable for Project Requirements
Modbus/Broadband Satellite
Nat Gas ICD|tech Farmington Sunset Circuit 75
Pre-Project Status Acceptable for Project Requirements
Modbus/Ethernet
Photovoltaic Southfield Substation 26Completely New Engineered Installation
Modbus/Phone Line
Energy Storage Lum - STDF4 Circuit 200Completely New Engineered Installation
Modbus/Phone Line
Diesel RecipUnion Lake Substation 2000
Completely New Engineered Installation LonWorks/Phone Line
Total 3901

Phase I Final Report for DE-FC36-03CH11161
11
DTE Energy Technology uses an OpenSSL version 0.9.6h. The Inter Control Center Protocol (ICCP – IEC 61870-6 TASE.2) was installed and tested at NROC and DTE Energy Technology (Energy Aggregator). The ICCP link makes the data easily available in a standard protocol to DECo. Considering the fact that this data is available through the web, protecting this link was a critical security concern. Virtual Private Networking (VPN) was chosen to provide the needed encryption and authentication provide secure communication between the two control centers. A new ICCP standard with a security layer is in the process of being established and will be tested as part of Phase II work. The installation of the ICCP was one of the most time consuming parts of the project because the technology had not previously been installed at the DECo ROC. Security concerns complicated the work. DTE Energy Technologies had previously installed and tested the gateway that provided the function, but it had not been used with a customer. In first eight weeks of the project the gateway at D|Tech was re-tested with a bench test system, and D|Tech’s firewall configuration was appropriately modified to allow traffic between DECo and D|Tech. A point naming convention was also developed and accepted by both parties. The Phase I project at DTE chose the use of IEC 60870-6 TASE.2 (e.g. ICCP – Inter Control Center Protocol) for the link between the ROC and D|Tech since it is widely accepted in the utility industry and was created with the specific intent of allowing utility control centers to exchange control and tagging information as well as SCADA. It is worthy to note that neither the ROC nor D|Tech had TASE.2 operational prior to this project. The project deployment and operation within six (6) months proved that the selection of TASE.2 was the appropriate selection and offers a standard that is scaleable and well supported within the industry. The ease of TASE.2 deployment yields a conclusion that TASE.2 may be a valid candidate for scaling the number of DER operators within Phase II. It represents a neutral protocol, easy to deploy, and is used widely in the industry. A side benefit is that there has been a large amount of activity, internationally, to secure TASE.2. During the timeframe of the Phase I deployment, the secure TASE.2 technology was demonstrated and has been adopted for deployment by the NERC Data Exchange Working Group (DEWG) for deployment in 2005. Unfortunately, the Phase I deployment schedule and finances did not allow for this “secure” TASE.2 to be deployed. It would be the intent to do so within Phase II. The use of the specified security would allow secure transactions to an expanded number of DER operators. DEW Modifications and Control Algorithm The Distribution Engineering Workstation, DEW, is used to implement the control algorithm calculations. A new application, DG Control, has been added to DEW to implement the control algorithm. Applications written to run under DEW can be written for two modes, an Interactive Design mode and a Real Time mode. Most existing applications that run under DEW are written just for the Interactive Design mode. The DG Control application is written to run in either mode.

Phase I Final Report for DE-FC36-03CH11161
12
In the Interactive Design mode a planning engineer can use the DG Control application to study using DG generation to control either low voltage problems or equipment overloads. The planning evaluations can be performed for any hour of the day and for any type of day and month modeled in DEW. DECo models 12 months, January – December, and all the days of the week. In the Real Time mode, the DG Control application runs 24 X 7, taking in measurements from a real time database and providing recommended control actions back to the real time database. The recommended control actions calculated by the DG Control application are based upon correcting low voltage and/or equipment overload problems local to the circuit. The recommended actions consist of kW and kVar set points to be communicated to controllers that are local to the DGs in the field. The kW and kVar setpoints represent minimum generation values needed to solve the problem. The DG Control application represents the lowest level, Level 1, of a two-level, hierarchical control design for DG control. This is illustrated in Figure 1. Level 1 checks to see if a DG is needed to control local circuit problems and also that turning on a DG will not create local circuit problems. If DG is not needed for Level 1 control, and it will not cause circuit problems if turned on, then it is released for use by the Level 2 control.
Figure 1 DG Hierarchical Control System The Level 2 control illustrated in Figure 1 aggregates DGs into a block of generation. Level 2 control aggregates DG generation so that it can be treated as a block of generation by transmission system control. The Level 2 controller provides to the transmission system control the amount of generation that is available. When a transmission system controller provides a desired generation level to the Level 2 DG control, the Level 2 DG control calculates the most economic way to provide that generation with the DG generation units that is has at its disposal. The Level 2 DG controller takes into account that each individual generator in the aggregate has a minimum and maximum level of generation, where the maximum level of generation available may vary based upon generation owner commitments.
Level 2: Economic Dispatch of Aggregated Units
Level 1: Local Control
Units available for dispatch

Phase I Final Report for DE-FC36-03CH11161
13
Figure 2 illustrates the Level 1 local control algorithm. As shown in the figure, measurements are provided to DEW via a real time database. The real time measurements consist of two types, circuit measurements provided by the utility regional operating center (ROC) and DG generation measurements provided by the DG aggregator operating center (D|Tech SOC). Generally the circuit measurements consist of start of circuit voltage and current measurements. The DG measurements are total kW and kVar generation for each DG unit.
Shown in Figure 2 are historical measurement inputs, representing load history for the previous year. These measurements represent individual customer load measurements and consist of two types, kWHr load measurements and (kW, kVar) load measurements. The kVar portion of the (kW, kVar) load measurement may be missing. The (kW, kVar) load measurements are available for every hour of the year. Thus, for a non-leap year, there are 8760 measurements for a given customer. For the kWHr measurement, there are 12 measurements available for each customer. The historical measurements are stored in tables in the DEW database. If kWHr load measurements are not available for a distribution transformer, than the kVA size of the transformer is used to estimate the transformer load. For a given month, day, and hour of day, the kWHr measurements are combined with load research statistics to predict loading levels. There are four types of load research statistics used in the calculation, which are parsing factors, C factors, diversity factors, and diversified load curves [1]. With sufficient raw load reach data, these statistics may be calculated as a function of weather conditions. As indicated in Figure 2, loads in the circuit model are scaled to cause the power flow calculations to match closely to the real time circuit measurements. The circuit model with the scaled loads is then passed to the DG Control application.
kW, kVar Set Points To Real Time Database
Generation Constraints
DEW Load Scaling to Match Real Time
Circuit Measurements
Real Time Measurements
Historical Measurements
DG Control
Power Flow
Figure 2 Level 1, Local Control of DGs Using DEW and the DG Control

Phase I Final Report for DE-FC36-03CH11161
14
The first action of the DG Control application is to search the circuit model to estimate low voltage or equipment overload problems. If problems are encountered, DG Control makes use of the DEW Power Flow calculation to determine generation levels that will eliminate the problems or help to mediate the problems. In setting DG generation levels, the DG Control application takes into account the availability of DG units, minimum and maximum generation constraints for each individual DG, and also power factor generation constraints. There are three things that can occur when DGs are used to control circuit problems. They are:
A. The DG generation can be used to eliminate the problems B. The DG generation can be used to mediate the problems but not totally eliminate the
problems C. The DG generation has no effect on the circuit problems.
For Items B and C above, operations and planning both should be alerted to the situation. It may be possible to change the location or size of the DG such that the problems can be eliminated. Since DG control is a non-linear problem involving large circuit models (since every distribution transformer and its associated historical measurements are modeled), an analytical solution is not possible. The DG Control application makes use of a bi-section search to determine the levels of generation needed to eliminate problems. The search is set so that it is guaranteed to converge in at most eight iterations of running the power flow calculation. Representative convergence times for the control algorithm are 1 to 2 seconds for a single circuit containing DGs under control. For solutions of very large systems consisting of hundreds or even thousands of circuits, distributed computation may be used to achieve real time solutions [2]. Since DG generation is often more expensive than generation available at the start of a circuit, the DG Control application calculates sufficient generation from each DG to eliminate problems and no more. To summarize the overall control, historical load data coupled with load research statistics are used to estimate circuit loads for a given month, day, and hour of day. These loads are then scaled such that power flow calculations closely match real-time circuit measurements. This resulting “load scaled circuit model” is used to estimate problems, either low voltage or equipment overloads, within the circuit. If problems are found, the DG Control application, taking into account generation constraints, uses the DEW Power Flow running on the “load scaled circuit model” to calculate generation levels to eliminate the circuit problems. It should be noted that the placement of DGs within a circuit is very important as regards DG ability to perform control and eliminate problems throughout the circuit. For instance, often a DG placed close to the start of a circuit is not near as effective in voltage and overload control as a DG placed further out on the circuit. DEW Testing The project needed to integrate DEW into the operating system at NROC and to test/modify the DEW algorithm. Because the DEW developers are located in Blacksburg, Virginia, there was an

Phase I Final Report for DE-FC36-03CH11161
15
issue for the Electric Distribution Design DEW developers to obtain real-time data from the NROC PI system for testing of the DEW algorithm. This was due to security issues at DECo that does not allow a firewall hole to be punched to allow an outside link. An intermediate solution was to install a PI server at SISCO, Inc. office and to have the NROC PI push a duplicate data to SISCO PI where the DEW program is able to read the tag data for testing. DEW will be relocated to NROC late November for installation on the NROC server. Because the time frame of this project testing was after DECo’s summer peak DEW made no actual recommendation to run DER to resolve overload or low voltage conditions. Circuit conditions were artificially created (See Appendix D for examples of DEW’s DER operational recommendation). The aggregation algorithm to manage all DER units as a block of load will be developed. Economic scheduling is part of Phase II. DER Monitoring and Control Models Monitoring and Control screens for all of the DER units were created that show status and load. The first sample screen show is a aggregate screen for all of the DER units in Phase I. The project needed to integrate DEW into the operating system at NROC and to test/modify the DEW algorithm. Operational screen were updated to include the suggested DER control and output scheme recommended by DEW.

Phase I Final Report for DE-FC36-03CH11161
16
Shown is the status and power level in kW of each DER. ICCP Communication status and DEW real-time DER operator suggestions are also shown. In addition DER contact information as well as tagging and operating proceedures have been embedded in the process book display. A sample screen of the Adair 1 MW natural gas generator connected to the distribution circuit is shown in Figure 1 below. The screen indicates the status of the communication paths, the generator output power quantities (current, real and reactive power, volt-ampere, power factor and voltage), circuit load (current and voltage), and control information. The screen is used for issuing control of the DERs. This screen also allows the operator to trend any of the power quantities that are displayed. All DER Process Book Displays can be found in Appendix C.
Figure 1. Monitoring and Control Screen
Within the DECo Operating Center, this screen is presently not integrated into the operator’s operating council but is a stand-alone screen. As part of the initial development of the system and due to security and time constrains, this development needs to be set apart from the day-to-day operation of the electric distribution system. There is a desire to have this screen integrated into the normal operating process and will be part of Phase II proposal.

Phase I Final Report for DE-FC36-03CH11161
17
Control Strategy & Testing The following control strategy was developed for the project:
o Control Flow − Dispatch from DECo via ICCP Linked Point(s) in D|Tech’s Database − D|Tech’s Database Server runs a Stored Procedure which Recognizes
Control Point Changes − The Stored Procedure Generates a Single Point Control XML File that is
pushed to the XML Gateway Queue − The UPC/SC Acquires the Single Point Control File off the Queue and
Starts/Stops the Unit o A Few Key Points
− More than One Point May Have to be Set by the DECo Operator to Start/Stop
− Default Values for Output Levels (kW) will have to be set in the DG Equipment for Start Commands
A control strategy was critical to ensure that DECo and D|Tech operators understood the status and control rights of the parties. In all control sites, DECo has the responsibilities of the Operating Authority, and D|Tech was designated as the Operating Agent. This allowed start and stop commands to be sent from DECo’s operators through the network to the UPC/SC for the control of the generation. In cases, such as the loss of the ICCP link, DECo can contact D|Tech operators to perform the needed control functions. The DECo, Operating Authority, Regional System Supervisor (RSS) will call D|Tech SOC and request permission to operate distributed resources at a specific site. The RSS will also give the approximate time duration of the request. D|Tech SOC personnel will set a digital point (ICCP Remote Control Cut-Off) to a value of “1” to allow remote control. D|Tech SOC then informs the RSS that this has been completed and he/she can now operate the generators at the site via the Process Book Display previously discussed. Starting and stopping each DER completed functional testing of our Phase I Architecture. The DECo ROC operators, while following our procedures, started and stopped each of the DERs from the Process Book Displays. Farmington is a sell-back generator that is owned and operated by D|Tech. An example of this function testing is DECo following our established procedures requested permission to operate the Farmington, which was currently running. The figure below shows the Farmington Process Book display.

Phase I Final Report for DE-FC36-03CH11161
18
D|tech took its unit out of schedule mode and electronically granted permission to control to DECo operators. This can be seen in the Control Information area, which now have activated control ON and OFF Buttons.

Phase I Final Report for DE-FC36-03CH11161
19
After 8minutes and 11 seconds the data updates were complete showing all zeros. The DECo then turn back ON the generator putting it back to its original state. Both of these operation can be seen in the process Book Graph Display below.
Operating Procedures After the stated duration, the RSS will inform D|Tech SOC that they no longer require control capability at the site. D|Tech SOC personnel will set the “ICCP Remote Control Cut-Off” point to a value of “0” which disables remote control capabilities at the site. Throughout the course of the project, operating procedures were developed and periodically update to include lessons learned during actual operation. The procedures designated DECo as the Operating Authority and D|Tech as the Operating Agent. The procedures addressed critical points such as loss of communication and control roles and responsibilities. See Appendix A for the tagging and operating procedures developed for Phase I.
OFF sent 12:34:02
OFF seen 12:42:11 ON sent 12:45:22)
ON seen 12:52:26
8:11
7:04

Phase I Final Report for DE-FC36-03CH11161
20
OBSERVATIONS & LEASONS LEARNED Information Technology Issues There were several security and Information Technology (IT) issues encountered during the deployment of the system. Most were minor incontinences, others caused system project and system disruptions. The disruptive issues can be summarized as follows:
• DTE IT policy does not allow incoming Internet connections to systems that are internal to DTE. This policy created issues in debugging the DEW dispatching algorithm and TASE.2 communication.
• There was a failure to communicate IT schedules that impacted the system deployment. In particular, a decision was made to install a VPN between the ROC and D|Tech. However, proper coordination did not occur between the DTE IT staff, D|Tech staff, or the project staff. This failure caused the system to become unavailable for one (1) week due to key resource scheduling conflicts.
• IT staff availability and responsiveness caused several delays in the project. There were many instances where there was an attempt to contact DTE IT staff and no response occurred. In most situations, responses occurred within 1-3 days. However, in some situations, the issue needed to be escalated through making it visible to higher management.
• There were few resources available that understood the OSIsoft PI system or ICCP. The impact on the project was that work regarding those technologies could only be performed when the appropriate resources were available. Thus, a result worth noting is that the deployment of these types of integration/aggregation systems requires training of the local staff in order to maintain and support the system. This particular issue will be typical in the industry.
Of these issues, the one that had the most impact on the overall schedule is the policy that disallows any incoming connections through the DTE firewall. This policy raises questions in regards to how to resolve the information exchange between two entities that have similar policies. However, there are other utilities/operators that could have similar policies and such policies may prevent long-term DER integration and aggregation between such entities. It is an interesting result of Phase I to be able to note that IT policies have a major impact and thus need to be addressed in Phase II and industry wide. It would be recommended that a “best practice” document be created so that IT staffs can be given the appropriate direction. Security During the initial stages of the project, there was a group consensus that the TASE.2 link between the ROC and D|Tech could be non-secure since the system was initially deemed a “pilot” or “temporary” system with a DTE subsidiary. However, as the project progressed, it became evident that the DECo ROC to D|Tech SOC link would not be as temporary as originally envisioned. Thus, approximately three (3) months into the project, it was determined to secure the TASE.2. Both the secure TASE.2 technology and Virtual Private Network (VPN)

Phase I Final Report for DE-FC36-03CH11161
21
technology were evaluated. Due to project schedule and costing, the decision was to use VPN technology. As indicated in the IT Technology Issue section, the IT staff did not coordinate the firewall reconfiguration with the project team nor the D|Tech staff. Thus, the switchover to VPN technology caused approximately a one (1) week project delay. Although, there was a delay, the results indicate that future DER aggregation projects must address security issues from the onset. This would include the involvement of IT staff from the beginning conception of such a project. As more DER operators become integrated, it is clear that VPN technology is not scaleable to the degree needed. Thus, the next phase should deploy “secure” TASE.2. System Latencies There were significant communication latencies encountered in the start/stop of the DERs. The initial thoughts, at the outset of the project, were that communication and response latencies would be in the realm of 1-5 minutes. Due to the use of the Internet as the communication media and communication architecture, the latencies encountered were in the realm of 8-10 minutes. This point is related to the paradigm shift with using the Internet for this type of functionality. Getting acknowledgement of the DERs response and all of the related data will take longer than traditional SCADA systems. This will be a hard concept to get people who are comfortable with traditional SCADA to accept. The project system latencies can be accounted by the following: Latency Item Normal Maximum (1) ICCP Control from DTE to D|Tech 1 second 5 seconds (2) D|Tech reception of ICCP command and scheduling of command to be queued to DER controller.
30 seconds 1 minute
(3) DER controller polling for commands 5 minutes 5 minutes (4) DER ramp/cool-down period required prior to actual execution of command.
Unit dependant
Unit dependant
(5) D|Tech polling for measurements 5 minutes 5 minutes (6) D|Tech DER measurements being exchanged to DTE via ICCP
2 seconds 1 minute
It is clear from the table, that there is a window of time where the actual status of the DER is not able to be determined. Data Validity

Phase I Final Report for DE-FC36-03CH11161
22
During the integration of the DEW dispatch algorithm, occasionally the calculation could not converge and therefore indicated a calculation failure. Closer inspection of the reason for the calculation failure uncovered that the failure was due to the bad data being delivered to the calculation algorithm and not the algorithm itself. In order to understand the full impact of the issues uncovered, it is worthwhile to characterize the validity issue encountered. The SCADA information where extended communication outages are expected, the DECo data disclosed scan-based issues. Instead of a communication channel failing data for an extended period of time (e.g. the data becomes unavailable until restored), the DTE issue was two good data scans and then one bad scan. This meant that the data being supplied to the dispatch algorithm had more rapid intermittent ”data unavailable” every so often. Analysis revealed problems with RTU and radio path as well as PI compaction and bandwidth issues to be addressed. Although these specific issues are being addressed, it raises an interesting issue facing DER aggregation. What is the amount of estimation and approximation that the industry, DER owners, Utilities, DER economic aggregators, and DER operators will accept? This issue will be a candidate issue to be addressed should Phase II implementation continue. Lessons Learned Some of the difficulties that were addressed during the project are listed below: Security – Encryption and authentication should be primary concerns from the start of the project. Late in the project it was discovered that the ICCP gateways could not offer security features. Security (SSL) is implemented in the third party software that is the core of the ICCP gateway, but this functionality was not stable enough for the project to utilize. A VPN link had to be integrated to provide the needed security. Conventions - The integration of the ICCP link required a naming convention to be developed. This convention greatly improved the integration effort. System Latencies - Data problem on the ICCP link was found to be with how the ICCP gateway (SiE shell around a SISCO core) gathers data from the database. The current method is to acquire data on a point-by-point basis. D|Tech will work on a solution that will acquire data from the database in groups rather than by individual points as part of Phase II. Field-testing is critical and is the place where you learn the most. Given the critical applications in which the ICCP link is likely to be used, it is good that it was used for the first time with a very friendly customer. Data Validity – The storage of distribution data into PI requires specific treatment, typically there is not state a estimator which fills in the holes in the data as in the transmission. A data validity application will be added to the front end of DEW to help smooth the data as part of our Phase II proposal.

Phase I Final Report for DE-FC36-03CH11161
23
Operating Procedures – During operational testing deficiencies in the operating procedures were discovered and updated to eliminate them (i.e. DECo needs to notify D|Tech when and in what mode they would like DR units returned to normal). Note utility operators can get busy an emphasis needs to be placed on the return to normal. Command Delays – During operational testing, fine-tuning of the update intervals (5 minute changed to 1 minute) for data updates needed to be made to shorten time delays in commands reaching the DR units. Overall Operation – During operational testing we observed the need to develop simple monitoring applications (gateway watchdog, data flow monitor, etc.) to aid in day-to-day operations and in troubleshooting.
Phase I Final Report for DE-FC36-03CH11161
24
Appendix A - Tagging and Operating Procedures
Phase I Final Report for DE-FC36-03CH11161
25
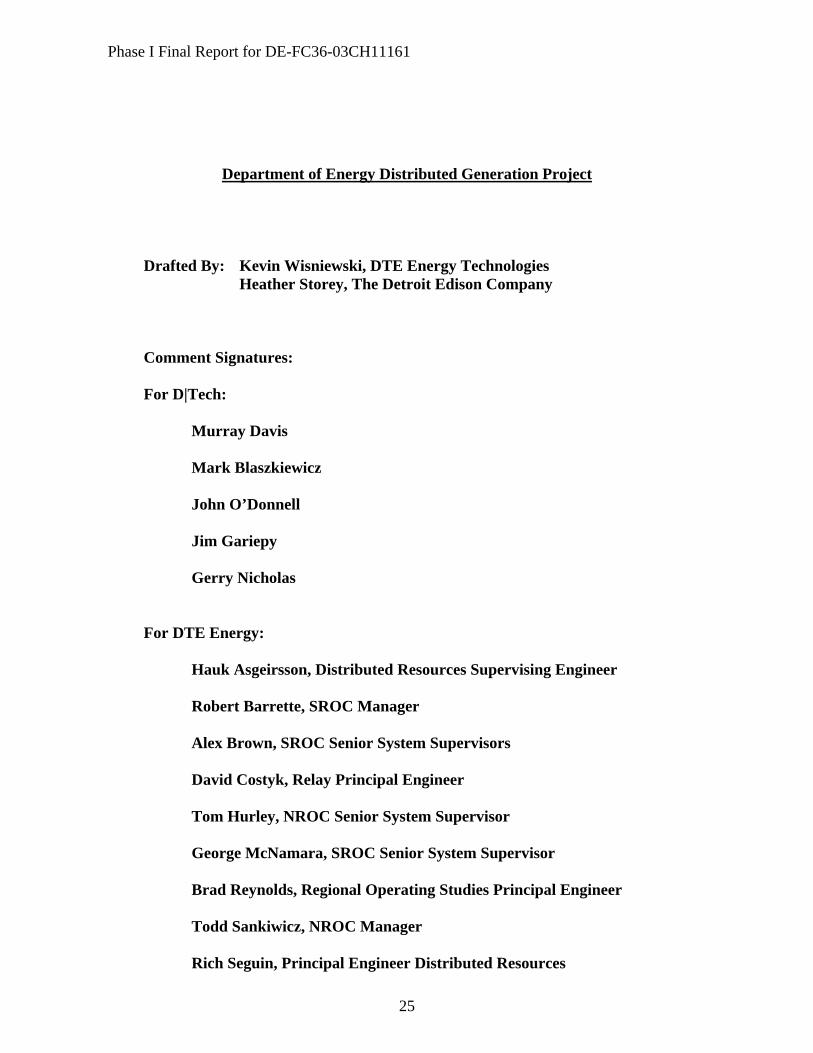
Department of Energy Distributed Generation Project
Drafted By: Kevin Wisniewski, DTE Energy Technologies Heather Storey, The Detroit Edison Company Comment Signatures:
For D|Tech:
Murray Davis
Mark Blaszkiewicz
John O’Donnell
Jim Gariepy
Gerry Nicholas
For DTE Energy:
Hauk Asgeirsson, Distributed Resources Supervising Engineer Robert Barrette, SROC Manager Alex Brown, SROC Senior System Supervisors David Costyk, Relay Principal Engineer Tom Hurley, NROC Senior System Supervisor George McNamara, SROC Senior System Supervisor Brad Reynolds, Regional Operating Studies Principal Engineer Todd Sankiwicz, NROC Manager Rich Seguin, Principal Engineer Distributed Resources

Phase I Final Report for DE-FC36-03CH11161
26
Mike Sheufelt, NROC Senior System Supervisor
INDEX
1. Scope 2. Communications
A. Scheduled Operations B. Unscheduled Operations C. D|Tech SOC D. Abnormal Event/Alarm Notification E. IT/Data Communication F. Loss of Normal Communication
3. Generation Operation
A. Local B. Remote C. Automatic
4. Malfunctioning Trip, Alarms, & Faults
5. Protection, Tagging, & Safety
6. Logging and Record Keeping
7. Appendices A. Sites
1. Adair 2. Union Lake
B. Miscellaneous 1. D|TECH SOC OPERATOR LOG ENTRIES

Phase I Final Report for DE-FC36-03CH11161
27
SECTION 1
SCOPE
A general/generic operational procedure for control and dispatch of distributed generation and alternative energy resources for DTE Energy. Site specific operating procedures and information can be found in the Section 7 appendices. This procedure is not a substitute for common sense and sound judgement. Common sense and sound judgement are expected to be utilized at all times since no document can cover all possible contingencies.

Phase I Final Report for DE-FC36-03CH11161
28
SECTION 2
COMMUNICATION PROCEDURE a) SCHEDULED OPERATION
1. Planned starting of the DR unit based on criteria for that site or a request from N-ROC & S-ROC a week or more in advance. The D|Tech SOC will confirm and begin monitoring those sites more closely. D|Tech SOC will also notify the N-ROC/S-ROC of any data communication problems and make arrangements to resolve these issues.
b) UNSCHEDULED OPERATION
1. Immediate unplanned starting of the DR unit that is not a scheduled event. N-ROC & S-ROC will call D|Tech SOC when the unscheduled start is expected. D|Tech will provide on-demand startups and shutdowns as requested. D|Tech SOC will actively monitor the site/units starting when the request is made and until the sites/units are shut down.
c) D|Tech SOC 1. D|Tech SOC will confirm start, run times, loading (schedules), and any other pertinent information with the RSS. This information shall be logged by both parties.
d) ABNORMAL EVENT/ALARM NOTIFICATIONS
1. ROCs and D|Tech SOC agree to inform each other whenever there is an alarm or other abnormal condition.
e) IT DATA/COMMUNICATION 1. Any IT/Data errors or problems should be reported to the D|Tech SOC operator as soon as possible. The D|Tech SOC Operator will be responsible for starting the trouble report and forwarding it through the appropriate channels.
f) LOSS OF NORMAL COMMUNICATION
1. For a loss of telephone and cell-phone service, a radio communication system needs to be established between D|Tech SOC and the ROCs. It is also necessary to establish conventional analog phone links between D|Tech SOC and the ROCs.
2. D|Tech SOC will provide 24/7 coverage contact for both D|Tech IT technicians and DR/DR Service technicians. These individuals will be dispatched directly to the site from D|Tech.
3. ICCP failure needs further analysis as to the effect on monitoring and control. 4. For loss of SCADA or D|Tech Enterprise Navigator at any of these sites, verbal
communication will need to be established between D|Tech SOC and the ROCs for monitoring.
Phase I Final Report for DE-FC36-03CH11161
29
SECTION 3
Distributed Resource Operation Modes
There are various modes of operation of the distributed resources.
a. Local For these installations, the distributed resource will start by a local operator. These locations could include the following sites: Adair, Glendale-Redford, Zachary-Western Wayne, Southfield, and Lum. For site specific information, see attached appendices.
b. Remote For these installations, the distributed resource will be started by the ROC or by contacting the D|Tech SOC to send a remote start where available or send a D|Tech technician if necessary to assist manual start-up. Loading will vary according to site requirements and controls programming. Remote load control may be available in the future. These locations include the following: Union Lake and Sunset- DTECH Farmington Hills Office. For site specific information, see attached appendices.
c. Automatic For these installations, the distributed resource will start and load automatically based on various parameters. These locations include the following sites: Adair, Glendale-Redford, Zachary-Western Wayne, Southfield, and Lum. For site specific information, see attached appendices.
d. Normal Operation Failure For site specific information, see site specific appendices and section 2.

Phase I Final Report for DE-FC36-03CH11161
30
SECTION 4
Trips, Alarms, and Faults Since monitoring and control differs at each site, refer to attached site specific appendices for site-specific information.

Phase I Final Report for DE-FC36-03CH11161
31
SECTION 5
PROTECTION, TAGGING, and SAFETY The purpose of this section is to ensure adequate safety and tagging procedures are created and followed to provide the maximum level of personnel safety and equipment protection. At locations with potential sources of backfeed, the Distributed Resource (generators or alternative energy source) must be taken off-line or out of service when in abnormal configuration. The distributed resource must have a visible break when taken off-line or out of service. When these distributed resources are connected to the system via distribution circuit, the distribution circuit operating map must identify the potential source of backfeed.
Circuit Operating Map Name Acronym Circuit Number Region Service Center Adair ADAIR 322 NE MAR
Redford GLEND 561 SE RFD Western Wayne ZACRY 9400 SW WWS
Farmington SNSET 9016 SW NHS Lum Battery STDF 2628 NE Solar Cells SOLFD 9010 NW RYO Union Lake UNLAK 1688 NW PON
Anyone working on DR equipment may request protection and tagging. All requests SHALL be made through the operating agent. ALL DTE tagging and safety procedures and practices SHALL be followed. Final acceptance of the protection provided shall be to the satisfaction of the requesting party, however, merit should be accorded the opinions and judgment of the personnel performing the switching and tagging. All personnel provided with protection MUST inform the operating agent who in turn MUST inform the operating authority when work is complete and they are clear of the potential hazard. These individuals may be required to sign applicable documents, forms, or tags accepting the provided protection and relinquishing the need and control for protection before the equipment can be returned to normal service. ALL switching, tagging, jumpering, etc, At the point of common coupling will be accomplished by Detroit Edison personnel. Package provided equipment protection may be accomplished by the service technicians (non-DTE personnel).

Phase I Final Report for DE-FC36-03CH11161
32
SECTION 6
LOGGING and RECORD KEEPING ALL events related to Distributed Generation/Alternative Resources operations and services shall be logged including the context of verbal communications. These entries will include (but not limited to) normal operational dispatches and service requests (see attachment B.1: D|Tech SOC Operator Log Entries).

Phase I Final Report for DE-FC36-03CH11161
33
SECTION 7
GLOSSARY, TERMS, and ABBREVIATIONS
A. General
Automatic Operation of a DR unit based on Algorithms or other site specific criteria that is requested by an operating authority and incorporated by D|Tech (Peak shaving, kW demand, load level, economic dispatch, etc...)
AR Alternate Resource. Solar Cell, Fuel Cell, Windmill, etc. CSS Central System Supervisor DEM Distributed Energy Manager DMS Distribution Management System DR Distributed Resource. A conventional generator or alternator driven by a
combustion turbine, water turbine, internal combustion engine, or external combustion engine (Sterling Engine).
EEM Suite The Silicon Energy software package used by D|Tech. EMS Energy Management System Enterprise Navigator
A module in the EEM Suite for viewing energy and process data.
ETR Estimated Time of Return (to/for service). FLT (Flt) Fault CCP Inter Center Control Protocol. A standardized method of sending and retrieving
data points/values between data centers (computers). Local Local operation of a DR unit requested by an operating agent thru the operating
authority to D|Tech which will result in a change from an automatic mode to local. (Emergency request for voltage support or load relief)
NSS North Regional System Supervisor NROC North Region Operations Center Operating Agent Primary, Sub-station operators and D|Tech. Operating Authority NROC and SROC Remote Remote operation of a DR unit that is requested by an operating authority sent
to D|Tech which will result in a change from an automatic mode to remote. (Emergency request for voltage support or load relief)
ROC Regional Operations Center RSS Regional System Supervisor SCADA Supervisory Control and Data Acquisition Scheduled Planned starting of the DR unit based on criteria for that site or a request for a
start of a unit a week or more in advance. SOC System Operations Center SROC South Region Operations Center SSS South Regional System Supervisor Unscheduled Immediate unplanned starting of the DR unit that is not a scheduled event.
Phase I Final Report for DE-FC36-03CH11161
34
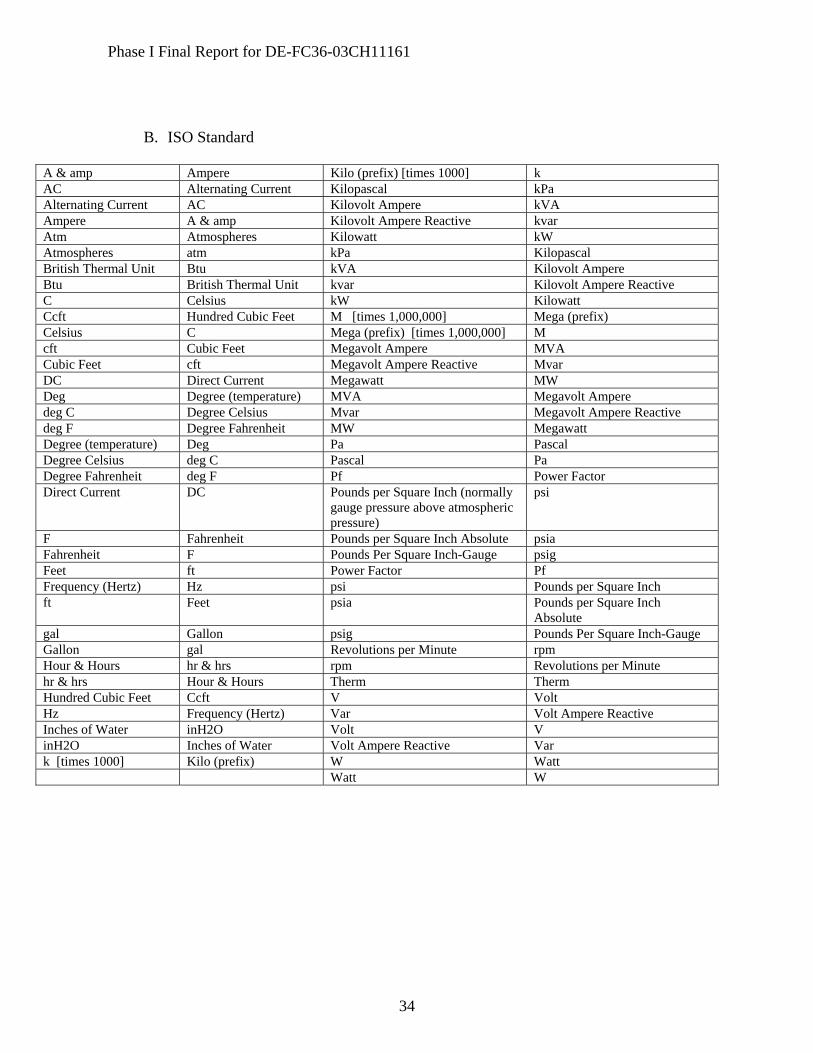
B. ISO Standard
A & amp Ampere Kilo (prefix) [times 1000] k AC Alternating Current Kilopascal kPa Alternating Current AC Kilovolt Ampere kVA Ampere A & amp Kilovolt Ampere Reactive kvar Atm Atmospheres Kilowatt kW Atmospheres atm kPa Kilopascal British Thermal Unit Btu kVA Kilovolt Ampere Btu British Thermal Unit kvar Kilovolt Ampere Reactive C Celsius kW Kilowatt Ccft Hundred Cubic Feet M [times 1,000,000] Mega (prefix) Celsius C Mega (prefix) [times 1,000,000] M cft Cubic Feet Megavolt Ampere MVA Cubic Feet cft Megavolt Ampere Reactive Mvar DC Direct Current Megawatt MW Deg Degree (temperature) MVA Megavolt Ampere deg C Degree Celsius Mvar Megavolt Ampere Reactive deg F Degree Fahrenheit MW Megawatt Degree (temperature) Deg Pa Pascal Degree Celsius deg C Pascal Pa Degree Fahrenheit deg F Pf Power Factor Direct Current DC Pounds per Square Inch (normally
gauge pressure above atmospheric pressure)
psi
F Fahrenheit Pounds per Square Inch Absolute psia Fahrenheit F Pounds Per Square Inch-Gauge psig Feet ft Power Factor Pf Frequency (Hertz) Hz psi Pounds per Square Inch ft Feet psia Pounds per Square Inch
Absolute gal Gallon psig Pounds Per Square Inch-Gauge Gallon gal Revolutions per Minute rpm Hour & Hours hr & hrs rpm Revolutions per Minute hr & hrs Hour & Hours Therm Therm Hundred Cubic Feet Ccft V Volt Hz Frequency (Hertz) Var Volt Ampere Reactive Inches of Water inH2O Volt V inH2O Inches of Water Volt Ampere Reactive Var k [times 1000] Kilo (prefix) W Watt Watt W

Phase I Final Report for DE-FC36-03CH11161
35
SECTION 8
Appendices
A. Sites: 1. Adair Appendix A.1 2. Union Lake Appendix A.2
B. Miscellaneous
1. D|TECH SOC OPERATOR LOG ENTRIES Appendix B.1

Phase I Final Report for DE-FC36-03CH11161
36
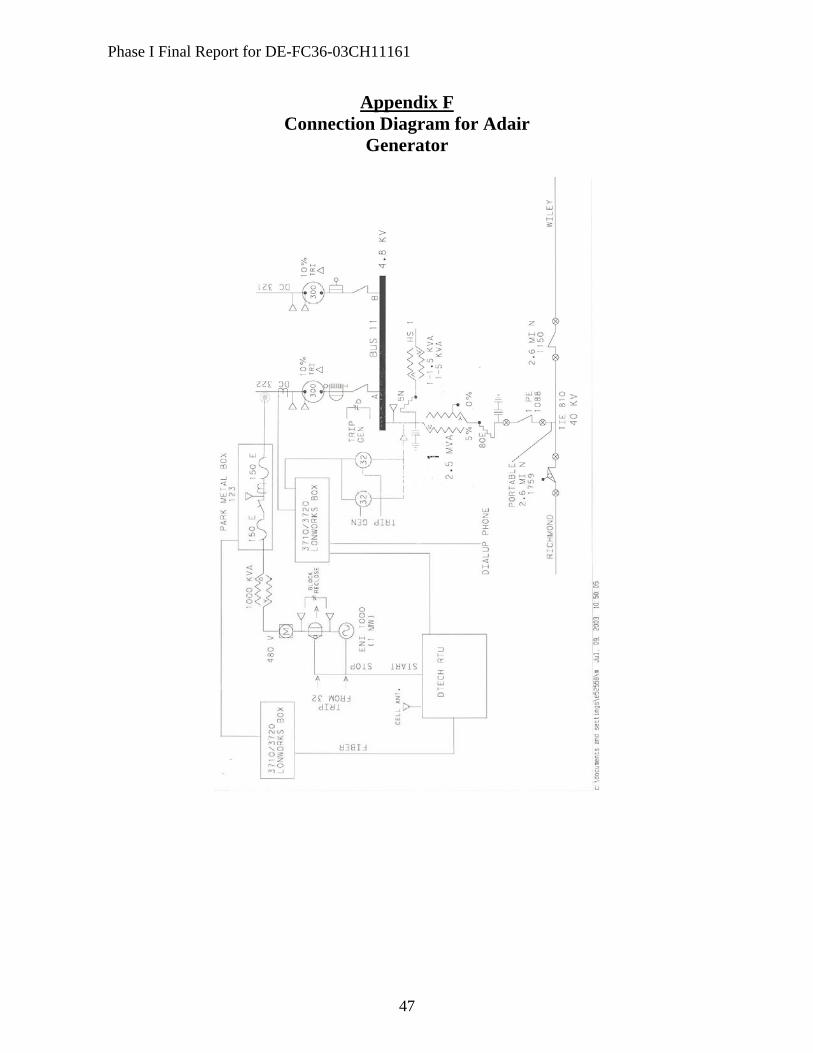
Date: October 7, 2003 Station: ADAIR (DC 322 Adair) A one-MW natural Gas Distributed Generator has been installed at Adair Substation to prevent overloading Adair Transformer 1 during heavy loading periods. The generator and its associated equipment are connected to the system via cable pole DR-C0001 on DC 322 Adair (See Appendix F). The Operating Authority for the generator is the North Regional System Supervisor (NSS). Since the generator is located on substation property, the Operating Agent is the substation operator. Normal Generator Operation The distributed generator will be brought on-line when the load on Adair Transformer 1 is approaching its 444 Amperes (3.7 MVA). With the portable oil cooler operating, the emergency rating of Transformer is 577 Amps. The generator will start automatically at an output of 36 amps (300 kW) when the load on Adair Transformer 1 exceeds 444 amps (3.7 MVA). The generator controller will sample the load every 30 seconds and will automatically increase or decrease its output to maintain 228 amps (1.9 MVA) on Adair Transformer 1 until either of the following occurs:
The generator maximum output of 120 Amps (1 MVA) is reached. At this point, the load on Adair Transformer 1 will begin to exceed 228 Amps (1.9 MVA). If the emergency rating of the transformer is exceeded, the North Regional Operating Center will need to take all necessary actions to protect substation equipment.
The generator minimum output of 36 Amps (300 kW) is reached and the load on
Adair Transformer 1 is less than 396 Amps (3.3 MVA). At this point, the generator will automatically shut down and be taken off line.
* Note: The generator requires a fifteen-minute cool-off period after shutdown before it can be restarted. The generator breaker has Emergency Trip and status in the Distribution Management System. The generator at Adair must remain off-line whenever DC 322 Adair is in an abnormal configuration. Alarming at Adair The Generator Control Permissive On (GEN CTL PERM ON) alarm in the Distribution Management System (DMS) will alert the System Supervisor when any phase on Transformer 1 exceeds 444 amps (3.7 MVA). This is a notification that the generator is about to start. The generator will automatically start following this notification. If the generator does not start, the NSS should contact D|TECH for assistance (See Appendix A for telephone numbers). The Generator Control Permissive Off (GEN CTL PERM OFF) alarm in the Distribution Management System (DMS) will alert the System Supervisor to take the generator off-line. This alarm occurs when the generator breaker is closed and the load of Transformer 1 is below 396

Phase I Final Report for DE-FC36-03CH11161
37
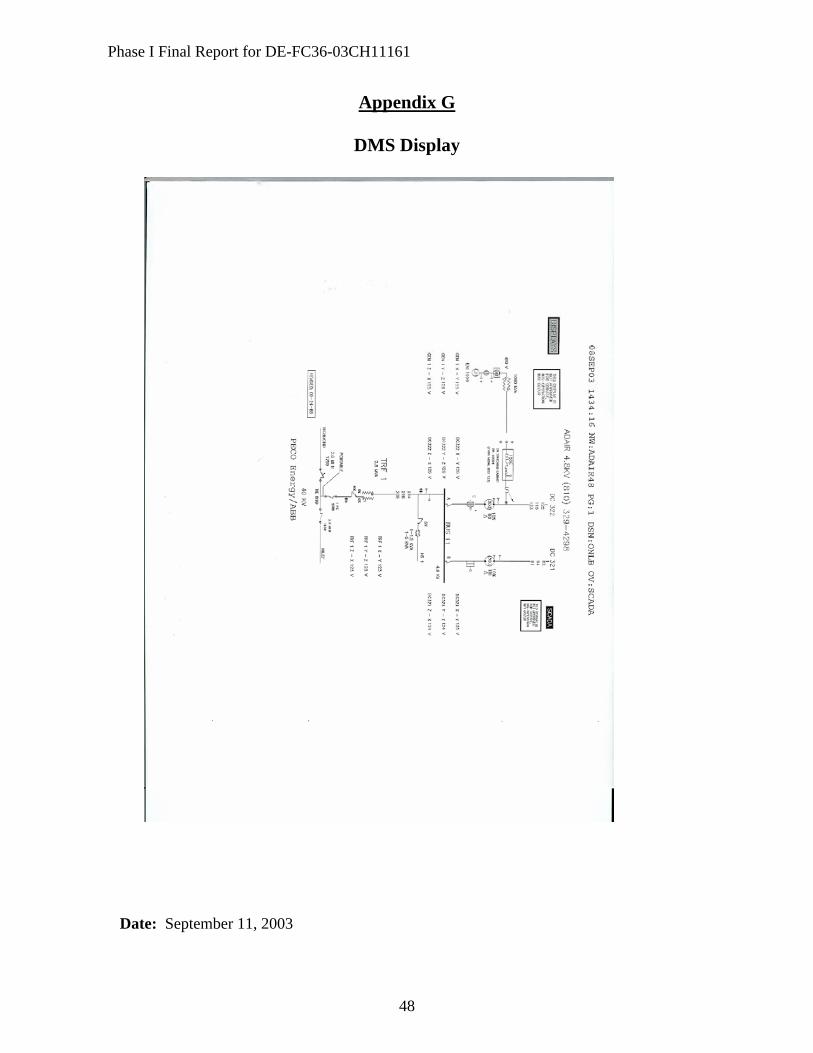
Amps (3.3 MVA) on all three phases. If this alarm is received, the NSS should direct D|TECH to shut down the generator. As long as the automatic generator controls are working properly, the Generator Control Permissive Off (GEN CTL PERM OFF) alarm should not be received. The Generator Major Alarm (G1 MAJOR ALARM) in DMS will alert the System Supervisor that the generator will shut down and the unit will be prohibited from restarting. This alarm is a collective output taken from the generator and can be triggered by any of the alarms listed in Appendix B. The Generator Minor Alarm (G1 MINOR ALARM) in DMS will alert the System Supervisor that the generator will NOT be shut down, but the unit will be prohibited from restarting. This alarm is a collective output taken from the generator and can be triggered by any of the alarms listed in Appendix C. Appendix E lists all DMS alarms available at Adair. Periodic Testing of the Distributed Generator The Adair generator will be run periodically to perform operational tests. These periodic tests will have to be arranged by the North Regional System Supervisor. To ensure a high level of performance throughout the year, the generator will be run twice a month. On these days, the generator should be started at 11:00 A.M. and run for at least two hours at a level of 36 Amps (300 kW). SCADA Monitoring and Control The Amp, MW, MVAR, and Voltage values will be available in the Energy Management System (EMS) and the DMS for the following equipment: Adair Transformer 1, the generator, DC 322, and DC 321. Breaker status and control on DC 322 and the generator is also available for use by the System Supervisors at Adair. A list of all DMS monitoring points available at Adair is shown in Appendix D. Appendix G shows the DMS display for Adair substation. Relaying Reverse power relays are installed on the secondary of Transformer 1. These relays will trip the generator if there is insufficient power flow from Transformer 1 to Adair Bus 11 (4.8-kV). The generator will also trip if the power flow is reversed (flowing from the 4.8-kV into the 40-kV). This relaying is intended to insure that the generator will be automatically shutdown for loss of the 40-kV source. Any opening of the three-phase substation recloser on DC 322 Adair will cause the generator to trip. This trip circuit is “hardwired” to the generator through a local fiber optic system. The scheme is intended to prevent the generator from feeding an islanded load that is isolated from its normal source. If the fiber optic communication is lost, the generator will be tripped after a 15-second time delay. If the generator’s 480-volt breaker is closed, reclosing is blocked on the substation recloser of DC 322. This is intended to prevent an out of synchronism closing of the recloser should the tripping of the generator fail to occur. The generator can be tripped remotely through the SCADA “Remote Trip” command.

Phase I Final Report for DE-FC36-03CH11161
38
Written by: H. L. Storey Contributions by: M. Jacob
R. Capatina-Rata L. F. Kelly D. M. Costyk R. J. Seguin W. D. Harlow M. Blaszkiewicz
Phase I Final Report for DE-FC36-03CH11161
39
Appendix A
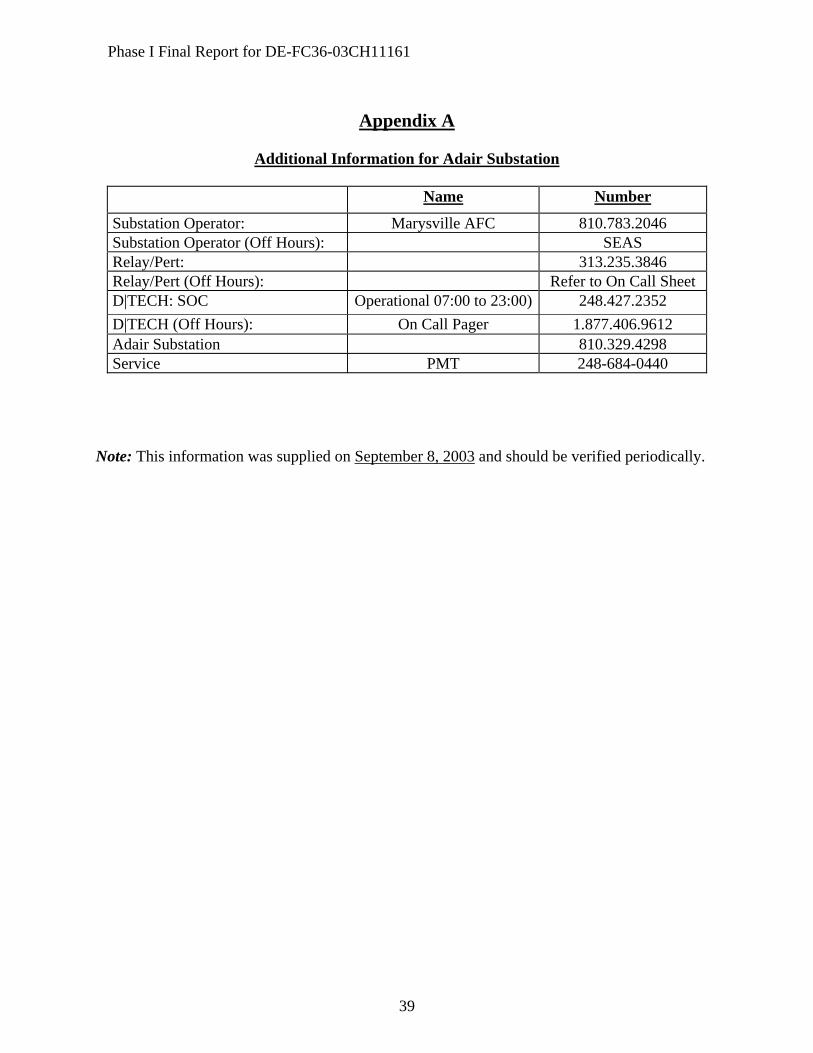
Additional Information for Adair Substation
Name Number
Substation Operator: Marysville AFC 810.783.2046 Substation Operator (Off Hours): SEAS Relay/Pert: 313.235.3846 Relay/Pert (Off Hours): Refer to On Call Sheet D|TECH: SOC Operational 07:00 to 23:00) 248.427.2352 D|TECH (Off Hours): On Call Pager 1.877.406.9612 Adair Substation 810.329.4298 Service PMT 248-684-0440
Note: This information was supplied on September 8, 2003 and should be verified periodically.
Phase I Final Report for DE-FC36-03CH11161
40
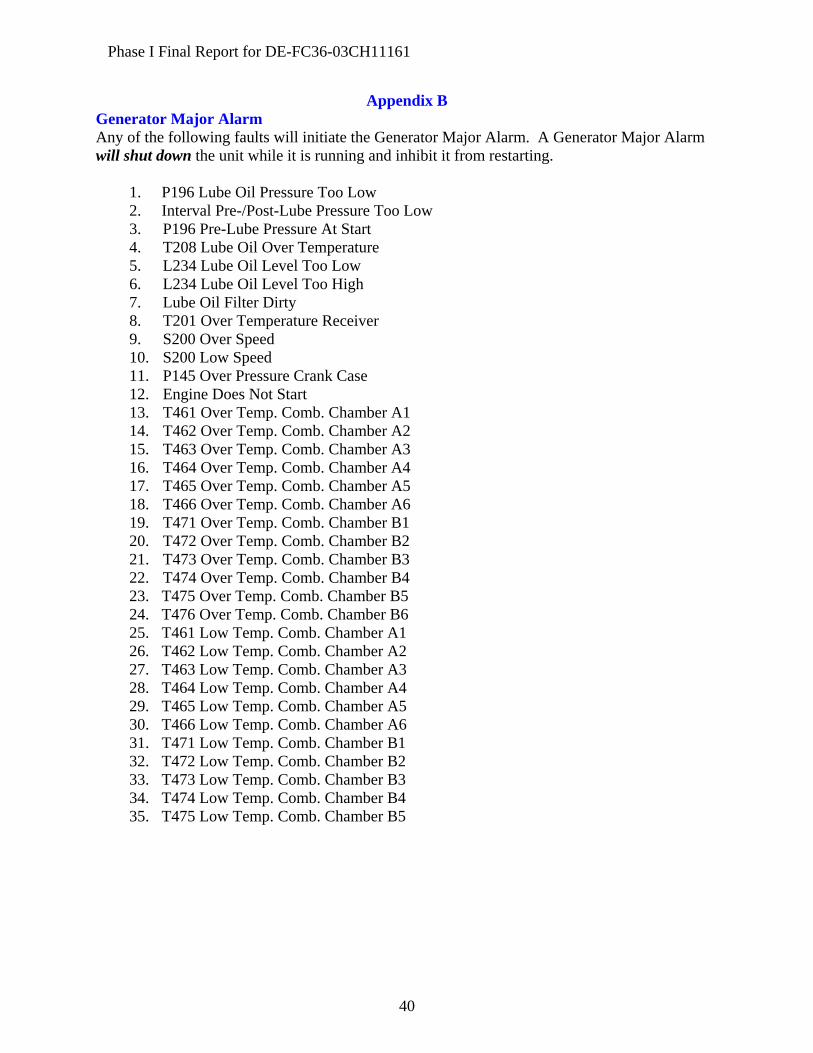
Appendix B Generator Major Alarm Any of the following faults will initiate the Generator Major Alarm. A Generator Major Alarm will shut down the unit while it is running and inhibit it from restarting.
1. P196 Lube Oil Pressure Too Low 2. Interval Pre-/Post-Lube Pressure Too Low 3. P196 Pre-Lube Pressure At Start 4. T208 Lube Oil Over Temperature 5. L234 Lube Oil Level Too Low 6. L234 Lube Oil Level Too High 7. Lube Oil Filter Dirty 8. T201 Over Temperature Receiver 9. S200 Over Speed 10. S200 Low Speed 11. P145 Over Pressure Crank Case 12. Engine Does Not Start 13. T461 Over Temp. Comb. Chamber A1 14. T462 Over Temp. Comb. Chamber A2 15. T463 Over Temp. Comb. Chamber A3 16. T464 Over Temp. Comb. Chamber A4 17. T465 Over Temp. Comb. Chamber A5 18. T466 Over Temp. Comb. Chamber A6 19. T471 Over Temp. Comb. Chamber B1 20. T472 Over Temp. Comb. Chamber B2 21. T473 Over Temp. Comb. Chamber B3 22. T474 Over Temp. Comb. Chamber B4 23. T475 Over Temp. Comb. Chamber B5 24. T476 Over Temp. Comb. Chamber B6 25. T461 Low Temp. Comb. Chamber A1 26. T462 Low Temp. Comb. Chamber A2 27. T463 Low Temp. Comb. Chamber A3 28. T464 Low Temp. Comb. Chamber A4 29. T465 Low Temp. Comb. Chamber A5 30. T466 Low Temp. Comb. Chamber A6 31. T471 Low Temp. Comb. Chamber B1 32. T472 Low Temp. Comb. Chamber B2 33. T473 Low Temp. Comb. Chamber B3 34. T474 Low Temp. Comb. Chamber B4 35. T475 Low Temp. Comb. Chamber B5

Phase I Final Report for DE-FC36-03CH11161
41
Generator Major Alarm (Continued)
36. T476 Low Temp. Comb. Chamber B6 37. Comb. Chamber Monitoring A (mean v.) 38. Comb. Chamber Monitoring B (mean v.) 39. Over Temp. Comb. Chamber Mean Value A 40. Over Temp. Comb. Chamber Mean Value B 41. T207 Over Temp. Jacket Water Engine Inlet 42. T206 Over Temp. Jacket Water Engine Outlet 43. DP Flow Monitoring Engine Cooling Circuit 44. DP Flow Monitoring Intercooler Circuit 45. Low Water Engine Cooling Circuit 46. Low Water Intercooler Circuit 47. T160 Over Temperature Cabinet Air 48. Cabinet Ventilation 49. T203 Over Temperature Air Inlet 50. Mixture Controller 51. Engine Overload 52. Power Control 53. Power Reduction Below 80% Necessary 54. Power Too Long Below 30% 55. P124 Gas Pressure 56. T209 Over Temp. Generator Winding U1 57. T210 Over Temp. Generator Winding V1 58. T211 Over Temp. Generator Winding W1 59. Synchronization Failure 60. Reverse Power 61. Collective Fault Generator Protection 62. Mains Failure 63. Mains Failure Sequence Fault 64. Circuit Breaker TEM 65. Reset While Engine Was Running 66. Internal Quick Stop 67. External Quick Stop Without Heat Removal 68. External Quick Stop With Heat Removal 69. Security Chain Open 70. Ignition System Collective Fault 71. Speed Governor Collective Fault 72. Stepper Motor Board Collective Fault 73. CAN-Bus Collective Fault 74. Control Parameters 75. P196 Lube Oil Pressure Before Filter Sensor 76. T208 Lube Oil Sensor

Phase I Final Report for DE-FC36-03CH11161
42
Generator Major Alarm (Continued)
77. L234 Lube Oil Level Sensor 78. T201 Receiver Sensor 79. P145 Crank Case Pressure Sensor 80. S200 Speed Governor Actual Speed Sensor 81. T203 Air Inlet Sensor 82. T461 Comb. Chamber A1 Sensor 83. T462 Comb. Chamber A2 Sensor 84. T463 Comb. Chamber A3 Sensor 85. T464 Comb. Chamber A4 Sensor 86. T465 Comb. Chamber A5 Sensor 87. T466 Comb. Chamber A6 Sensor 88. T471 Comb. Chamber B1 Sensor 89. T472 Comb. Chamber B2 Sensor 90. T473 Comb. Chamber B3 Sensor 91. T474 Comb. Chamber B4 Sensor 92. T475 Comb. Chamber B5 Sensor 93. T476 Comb. Chamber B6 Sensor 94. T Cold Junction A Sensor 95. T Cold Junction B Sensor 96. T206 Jacket Water Engine Outlet Sensor 97. T207 Jacket Water Engine Inlet Sensor 98. T202 Jacket Water GK Inlet Sensor 99. E199 Demand Analog Sensor 100. E198 Actual Power Generator Sensor 101. T209 Generator Winding U Sensor 102. T210 Generator Winding V Sensor 103. T211 Generator Winding W Sensor 104. CAN-Bus Digital Inputs 105. CAN-Bus Digital Outputs 106. Local Digital Inputs 107. Local Digital Outputs 108. E149 Supply Voltage TEM

Phase I Final Report for DE-FC36-03CH11161
43
Appendix C Generator Minor Alarm Any of the following alarms will initiate the Generator Minor Alarm. A Generator Minor Alarm will not shut down the unit while it is running, but the generator will be inhibited from restarting.
1. P196 Lube Oil Pressure Too Low 2. Interval Pre-/Re-lube Pressure Too Low 3. T208 Lube Oil Over Temperature 4. L234 Lube Oil Level Too Low 5. L234 Lube Oil Level Too High 6. Lube Oil Filter Dirty 7. P157 Exhaust Back Pressure Too High 8. S200 Speed Before Start Too High 9. P145 Low Pressure Crank Case 10. T461 Low Temperature Comb. Chamber A1 11. T462 Low Temperature Comb. Chamber A2 12. T463 Low Temperature Comb. Chamber A3 13. T464 Low Temperature Comb. Chamber A4 14. T465 Low Temperature Comb. Chamber A5 15. T466 Low Temperature Comb. Chamber A6 16. T471 Low Temperature Comb. Chamber B1 17. T472 Low Temperature Comb. Chamber B2 18. T473 Low Temperature Comb. Chamber B3 19. T474 Low Temperature Comb. Chamber B4 20. T475 Low Temperature Comb. Chamber B5 21. T476 Low Temperature Comb. Chamber B6 22. T206 Over Temp. Jacket Water Engine Outlet 23. T160 Over Temperature Cabinet Air 24. T203 Over Temperature Air Inlet 25. Power Too Long Under 30% 26. Mains Failure 27. T209 Over Temperature Generator Winding U1 28. T210 Over Temperature Generator Winding V1 29. T211 Over Temperature Generator Winding W1 30. Ignition System Collective Alarm 31. Anti-Knock Governor Collective Alarm 32. Stepper Motor Board Collective Alarm 33. CAN-Bus Collective Alarm 34. Earth Fault Analog Inputs 35. Speed Governor Collective Alarm

Phase I Final Report for DE-FC36-03CH11161
44
Generator Minor Alarm (Continued)
36. Supply Voltage Below 18 V 37. Supply Voltage Above 30 V 38. T203 Air Inlet Sensor 39. T405 GK Dry Cooler Outlet Sensor 40. T419 NK Dry Cooler Outlet Sensor 41. T160 Cabinet Air Sensor 42. Collective Alarm Digital Inputs Bus 43. Collective Alarm Digital Outputs Bus 44. Collective Alarm Digital Outputs TEM 45. Parametrizable Measurement 01 46. Parametrizable Measurement 02

Phase I Final Report for DE-FC36-03CH11161
45
Appendix D
Monitoring Points in DAS
Point Name Point Name
DC321 X-Y 4.8KV DC322 VA DC321 Y-Z 4.8KV DC322 X I DC321 Z-X 4.8KV DC322 Y I DC322 X-Y 4.8KV DC322 Z I DC322 Y-Z 4.8KV DC322 COMM
FAIL DC322 Z-X 4.8KV DC322 CTRL BAT GEN 1 X-Y 4.8KV DC322 TEST
VOLTS GEN 1 Y-Z 4.8KV RTU BAT GEN 1 Z-X 4.8KV GEN 1 MW TRF 1 X-Y 4.8KV GEN 1 MV TRF 1 Y-Z 4.8KV GEN 1 I TRF 1 Z-X 4.8KV GEN 1 VA DC321 MW GEN 1 X I DC321 MV GEN 1 Y I DC321 I GEN 1 Z I DC321 VA TRF 1 MW DC321 X I TRF 1 MV DC321 Y I TRF 1 I DC321 Z I TRF 1 VA DC322 MW TRF 1 X I DC322 MV TRF 1 Y I DC322 I
TRF 1 Z I

Phase I Final Report for DE-FC36-03CH11161
46
Appendix E
Alarm Points in DAS
Point Name Point Name
END ELEMENT DC322 Z FLT DC322 BKR G1 MAJOR ALARM DC322 CHECK BAT G1 MINOR ALARM DC322 CTRL OK G1 RLY LOSS AC DC322 END ELE GEN 1 BREAKER DC322 GND FLT GEN1 METER DC322 HOT LINE TRF1 METER DC322 NORM PROF DC322 METER DC322 REC LO DC321 METER DC322 REC MALFN BE1-32R RELAY DC322 RECLOSE GND DETECTOR DC322 RTU FAIL LOSS OF AC DC322 RTU PWR LOW 4.8KV
VOLTS DC322 SPV CTRL STA AL PWR DC322 SW MODE STA AL SW L/R DC322 X FLT TRF-REG TMP DC322 Y FLT G1 CTL PERM OFF DC322 OPEN G1 CTL PERM ON DC322 CLOSE GEN1 TRIP DC322 REC DIS POS. A METER DC322 REC ENAB POS. B METER DC322 SW MODE
POS. A BKR
Phase I Final Report for DE-FC36-03CH11161
47
Appendix F Connection Diagram for Adair
Generator
Phase I Final Report for DE-FC36-03CH11161
48
Appendix G
DMS Display
Date: September 11, 2003

System Operating Practice Appendix A.2
Appendix A.2 49
Station: Union Lake (DC 1688 Union Lake) A 2-MW diesel Distributed Generator has been installed at Union Lake Substation to prevent overloading DC 1688 Union Lake during heavy loading periods. The generator and its associated equipment are connected to the system via cable pole DR H0004 on DC 1688 Union Lake (See Appendix F for connection diagram). The Operating Authority for the generator is the North Regional System Supervisor (NRSS). Since the generator is located on substation property, the Operating Agent is the substation operator. Normal Generator Operation The summer emergency rating of DC 1688 Union Lake is 770 Amps (6.4 MVA). The summer day-to-day rating of DC 1688 Union Lake is 612 Amps (5.1 MVA). The distributed generator should be brought on-line when the load exceeds it summer day-to-day rating. Whenever the load exceeds 625 Amps (5.2 MVA) on any phase of DC 1688 Union Lake, the generator should be placed online. The NSS will receive the PERMISSIVE ON alarm when this load level is reached. The NRSS should contact D|TECH to start the generator. (See Appendix A for telephone numbers) Since the transfer trip scheme is not functional, the generator must be limited to an output of 84 amps (0.7 MVA). The generator should only be run when the under/over frequency relays and under/over voltage relays are operational and the load of DC 1688 Union Lake exceeds 480 amps (4 MVA). The generator can be run at a higher output if necessary as long as the generator output does not exceed 25% of the total circuit load. * *Note: Once the generator is running, the circuit load does not include the generator output. For this reason, the total circuit load is calculated by adding the load on the circuit to the generator output. The NSS will receive the BE1-81 alarm when there is no DC power for the under/over frequency relays. If this alarm is received, the generator should be taken off-line and kept off-line until the power to the relays is restored. When the load on DC 1688 Union Lake falls below 505 Amps (4.2 MVA) and the generator is running, the PERMISSIVE OFF alarm will be received by the NSS. The NSS should contact D|TECH to turn off the generator if the generator is being used to relieve DC 1688 Union Lake. (See Appendix A for telephone numbers)** ** Note: The generator requires a fifteen-minute cool-off period after shutdown before it can be restarted. Emergency Trip of the generator breaker is available in the Data Management System (DMS). The generator at Union Lake must remain off-line whenever DC 1688 Union Lake is in an abnormal configuration.
System Operating Practice Appendix A.2
Appendix A.2 50
Alarming at Union Lake Substation The Generator Permissive On (PERMISSIVE ON) alarm in the Distribution Management System (DMS) will alert the System Supervisor when any phase on DC 1688 Union Lake exceeds 625 amps (5.2 MVA). This is a notification that the generator should be started. The NSS should contact D|TECH to start the generator. (See Appendix A for telephone numbers). *** The Generator Permissive Off (PERMISSIVE OFF) alarm in the Distribution Management System (DMS) will alert the System Supervisor to take the generator off-line. This alarm occurs when the generator breaker is closed and the load of DC 1688 Union Lake is below 505 Amps (4.2 MVA) on all three phases. If this alarm is received, the NSS should direct D|TECH to shut down the generator. (See Appendix A for telephone numbers)*** *** Note: Since the transfer trip scheme is not functional, the generator must be limited to an output of 84 amps (0.7 MVA). The generator should only be run when the under/over frequency relays and under/over voltage relays are operational and the load of DC 1688 Union Lake exceeds 480 amps (4 MVA). The generator can be run at a higher or lower output if necessary as long as the generator output does not exceed 25% of the total circuit load. The Generator Major Alarm (MAJOR GEN ALARM) in DMS will alert the System Supervisor that the generator will shut down and the unit will be prohibited from restarting. This alarm is a collective output taken from the generator and can be triggered by any of the faults listed in Appendix B. A list of troubleshooting procedures from the generator manual is listed in Appendix G. The Generator Minor Alarm (MINOR GEN ALARM) in DMS will alert the System Supervisor that the generator will NOT be shut down, but the unit will be prohibited from restarting. This alarm is a collective output taken from the generator and can be triggered by any of the alarms listed in Appendix C. A list of troubleshooting procedures from the generator manual is listed in Appendix G. The BE1-32R Alarm (BE1-32R) in DMS will alert the System Supervisor that there is no DC power to the reverse power relays. The generator can still run without the reverse power relays, but the ratio of the load to generator output must be 4:1. The BE1-81 Alarm (BE1-81) in DMS will alert the System Supervisor that there is no DC power to the under/over frequency relays. If this alarm is received and the Transfer trip scheme is not operational, the NSS should direct D|TECH to shut down the generator. The generator should not be started unless there is DC power to the under/over frequency relays. Appendix E lists all DMS alarms available at Union Lake. Appendix H shows the DMS displays. Periodic Testing of the Distributed Generator The Union Lake generator will be run periodically to perform operational tests. These periodic

System Operating Practice Appendix A.2
Appendix A.2 51
tests will have to be arranged through the North Regional System Supervisor. Monitoring and Control The Amp, MW, MVAR, and Voltage values on the generator are available in the Energy Management System (EMS) and the DMS. The D|TECH web site can be used for an alternate way to view these values for the generator. The web sit can be access by going to the following web page: http://www.energy-now.com/ *Note this web site requires Internet access. The web site also requires a username and password. Portable metering equipment has been installed on DC 1688 Union Lake. The current circuit readings can be obtained by going to the following web page: http://162.9.240.166/pqweb/webreports/PDC-Northwest.html This web page can also be reached from the Regional Operating Center web site by clicking on resources and then clicking Northwest under the Portable Monitor-Circuit Load Reports. A list of all DMS monitoring points available at Union Lake is shown in Appendix D.

System Operating Practice Appendix A.2
Appendix A.2 52
Relaying Since the transfer trip scheme is currently not functional, the generator must be limited to an output of 84 amps (0.7 MVA) and the load on DC 1688 Union Lake must be greater than 480 amps (4 MVA) to provide adequate protection. Reverse power relaying to protect against back feeding the 40 kV for faults on the 40 kV is not installed at Union Lake Substation, but it will be installed at a later date. For this reason, the generator must only be run during peak loading periods to ensure that the undervoltage relaying will provide protection for 40 kV faults.
Written by: H. L. Storey Contributions by: M. Jacob
R. Capatina-Rata L. F. Kelly D. M. Costyk R. J. Seguin W. D. Harlow M. Blaszkiewicz

System Operating Practice Appendix A.2
Appendix A.2 53
Appendix A
Additional Information for Union Lake Substation
Name Number
Substation Operator: Pontiac AFC 586.745.5082 Substation Operator (Off Hours):
SEAS
Relay/Pert: 313.235.3846 Relay/Pert (Off Hours): Refer to On Call
Sheet D|TECH: D|TECH System
Operations Center (Operational 07:00 to
23:00)
248.427.2352
D|TECH (Off Hours): D|TECH Toll Free Number 1.877.406.9612 Union Lake Substation 313.235.2794
Note: This information was supplied on July 23, 2003 and should be verified periodically.

System Operating Practice Appendix A.2
Appendix A.2 54
Appendix B Generator Major Alarm1 Any of the following faults will initiate the Generator Major Alarm. Any of these faults will shut down the unit while it is running and will inhibit it from restarting. *CAT CODE LAMP DISPLAYED MESSAGE A 556 Shtdn Blowby pressure A 586 Shtdn Run/Stop Switch A 587 Shtdn Run/Stop Switch D 688 Shtdn High oil level alarm A 1322 Shtdn Load gov kW setpoint oor hi A 1323 Shtdn Load gov kW setpoint oor lo A 1331 Shtdn AVR driver shorted A 1332 Shtdn Manual switch oor lo A 1333 Shtdn Manual switch oor hi A 1327 Shtdn Load gov kW analog oor A 1334 Shtdn Critical scaler oor NA 1336 Shtdn Cooldown Complete NA 1341 Shtdn Load demand stop A 1342 Shtdn Slot 0 card A 1343 Shtdn Slot 1 card A 1344 Shtdn Slot 2 card A 1345 Shtdn Slot 3 card A 1346 Shtdn Slot 4 incorrect A 1347 Shtdn Slot 5 card A 1348 Shtdn Slot 6 card A 1349 Shtdn Slot 7 card D 1433 Shtdn Emergency stop - local D 1434 Shtdn Emergency stop - remote A 1437 Shtdn E-stop path fuse blown A 111 Shtdn Internal ECM error A 112 Shtdn Actuator not responding A 115 Shtdn No speed signal A 116 Shtdn Time press sensor high A 117 Shtdn Time press sensor low C 151 Shtdn High coolant temp alarm A 155 Shtdn Manifold air temp alarm A 214 Shtdn High oil temperature
1 Operator’s Manual-PowerCommand Control 3200 Series Generator Sets Cummings Power Generation, 9-2001

System Operating Practice Appendix A.2
Appendix A.2 55
Generator Major Alarm (Continued)2: *CAT CODE LAMP DISPLAYED MESSAGE A 228 Shtdn Low coolant pressure A 234 Shtdn Overspeed D 235 Shtdn Coolant level alarm A 236 Shtdn Position sensor D 253 Shtdn Oil level alarm A 254 Shtdn Fuel shutoff valve A 266 Shtdn Fuel temperature B 415 Shtdn Low oil pressure alarm A 455 Shtdn Fuel control valve sensor A 514 Shtdn Fuel control valve A 1445 Shtdn Alternator short circuit A 1446 Shtdn AC output voltage is high A 1447 Shtdn AC output voltage is low A 1448 Shtdn AC output frequency low A 1452 Shtdn Gen CB failed to close A 1453 Shtdn Gen CB failed to open A 1455 Shtdn Util CB contact A 1459 Shtdn Reverse kW A 1461 Shtdn Loss of field A 1472 Shtdn Overcurrent A 1473 Shtdn Watchdog failure A 1474 Shtdn Software version mismatch A 1481 Shtdn AVR driver open A 1485 Shtdn EFC driver shorted A 1486 Shtdn EFC driver open A 2114 Shtdn High aftercooler temp
*Category Fault Code Definitions:
Category A Fault Codes: These codes pertain to engine or alternator shutdown faults that require immediate repair by qualified service personnel (generator set non-operational). Control prevents the generator set from being restarted.
2 Operator’s Manual-PowerCommand Control 3200 Series Generator Sets Cummings Power Generation, 9-2001

System Operating Practice Appendix A.2
Appendix A.2 56
Category B Fault Codes: These codes consist of faults that can affect genset performance or cause engine, alternator, or connected equipment damage. Operate only when generator set is powering critical loads and cannot be shutdown. Requires repair by qualified service personnel.
Category C Fault Codes: These codes consist of faults that do not affect the
generator set performance but require qualified service personnel to repair. These codes indicate a defective sensor or harness, leaving no engine protection. (Engine damage can occur without detection.) Continued operation may void generator set warranty if damage occurs that relates to fault condition.
Category D Fault Codes: These codes consist of faults that are repairable by site
personnel. Qualified service personnel will repair Service if site personnel cannot resolve the problem after taking the corrective actions suggested in Appendix G.
Category NA Fault Codes: These codes consist of faults that are non-critical
operational status of generator set, external faults, or customer fault inputs. May require repair by qualified service personnel.
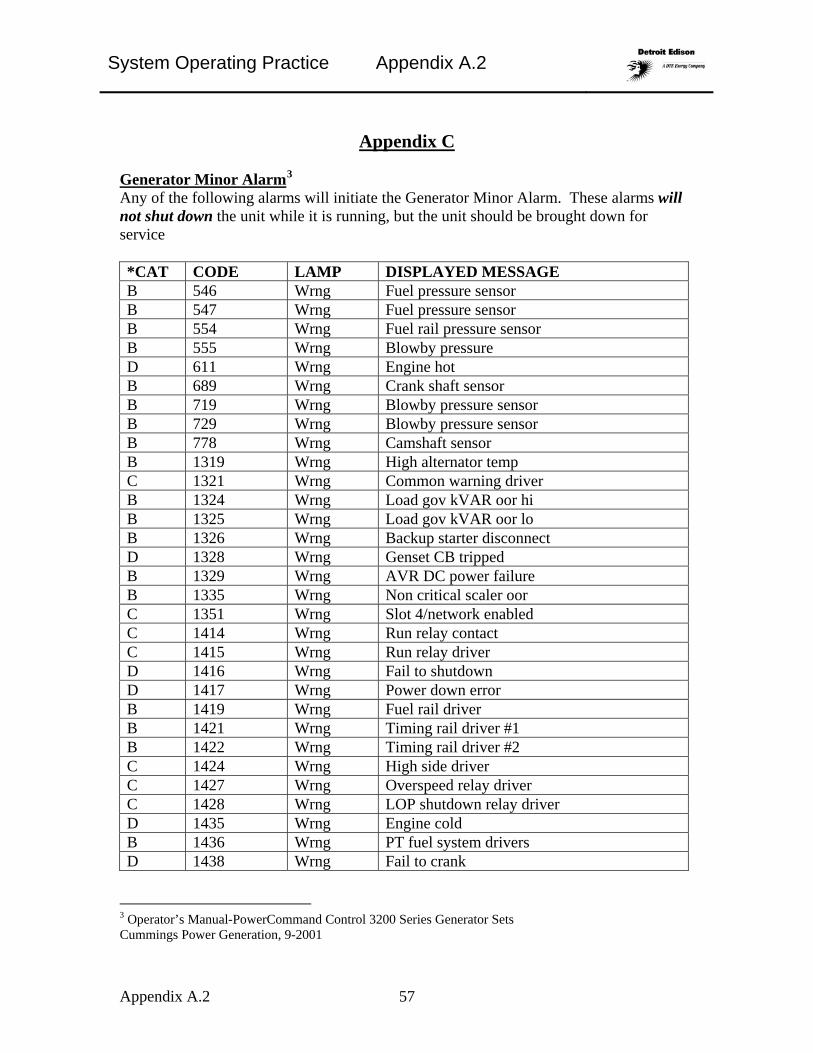
System Operating Practice Appendix A.2
Appendix A.2 57
Appendix C Generator Minor Alarm3 Any of the following alarms will initiate the Generator Minor Alarm. These alarms will not shut down the unit while it is running, but the unit should be brought down for service *CAT CODE LAMP DISPLAYED MESSAGE B 546 Wrng Fuel pressure sensor B 547 Wrng Fuel pressure sensor B 554 Wrng Fuel rail pressure sensor B 555 Wrng Blowby pressure D 611 Wrng Engine hot B 689 Wrng Crank shaft sensor B 719 Wrng Blowby pressure sensor B 729 Wrng Blowby pressure sensor B 778 Wrng Camshaft sensor B 1319 Wrng High alternator temp C 1321 Wrng Common warning driver B 1324 Wrng Load gov kVAR oor hi B 1325 Wrng Load gov kVAR oor lo B 1326 Wrng Backup starter disconnect D 1328 Wrng Genset CB tripped B 1329 Wrng AVR DC power failure B 1335 Wrng Non critical scaler oor C 1351 Wrng Slot 4/network enabled C 1414 Wrng Run relay contact C 1415 Wrng Run relay driver D 1416 Wrng Fail to shutdown D 1417 Wrng Power down error B 1419 Wrng Fuel rail driver B 1421 Wrng Timing rail driver #1 B 1422 Wrng Timing rail driver #2 C 1424 Wrng High side driver C 1427 Wrng Overspeed relay driver C 1428 Wrng LOP shutdown relay driver D 1435 Wrng Engine cold B 1436 Wrng PT fuel system drivers D 1438 Wrng Fail to crank
3 Operator’s Manual-PowerCommand Control 3200 Series Generator Sets Cummings Power Generation, 9-2001

System Operating Practice Appendix A.2
Appendix A.2 58
Generator Minor Alarm4 (Continued) *CAT CODE LAMP DISPLAYED MESSAGE D 1439 Wrng Fuel level low in day D 1441 Wrng Fuel level low in main D 1442 Wrng Battery is weak B 113 Wrng Actuator sensor fault B 118 Wrng Pump press sensor high B 119 Wrng Pump press sensor low C 121 Wrng No engine speed signal B 122 Wrng Manifold air press sensor B 123 Wrng Manifold air press sensor C 135 Wrng Oil pressure sensor C 141 Wrng Oil pressure sensor B 143 Wrng Low oil pressure C 144 Wrng Coolant temperature sensor C 145 Wrng Coolant temperature sensor D 146 Wrng High coolant temp warning D 152 Wrng Low coolant temp C 153 Wrng Manifold air temp sensor C 154 Wrng Manifold air temp sensor D 197 Wrng Coolant level warning C 212 Wrng Oil temperature sensor C 213 Wrng Oil temperature sensor C 221 Wrng Air pressure sensor C 222 Wrng Air pressure sensor C 231 Wrng Coolant pressure sensor C 232 Wrng Coolant pressure sensor A 233 Wrng Coolant pressure warning C 259 Wrng Fuel shutoff valve C 261 Wrng Fuel temperature sensor C 263 Wrng Fuel temperature sensor C 265 Wrng Fuel temperature sensor B 316 Wrng Fuel supply pump B 318 Wrng Fuel supply pump D 326 Wrng Oil level warning B 343 Wrng Internal ECM error C 359 Wrng Engine failed to start
4 Operator’s Manual-PowerCommand Control 3200 Series Generator Sets Cummings Power Generation, 9-2001
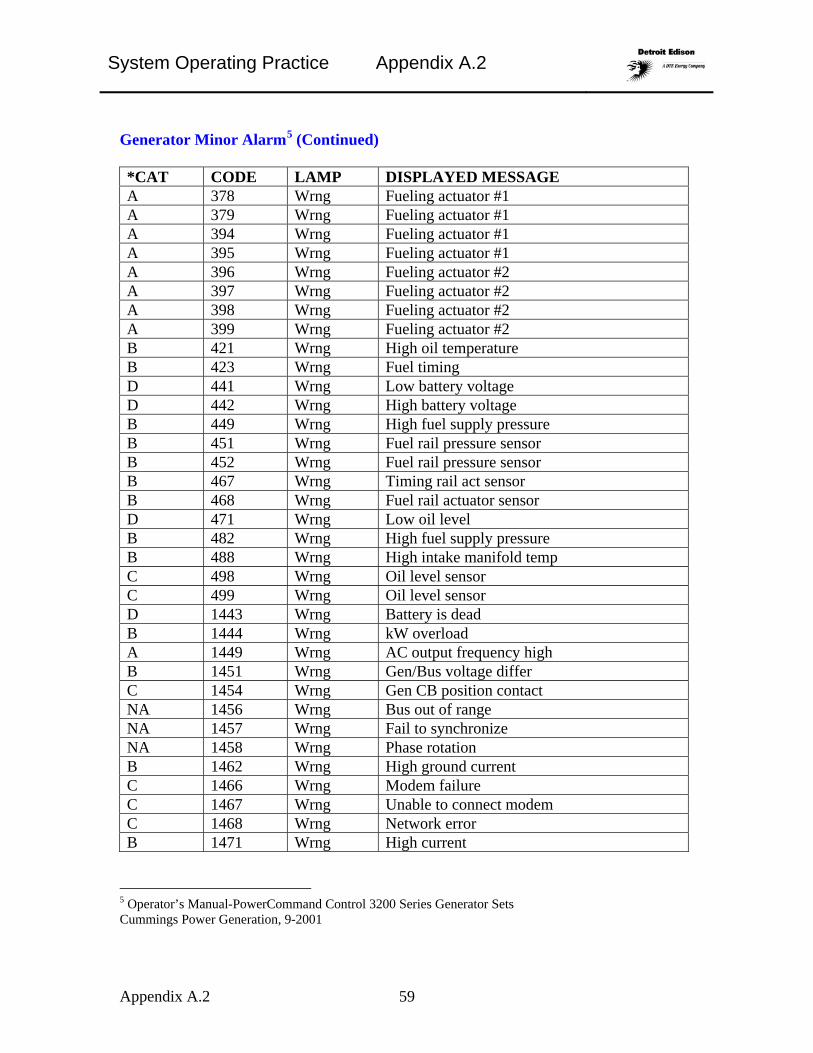
System Operating Practice Appendix A.2
Appendix A.2 59
Generator Minor Alarm5 (Continued) *CAT CODE LAMP DISPLAYED MESSAGE A 378 Wrng Fueling actuator #1 A 379 Wrng Fueling actuator #1 A 394 Wrng Fueling actuator #1 A 395 Wrng Fueling actuator #1 A 396 Wrng Fueling actuator #2 A 397 Wrng Fueling actuator #2 A 398 Wrng Fueling actuator #2 A 399 Wrng Fueling actuator #2 B 421 Wrng High oil temperature B 423 Wrng Fuel timing D 441 Wrng Low battery voltage D 442 Wrng High battery voltage B 449 Wrng High fuel supply pressure B 451 Wrng Fuel rail pressure sensor B 452 Wrng Fuel rail pressure sensor B 467 Wrng Timing rail act sensor B 468 Wrng Fuel rail actuator sensor D 471 Wrng Low oil level B 482 Wrng High fuel supply pressure B 488 Wrng High intake manifold temp C 498 Wrng Oil level sensor C 499 Wrng Oil level sensor D 1443 Wrng Battery is dead B 1444 Wrng kW overload A 1449 Wrng AC output frequency high B 1451 Wrng Gen/Bus voltage differ C 1454 Wrng Gen CB position contact NA 1456 Wrng Bus out of range NA 1457 Wrng Fail to synchronize NA 1458 Wrng Phase rotation B 1462 Wrng High ground current C 1466 Wrng Modem failure C 1467 Wrng Unable to connect modem C 1468 Wrng Network error B 1471 Wrng High current
5 Operator’s Manual-PowerCommand Control 3200 Series Generator Sets Cummings Power Generation, 9-2001
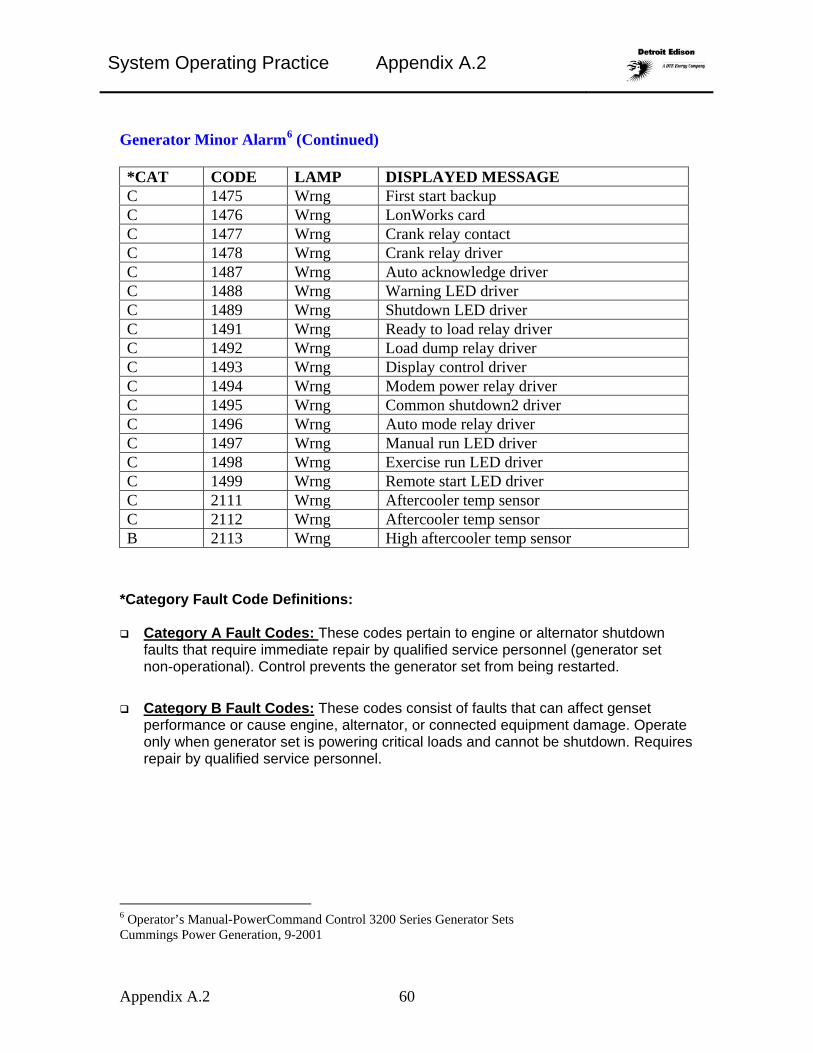
System Operating Practice Appendix A.2
Appendix A.2 60
Generator Minor Alarm6 (Continued) *CAT CODE LAMP DISPLAYED MESSAGE C 1475 Wrng First start backup C 1476 Wrng LonWorks card C 1477 Wrng Crank relay contact C 1478 Wrng Crank relay driver C 1487 Wrng Auto acknowledge driver C 1488 Wrng Warning LED driver C 1489 Wrng Shutdown LED driver C 1491 Wrng Ready to load relay driver C 1492 Wrng Load dump relay driver C 1493 Wrng Display control driver C 1494 Wrng Modem power relay driver C 1495 Wrng Common shutdown2 driver C 1496 Wrng Auto mode relay driver C 1497 Wrng Manual run LED driver C 1498 Wrng Exercise run LED driver C 1499 Wrng Remote start LED driver C 2111 Wrng Aftercooler temp sensor C 2112 Wrng Aftercooler temp sensor B 2113 Wrng High aftercooler temp sensor
*Category Fault Code Definitions:
Category A Fault Codes: These codes pertain to engine or alternator shutdown faults that require immediate repair by qualified service personnel (generator set non-operational). Control prevents the generator set from being restarted.
Category B Fault Codes: These codes consist of faults that can affect genset
performance or cause engine, alternator, or connected equipment damage. Operate only when generator set is powering critical loads and cannot be shutdown. Requires repair by qualified service personnel.
6 Operator’s Manual-PowerCommand Control 3200 Series Generator Sets Cummings Power Generation, 9-2001

System Operating Practice Appendix A.2
Appendix A.2 61
Generator Minor Alarm7 (Continued)
Category C Fault Codes: These codes consist of faults that do not affect the generator set performance but require qualified service personnel to repair. These codes indicate a defective sensor or harness, leaving no engine protection. (Engine damage can occur without detection.) Continued operation may void generator set warranty if damage occurs that relates to fault condition.
Category D Fault Codes: These codes consist of faults that are repairable by site
personnel. Qualified service personnel will repair Service if site personnel cannot resolve the problem after taking the corrective actions suggested in Appendix G.
Category NA Fault Codes: These codes consist of faults that are non-critical
operational status of generator set, external faults, or customer fault inputs. May require repair by qualified service personnel.
7 Operator’s Manual-PowerCommand Control 3200 Series Generator Sets Cummings Power Generation, 9-2001
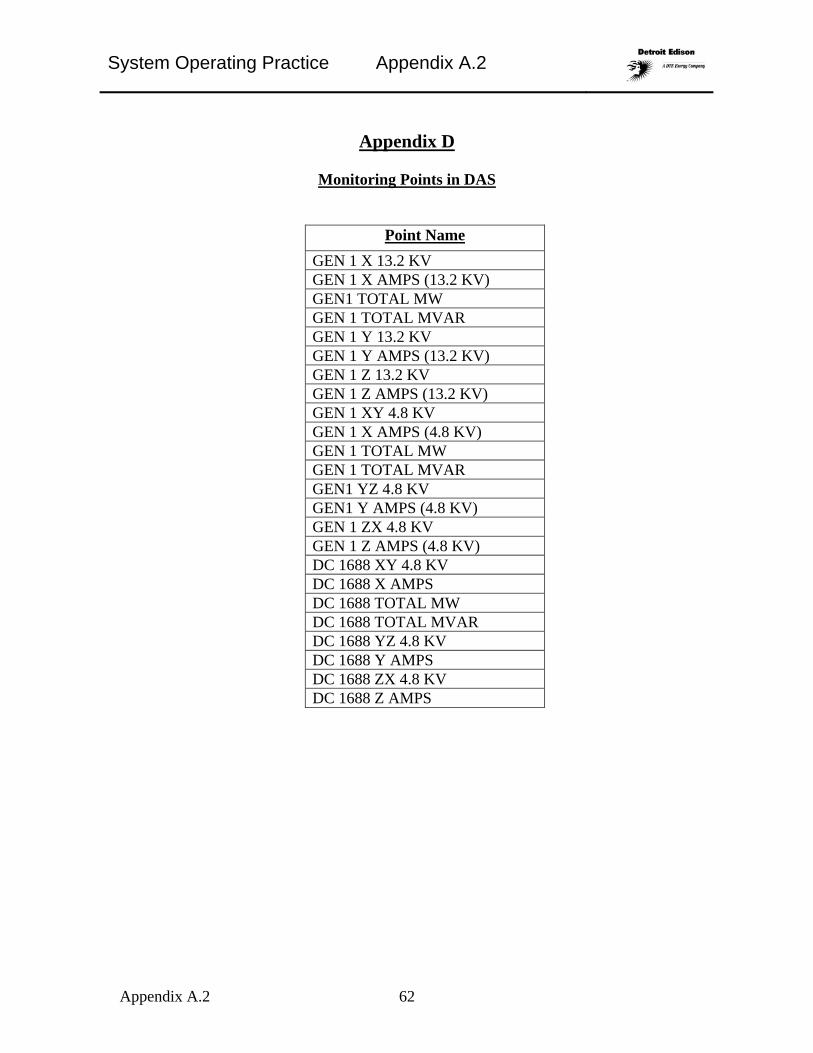
System Operating Practice Appendix A.2
Appendix A.2 62
Appendix D
Monitoring Points in DAS
Point Name
GEN 1 X 13.2 KV GEN 1 X AMPS (13.2 KV) GEN1 TOTAL MW GEN 1 TOTAL MVAR GEN 1 Y 13.2 KV GEN 1 Y AMPS (13.2 KV) GEN 1 Z 13.2 KV GEN 1 Z AMPS (13.2 KV) GEN 1 XY 4.8 KV GEN 1 X AMPS (4.8 KV) GEN 1 TOTAL MW GEN 1 TOTAL MVAR GEN1 YZ 4.8 KV GEN1 Y AMPS (4.8 KV) GEN 1 ZX 4.8 KV GEN 1 Z AMPS (4.8 KV) DC 1688 XY 4.8 KV DC 1688 X AMPS DC 1688 TOTAL MW DC 1688 TOTAL MVAR DC 1688 YZ 4.8 KV DC 1688 Y AMPS DC 1688 ZX 4.8 KV DC 1688 Z AMPS

System Operating Practice Appendix A.2
Appendix A.2 63
Appendix E
Alarm Points in DAS
Point Name
END ELEMENT LOSS OF AC GEN 1 BKR GEN 1 13.2 KV METER GEN 1 4.8 KV METER GEN 1 MAJOR ALARMGEN 1 MINOR ALARM STATION METER PERMISSIVE ON PERMISSIVE OFF BE1-32R BE1-81 GEN 1 TRIP UNUSABLE CLOSE

System Operating Practice Appendix A.2
Appendix A.2 64
Appendix F
Connection Diagram for Union Lake Generator
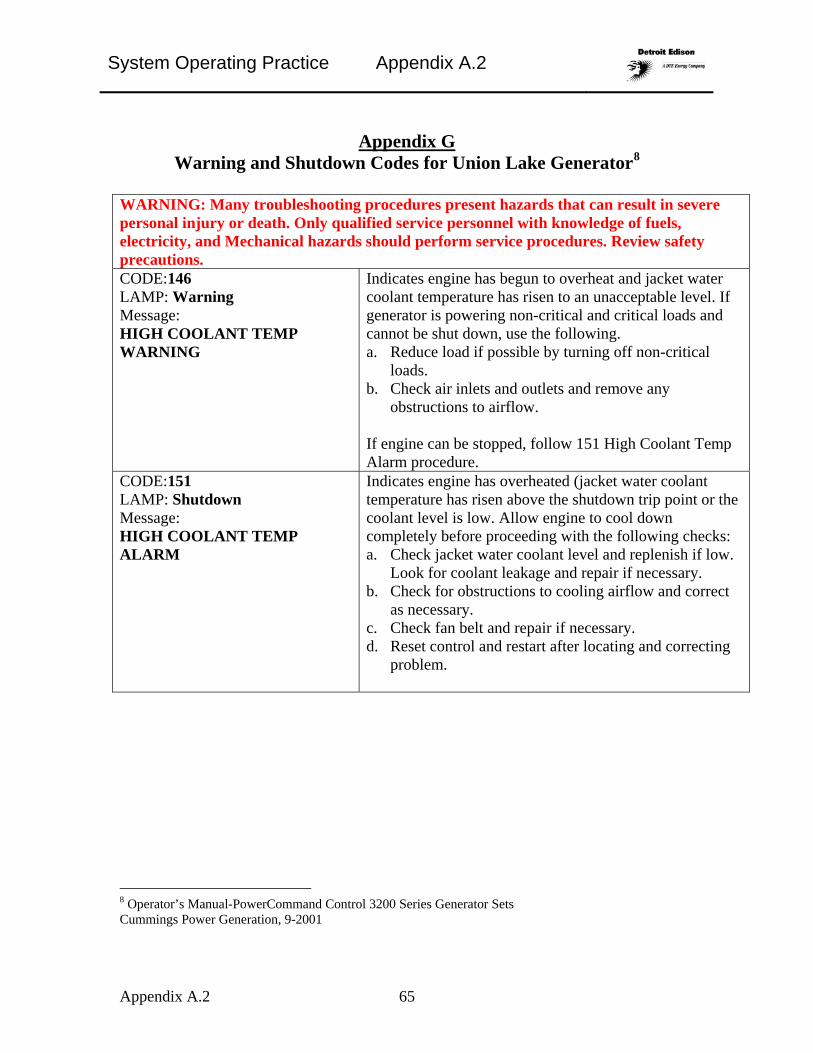
System Operating Practice Appendix A.2
Appendix A.2 65
Appendix G Warning and Shutdown Codes for Union Lake Generator8
WARNING: Many troubleshooting procedures present hazards that can result in severe personal injury or death. Only qualified service personnel with knowledge of fuels, electricity, and Mechanical hazards should perform service procedures. Review safety precautions. CODE:146 LAMP: Warning Message: HIGH COOLANT TEMP WARNING
Indicates engine has begun to overheat and jacket water coolant temperature has risen to an unacceptable level. If generator is powering non-critical and critical loads and cannot be shut down, use the following. a. Reduce load if possible by turning off non-critical
loads. b. Check air inlets and outlets and remove any
obstructions to airflow. If engine can be stopped, follow 151 High Coolant Temp Alarm procedure.
CODE:151 LAMP: Shutdown Message: HIGH COOLANT TEMP ALARM
Indicates engine has overheated (jacket water coolant temperature has risen above the shutdown trip point or the coolant level is low. Allow engine to cool down completely before proceeding with the following checks: a. Check jacket water coolant level and replenish if low.
Look for coolant leakage and repair if necessary. b. Check for obstructions to cooling airflow and correct
as necessary. c. Check fan belt and repair if necessary. d. Reset control and restart after locating and correcting
problem.
8 Operator’s Manual-PowerCommand Control 3200 Series Generator Sets Cummings Power Generation, 9-2001

System Operating Practice Appendix A.2
Appendix A.2 66
Warning and Shutdown Codes for Union Lake Generator9 (Continued)
WARNING: Many troubleshooting procedures present hazards that can result in severe personal injury or death. Only qualified service personnel with knowledge of fuels, electricity, and Mechanical hazards should perform service procedures. Review safety precautions. CODE:152 LAMP: Warning Message: LOW COOLANT TEMP
Indicates engine coolant heater is not operating or is not circulating coolant. Set is in standby mode but is not operating. Warning occurs when engine jacket water coolant temperature is 70 degrees F (21 degrees C) or lower. NOTE: In applications where the ambient temperature falls below 40 degrees F (4 degrees C), Low Coolant Temp may be indicated even though the coolant heaters are operating. Check for the following conditions: a. Coolant heater not connected to power supply. Check
for blown fuse or disconnected heater cord and correct as required.
b. Check for low jacket water coolant level and replenish if required. Look for possible coolant leakage points and repair as required.
CODE:197 LAMP: Warning Message: COOLANT LEVEL WARNING
Indicates engine jacket water coolant level has fallen to an unacceptable level. If generator is powering critical loads and cannot be shut down, wait until next shutdown period, then follow 235 Coolant Level Alarm procedure. If engine can be stopped, follow 235 procedure.
9 Operator’s Manual-PowerCommand Control 3200 Series Generator Sets Cummings Power Generation, 9-2001

System Operating Practice Appendix A.2
Appendix A.2 67
Warning and Shutdown Codes for Union Lake Generator10 (Continued)
WARNING: Many troubleshooting procedures present hazards that can result in severe personal injury or death. Only qualified service personnel with knowledge of fuels, electricity, and Mechanical hazards should perform service procedures. Review safety precautions. CODE:359 LAMP: Warning Message: ENGINE FAILED TO START
Indicates possible fault with control or starting system. Check for the following conditions: a. Poor battery cable connections. Clean the battery cable
terminals and tighten all connections. b. Discharged or defective battery. Recharge or replace
the battery.
CODE:441 LAMP: Warning Message: LOW BATTERY VOLTAGE
Indicates battery voltage is below 24 VDC. a. Discharged or defective battery. Check the battery
charge fuse. Recharge or replace the battery. b. Poor battery cable connections. Clean the battery cable
terminals and tighten all connections. c. Check engine DC alternator. Replace engine DC
alternator if normal battery charging voltage (24 to 26 VDC) is not obtained.
d. Check float level if applicable (raise float level)
CODE:471 LAMP: Warning Message: LOW OIL LEVEL
Indicates engine oil has dropped to an unacceptable level. If generator is powering critical loads and cannot be shut down, wait until next shutdown period, then follow 253 Oil Level Alarm procedure. If engine can be stopped follow 253 procedure.
CODE:611 LAMP: Warning Message: ENGINE HOT
a. Indicates that engine hot shut down has occurred (cool-down timers were bypassed). This condition will occur when the engine coolant temperature is above the normal operating level and the operator presses the Emergency Switch or moves the 0/Manual/Auto switch to 0 (Off) position. This type of shutdown should be avoided. Can cause possible loss of performance and engine damage.
10 Operator’s Manual-PowerCommand Control 3200 Series Generator Sets Cummings Power Generation, 9-2001

System Operating Practice Appendix A.2
Appendix A.2 68
Warning and Shutdown Codes for Union Lake Generator11 (Continued)
WARNING: Many troubleshooting procedures present hazards that can result in severe personal injury or death. Only qualified service personnel with knowledge of fuels, electricity, and Mechanical hazards should perform service procedures. Review safety precautions. CODE:253 LAMP: Shutdown Message: OIL LEVEL ALARM
Indicates engine oil level has dropped below the shutdown trip point. Check oil level, lines and filters. If oil system OK but oil level is low, replenish. Reset control and restart
CODE:326 LAMP: Warning Message: OIL LEVEL WARNING
Indicates that the engine oil level has exceeded the warning trip point for high oil level. If generator is powering critical loads and cannot be shut down, wait until next shutdown period, then follow 688 High Oil Level Alarm procedure. If engine can be stopped follow 688 procedure.
CODE:688 LAMP: Warning Message: HIGH OIL LEVEL ALARM
Indicates that the engine oil level has exceeded the alarm trip point for high oil level. Check oil level. Drain oil to operating level.
CODE:235 LAMP: Shutdown Message: COOLANT LEVEL ALARM
Indicates engine jacket water coolant level has fallen below the alarm trip point. Allow engine to cool down completely before proceeding. a. Check jacket water coolant level and replenish if low.
Look for possible coolant leakage points and repair if necessary.
b. Reset control and restart after locating and correcting problem.
CODE:1311 through 1318 LAMP: Shutdown/Warning Message: Customer Defined Fault
When any one of these customer-defined inputs is detected by the control, the corresponding fault message is displayed. The nature of the fault is an optional customer selection. These fault functions can be programmed to initiate a shutdown or warning as indicated by the Warning or Shutdown lamp. Note: Customer fault messages are editable. The message displayed for the code shown (1311 through 1318) is determined by the customer.
11 Operator’s Manual-PowerCommand Control 3200 Series Generator Sets Cummings Power Generation, 9-2001

System Operating Practice Appendix A.2
Appendix A.2 69
Warning and Shutdown Codes for Union Lake Generator12 (Continued)
WARNING: Many troubleshooting procedures present hazards that can result in severe personal injury or death. Only qualified service personnel with knowledge of fuels, electricity, and Mechanical hazards should perform service procedures. Review safety precautions. CODE:1416 LAMP: Warning Message: FAIL TO SHUTDOWN
Status- indicates that the “Fault Bypass” mode is enabled. Service personnel for troubleshooting purposes primarily use this mode. In this mode the generator set ignores the majority of system shutdown faults.
CODE:1417 LAMP: Warning Message: POWER DOWN ERROR
Indicates that the control can not power down due to some unknown condition. Possible drain on battery. Contact an authorized service center for service.
CODE:1433/1434 LAMP: Shutdown Message: EMERGENCY STOP – LOCAL/ EMERGENCY STOP - REMOTE
Indicates local or remote Emergency Stop. Emergency Stop shutdown status can be reset only at the local control panel. To reset the local/remote Emergency Stop button: • Pull the button out. • Move the O/Manual/Auto switch to O (off). • Press the front panel Fault Acknowledge button. • Select Manual or Auto, as required.
CODE:1438 LAMP: Warning Message: FAIL TO CRANK
Indicates possible fault with control or starting system. Check for the following conditions. a. Poor battery cable connections. Clean the battery cable
terminals and tighten all connections. b. Discharged or defective battery. Recharge or replace
the battery.
CODE:1439 LAMP: Warning Message: FUEL LEVEL LOW IN DAY
Indicates fuel supply is running low. Check fuel supply and replenish as required.
12 Operator’s Manual-PowerCommand Control 3200 Series Generator Sets Cummings Power Generation, 9-2001

System Operating Practice Appendix A.2
Appendix A.2 70
Warning and Shutdown Codes for Union Lake Generator13 (Continued)
WARNING: Many troubleshooting procedures present hazards that can result in severe personal injury or death. Only qualified service personnel with knowledge of fuels, electricity, and Mechanical hazards should perform service procedures. Review safety precautions. CODE:1441 LAMP: Warning Message: FUEL LEVEL LOW IN MAIN
Indicates fuel supply is running low. Check fuel supply and replenish as required.
CODE:1442 LAMP: Warning Message: BATTERY IS WEAK
Indicates battery voltage drops below 14.4 volts for two seconds, during starting. Discharged or defective battery. See Warning message 441 Low Battery Voltage.
CODE:1443 LAMP: Warning Message: BATTERY IS DEAD
Indicates battery has dropped below genset operating range (3.5 volts when cranking) to power the starter and the control circuitry. See Warning message 441 Low Battery Voltage.
13 Operator’s Manual-PowerCommand Control 3200 Series Generator Sets Cummings Power Generation, 9-2001

System Operating Practice Appendix A.2
Appendix A.2 71
Appendix H
DMS Displays

System Operating Practice Appendix A.2
Appendix A.2 72
Appendix H
DMS Displays (Continued)
Phase I Final Report for DE-FC36-03CH11161
Page 73
D|TECH SOC OPERATOR LOG ENTRIES This is a list of the types of entries an operator should consider for entry in the daily log. It is not all inclusive and certainly any significant event or information would be helpful. Logging can be a significant source of data to aid in the reconstruction or analysis of a given situation, it is better to include too much information than not enough.
1. Unit trips: include approximate time (exact if known), cause if known, any other data relative to the incident such as ETR (Estimated Time of Repair/Return to Service) severe weather conditions, etc.
2. Operating notes peculiar to a specific unit’s or site’s idiosyncrasies.
3. DEM (Distributed Energy Manager) dispatch requests such as start/stop and unit load
changes. When practical, confirm the name and callback phone number of the person initiating the request.
4. Special instructions for the Dispatchers such as priorities, potential hazards, site entrance
requirements, severe weather, etc.
5. Communications disruptions, problems, errors, failures, etc.
6. SOC Customer trouble and incident calls and time Dispatch is notified, log the time the dispatch was made by the Dispatcher. Log the time the technician arrives at the site and the time the technician leaves the site.
7. Follow up information.
8. Manual Unit shutdowns (Normal or Emergency) and related information.
9. Any other comments or information the Operator thinks will be useful or of interest for future
reference. Abbreviations if used should be expanded at least once in parenthesis.Similarly, the Operator making the entry should enter at least the first name initial and last name. rather than using initials because the potential for confusion does exist. Log entry times should be the actual time (SOC using the 24 hour clock) you made the entry and the time (the local time at the site) of the event is then included in the events/data portion of the log. These logs are on the server and may be read by many different levels of the Company so a narrative style similar to normal speech is a good approach. Accuracy is MOST important. We will have 1 log created per day and each entry is to have at least the 1st initial and last name of the operator making that entry. At the end of the day the log will be saved to the hard drive and at least 1 hard copy printed and placed in the appropriate log binder.

Phase I Final Report for DE-FC36-03CH11161
Page 74
Appendix B - Circuit & DER 1-Line Diagrams & Pictures

Phase I Final Report for DE-FC36-03CH11161
Page 75
Location of DER Sites

Phase I Final Report for DE-FC36-03CH11161
Page 76
Adair substation has an ENI 1000, which is a 1MW natural gas Deutz generator. The generator is owned by Detroit Edison and feeds into the Adair 4.8 kV distribution circuit DC 322.
1 MW Nat. Gas
Substatio

Phase I Final Report for DE-FC36-03CH11161
Page 77
Farmington’s 75kW ENI 75 natural gas internal combustion generator, which is located internal to DC 9016 and fed out of the Sunset substation.
75 KW Nat. Gas
Substatio
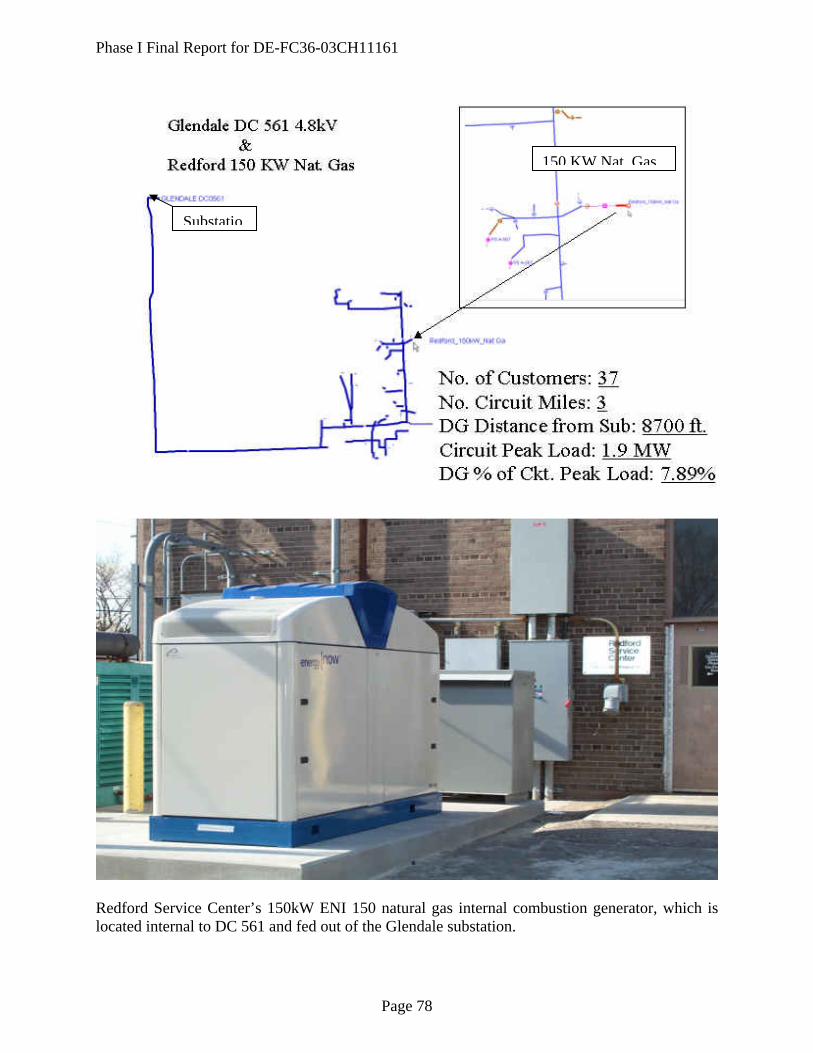
Phase I Final Report for DE-FC36-03CH11161
Page 78
Redford Service Center’s 150kW ENI 150 natural gas internal combustion generator, which is located internal to DC 561 and fed out of the Glendale substation.
150 KW Nat. Gas
Substatio

Phase I Final Report for DE-FC36-03CH11161
Page 79
Southfield’s 26kW Siemens Solar, which is located internal to Distribution Circuit 9010 fed out of the Southfield substation.
26 KW
Substatio

Phase I Final Report for DE-FC36-03CH11161
Page 80
ZBB/SANDIA 200kW Flow Battery, which is located internal to the 4.8kV delta DC 2628 fed out of a pole, mounted at the substation STDF4 (Sub Transmission Pole Mounted Distribution Facility) in Lum, MI.
200 KW DG
Substatio

Phase I Final Report for DE-FC36-03CH11161
Page 81
Union Lake Substation has an ENR 2000, which is a modified Cummins 2 MW diesel. The Generator is owned by Detroit Edison and feeds into a 4.8 kV distribution circuit DC 1688 for peak shaving to relieve an exit cable overload. The generator control protocol, Lonworks, is linked via fiber into a portable ACM. The generator automatically turns on; load follows and turns off to manage the loading below the circuit exit cable.
2 MW Diesel
Substatio
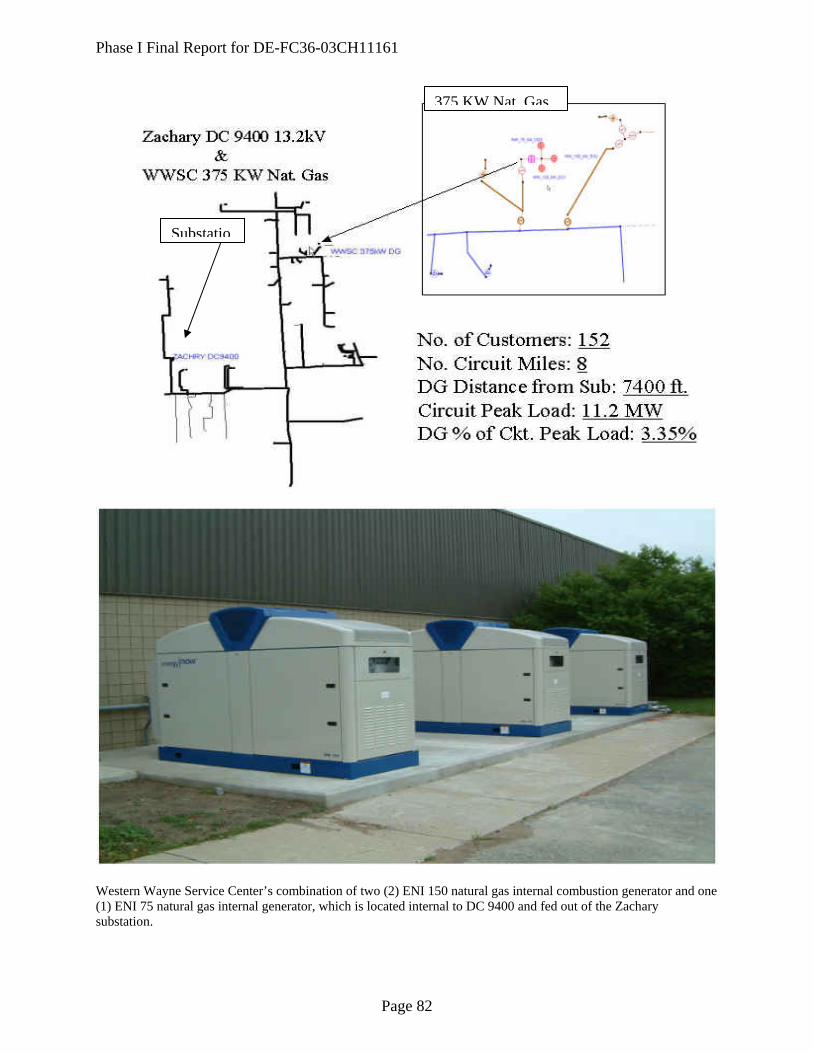
Phase I Final Report for DE-FC36-03CH11161
Page 82
Western Wayne Service Center’s combination of two (2) ENI 150 natural gas internal combustion generator and one (1) ENI 75 natural gas internal generator, which is located internal to DC 9400 and fed out of the Zachary substation.
375 KW Nat. Gas
Substatio
Phase I Final Report for DE-FC36-03CH11161
Page 83
Appendix C – DER Process Book Displays

Phase I Final Report for DE-FC36-03CH11161
Page 84
PI – Process Book
PI – Process Book was used to set up interactive monitoring and control for the Detroit Edison ROC system operators. The DG PI process book is an icon located on the operator’s desktop. Time did not permit the integration into our current DMS system, which is scheduled to be replaced in 2005.
By opening the DER (DG) General Display the following screen appears.

Phase I Final Report for DE-FC36-03CH11161
Page 85
COMM STAT: is the status of the ICCP links to both Detroit Edison’s (DTE) System Operating Center and for DTECH SOC. DEW Recommendation: is given for kW, kVARS, and action needed by the Detroit Edison’s SOC operators. Circuit Name: these buttons are the Phase I Detroit Edison circuits that the DERs for Phase I are located on. Actual State: give both the status of the generator (on/off) as well as the kW output for that DER. Contacts and SOP: button provides a quick reference link for the Detroit Edison ROC operators to the DER contact information, as well as the tagging and operating procedures developed as part of this project as well as the our internal System Operating Procedures (SOP) developed for those DERs over 1MW or larger. By clicking each of the circuit buttons you can bring up the following depiction of the Detroit Edison distribution circuit (DC) configuration and start of circuit phase voltages, on a 120-volt base, and the phase currents in amps.

Phase I Final Report for DE-FC36-03CH11161
Page 86
ADAIR DER on Adair DC 322 - 4.8kV Delta System.
The above figure shows a one-line diagram of the Detroit Edison SCADA data and of the DER, for the aggregator DER SOC data. The DEW recommendation of level is also shown on the one line diagram. COMM STAT, Contacts and SOP: buttons are the same links that appear on the previous page. Control Information: as described in the tagging and operating procedures has two states.
Not controllable: the customer has control and the unit is not open to the utility control. The Off and On buttons are not visible in this state. Controllable: the customer via the aggregator has turned over control to the utility. The Off and On buttons are now visible after the operating procedures are followed.
PI process book has a graph feature enabling the operator to review operation of the DER. In the following graph we can review the round trip time for Farmington DER to respond to a Detroit Edison operator control signal to shut off. This process consumed a total of two (2) minutes and eighteen (18) seconds.
Phase Current
Phase Voltage

Phase I Final Report for DE-FC36-03CH11161
Page 87
The following are the remaining displays of the Detroit Edison distribution circuits that were used for the Phase I project. The PI –ProcessBook window exhibits the circuit configuration and start of circuit phase voltages, on a 120-volt base, and the phase currents in amps.

Phase I Final Report for DE-FC36-03CH11161
Page 88
Farmington DER on Sunset DC 9016 - 13.2kV System.
Lum DER on STDF4 DC 2628 – 4.8kV Delta System.

Phase I Final Report for DE-FC36-03CH11161
Page 89
Redford DER on Glendale DC 561 – 4.8kV Delta System.
Southfield DER on Southfield DC 9010 – 13.2kV System.

Phase I Final Report for DE-FC36-03CH11161
Page 90
Union Lake DER on Union Lake DC 1688 – 4.8kV Delta System.
Western Wayne DER on Zachary DC 9400 – 13.2kV System.

Phase I Final Report for DE-FC36-03CH11161
Page 91
Appendix D - DEW Examples Outputs of DER Control Algorithm

Phase I Final Report for DE-FC36-03CH11161
Page 92
Example DG Control Calculations Consider the circuit depicted in Figure 2. The circuit is a 13.2 kV grounded circuit and includes a 495 kW synchronous DG placed at the location indicated in the figure. Initially the circuit has no operational problems. Therefore, initially no power is generated by the DG. It is assumed that the minimum generation level for the DG is 30% and a circuit voltage is considered as an under voltage if it falls below 95% of its nominal value.
495 kW DG
Location 2
Location 1
13.2 kV Substation
Figure 2. Circuit for Example Control Calculations
Table 1 shows power flow results for the circuit of Figure 2. Note from the report that there are currently no under voltaged or overloaded components in the circuit.

Phase I Final Report for DE-FC36-03CH11161
Page 93
Table 1 Power Flow Analysis Results for Circuit Shown in Figure 2 with No Operational
Problems and with DG Turned Off ============================= R e s u l t s S u m m a r y ============================= Description ========================== ====== AMP Flow At Start of Ckt A: 304.1 B: 308.0 C: 314.1 Substation TR % Loading 90.7 # of Undervoltaged Cmps 0 # of Overloaded Cmps 0 Worst % Voltage in Ckt 101.97 Worst % Loading in Ckt 96.8 KW Gen at DG Site 0.0 KVAR Gen at DG Site 0.0
==================================================================== L o c a t i o n W i t h W o r s t % V o l t a g e L e v e l ==================================================================== Nominal |-Pflow Cust Volt -| Local Name Loc X Loc Y Cust Volt A B C %Volt ==================== ======== ======== ========= ====== ====== ====== ====== 2-PECX3 2241391 270977 120.00 123.02 123.90 122.36 101.97 ===================================================================== L o c a t i o n W i t h W o r s t % L o a d i n g L e v e l ===================================================================== Nom. Rated |---- Pflow AMP ---| Local Name Loc X Loc Y Volt(kV) AMP A B C %Loading ==================== ======== ======== ========= ======= ====== ====== ====== ====== iPS_M188 2241287 270976 7.96 Ln 80.0 77.1 76.9 77.5 96.82
Next three scenarios will considered. In each scenario a condition will be introduced into the circuit of Figure 2 that will cause operational problems. The DG Control application will then be employed to determine the generation levels at which the DG is to be operated for solving the problem created. Output report results from the DG Control application are presented.

Phase I Final Report for DE-FC36-03CH11161
Page 94
Scenario 1: Overload Problem At Location 1 In this scenario a conductor that is too small is inserted at Location 1 shown in Figure 2. The conductor selected creates an overload condition. The DG Control application is then run to determine the minimum DG set point (i.e., kW and kVAR generation) to eliminate the overload problem. A portion of the output report from the DG Control application is shown in Table 2. The report shows that by selecting a generation level of 307 kW, 63 kVar, the overload is eliminated. Table 2 Output Report Results from DG Control Application for Overload at Location 1 of
Circuit Shown in Figure 2 ============================= R e s u l t s S u m m a r y ============================= Description BEFORE AFTER ========================== ====== ====== AMP Flow At Start of Ckt A: 304.1 290.8 B: 308.0 294.8 C: 314.1 300.8 Substation TR % Loading 90.7 86.8 # of Undervoltaged Cmps 0 0 # of Overloaded Cmps 1 0 <-- OVERLOAD problem REMOVED... Worst % Voltage in Ckt 101.78 101.91 Worst % Loading in Ckt 122.4 99.8 KW Gen at DG Site 0.0 307.0 <-- Min KW = 148.5, Max KW = 495.1 KVAR Gen at DG Site 0.0 63.0 ======================================================================= L o c a t i o n s W i t h W o r s t % V o l t a g e L e v e l s ======================================================================= Nominal |-Pflow Cust Volt -| Local Name Loc X Loc Y Cust Volt A B C %Volt ================= ======== ======== ========= ====== ====== ====== ====== BEFORE: 2-PECX3 2241391 270977 120.00 122.81 123.68 122.14 101.78 AFTER: 2-PECX3 2241391 270977 120.00 123.01 123.82 122.29 101.91 ======================================================================== L o c a t i o n s W i t h W o r s t % L o a d i n g L e v e l s ======================================================================== Nom. Rated |---- Pflow AMP ---| Local Name Loc X Loc Y Volt(kV) AMP A B C %Loading ========== ======== ======== ========= ======= ====== ====== ====== ====== BEFORE: Loc1 2240440 272379 7.96 Ln 57.5 67.3 68.7 70.4 122.43 AFTER: Loc1 2240440 272379 7.96 Ln 57.5 54.3 55.7 57.4 99.78 KW and KVAR Generation at DG Site: ================================== |----- P (KW) -----| |---- Q (KVAR -----| KVA A B C A B C Gen ====== ====== ====== ====== ====== ====== ===== Measured P-Q Gen BEFORE: 0.0 0.0 0.0 0.0 0.0 0.0 0% Recommended P-Q Gen AFTER : 102.3 102.3 102.3 21.0 21.0 21.0 62%

Phase I Final Report for DE-FC36-03CH11161
Page 95
Scenario 2: Undervoltage Problem at Location 2 In this scenario the sizes and lengths of the conductors between location 1 and 2 shown in Figure 2 are changed so that larger voltage drops occur due to smaller and longer conductors, resulting in under voltages on the components around Location 2. The DG Control application is run to solve the problem. The output report from the DG Control application is shown in Table 3. The report shows that by selecting a generation level of 148.5 kW, 36 kVar, the undervoltages are eliminated.
Table 3 Output Report Results from DG Control Application for Undervoltages at Location 2 of Circuit Shown in Figure 2
============================= R e s u l t s S u m m a r y ============================= Desc BEFORE AFTER ========================== ====== ====== AMP Flow At Start of Ckt A: 304.1 297.5 B: 308.1 301.5 C: 314.1 307.5 Substation TR % Loading 90.7 88.7 # of Undervoltaged Cmps 4 0 <-- UNDERVOLTAGE problem REMOVED... # of Overloaded Cmps 0 0 Worst % Voltage in Ckt 94.91 95.14 Worst % Loading in Ckt 96.8 96.8 KW Gen at DG Site 0.0 148.5 <-- Min KW = 148.5, Max KW = 495.1 KVAR Gen at DG Site 0.0 36.0 ======================================================================= L o c a t i o n s W i t h W o r s t % V o l t a g e L e v e l s ======================================================================= Nominal |-Pflow Cust Volt -| Local Name Loc X Loc Y Cust Volt A B C %Volt ========== ======== ======== ========= ====== ====== ====== ====== BEFORE: 2-PECX3 2241391 270977 120.00 114.63 115.67 113.89 94.91 AFTER: 2-PECX3 2241391 270977 120.00 114.93 115.93 114.17 95.14 ======================================================================== L o c a t i o n s W i t h W o r s t % L o a d i n g L e v e l s ======================================================================== Nom. Rated |---- Pflow AMP ---| Local Name Loc X Loc Y Volt(kV) AMP A B C %Lding ========== ======== ======== ========= ======= ====== ====== ====== ====== BEFORE: iPS_M188 2241287 270976 7.96 Ln 80.0 77.1 76.9 77.4 96.80 AFTER: iPS_M188 2241287 270976 7.96 Ln 80.0 77.1 76.9 77.4 96.80 KW and KVAR Generation at DG Site: ================================== |----- P (KW) -----| |---- Q (KVAR -----| KVA A B C A B C Gen ====== ====== ====== ====== ====== ====== ===== Measured P-Q Gen BEFORE: 0.0 0.0 0.0 0.0 0.0 0.0 0% Recommended P-Q Gen AFTER : 49.5 49.5 49.5 12.0 12.0 12.0 30%

Phase I Final Report for DE-FC36-03CH11161
Page 96
Scenario 3: Overload at Location 1 and Undervoltage at Location 2 In this scenario the conductors between locations 1 and 2 are made smaller such that both overload and a low voltage problems are created. The DG Control application is run to solve the problem. The output report from the DG Control application is shown in Table 4. The report shows that by selecting a generation level of 307 kW, 63 kVar, both the overload and undervoltage problems are eliminated.
Table 4 Output Report Results from DG Control Application for Overload at Location 1 and Undervoltage at Location 2 of Circuit Shown in Figure 2
============================= R e s u l t s S u m m a r y ============================= Desc BEFORE AFTER ========================== ====== ====== AMP Flow At Start of Ckt A: 304.1 290.6 B: 308.1 294.7 C: 314.1 300.6 Substation TR % Loading 90.7 86.7 # of Undervoltaged Cmps 1 0 <-- UNDERVOLTAGE problem REMOVED... # of Overloaded Cmps 1 0 <-- OVERLOAD problem REMOVED... Worst % Voltage in Ckt 94.97 95.43 Worst % Loading in Ckt 122.8 99.8 KW Gen at DG Site 0.0 307.0 <-- Min KW = 148.5, Max KW = 495.1 KVAR Gen at DG Site 0.0 63.0 ======================================================================= L o c a t i o n s W i t h W o r s t % V o l t a g e L e v e l s ======================================================================= Nominal |-Pflow Cust Volt -| Local Name Loc X Loc Y Cust Volt A B C %Volt ========== ======== ======== ========= ====== ====== ====== ====== BEFORE: 2-PECX3 2241391 270977 120.00 114.72 115.72 113.97 94.97 AFTER: 2-PECX3 2241391 270977 120.00 115.32 116.25 114.51 95.43 ======================================================================== L o c a t i o n s W i t h W o r s t % L o a d i n g L e v e l s ======================================================================== Nom. Rated |---- Pflow AMP ---| Local Name Loc X Loc Y Volt(kV) AMP A B C %Lding ========== ======== ======== ========= ======= ====== ====== ====== ====== BEFORE: Loc1 2240440 272379 7.96 Ln 57.5 67.6 69.0 70.6 122.84 AFTER: Loc1 2240440 272379 7.96 Ln 57.5 54.3 55.7 57.4 99.82 KW and KVAR Generation at DG Site: ================================== |----- P (KW) -----| |---- Q (KVAR -----| KVA A B C A B C Gen ====== ====== ====== ====== ====== ====== ===== Measured P-Q Gen BEFORE: 0.0 0.0 0.0 0.0 0.0 0.0 0% Recommended P-Q Gen AFTER : 102.3 102.3 102.3 21.0 21.0 21.0 62%