pharma & medtech commercial compliance
TRANSCRIPT
Copyright WorldDataOnline LLC 2016
Pharma & MedtechCommercial Compliance
54 Companies pay >$2,500 to Individual Californian Docs
Av. Food & Bev payment now $24
Pharma eradicates Entertainment
Gulf widens between pharma. & medtech payments
OverviewData relates to the latest 2015 Open Payments - General File.
Outputs concentrate on:
National year-on-year summary of Open Payment changes
National fair market rates
Food & Beverage >$1,500 in California
Top companies by expenditure by ToV* payment category
Average payment values for top companies in each category
* Transfer of Value Payments – see definition slide

National year-on-year summary of Open Payment data changes
Total payments are effectively the same from 2014 - 2015 at $7.47B v $7.52B
Number of physicians receiving a payment is static YoY at 618,000
Total number of records published has shows no growth at 11.9M
Average payment received by physicians (total payments/no. physicians receiving payment) has no differential at $12,120 in 2014 against $12,168 in 2015
Only real change is in the number of companies reporting under the Physician Payments Sunshine Act– which has seen a decrease by 8% to 1456
For additional insight by specific company and/or brand please email [email protected] or visit here
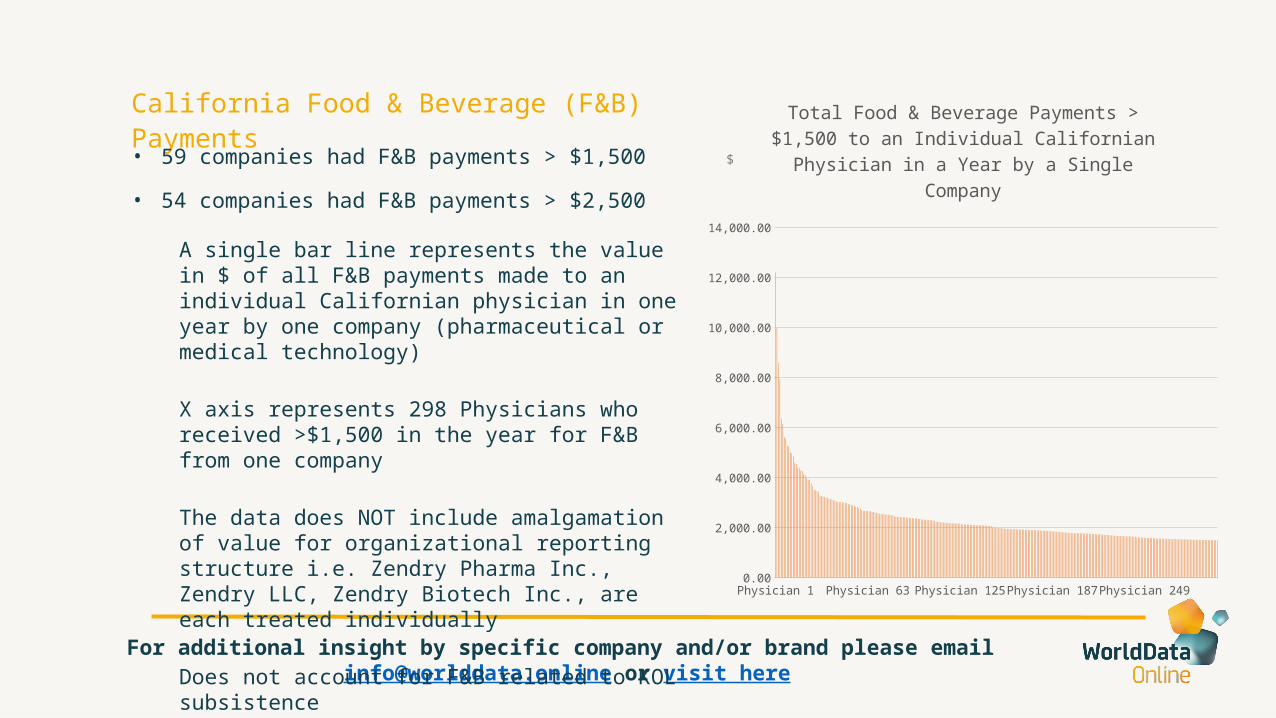
California Food & Beverage (F&B) Payments
• 59 companies had F&B payments > $1,500
• 54 companies had F&B payments > $2,500
A single bar line represents the value in $ of all F&B payments made to an individual Californian physician in one year by one company (pharmaceutical or medical technology)
X axis represents 298 Physicians who received >$1,500 in the year for F&B from one company
The data does NOT include amalgamation of value for organizational reporting structure i.e. Zendry Pharma Inc., Zendry LLC, Zendry Biotech Inc., are each treated individually
Does not account for F&B related to KOL subsistence Physician 1 Physician 44 Physician 87 Physician 130Physician 173Physician 216Physician 2590.00
2,000.00
4,000.00
6,000.00
8,000.00
10,000.00
12,000.00
14,000.00
Total Food & Beverage Payments > $1,500 to an Individual Californian Physician in a Year by a
Single Company$
For additional insight by specific company and/or brand please email [email protected] or visit here
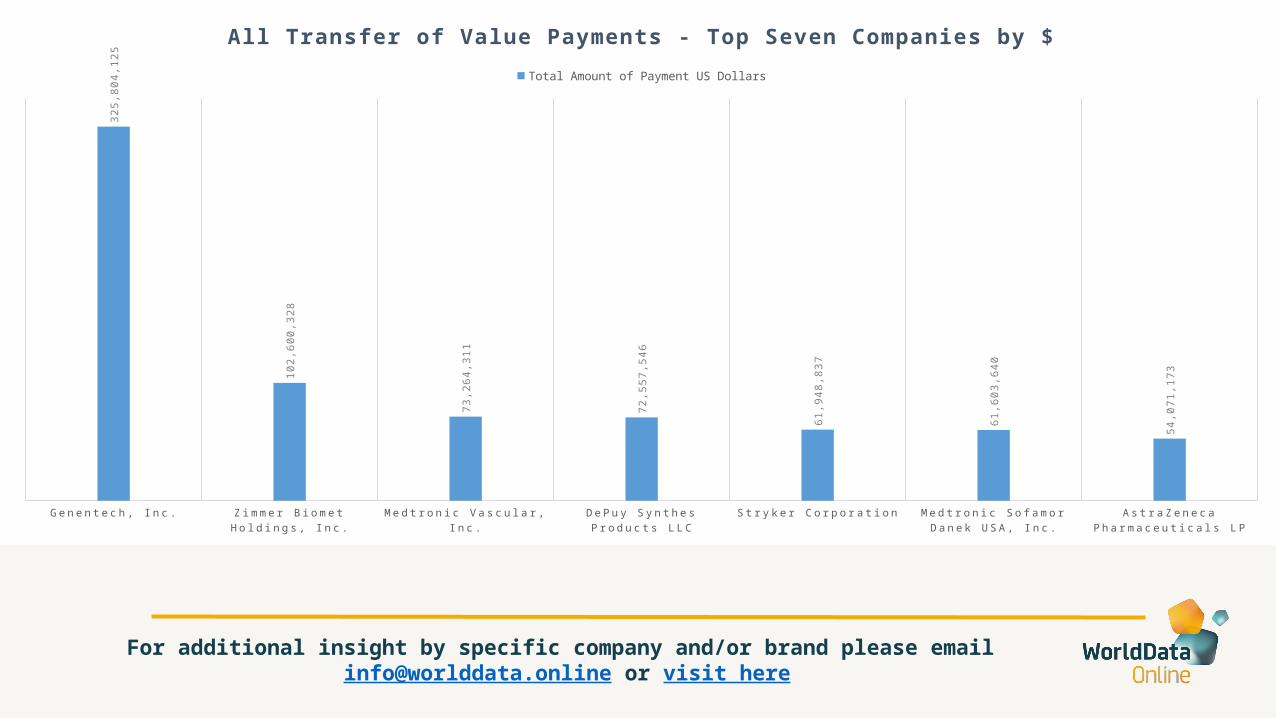
Genen tech , I
n c .
Z imme r B
iom e t H
o ldin
g s , In c .
Me d t r on i c V
a s cu l ar ,
Inc .
DeP uy Sy n th
e s Pr o
du c ts LLC
S t r yke r C
o r po r a
t i on
Me d tr on ic S
o fam o r D
a ne k USA , I
n c .
A s t r aZ e ne ca P
ha rma ce u t i c
a l s L P
325,
804,
125
102,
600,
328
73,2
64,3
11
72,5
57,5
46
61,9
48,8
37
61,6
03,6
40
54,0
71,1
73
All Transfer of Value Payments - Top Seven Companies by $Total Amount of Payment US Dollars
For additional insight by specific company and/or brand please email [email protected] or visit here
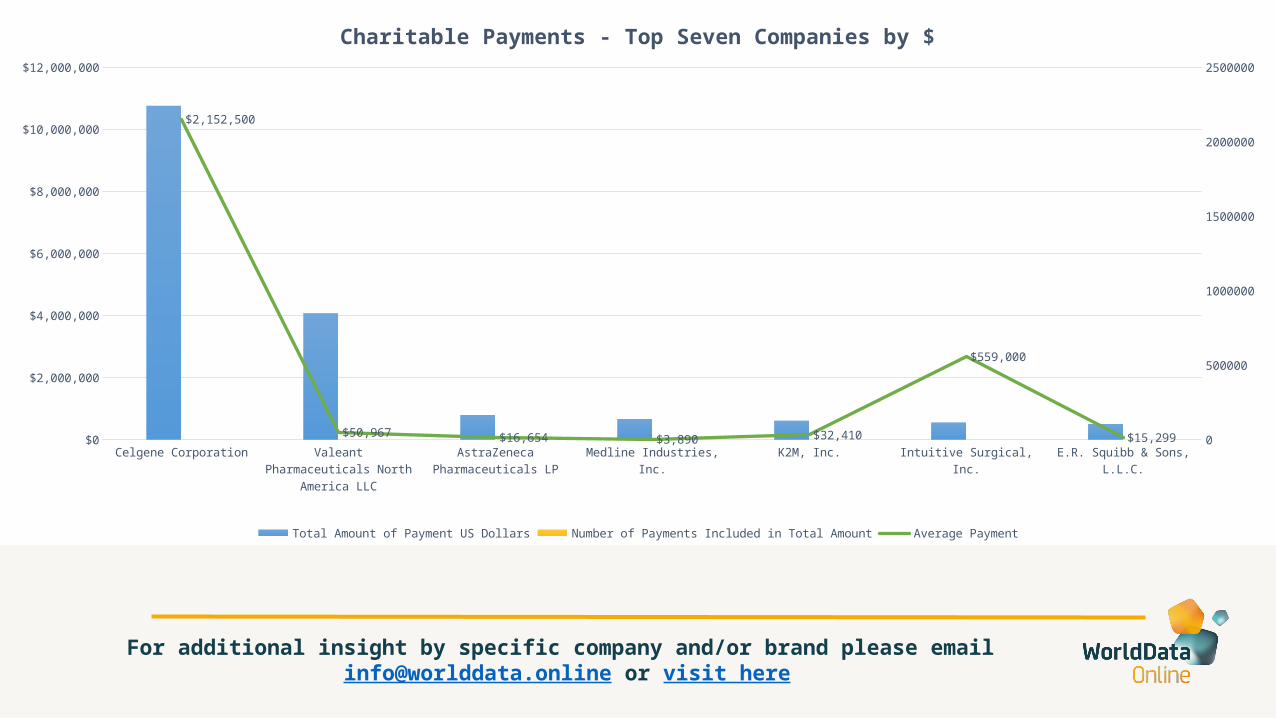
Celge
ne Corp
oratio
n
Valea
nt Ph
armace
uticals
North Am
erica
LLC
AstraZ
eneca
Pharm
aceuti
cals L
P
Medline
Indu
stries
, Inc.
K2M, In
c.
Intuit
ive Su
rgical
, Inc.
E.R. S
quibb
& Sons, L
.L.C.
$0
$2,000,000
$4,000,000
$6,000,000
$8,000,000
$10,000,000
$12,000,000
0
500000
1000000
1500000
2000000
2500000
$2,152,500
$50,967 $16,654 $3,890 $32,410
$559,000
$15,299
Charitable Payments - Top Seven Companies by $
Total Amount of Payment US Dollars Number of Payments Included in Total Amount Average Payment
For additional insight by specific company and/or brand please email [email protected] or visit here
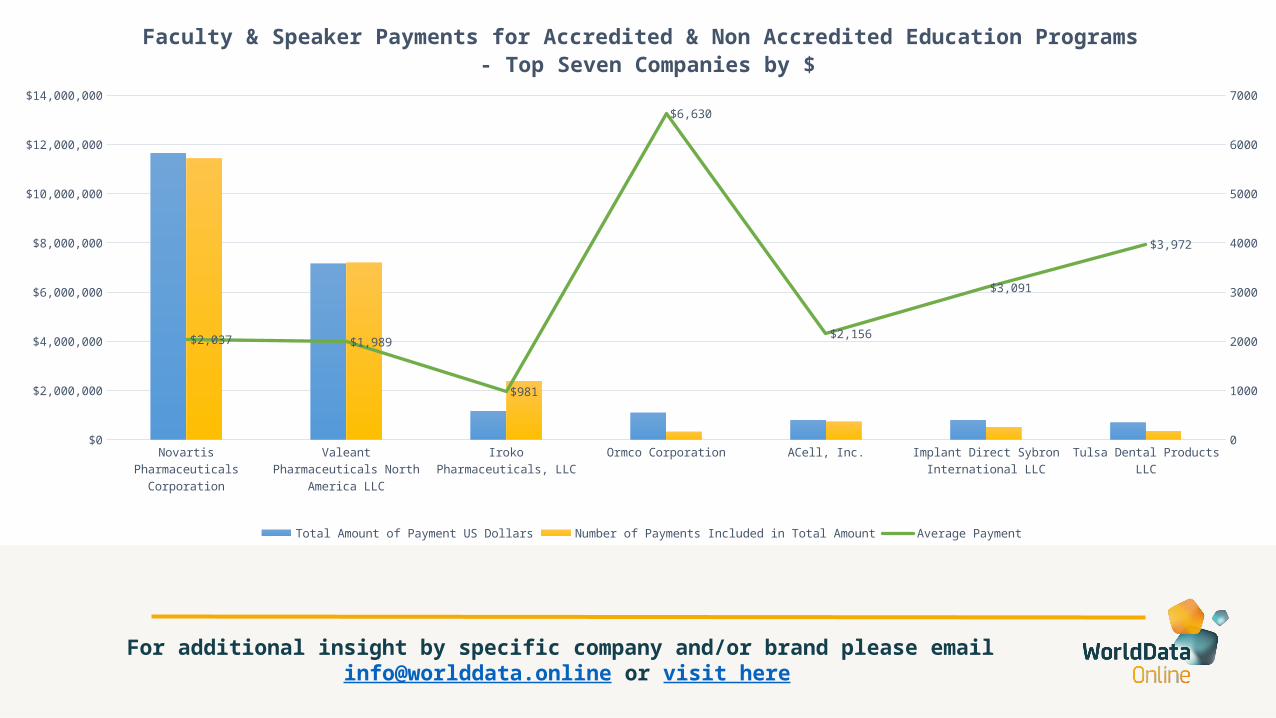
Novartis Pharmaceu-ticals Corporation
Valeant Pharmaceuticals North America LLC
Iroko Pharmaceuticals, LLC
Ormco Corporation ACell, Inc. Implant Direct Sybron International LLC
Tulsa Dental Products LLC
$0
$2,000,000
$4,000,000
$6,000,000
$8,000,000
$10,000,000
$12,000,000
$14,000,000
0
1000
2000
3000
4000
5000
6000
7000
$2,037 $1,989
$981
$6,630
$2,156
$3,091
$3,972
Faculty & Speaker Payments for Accredited & Non Accredited Education Programs - Top Seven Companies by $
Total Amount of Payment US Dollars Number of Payments Included in Total Amount Average Payment
For additional insight by specific company and/or brand please email [email protected] or visit here
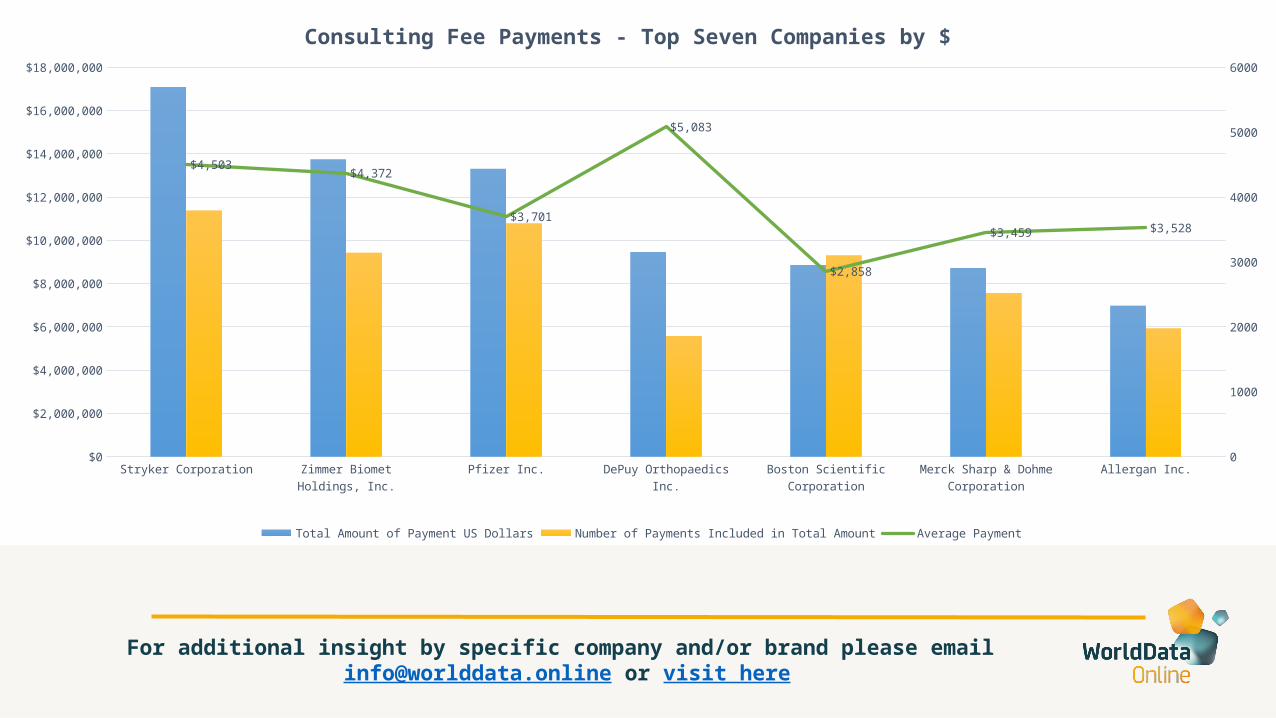
Stryke
r Corp
oratio
n
Zimmer
Biomet
Holding
s, Inc.
Pfizer
Inc.
DePuy O
rthop
aedics
Inc.
Bosto
n Scientifi
c Corp
oratio
n
Merck S
harp
& Dohme C
orpora
tion
Allerga
n Inc
.$0
$2,000,000
$4,000,000
$6,000,000
$8,000,000
$10,000,000
$12,000,000
$14,000,000
$16,000,000
$18,000,000
0
1000
2000
3000
4000
5000
6000
$4,503 $4,372
$3,701
$5,083
$2,858
$3,459 $3,528
Consulting Fee Payments - Top Seven Companies by $
Total Amount of Payment US Dollars Number of Payments Included in Total Amount Average Payment
For additional insight by specific company and/or brand please email [email protected] or visit here
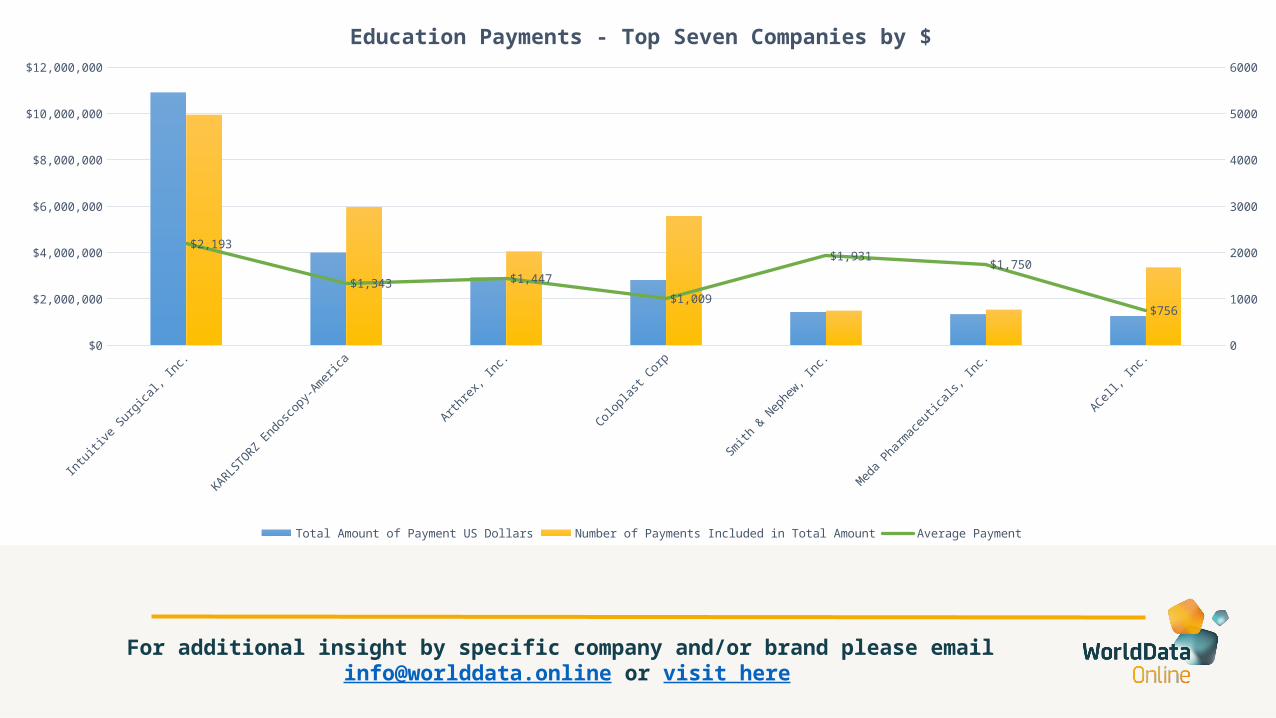
Intuit
ive Su
rgical
, Inc.
KARL
STORZ E
ndosco
py-Ameri
ca
Arthrex
, Inc.
Colop
last C
orp
Smith
& Nephew
, Inc.
Meda P
harm
aceuti
cals, I
nc.
ACell,
Inc.
$0
$2,000,000
$4,000,000
$6,000,000
$8,000,000
$10,000,000
$12,000,000
0
1000
2000
3000
4000
5000
6000
$2,193
$1,343 $1,447
$1,009
$1,931$1,750
$756
Education Payments - Top Seven Companies by $
Total Amount of Payment US Dollars Number of Payments Included in Total Amount Average Payment
For additional insight by specific company and/or brand please email [email protected] or visit here
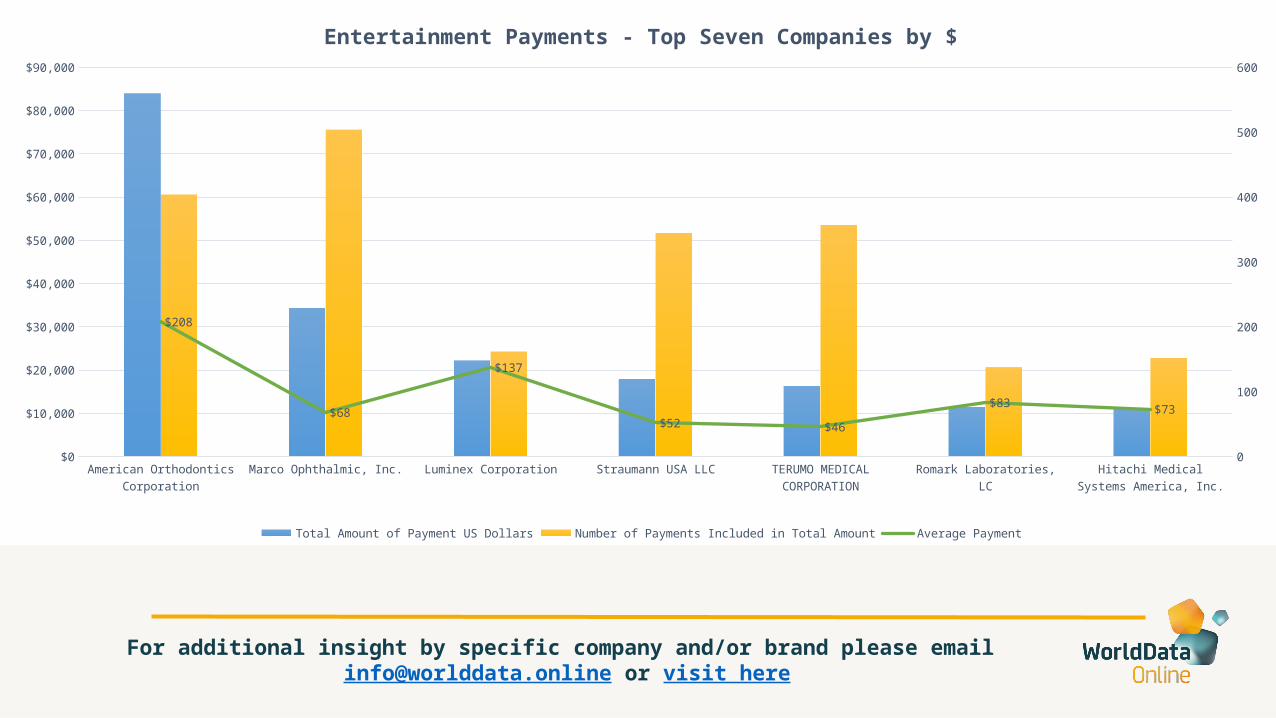
American Orthodontics Corporation
Marco Ophthalmic, Inc. Luminex Corporation Straumann USA LLC TERUMO MEDICAL CORPORATION
Romark Laboratories, LC Hitachi Medical Systems America, Inc.
$0
$10,000
$20,000
$30,000
$40,000
$50,000
$60,000
$70,000
$80,000
$90,000
0
100
200
300
400
500
600
$208
$68
$137
$52 $46
$83 $73
Entertainment Payments - Top Seven Companies by $
Total Amount of Payment US Dollars Number of Payments Included in Total Amount Average Payment

For additional insight by specific company and/or brand please email [email protected] or visit here
AstraZ
eneca
Pharm
aceuti
cals L
P
Jansse
n Pharm
aceuti
cals, I
nc
Pfizer
Inc.
Novo Nord
isk In
c
Boeh
ringe
r Ingelh
eim Ph
armace
uticals
, Inc.
AbbV
ie, Inc
.
SANOFI-
AVENTIS
U.S. LLC
GlaxoS
mithKlin
e, LLC
.
Taked
a Pharm
aceuti
cals A
merica,
Inc.
Actav
is Pha
rma I
nc$0
$2,000,000
$4,000,000
$6,000,000
$8,000,000
$10,000,000
$12,000,000
$14,000,000
0
100000
200000
300000
400000
500000
600000
700000
800000
$17 $19 $15 $15 $21 $23 $20 $16 $19 $14
Food & Beverage Payments - Top Ten Companies by $
Total Amount of Payment US Dollars Number of Payments Included in Total Amount Average Payment
For additional insight by specific company and/or brand please email [email protected] or visit here
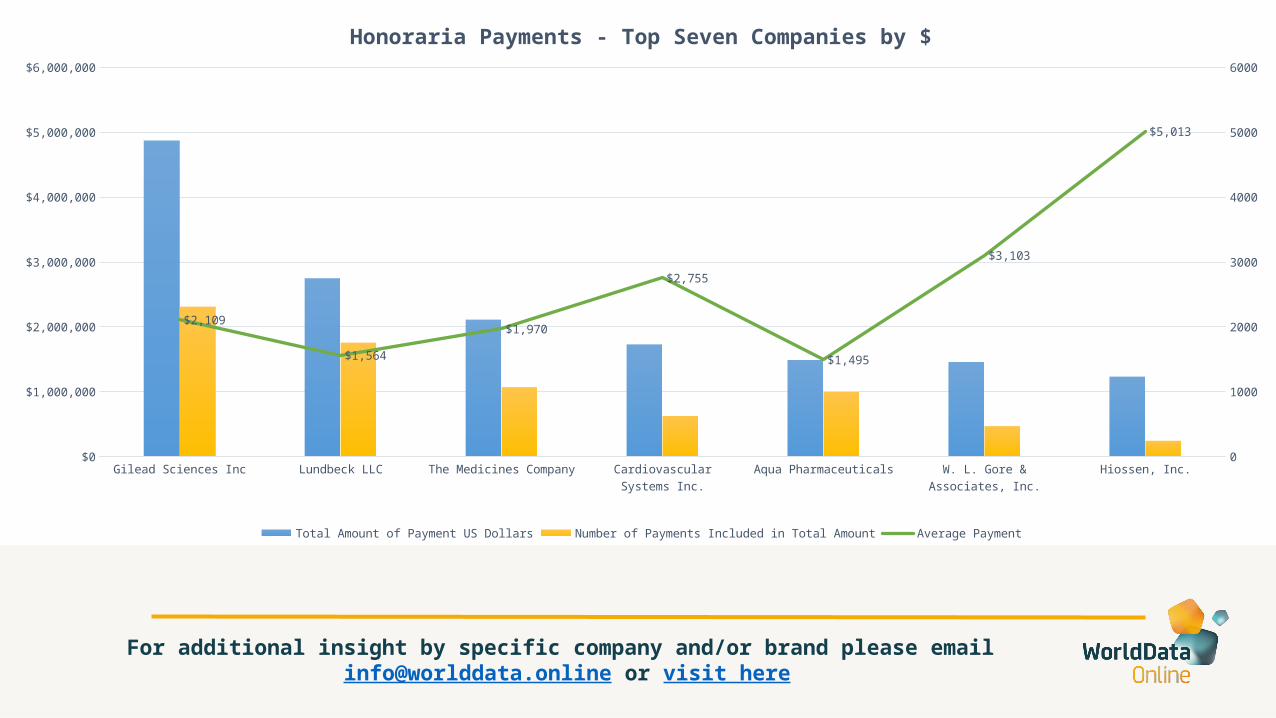
Gilead Sciences Inc Lundbeck LLC The Medicines Company Cardiovascular Systems Inc.
Aqua Pharmaceuticals W. L. Gore & Associates, Inc.
Hiossen, Inc.$0
$1,000,000
$2,000,000
$3,000,000
$4,000,000
$5,000,000
$6,000,000
0
1000
2000
3000
4000
5000
6000
$2,109
$1,564
$1,970
$2,755
$1,495
$3,103
$5,013
Honoraria Payments - Top Seven Companies by $
Total Amount of Payment US Dollars Number of Payments Included in Total Amount Average Payment
For additional insight by specific company and/or brand please email [email protected] or visit here
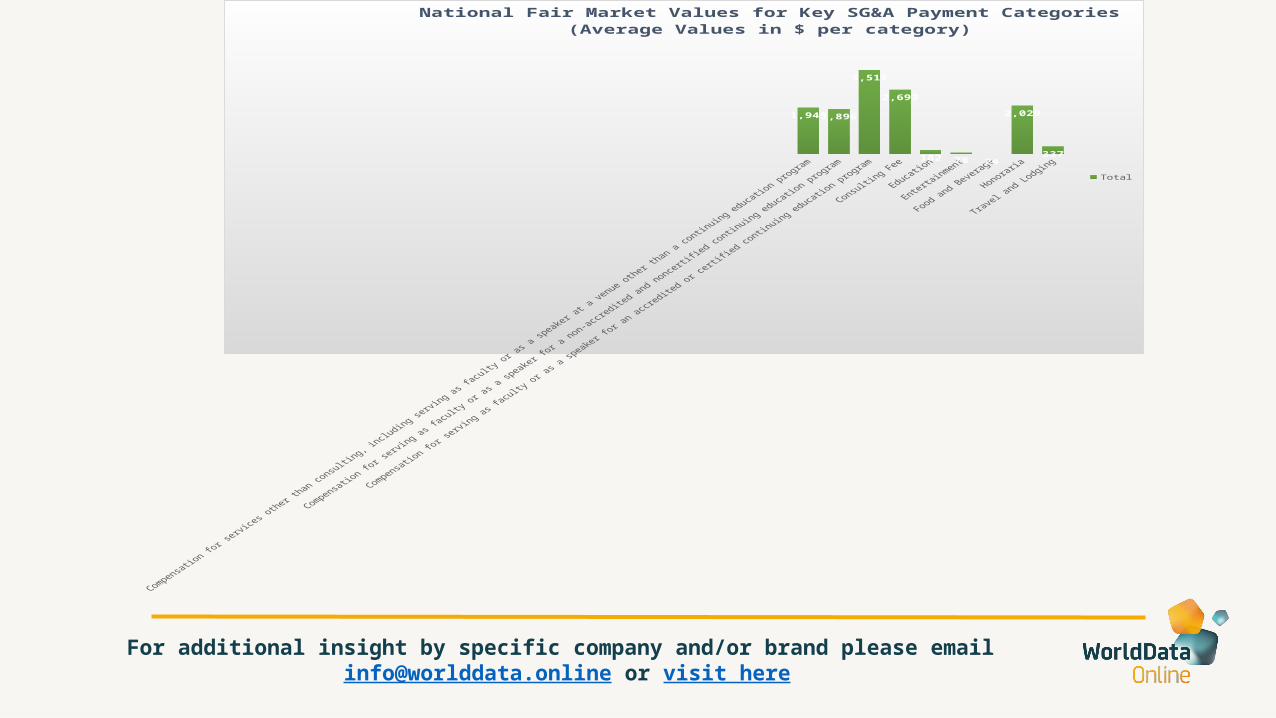
1,949 1,896
3,511
2,693
182 78 24
2,029
337
National Fair Market Values for Key SG&A Payment Categories(Average Values in $ per category)
Total
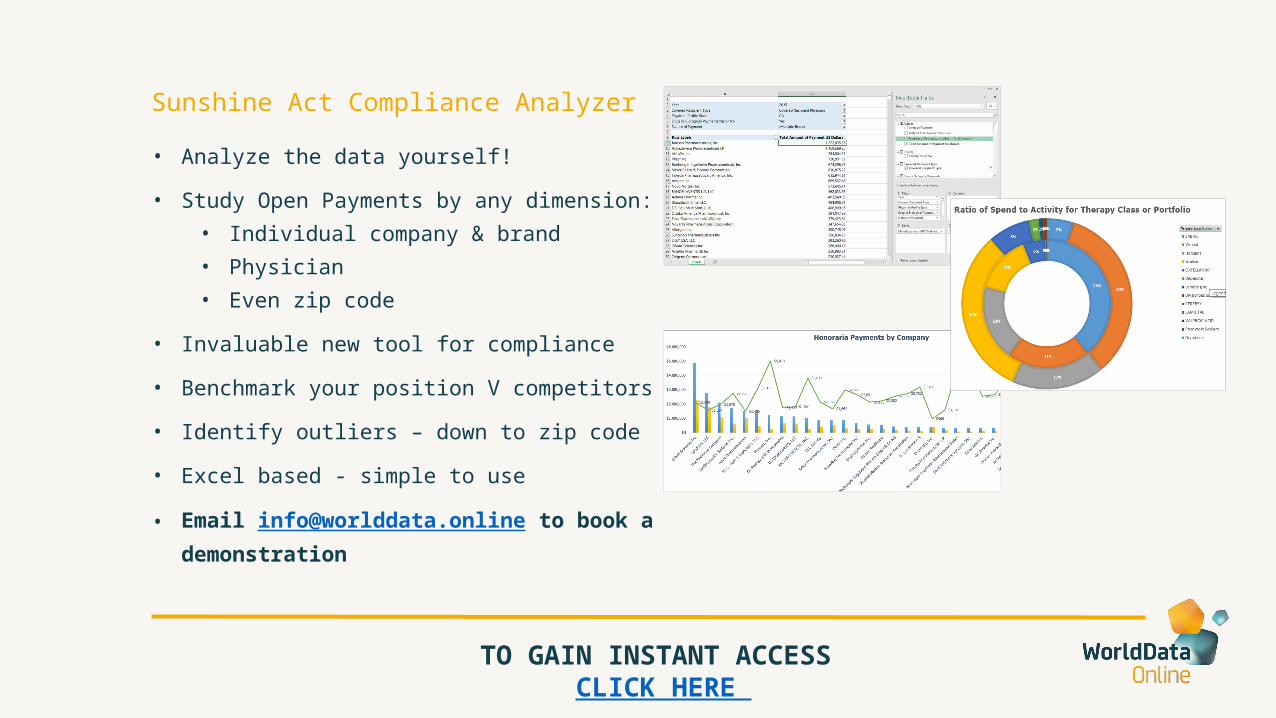
Sunshine Act Compliance Analyzer
• Analyze the data yourself!
• Study Open Payments by any dimension:• Individual company & brand• Physician• Even zip code
• Invaluable new tool for compliance
• Benchmark your position V competitors
• Identify outliers – down to zip code
• Excel based - simple to use
• Email [email protected] to book a demonstration
TO GAIN INSTANT ACCESS CLICK HERE

Sunshine Act Compliance Report
• Let someone else do the analysis!
• See where you are an outlier
• Know your results & your competitors
• Identify local areas of non-compliance
• Study fair market values
• Assess your meal-cap compliance by state
• Purchase a bespoke or syndicated report – your choice!
Click here to place an image
Call today on (941) 726-8125
Email [email protected]
About WorldDataOnline and the Sunshine Act Compliance Analysis
WorldDataOnline manages and adds value to the U.S’s most complex open healthcare data. Our analysts
have rich expertize in developing solutions to help payers, providers and life science companies.
All content in the Executive Summary slide deck is constructed from our state-of-the-art Open Payment
interrogation system – the Sunshine Act Compliance Analyzer (SACA).
SACA is available for use by Compliance departments on a subscription basis.

Contact details
Start investigating your data using the Sunshine Act Compliance Analyzer today!
For immediate access to a reduced cost trial period, simply click here.
To learn more about how the system could help your compliance:
Call today on: (941) 726-8125
Email: [email protected]
To read more articles on this year’s Sunshine Act data please click here.
Disclaimer & Conditions
In producing this Executive Summary slide deck WorldDataOnline explicitly does not:
Intend to draw conclusions, inferences or interpretations from the data. The data is presented on a factual basis, being derived from original atomic level records produced by the Centers for Medicare & Medicaid (CMS) om the 30th June 2015.
Accept any liability for the data’s content or subsequent use
Any person or company wishing to use the data can do so for non-commercial purposes, providing reference is made to the original source of the material – www.worlddata.online
All General WordDataOnline Terms apply to the data
DefinitionsTransfer of Value (ToV) Payment Categories are those provided by CMS and entered by the manufacturer or Group Purchasing Organization (GPO) during the open payments submission process and include: Honoraria, Travel & lodging, Food & beverage, Entertainment, Education, Consulting fees, Compensation for services as a faculty or speaker, Compensation for services other than consulting, Gifts, Grants, Charitable payments, Royalties & license fees, Current or prospective ownership, Space rental or facility fees & Unknown
Selling, General & Administrative (SG&A) - for the purposes of the Executive Summary, the ToV categories have been split into Selling, General & Administrative (SG&A) related payments and non SG&A.
SG&A Related Categories include: Honoraria, Travel & lodging, Food & beverage, Entertainment, Education, Consulting fees, Compensation for services as a faculty or speaker, Compensation for services other than consulting
Non SG&A Related Categories include: Gifts, Grants, Charitable payments, Royalties & license fees, Current or prospective ownership, Space rental or facility fees, Unknown
Return to Overview slide