pgm market report february 2018 summary of platinum … market reports/pgm... · pgm market report...
TRANSCRIPT

PGM MARKET REPORT FEBRUARY 2018
1
Precious Metals Management
Summary of PlatinumSUPPLY & DEMAND IN 2017
Demand for platinum slowed during 2017, in line with sharp falls in jewellery demand in China and investment buying in Japan. Chinese jewellery fabrication contracted, as platinum lost market share to karat gold jewellery, while purchases of platinum bars by Japanese investors returned to more normal levels following two years of exceptionally strong demand. However, the autocatalyst market proved more robust than expected, declining only marginally versus 2016, while industrial platinum usage increased. With growth in recycling offsetting weaker mine supply, our expectations of a modest surplus in 2017 have been confirmed.
We estimate that global primary supplies of platinum in 2017 fell just short of 6 million oz, a decline of 2%. Russian shipments fell by 7.5%, due to lower sales from inventory and weaker output from alluvial deposits, while North American output was affected by some changes in processing routes. In South Africa, the world’s two largest primary platinum producers, Anglo American Platinum and Impala Platinum, both experienced technical issues at their processing facilities, causing fluctuations in inventories of unrefined pgm. This has had the effect of deferring some refined platinum output into 2018. At the time of writing, final production and sales figures for 2017 were not yet available, so our estimates of mine supply are provisional.
Mine output of platinum in South Africa was little changed last year. Two of the largest platinum mining operations in South Africa – Sibanye-Stillwater’s Rustenburg platinum mines and Impala Platinum’s Rustenburg lease area – both saw production gains, while the Mogalakwena open pit (Anglo American Platinum) put in another record performance. However, the operating environment in South Africa remained difficult, with producers continuing to experience sporadic disruptions to their mining activities, mainly due to safety stoppages and community unrest.
There were two further mine closures during 2017: Platinum Group Metals Ltd’s Maseve mine ceased producing in mid-year, while Atlatsa Resources’ Bokoni mine was mothballed at the end of September. Surface assets at Maseve are to be sold to Royal Bafokeng Platinum, which operates the neighbouring BRPM and Styldrift mines.
Refined production in South Africa was affected by a series of processing interruptions last year. Anglo American Platinum began 2017 with in-process stocks above normal levels following a furnace run-out at its Waterval smelter the previous year; the refining of this inventory was delayed by a high-pressure water leak at its convertor plant in June 2017, although most of the pgm had been processed by year end. In October, the company announced that seepage had been detected on the tailings dam wall at its Mototolo joint venture (with Glencore), and that concentrating activities at the
• Declines in jewellery and investment demand moved the platinum market into a modest surplus.
• A slight fall in mine shipments was offset by growth in recycling, leaving total supplies little changed.
• Auto demand fell by 1%, in line with small declines in European diesel output and loadings.
• Industrial consumption rose strongly to almost 2 million oz, with firm demand in most sectors.
• With the Chinese market facing stiff headwinds, global jewellery fabrication demand fell by 8%.
• Platinum investment fell by over 260,000 oz on significantly lower Japanese bar sales.
SUMMARY: PLATINUM
Platinum Supply and Demand ‘000 oz
Supply 2015 2016 20179
South Africa 4,572 4,392 4,364
Russia 670 703 650
Others 865 988 962
Total Supply 6,107 6,083 5,976
Gross Demand
Autocatalyst 3,228 3,327 3,285
Jewellery 2,746 2,412 2,227
Industrial 1,753 1,855 1,978
Investment 451 620 356
Total Gross Demand 8,178 8,214 7,846
Recycling -1,715 -1,929 -1,980
Total Net Demand 6,463 6,285 5,866
Movements in Stocks -356 -202 110

PGM MARKET REPORT FEBRUARY 2018
Precious Metals Management
2
Refined production in South Africa was affected by a series of process interruptions.
site had been suspended. Newly mined ore will be added to stockpiles until processing resumes, deferring around 45,000 oz of platinum production.
At Impala Platinum, maintenance work was undertaken at two of the group’s South African furnaces and at the Zimplats smelter in Zimbabwe. As a result, the group’s in-process inventories were above normal levels at the year end. Northam Platinum also accumulated some stocks of pgm in concentrate ahead of the commissioning of a new furnace. In contrast, refined output from Lonmin exceeded production from its mines, as the company continued to process pgm-containing materials sourced from a clean-up of its smelter plant. After accounting for these stock movements, we estimate that South African producers supplied around 4.36 million oz of platinum last year, down marginally compared with 2016.
In Zimbabwe, all three producers continue to make incremental gains in mine production. However, our supply estimate for 2017 shows a modest year-on-year decline, because the record total achieved in 2016 included an additional 20,000 oz from the smelting of a concentrate backlog at Zimplats. With another smelter outage affecting production last year, it may be that some of Zimplats’ 2017 pgm output will in fact be refined in 2018. We will adjust our supply estimates in our next report, due for publication in May, in line with final year-end production reports.
Our preliminary estimate of Russian platinum supplies in 2017 is 650,000 oz, down 7.5% on the previous year, when Norilsk supplied some metal from inventories. While alluvial production from the Kondyor and Koryak mines in the Far East of the country continues to decline, in line with a steep fall in the volume and platinum grade of sands processed, refined output from Norilsk Nickel has recovered following a temporary dip in the first quarter of 2017. This fluctuation was caused by a short-term increase in work-in-progress during the transfer of some pgm concentrating activities from the Norilsk mine site to the company’s Kola Peninsula processing complex.
In recent years, Norilsk Nickel’s production has been augmented by the refining of pgm from old pyrrhotite concentrate stored at the Norilsk mine site. Stocks of this material have
now been depleted, but in 2017 the company began to extract pgm from copper concentrate derived from mining activities in the Norilsk area in the 1980s. This material was purchased from the state-controlled corporation Rostec in December 2016.
We estimate that North American supplies totalled 318,000 oz in 2017, down 6% compared with the previous year. During the first nine months, both Vale and Glencore reported double-digit declines in platinum output, reflecting lower copper and nickel production from their Canadian operations. Our full-year figure reflects our belief that there is potential for an improved final quarter, with some pgm output having been delayed by smelter maintenance and changes to the flowsheet at Vale’s Sudbury smelter earlier in the year.
Norilsk Nickel supplemented pgm output by processing old copper concentrate.

PGM MARKET REPORT FEBRUARY 2018
3
Precious Metals Management
In the USA, the Stillwater and East Boulder mines in Montana were incorporated into the renamed Sibanye-Stillwater group from May 2017, and output has improved modestly compared with 2016. The company is proceeding with its Blitz expansion project, which achieved its first production on 29th September 2017.
Overall, primary shipments of platinum contracted slightly, but secondary supplies moved in the opposite direction, climbing 3% to nearly 2 million oz. While jewellery recycling declined, there was a surge in autocatalyst recycling which lifted platinum recoveries from automotive scrap to record levels.
Autocatalyst scrap volumes were unusually depressed during 2015 and 2016: weak steel prices prompted a significant decline in the number of end-of-life vehicles (ELVs) reaching scrapyards, while fluctuations in pgm prices resulted in periodic hoarding by collectors betting on a rise in catalyst scrap values. However, the scrap market began to show signs of recovery starting in late 2016, and this trend accelerated over the course of last year, with some major recyclers reporting double-digit increases both in the volume of catalyst scrap processed and in pgm recoveries.
This rebound was primarily a function of a sharp increase in the number of ELVs being dismantled for scrap, rather than any underlying change in the platinum content of spent autocatalyst. We had expected to see significant growth in the platinum grade of catalyst scrap this year, particularly in the European market, reflecting the steep gains in platinum consumption on diesel vehicles that occurred starting in 2000. However, there has been little evidence of any significant increase in platinum assays in the past year; our analysis suggests that this is because average vehicle age has risen over time.
There are also some technical challenges associated with the processing of the silicon carbide substrate used for most diesel particulate filters. Silicon carbide scrap must be treated under oxidising conditions, whereas most European scrap smelters use arc furnaces which operate under reducing conditions. As a result, a shortage of local capacity to treat some types of diesel scrap has contributed to longer shipment and processing times.
We estimate that global jewellery recycling fell by 15% to 623,000 oz, reflecting a fall in recycling in both major jewellery scrap markets, Japan and China. In Japan, the recycling of platinum jewellery reached a peak in 2012–2013, as higher gold prices sparked a boom in precious metals recycling, but activity has since returned to more normal levels.
In China, the jewellery recycling sector is undergoing some significant changes. In the past, recycling took place almost exclusively via the jewellery distribution network: consumers took their unwanted platinum jewellery items to retail outlets, exchanging them for new and usually heavier designs, while retailers and wholesalers periodically returned excess or outdated stock to manufacturers to be reworked into new
The Sibanye-Stillwater Blitz project began production on 29th September 2017.
The recycling of platinum from automotive scrap was lifted to record levels.

PGM MARKET REPORT FEBRUARY 2018
Precious Metals Management
4
jewellery pieces. Over the past decade, metal recycled in this fashion has typically accounted for about a quarter of the platinum used in Chinese jewellery fabrication.
However, more recently, recycling has been taking place outside of this established ‘closed-loop’ network, with consumers who do not wish to exchange their platinum jewellery for a new platinum piece preferring to sell directly to scrap collection booths for cash. This metal is processed at local refineries for sale to either jewellery fabricators or other consumers. We believe that the amount of platinum jewellery being recycled via this route increased significantly in 2017.
In contrast, the quantity of unsold stock returned for refabrication via the usual ‘closed-loop’ distribution network was down sharply, following unusually high volumes the previous year. Since 2015, there has been some rationalisation of the jewellery distribution chain in China, while platinum has also lost market share to karat gold in the fashion jewellery segment. This has had an impact on the amount of stock that retailers and wholesalers are prepared to hold, and led to extensive destocking throughout the distribution chain during 2016. While there were some further inventory reductions last year, partly as a function of a decline in the amount of counter space devoted to platinum jewellery, the impact was much smaller.
Gross demand for platinum fell by 4% to 7.85 million oz, mainly due to the steep fall in Chinese jewellery manufacturing and lower Japanese investment bar sales. These declines were partly offset by firm demand in most industrial sectors, with total industrial consumption rising by 7% to just short of 2 million oz – matching the previous record set in 2011. Changes in autocatalyst demand last year were comparatively minor, with total platinum use down 1% to 3.29 million oz.
In our last report, we predicted that demand for platinum in autocatalysts would shrink by 5% in 2017. However, light duty diesel vehicle production held up better than expected, falling marginally in Europe and rising 2% globally, while there were only small changes in average platinum loadings. Consumption in the heavy duty diesel sector increased modestly, leaving total use of platinum in diesel applications virtually unchanged compared with the previous year. However, there was some further slight erosion of platinum demand in gasoline vehicle catalysts.
The next stage of European light duty diesel emissions legislation, known as Euro 6d-TEMP, was introduced in September 2017. During the phase-in period of these regulations, we expect to see a progressive shift away from the use of platinum-rich lean NOx traps (LNTs) to control NOx, and greater adoption of selective catalytic reduction (SCR) technology, which does not contain pgm. SCR will be used alongside platinum-containing bricks such as oxidation catalysts and particulate filters, but on average we expect Euro 6d-TEMP aftertreatment systems to contain less platinum than their Euro 6b equivalents. However, the new legislation applied only to new models launched in the final four months of 2017, and the impact on average platinum loadings was therefore small.
Industrial consumption rose by 7% to just short of 2 million ounces.
Global jewellery recycling fell by 15%, reflecting falls in both Japan and China.

PGM MARKET REPORT FEBRUARY 2018
World demand for platinum in heavy duty catalysts rose by an estimated 3% in 2017, reflecting higher truck output in major markets such as Japan and the USA, and greater use of diesel oxidation catalysts (DOCs) on heavy vehicles in China. Globally, we estimate that around 60% of heavy duty diesel vehicles were equipped with platinum-containing catalysts last year, up from 54% the previous year.
Chemical industry demand for platinum remained buoyant, with demand firm in all regions. China remains the largest single user of platinum in the majority of chemical applications, and investment by Chinese companies in their overseas markets – encouraged under the government’s ‘One Belt and One Road’ initiative – also contributes significantly to demand in other regions.
Many of platinum’s chemical applications are in the form of catalysts that are used, but not consumed, in the manufacture of chemical products. Most purchasing therefore occurs at the time of plant construction, when an initial catalyst charge is purchased, with only small amounts of ‘top-up’ metal required thereafter. Last year saw particularly strong demand for platinum as a result of paraxylene capacity additions in the Rest of World region, and from new propylene dehydrogenation plants in China.
Platinum demand in the speciality silicones sector differs from the general rule, in that the platinum catalyst is consumed during the manufacturing process and the metal ends up, in extremely low concentrations, in the final product. These end-products include a wide range of consumer and industrial products, such as seals and packaging, medical appliances, release liners for labels, and dental impression materials. The Chinese market for silicones has been growing rapidly in recent years, in line with strong economic growth, and this has stimulated the construction of new domestic silicones production capacity.
Investment in petroleum refining in China also remained strong in 2017, as the industry upgraded its facilities in order to produce higher quality products to meet new vehicle emissions legislation. New demand in the country is also being generated by large projects integrating crude refining with downstream petrochemicals production, as China aims to be self-sufficient in certain chemicals.
Last year also saw growth in demand for platinum in the electrical sector. We estimate that platinum usage in hard disks grew by more than 10% last year; while hard disk drives (HDDs) face stiff competition from solid state data (SDD) storage in consumer applications, there has been steady expansion in the use of HDDs in ‘server farms’ for
Precious Metals Management
5
Platinum Demand: Autocatalyst ‘000 oz
Gross Recycling Net
2015 2016 20179 2015 2016 20179 2015 2016 20179
Europe 1,668 1,821 1,766 -477 -501 -558 1,191 1,320 1,208
Japan 395 391 396 -62 -66 -68 333 325 328
North America 368 346 326 -460 -470 -565 -92 -124 -239
China 136 145 157 -14 -18 -23 122 127 134
Rest of World 661 624 640 -99 -104 -108 562 520 532
Total 3,228 3,327 3,285 -1,112 -1,159 -1,322 2,116 2,168 1,963
Chemical demand was boosted by China's 'One Belt and One Road' initiative.

PGM MARKET REPORT FEBRUARY 2018
cloud and enterprise data storage. Along with greater numbers of drives for server applications, there is also a trend to increasing numbers of disks per drive to meet rapidly growing data storage requirements. The potential for SDD memory to encroach on hard disk market share in this segment is limited by price and capacity issues.
Fuel cell demand is included in our electrical industry number, and accounted for just under 50,000 oz of demand in 2017. Demand from the Japanese residential fuel cell market (known as ‘Ene-Farm’) was weaker than previously expected: proton exchange membrane (PEM) fuel cells have lost market
share to solid oxide fuel cells, which do not contain platinum. In contrast, the use of platinum in fuel cell electric vehicles (FCEV) rose by over 300% last year. Sales of fuel cell cars (mainly in California and Japan) more than doubled in 2017, while several hundred fuel cell buses were deployed in China. See page 11 for a more detailed discussion of the developing Chinese market for FCEVs.
Sales of platinum to the glass-making sector were the strongest for six years at over 300,000 oz. While there was some modest purchasing of pgm for LCD glass expansions, the booming glass fibre sector accounted for the bulk of new platinum requirements. With momentum building in major Western economies, and the Chinese economy continuing to expand at around 6% per annum, global demand for fibre-reinforced plastics is growing rapidly. This has stimulated significant investment in new fibreglass production capacity, especially in China. While the Chinese domestic market accounts for the largest share of new investment, Chinese companies have also been adding to capacity outside their home country, in order to avoid anti-dumping duties in their overseas markets, and in order to qualify for local incentives and tax reduction programmes.
Demand for platinum in other applications rose by around 4% in 2017, with rising platinum use in vehicle components such as sensors used in engine management and emissions control systems. Demand for platinum in coatings used on turbine blades and other aero engine components was also firm.
While developments in platinum’s industrial markets were generally positive, the opposite was true in the jewellery sector: the Chinese platinum jewellery market has faced significant headwinds over the past three years, and there is little immediate prospect of an improvement in business conditions. According to the World Gold Council, Chinese demand for gold jewellery fell by 17% in 2016, and there were further declines in the first six months of 2017. Gold amounts for the majority of jewellery sales in China, usually in the form of heavy, pure metal items that are purchased as a store of value; this collapse in revenues has led to consolidation of the retail network, with stores closing and their inventory being distributed among other outlets in the same retail chain, or returned for recycling (see pages 3
Precious Metals Management
6
Sales to glass makers were the strongest for six years at over 300,000 oz.
Platinum Demand: Industrial ‘000 oz
2015 2016 20179
Chemical 502 527 521
Electrical 228 230 258
Glass 227 246 306
Medical & Biomedical 215 218 220
Petroleum 140 176 198
Other 441 458 475
Total 1,753 1,855 1,978

PGM MARKET REPORT FEBRUARY 2018
and 4). This rationalisation process, along with a reduction in the amount of counter space devoted to platinum jewellery, has led to an overall decline in inventory requirements.
Platinum jewellery tends not to compete directly with traditional pure gold jewellery. However, it has become clear over the last year that platinum
is now facing significant competition from karat gold products in the fashion jewellery segment. Chinese consumers have historically been wary of karat gold, because of its relatively low precious metal content (75% or below) compared with pure gold or platinum jewellery. The latter are usually sold by weight, with retailers displaying metal prices in their stores; this enables consumers to be confident of the inherent value of their purchase, and facilitates the exchange of jewellery for newer items at a later date. In contrast, karat gold jewellery is sold by piece, usually at a much greater mark-up compared to the inherent metal value, and retailers do not typically offer exchanges on these items. In the past this might have proved a significant barrier to the development of a karat gold market in China.
However, in the last two years, with the Chinese jewellery market struggling, retailers have reacted to financial pressures by increasing the amount of counter space devoted to karat gold items, on which they are able to achieve much better margins than on pure gold or platinum. The commission structure for jewellery store employees often reflects these margins, providing a strong incentive for workers to market karat gold jewellery to customers, instead of platinum.
While the karat gold trend appears to have been initiated primarily by retailers hoping to mitigate financial pressures, it is now clear that retail marketing efforts have been successful in tapping into evolving consumer tastes. This is particularly true amongst younger people, who are typically less concerned about exchange values than older generations of jewellery
purchasers. In turn, retail-led growth in karat gold has created a strong demand pull at manufacturer level, often at the expense of platinum.
Johnson Matthey undertakes twice-yearly surveys of fabrication demand in China. Our factory survey for the first half of 2017 showed that gross platinum use had fallen by 17% compared with the same period of the previous year. We believe that the rate of decline slowed in the second half, leaving gross platinum consumption down 14% at 1.3 million oz for the full year. These are preliminary figures, which will be updated in our May 2018 report following the completion of our latest factory survey.
In contrast, we estimate that the Indian market grew by 15% last year, after faltering in 2016 following severe flooding in the Chennai region (a
Precious Metals Management
7
Platinum is facing strong competition from karat gold fashion jewellery in China.
Platinum Demand: Jewellery ‘000 oz
Gross Recycling Net
2015 2016 20179 2015 2016 20179 2015 2016 20179
Europe 203 177 174 -5 -5 -5 198 172 169
Japan 314 310 309 -256 -241 -224 58 69 85
North America 227 220 225 -11 -3 0 216 217 225
China 1,796 1,510 1,303 -298 -485 -391 1,498 1,025 912
Rest of World 206 195 216 -4 -4 -4 202 191 212
Total 2,746 2,412 2,227 -574 -738 -624 2,172 1,674 1,603

PGM MARKET REPORT FEBRUARY 2018
major centre for platinum jewellery fabrication), some changes in the customs regime which caused significant uncertainty for the jewellery trade, and the implementation of the government’s ‘demonetisation’ policy. Although the broader context remained negative for Indian jewellery demand last year, platinum is a new market, very small relative to gold, and benefited from positive demographic factors such as rising personal wealth and an expanding middle class.
In terms of the number of pieces sold, couple rings and lighter pieces such as earrings and pendants are the most popular items, as in other regional platinum jewellery markets. However, India is unusual in the size and importance of its men’s jewellery market, with platinum neck chains and bangles proving increasingly popular. These items typically weigh around 25 grams for a chain and 50 grams for a bangle – compared to around 8 grams for an average ring – and account for a significant proportion of total Indian fabrication demand.
With industrial demand strong, jewellery demand weak, and autocatalyst demand little changed, last year saw only a modest decline in total world demand for platinum in ‘consuming’ applications, i.e. excluding investment. However, after accounting for investment, world demand fell by 4% or around 370,000 oz, with most of this decline occurring in the Japanese investment bar sector. World investment totalled 356,000 oz in 2017, a 43% decline compared with the previous year.
During 2015 and 2016, Japanese retail investors accumulated around 1.15 million oz of platinum, primarily in the form of platinum bars purchased over-the-counter from bullion houses. This surge in investment was linked to a series of falls in yen platinum prices, which coincided with a dramatic widening of platinum’s discount to gold. This created a perception among Japanese retail investors that platinum represented particularly good value, both compared to historic prices and also in relation to gold, and triggered a boom in Japanese bar sales that was unprecedented both in its magnitude and its duration.
This boom period came to an end in 2017, even though the price environment remained favourable for continuing investment: yen platinum prices remained below the
psychologically important ¥4,000 per gram level during 2017, and the discount to gold remained at historically high levels of around ¥1,000/gram. These factors enabled investment activity to remain in positive territory for much of the year, but buying was muted compared to the two prior years.
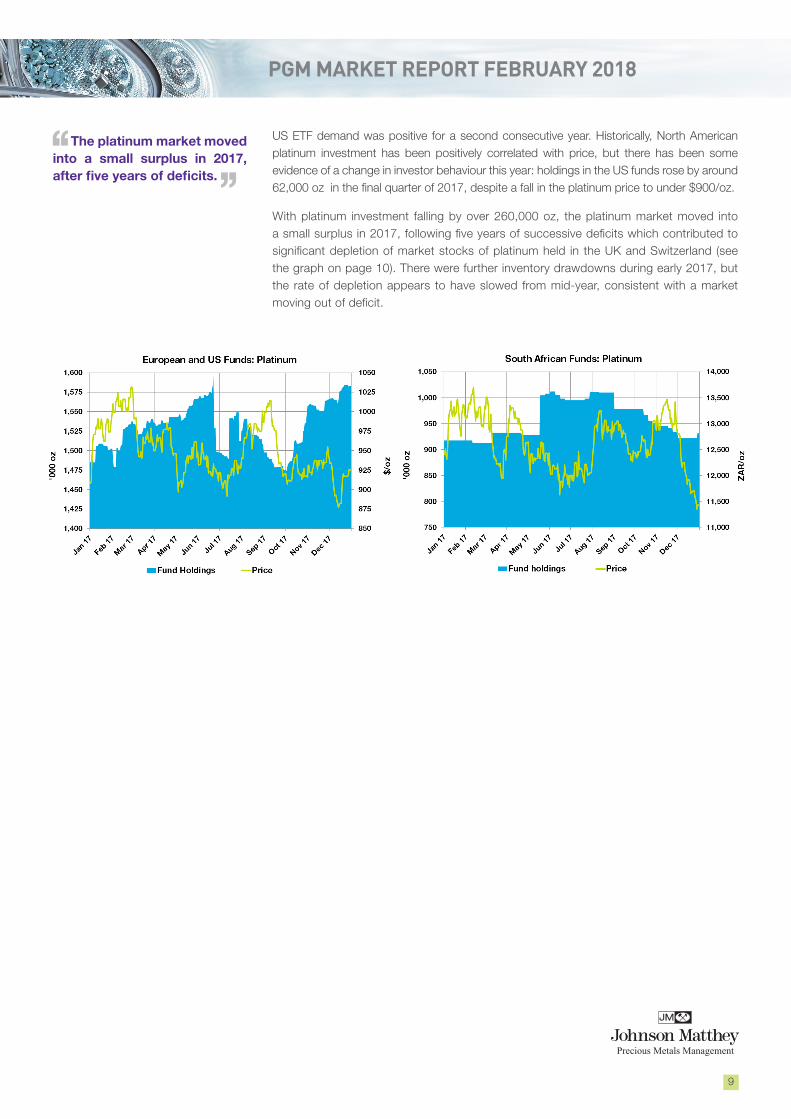
Global investment in platinum ETFs was positive during 2017 for the first time in three years, as holdings in South Africa stabilised after two years of heavy liquidation. There was periodic purchasing into declining prices by South African investors, as movements in the value of the rand created buying opportunities even during periods when dollar platinum price volatility was low. In contrast, the only significant periods of liquidation occurred during the second half of the year, when prices briefly topped ZAR 13,000 per ounce.
Precious Metals Management
8
We estimate that the Indian market for platinum jewellery grew by 15% in 2017.
The boom in Japanese bar sales ended in 2017 but investment stayed positive.
PGM MARKET REPORT FEBRUARY 2018
US ETF demand was positive for a second consecutive year. Historically, North American platinum investment has been positively correlated with price, but there has been some evidence of a change in investor behaviour this year: holdings in the US funds rose by around 62,000 oz in the final quarter of 2017, despite a fall in the platinum price to under $900/oz.
With platinum investment falling by over 260,000 oz, the platinum market moved into a small surplus in 2017, following five years of successive deficits which contributed to significant depletion of market stocks of platinum held in the UK and Switzerland (see the graph on page 10). There were further inventory drawdowns during early 2017, but the rate of depletion appears to have slowed from mid-year, consistent with a market moving out of deficit.
Precious Metals Management
9
The platinum market moved into a small surplus in 2017, after five years of deficits.

PGM MARKET REPORT FEBRUARY 2018
10
Precious Metals Management
Outlook for PlatinumSUPPLY & DEMAND IN 2018
In 2018, platinum use in autocatalysts will see further moderate erosion due to a fall in average loadings on European diesels, while jewellery fabrication in China is forecast to contract for a fifth consecutive year. However, this should be more than offset by growth in industrial applications, where demand could beat the all-time record achieved last year. Glass manufacturers are set to purchase unusually large quantities of platinum for new LCD and fibreglass facilities, while chemical demand will remain at historically high levels. Overall, before accounting for investment, we expect global platinum consumption to rise slightly. However, this will be matched by a modest increase in combined primary and secondary supplies, mainly due to rising recoveries from autocatalyst scrap.
World primary supplies of platinum are unlikely to change much in 2018, with the impact of mine closures in South Africa offset by a one-off benefit from the refining of some unprocessed inventory that accumulated last year.
We estimate that the release of metal from stocks of ore and work-in-progress could add as much as 150,000 oz of platinum to refined output in South Africa this year. The Mototolo mine will treat a backlog of unprocessed ore following a concentrator outage, while Impala Platinum will process unrefined inventory that built up during furnace maintenance in 2017, and Northam Platinum will refine concentrate that accumulated ahead of the commissioning of a new furnace. The refining of these materials will provide a temporary boost to South African platinum supplies in 2018. However, this gain will be partly offset by the loss of production from the Bokoni and Maseve mines, which closed during 2017.
Output of pgm at Norilsk Nickel is expected to be broadly flat, but alluvial platinum production in the Far East of Russia will decline once again. These deposits once supplied over 150,000 oz of platinum annually, but output has been contracting for several years and could be as little as 20,000 oz in 2018. In North America, Sibanye-Stillwater’s Blitz expansion project should make a meaningful contribution to supplies this year, but pgm grades at the Sudbury nickel mines are on the decline.
While mine output is expected to be lacklustre, secondary production is forecast to benefit from further growth in the volume of spent autocatalyst collected and processed. After a period of unusually muted activity in this sector during 2015 and 2016, especially in the large European
• With primary mine shipments little changed, growth in auto recycling will boost total supplies.
• Record industrial demand will lift global consumption of platinum, excluding investment.
• The glass industry is set to make large platinum purchases for new LCD and fibreglass facilities.
• Auto consumption will fall slightly, with weak diesel demand in Europe partly offset by growth in the USA.
• Platinum jewellery fabrication in China is likely to contract again, but the rate of decline could slow.
• Assuming no change in investment demand, the market should remain in moderate surplus.
OUTLOOK: PLATINUM

PGM MARKET REPORT FEBRUARY 2018
Precious Metals Management
11
and North American markets, there is room for further expansion in the number of vehicles being dismantled. We continue to anticipate an increase in the platinum grade of European catalyst scrap, based on the dramatic increase in loadings on diesel vehicles that occurred during the 2000–2007 period.
Jewellery recycling in China is expected to fall, although as a proportion of gross jewellery demand it is likely to remain above normal levels. Overall, we think combined primary and secondary supplies could rise by 2−3%.
There is potential for platinum demand to increase in 2018, based on a very positive outlook for industrial applications. It is likely to be a bumper year for the glass sector, with glass makers poised to make exceptionally large purchases of platinum for LCD and fibreglass expansions in China. The electrical sector will be boosted by strong growth in the fuel cell segment, where transport applications are forecast to consume more platinum than stationary fuel cells for the first time. Chemical demand will remain robust: new metal requirements from this industry are expected to exceed half a million ounces of platinum for a sixth consecutive year.
Much of this year’s growth in platinum consumption in fuel cell electric vehicles (FCEVs) will come from China, mainly due to the roll-out of fuel cell bus programmes in a number of cities. This has generated orders for significant numbers of fuel cell stacks to be delivered over the 2018–2021 period.
The outlook for fuel cells in China is increasingly positive: over the past year, developments in the government’s New Energy Vehicle policy have created a favourable environment for the development of a mass market for FCEVs. The use of fuel cells should be favoured by the need to meet strict criteria such as a minimum range and fast charging in order to qualify for the most generous subsidies and incentives available. In contrast, we expect financial support for battery electric and plug-in hybrid vehicles to be reduced, and eventually removed. The Chinese government’s aim is to increase the number of FCEVs on Chinese roads to 50,000 units by 2025, and one million by 2030.
In contrast to buoyant industrial demand, the use of platinum in autocatalysts is expected to shrink slightly in 2018. World output of light duty diesel vehicles is forecast to be stable, with growth in North America, India and some Rest of World countries offsetting a 2–3% decline in European production, but platinum demand will be hit by lower average loadings on diesel vehicles built for sale in Europe.
This decline in loadings is based on changing catalyst fitment strategy at some European automakers. The phase-in of Euro 6d-TEMP regulations began in September 2017, and is expected to result in a shift towards non-pgm SCR technology for NOx control, although all diesel vehicles will continue to be fitted with platinum-rich catalysts for the treatment of other pollutants. This will result in a modest decline in average catalyst loadings across the European fleet in 2018.
Combined primary and secondary supplies could rise by 2−3% in 2018.
The outlook for fuel cell vehicles in China is increasingly positive.

PGM MARKET REPORT FEBRUARY 2018
Precious Metals Management
12
Lower autocatalyst demand in Europe will be partly offset by a very strong performance from the US diesel market, with North American light diesel production forecast to approach 1 million units, an all-time high. US diesels tend to be much larger than their European counterparts, and catalyst systems therefore have higher pgm loadings, despite the almost universal use of SCR technology instead of LNTs for NOx control in this region.
Platinum jewellery fabrication in China has been contracting for the last four years, and is expected to fall again in 2018, although the rate of decline could slow. During the second half of last year there was some evidence of a recovery in the Chinese gold jewellery market, with the World Gold Council estimating that third-quarter sales rose by 13%. If this trend is confirmed, it will help to relieve the financial pressure on jewellery retailers, and reduce the likelihood of further rationalisation in the distribution chain. There
are also signs that the industry is working to improve the design of platinum jewellery, with the aim of moving towards ‘per piece’ pricing, and improving margins. However, it is too early to tell whether this initiative will be successful.
Platinum jewellery demand in Japan peaked at over a million ounces in the 1990s, but in recent years has been stable at just over 300,000 oz per annum. Low platinum prices have generally been supportive for jewellery demand in this region, making it easier for manufacturers to develop new ranges of fashion jewellery at attractive price points. In 2018, the wedding of Imperial Princess Mako in November should have a positive influence on the market; the princess is expected to wear platinum jewellery at wedding-related events and the resulting exposure has the potential to stimulate platinum sales among younger consumers, with whom she is very popular. However, the impact is likely to be small compared to the decline in Chinese fabrication.
Notwithstanding declines in the jewellery and auto sectors, we expect total use of platinum in ‘consuming applications’ (i.e. excluding investment) to increase slightly in 2018. This means that investment will once again be a key factor in determining the direction of change in total platinum demand.
Over the eleven years since platinum ETFs were first launched in 2007, combined physical investment demand in ETFs, bars and coins has averaged around 500,000 oz per annum. However, over this period the two major components of investment demand have moved in opposite directions: in years when ETF purchases were unusually strong, Japanese retail bar demand tended to fall, and vice versa.
Auto demand will be hit by lower average loadings on European diesel vehicles.
PGM MARKET REPORT FEBRUARY 2018
Precious Metals Management
13
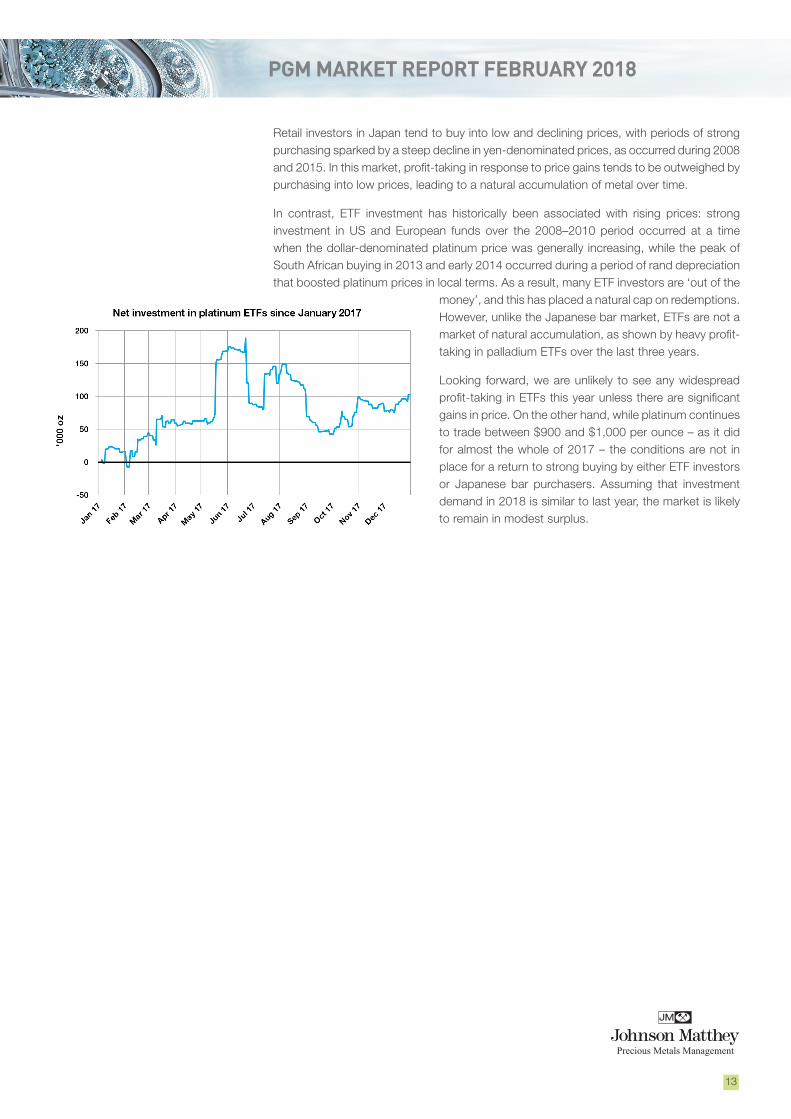
Retail investors in Japan tend to buy into low and declining prices, with periods of strong purchasing sparked by a steep decline in yen-denominated prices, as occurred during 2008 and 2015. In this market, profit-taking in response to price gains tends to be outweighed by purchasing into low prices, leading to a natural accumulation of metal over time.
In contrast, ETF investment has historically been associated with rising prices: strong investment in US and European funds over the 2008–2010 period occurred at a time when the dollar-denominated platinum price was generally increasing, while the peak of South African buying in 2013 and early 2014 occurred during a period of rand depreciation that boosted platinum prices in local terms. As a result, many ETF investors are ‘out of the
money’, and this has placed a natural cap on redemptions. However, unlike the Japanese bar market, ETFs are not a market of natural accumulation, as shown by heavy profit-taking in palladium ETFs over the last three years.
Looking forward, we are unlikely to see any widespread profit-taking in ETFs this year unless there are significant gains in price. On the other hand, while platinum continues to trade between $900 and $1,000 per ounce – as it did for almost the whole of 2017 – the conditions are not in place for a return to strong buying by either ETF investors or Japanese bar purchasers. Assuming that investment demand in 2018 is similar to last year, the market is likely to remain in modest surplus.

PGM MARKET REPORT FEBRUARY 2018
14
Precious Metals Management
Summary of PalladiumSUPPLY & DEMAND IN 2017
The use of palladium in autocatalysts surged by nearly half a million ounces in 2017, setting a new record of 8.4 million oz. With purchasing by chemicals producers also at historical highs, and a sharp fall in the rate of redemptions by ETF investors, total palladium demand rose by 8% to 10.15 million oz. Although there was significant growth in the recovery of palladium from scrapped autocatalysts, world mine supplies fell slightly, leaving combined primary and secondary shipments up only modestly. As a result, the market deficit widened to over 600,000 oz.
We estimate that world primary supplies of palladium declined by 2% in 2017, reflecting lower shipments from Russia following sales from inventory the previous year, and weaker output in North America, where there have been some changes in the route to market for producers in the region; this has contributed to fluctuations in pipeline inventory.
Supplies of palladium from South Africa were stable in 2017, despite a new round of mine closures, and a number of maintenance outages and technical problems at processing plants, which caused a build-up in stocks of unrefined palladium at the year end (see pages 1–2). This metal will be processed during 2018.
Russian supplies have also been affected by some fluctuations in the amount of palladium in work-in-process over the last year. During the first quarter of 2017, refined production from Norilsk Nickel was affected by a reconfiguration of the company’s processing flowsheet, involving the closure of the nickel smelter at the Norilsk mine site and the transfer of most nickel and pgm processing activities to the Kola Peninsula. However, output recovered in subsequent quarters, leaving palladium production from the group’s Russian operations up on the previous year during the first nine months of 2017.
It is likely that the processing of pgm from some above-ground materials contributed to this gain. In December 2016, Norilsk Nickel entered into a transaction with the state-controlled corporation Rostec to purchase 1.5 million tonnes of old copper concentrate that derived from mining activities in the Norilsk area during the Soviet period. The refining of this material has helped compensate for a decline in the recovery of pgm from stored
pyrrhotite concentrate, stocks of which have now been depleted.
However, although production rose, we estimate that Russian supplies fell last year; our 2016 figure was inflated by the inclusion of sales from refined stocks of palladium that Norilsk had accumulated the previous year.
Norilsk Nickel announced last November that total holdings in its Global Palladium Fund could amount to as much as 600,000 oz by the end of 2017. The fund purchases palladium from Russia’s Central Bank and other market
• Primary palladium supplies fell by 2%, but this was balanced by sharp growth in auto recycling.
• Gross palladium consumption rose by 8%, as autocatalyst demand surged to an all-time high.
• Global gasoline car sales rose 1.5%, while US catalyst loadings were boosted by Tier 3 legislation.
• Buoyant demand from the Chinese chemicals industry kept industrial consumption firm.
• Investment was negative for a third year in a row, but the volume of liquidation fell.
• The market remained in large fundamental deficit, reflected in poor liquidity and higher prices.
SUMMARY: PALLADIUM
Palladium Supply and Demand ‘000 oz
Supply 2015 2016 20179
South Africa 2,684 2,574 2,569
Russia 2,434 2,773 2,652
Others 1,337 1,413 1,376
Total Supply 6,455 6,760 6,597
Gross Demand
Autocatalyst 7,622 7,948 8,424
Jewellery 222 191 180
Industrial 1,956 1,877 1,934
Investment -659 -646 -386
Total Gross Demand 9,141 9,370 10,152
Recycling -2,418 -2,503 -2,926
Total Net Demand 6,723 6,867 7,226
Movements in Stocks -268 -107 -629

PGM MARKET REPORT FEBRUARY 2018
15
Precious Metals Management
participants, with the aim of easing market shortages and guaranteeing metal availability for customers. It should be noted that market purchases by Norilsk Nickel are considered to represent a change in ownership of existing market stocks, so they do not feature in our supply or demand estimates, and do not affect our estimate of the market balance.
Secondary supplies of palladium surged in 2017, as scrap autocatalyst volumes bounced back following two years of weak activity in this sector. At the same time, the palladium content of scrap continued to rise, reflecting the dramatic increase in palladium use that occurred over the 1995–2005 period, as many automakers moved away from platinum in three-way catalysis. The fastest growth was seen in North America, the first region to make widespread use of palladium catalysts, starting in the mid-1990s. Although emissions legislation was significantly less strict than today, palladium catalyst technology was also much less advanced, and palladium loadings were often extremely high by modern standards.
Despite growth in recycling, combined primary and secondary supplies rose by less than 3%. In contrast, demand climbed by 8%, or nearly 800,000 oz, as autocatalyst consumption soared to an all-time high and ETF redemptions fell. Meanwhile, buoyant demand from the chemicals sector contributed to a firm picture for industrial demand in 2017, despite continued gradual erosion of demand in the electrical and dental sectors.
Palladium purchasing by the chemicals industry was exceptionally strong in 2017, with demand robust in all regions and at record levels in China, where the government’s ‘Made in China 2025’ initiative – designed to reduce the country’s reliance on imports of chemical feedstocks – has stimulated massive investment in new integrated petrochemical facilities.
Palladium catalysts are used in a wide range of chemical processes, ranging from bulk petrochemicals to speciality products such as pharmaceuticals. Historically, palladium’s largest single use in the chemicals sector was in the production of purified terephthalic acid (PTA), an intermediate that is used to make polyethylene terephthalate (PET) for textiles and packaging applications. However, in the last few years there has been dramatic growth in several other bulk chemicals processes that use palladium catalysts.
These include the manufacture of hydrogen peroxide, used in paper-making, waste water treatment and as a chemical intermediate; mono ethylene gycol (MEG), using a process known as ‘coal to MEG’, or CTMEG; and caprolactam, an intermediate used in nylon production.
Global demand for hydrogen peroxide is estimated to be rising at over 5%, with growth concentrated in Asia and particularly in China. Environmental concerns are encouraging the replacement of plastic with paper in packaging applications, and stimulating the treatment of waste water, lifting requirements for hydrogen peroxide as a bleaching and oxidation agent. There is also growing demand for hydrogen peroxide as a feedstock in the production of propylene oxide. The primary use of propylene oxide is the production of polyether polyols
Secondary supplies of palladium surged as auto scrap volumes bounced back.
Chemicals industry demand was stimulated by the Made in China 2025 initiative.

PGM MARKET REPORT FEBRUARY 2018
16
Precious Metals Management
used in the synthesis of polyurethanes, which find application in a wide range of consumer products.
Last year saw exceptionally strong investment in new CTMEG capacity in China, with the aim of reducing the country’s reliance on ethylene glycol imports. MEG is usually produced from oil using a non-pgm catalyst. However, because China has abundant coal supplies but is a net oil importer, it has invested heavily in CTMEG plants, which require a palladium catalyst. Demand for this application was particularly strong in 2017, but going forward we expect to see a slowdown in CTMEG capacity additions.
Last year saw Chinese chemical companies invest heavily in caprolactam production capacity via the hydroxylamine phosphate oxime (HPO) process, after a pause in plant construction in 2016. Caprolactam is used to make nylon, which is best known for its use in fabrics. However, it also finds growing use in industrial applications such as lightweight composite nylon resins for automotive components, plastics for 3D printing, and nylon ‘tyre cords’ which improve the performance and durability of vehicle tyres.
Demand for palladium in autocatalysts also saw exceptionally strong growth, rising by 6% to set another all-time high of 8.42 million oz – up nearly half a million ounces in a single year. While China and the Rest of World region posted significant gains, the strongest growth came from North America, where a 5% drop in production of cars and light trucks was easily outweighed by growth in palladium loadings on both diesel and gasoline vehicle catalysts.
These higher loadings were associated with US Tier 3 Federal emissions regulations, implementation of which began in 2017 and will extend to 2025. Under this legislation, automakers are able to certify their vehicles to a range of different benchmarks, or ‘bins’, as long as they comply with fleet average emissions limits that become progressively tighter each year. This has already resulted in an increase in the number of vehicles equipped with catalyst systems capable of meeting the 2025 SULEV30 target. This had a significant impact on palladium demand last year, with average loadings on US gasoline cars rising at double-digit rates.
In the USA, emissions limits are identical for both diesel and gasoline vehicles, so the light duty diesel sector also saw growth in pgm loadings as Tier 3 standards began to take effect. In this region, the use of diesel engines in the light duty segment is mainly restricted to the heaviest categories of vehicles, such as large pick-up trucks and sports utility vehicles. This means that almost all US diesels use SCR technology rather than LNTs for NOx control. Nevertheless, because of vehicle size and weight, loadings are substantially higher than for European diesels, while the technical detail of US legislation tends to favour additional palladium use in diesel. The platinum:palladium ratio on North American diesel catalysts is now close to 1:1, compared with over 3:1 in other light duty diesel markets.
Average loadings on US gasoline cars rose at double-digit rates.
Palladium Demand: Industrial ‘000 oz
2015 2016 20179
Chemical 451 425 537
Dental 468 430 407
Electrical 903 871 853
Other 134 151 137
Total 1,956 1,877 1,934

PGM MARKET REPORT FEBRUARY 2018
Overall, the use of palladium on North American vehicles rose by 8% to a new record of 2.12 million oz. Nevertheless, the Chinese market retained its position as the world’s largest palladium consumer, with autocatalyst demand up 6% to 2.16 million oz. This gain was primarily a result of an increase in palladium loadings, following the nationwide implementation of China 5
emissions limits for gasoline vehicles starting in January 2017. Changes in vehicle production volumes had only a modest impact on demand: growth slowed to low single-digit rates, in the wake of a 16% gain the previous year.
Investment demand was negative for a third consecutive year in 2017, although the volume of liquidation was lower than in 2015–2016. European holdings saw a bout of heavy disinvestment in January, when palladium gained more than $100/oz over a two-week period, and investors responded by selling over 150,000 oz. There was further selling in mid-year, but this liquidation was partly reversed by heavy South African buying in August. During the final quarter, the rand-denominated palladium price reached a series of all-time highs, and this triggered sustained liquidation by South African investors.
Most physical palladium investment occurs in the form of ETFs, but small quantities of palladium coins are produced by national mints. Last year the US Mint issued a palladium version of its Eagle coin for the first time, but this new demand was partly offset by the return of some old palladium coins and small bars to the market by investors cashing in as palladium prices approached record levels.
Over the past three years, investors have returned nearly 1.7 million oz of palladium to the market, helping to support market liquidity at a time of booming autocatalyst demand and lacklustre primary supply. However, during 2017, the persistent market deficits of the last six years began to have a significant impact on the market, with palladium rising from
under $700 per ounce at the beginning of the year to trade either side of $1,000 during the final quarter, at a premium to platinum for the first time in sixteen years. Traders reported periodic difficulty in sourcing ingot, and this tightness was reflected in a sharp increase in lease rates, which spiked over 15% in mid-year. Although availability improved slightly in the second half of 2017, the market remained tight, with lease rates consistently above 5%.
Based on our supply and demand estimates, we calculate that between 2012 and 2017, around 4.3 million oz of palladium was consumed from market stocks. This is supported by analysis of trade data, which provides compelling evidence for a market in large fundamental deficit: net withdrawals from Swiss and UK inventories
17
Precious Metals Management
Palladium traded at a premium to platinum for the first time in sixteen years.
Palladium Demand: Autocatalyst ‘000 oz
Gross Recycling Net
2015 2016 20179 2015 2016 20179 2015 2016 20179
Europe 1,613 1,640 1,665 -413 -424 -489 1,200 1,216 1,176
Japan 760 792 805 -106 -110 -122 654 682 683
North America 2,032 1,956 2,121 -1,110 -1,152 -1,443 922 804 678
China 1,654 2,036 2,164 -56 -75 -100 1,598 1,961 2,064
Rest of World 1,563 1,524 1,669 -212 -240 -269 1,351 1,284 1,400
Total 7,622 7,948 8,424 -1,897 -2,001 -2,423 5,725 5,947 6,001

PGM MARKET REPORT FEBRUARY 2018
totalled at least 7 million oz over this six-year period (see the graph on page 19). Although part of this inventory movement may reflect a movement in palladium stocks from west to east, it is clear that the market overhang that was created by Russian government sales during the 1990s and early 2000s is being consumed at an unsustainable rate.
Precious Metals Management
18

PGM MARKET REPORT FEBRUARY 2018
19
Precious Metals Management
Outlook for PalladiumSUPPLY & DEMAND IN 2018
Following significant growth in gross autocatalyst demand and recycling in 2017, we expect this year to see much smaller changes in palladium fundamentals. Combined primary and secondary supplies are expected to rise by around 2%, while demand in ‘consuming applications’ (excluding investment) is predicted to rise by around half that rate. The market will almost certainly remain in deficit, but the size of the shortfall will be determined primarily by the investment sector, where demand has been negative for the last three years.
Palladium ETF holdings peaked at around 3 million ounces between mid-2014 and mid-2015, but since then selling has been heavy and prolonged. Investors have taken advantage of a steep rise in palladium prices to take profits, with the result that holdings fell to around 1.3 million oz at the end of December 2017.
Given recent price rises to over $1,000/oz, it is likely that most remaining palladium investors are ‘in the money’, but it is difficult to predict how they will respond to price movements over the next year. Our view is that there is still potential for further profit-taking, but it may be that remaining ETF holders are prepared to wait for higher prices before they liquidate their holdings. There is also scope for rising prices to stimulate fresh interest among investors; prior to 2015, palladium ETF investment was positively correlated with price.
Primary supplies may rise slightly, reflecting a release of pipeline stocks in South Africa, but the outlook for mine production remains lacklustre, with potential for further shaft closures.
Only in North America is there scope for near-term expansion: Sibanye-Stillwater’s output should rise this year as the Blitz project begins to make a significant contribution, while North American Palladium has returned to full-time mill operations and should see higher palladium production in 2018 as a result.
Norilsk Nickel expects its output to remain flat over the 2017–2020 period. There is some prospect of expansion in the longer term, if a project to develop the ‘Southern Cluster’ goes ahead. A feasibility study is being conducted, and the results are due to be announced in 2018, but this project is unlikely to contribute to supplies within the next five years.
The recovery of palladium from scrapped catalytic converters is forecast to expand again, although at
• North American mine expansions and growth in auto recycling will lift total supplies.
• Auto demand will hit a new all-time high, in line with modest growth in gasoline vehicle output.
• Petrochemical expansions in China will underpin industrial palladium consumption.
• The palladium market will remain in large deficit, even if ETF investors continue to take profits.
OUTLOOK: PALLADIUM

PGM MARKET REPORT FEBRUARY 2018
Precious Metals Management
20
a lower rate than in 2017. Growth will again be concentrated in North America, where automakers were the first to make widespread use of palladium in three-way catalysts, and where loadings in the early 2000s were particularly high. We also expect to see a ramp-up in autocatalyst recovery in China, albeit from a low base, reflecting the extraordinary growth in palladium use over the last fifteen years. As a result, combined primary and secondary supplies should grow by around 2%.
Demand in ‘consuming applications’, i.e. excluding investment, should increase modestly, although the final total will depend upon the timing of purchases by the Chinese chemicals industry. The government’s ‘Made in China 2025’ initiative – designed to reduce the country’s reliance on imports of chemical feedstocks – has stimulated massive investment in new integrated petrochemical facilities, and some of these plants will begin to come on-stream over the next two years. Overall palladium demand from the chemicals industry may fall slightly short of the exceptional total seen in 2017, but is predicted to remain well above historical levels.
The use of palladium in autocatalysts is expected to hit another all-time high, on the back of modest growth in global production of gasoline vehicles. Average palladium loadings on gasoline vehicles are predicted to be broadly flat in 2018, but legislative change in Europe and China is expected to have a significant impact in the coming years.
In Europe, the phased implementation of RDE testing under Euro 6d-TEMP and Euro 6d is expected to be positive for palladium loadings on gasoline vehicles: from September 2018, all new vehicles must meet a particle number conformity factor of 1.5, while the NOx conformity factor of 2.1 will apply to all new cars starting in September 2019. Chinese manufacturers are also gearing up to meet new legislation: China 6a is scheduled for implementation in July 2020, but some provinces will move directly to the stricter China 6b limits (although initially without the RDE component).
Other palladium applications are expected to experience some thrifting, in particular dental – where demand could fall below 400,000 oz for the first time in our historical demand series – and electronics, where miniaturisation and substitution with base metals
continues to erode palladium usage. Jewellery demand is likely to stabilise, now that Chinese fabrication has almost completely disappeared; the use of palladium is mainly confined to platinum jewellery alloys in Japan, and white gold alloys in most major jewellery markets, although there is still a small market for men’s palladium jewellery in North America and Europe.
While total demand in industrial and autocatalyst applications is expected to rise at a slower rate than combined primary and secondary supply, the market is forecast to remain in significant deficit. The behaviour of ETF investors will be critical to determining the size of the shortfall, but even if they continue to take profits, this is unlikely to be enough to bring the market into balance.
Combined primary and secondary supplies should grow by around 2%.
The behaviour of ETF investors will determine the size of the shortfall in 2018.
PGM MARKET REPORT FEBRUARY 2018
21
Precious Metals Management
Rhodium Summary & OutlookSUPPLY & DEMAND: 2017/18
Gross demand for rhodium increased by 3.5% in 2017, reflecting growth in global output of gasoline vehicles, and higher loadings on North American cars. Consumption in the chemical and glass sectors was also buoyant, but investment demand turned negative. Combined primary and secondary supplies rose by 3%, with lower sales by primary rhodium producers more than offset by an increase in autocatalyst recycling. Although the market remained in fundamental surplus, liquidity was reduced by speculative and strategic purchasing, and the rhodium price doubled during 2017 to a six-year high of over $1,700/oz.
Supplies of rhodium fell slightly in 2017, despite another strong year for South African producers, who continued to reduce stocks of work-in-progress at their smelters and refineries. In contrast, rhodium output at Norilsk Nickel is thought to have declined sharply in 2017, following the depletion of stocks of stored pyrrhotite concentrate, which the company has been reprocessing over the last few years, and which were relatively rich in rhodium. While the company continues to supplement mine production with the treatment of above-ground materials, notably stocks of old copper concentrate purchased from Rostec in December 2016, we believe that these contain only small amounts of rhodium.
Secondary supplies, almost entirely from autocatalyst scrap, rose by nearly 20% last year. Growth was particularly strong in North America, as the number of vehicles dismantled rose sharply after two years of unusually muted activity in the auto recycling market. Rising recoveries also reflect the steep increase in rhodium usage in three-way catalysts that occurred during the early 2000s: global rhodium demand rose from just over 500,000 oz in 1999 to an all-time record of around 880,000 oz in 2007. Although emissions limits were less strict than they are today, average rhodium loadings were substantially higher; it was only after the 2007−2008 price spike that automakers ramped up their efforts to thrift the rhodium content of three-way catalysts. A large proportion of vehicles dismantled during 2017 were built during this eight-year period when rhodium loadings reached their peak.
Combined primary and secondary supplies rose by around 3%, while gross demand expanded at a slightly faster rate to an all-time-record 1.05 million oz. The auto sector remained the primary driver of demand growth, with light duty vehicle output rising in all major markets except North America. Globally, gasoline car production increased by over
2% to exceed 75 million units.
Demand for rhodium in autocatalysts broadly reflected changes in light duty gasoline vehicle production, except in the USA, where the implementation of Tier 3 Federal emissions legislation boosted average pgm loadings on gasoline cars. US legislation is unusual in that it enables automakers to certify vehicles to a range of different standards, as long as they comply with fleet
• A fall in primary rhodium shipments was offset by sharp growth in autocatalyst recovery in 2017.
• Rhodium demand was boosted by growth in gasoline car output plus higher US loadings.
• The market remained in surplus but speculative and strategic purchasing absorbed liquidity.
• Supply and demand will be little changed in 2018.
• Tighter emissions limits are set to lift auto demand significantly over the next few years.
SUMMARY: RHODIUM
Rhodium Supply and Demand ‘000 oz
Supply 2015 2016 20179
South Africa 611 615 618
Russia 80 85 65
Others 62 72 67
Total Supply 753 772 750
Gross Demand
Autocatalyst 762 822 858
Other 158 191 190
Total Gross Demand 920 1,013 1,048
Recycling -262 -271 -324
Total Net Demand 658 742 724
Movements in Stocks 95 30 26

PGM MARKET REPORT FEBRUARY 2018
Precious Metals Management
22
average emissions limits that tighten progressively between 2017 and 2025. There has already been a significant increase in the number of vehicles equipped with heavily-loaded catalyst systems meeting the 2025 SULEV30 target, and this has had a marked impact on the average rhodium content of US vehicles. We estimate that rhodium usage in this market rose by 5% despite a sharp fall in US production of gasoline cars.
Although North America loadings are typically as much as 50% higher than in other major vehicle markets – a function of differences in emissions legislation and greater average vehicle size – it is only the second largest regional consumer of rhodium. China remains by far the biggest regional producer of gasoline vehicles and consequently the world’s leading user of rhodium in autocatalysts. Demand in China also rose by around 5% last year, reflecting a modest increase in gasoline car output accompanied by a marginal uplift in the average rhodium content of a vehicle.
The use of rhodium in chemical, glass, electrical and other applications was flat in 2017. Demand from chemical and glass producers was unusually robust, primarily as a result of strong buying by Chinese companies, both for domestic expansions and for overseas plants. However, this was partly offset by negative investment demand, as holders of ETFs took advantage of the steep rise in rhodium prices in order to take profits.
Despite overall demand growth, the market remained in a modest surplus in 2017. However, availability of rhodium tightened significantly, reflecting speculative and strategic purchasing of rhodium, especially in Asia. We do not count this in our demand figures, as it cannot be attributed to a specific industry, and occurred outside measurable investment media such as ETFs. Because the rhodium market is relatively small and illiquid, this purchasing had a very significant impact on prices, which more than doubled during 2017, reaching a six-year peak of $1,715 at the time of writing.
Looking forward, we expect to see little change to the fundamental supply−demand picture in 2018. Supplies are expected to be flat to slightly down; mine output in South Africa will be impacted by last year’s mine closures, although refined production should be supported by the processing of metal from pipeline stocks. However, this is likely to be the last year in which rhodium output can be sustained in this way, and shipments from South Africa could fall back below 600,000 oz per annum in the near term. Meanwhile, autocatalyst recycling should rise, although at a much lower rate than in 2017.
In 2017, gross demand rose to an all-time record of 1.05 million ounces.

PGM MARKET REPORT FEBRUARY 2018
Precious Metals Management
23
Demand is expected to be stable in 2018. We do not expect any significant changes in average rhodium loadings on gasoline vehicles this year, so consumption trends will reflect the rate of growth in gasoline car production – forecast at around 2%. These gains will be offset by a fall in rhodium usage on diesel vehicles in Europe, where fewer cars will be equipped with rhodium-containing lean NOx traps.
Beyond 2018, we expect to see an upward trend in rhodium loadings, as legislation tightens in most major automotive markets. In Europe, automakers are predicted to increase rhodium loadings to comply with Euro 6d-TEMP and Euro 6d legislation, which imposes a NOx conformity factor of 2.1 on all new cars starting in 2019. This conformity
factor falls to 1.5 starting in 2020. In North America, fleet average emissions limits will fall steadily over the period to 2025, while China is entering a period of major legislative change with the introduction of China 6a and 6b regulations over the 2020−2023 period. Some provinces are expected to move directly to the stricter 6b limits (although initially without the RDE component), and this will have a significant impact on average rhodium loadings in the coming years.
The prospect of further increases in automotive demand may stimulate further speculative and strategic buying. If this should occur, rhodium availability would remain tight, even though our supply−demand estimates suggest that the market is likely to remain in a modest surplus in 2018.

PGM MARKET REPORT FEBRUARY 2018
Precious Metals Management
24
PLATINUM ‘000 oz - Supply and Demand
2017 Numbers are Preliminary Estimates9
2012 2013 2014 2015 2016 2017
Supply1 South Africa 4,110 4,208 3,547 4,572 4,392 4,364
Russia2 801 736 700 670 703 650
North America 306 318 339 314 337 318
Zimbabwe3 337 410 401 400 489 486
Others3 126 174 167 151 162 158
Total Supply 5,680 5,846 5,154 6,107 6,083 5,976
Demand4 Autocatalyst4 3,158 2,937 3,057 3,228 3,327 3,285
Chemical 452 522 576 502 527 521
Electrical4 176 219 225 228 230 258
Glass 153 102 143 227 246 306
Investment 450 871 277 451 620 356
Jewellery4 2,783 2,984 2,839 2,746 2,412 2,227
Medical and Biomedical5 223 217 214 215 218 220
Petroleum 112 146 172 140 176 198
Other 395 419 434 441 458 475
Total Gross Demand 7,902 8,417 7,937 8,178 8,214 7,846
Recycling6 Autocatalyst -1,120 -1,199 -1,280 -1,112 -1,159 -1,322
Electrical -22 -24 -27 -29 -32 -34
Jewellery -895 -790 -762 -574 -738 -624
Total Recycling -2,037 -2,013 -2,069 -1,715 -1,929 -1,980
Total Net Demand7 5,865 6,404 5,868 6,463 6,285 5,866
Movement in Stocks8 -185 -558 -714 -356 -202 110
PGM MARKET REPORT FEBRUARY 2018
Precious Metals Management
25
PLATINUM ‘000 oz - Gross Demand by Region
2017 Numbers are Preliminary Estimates9
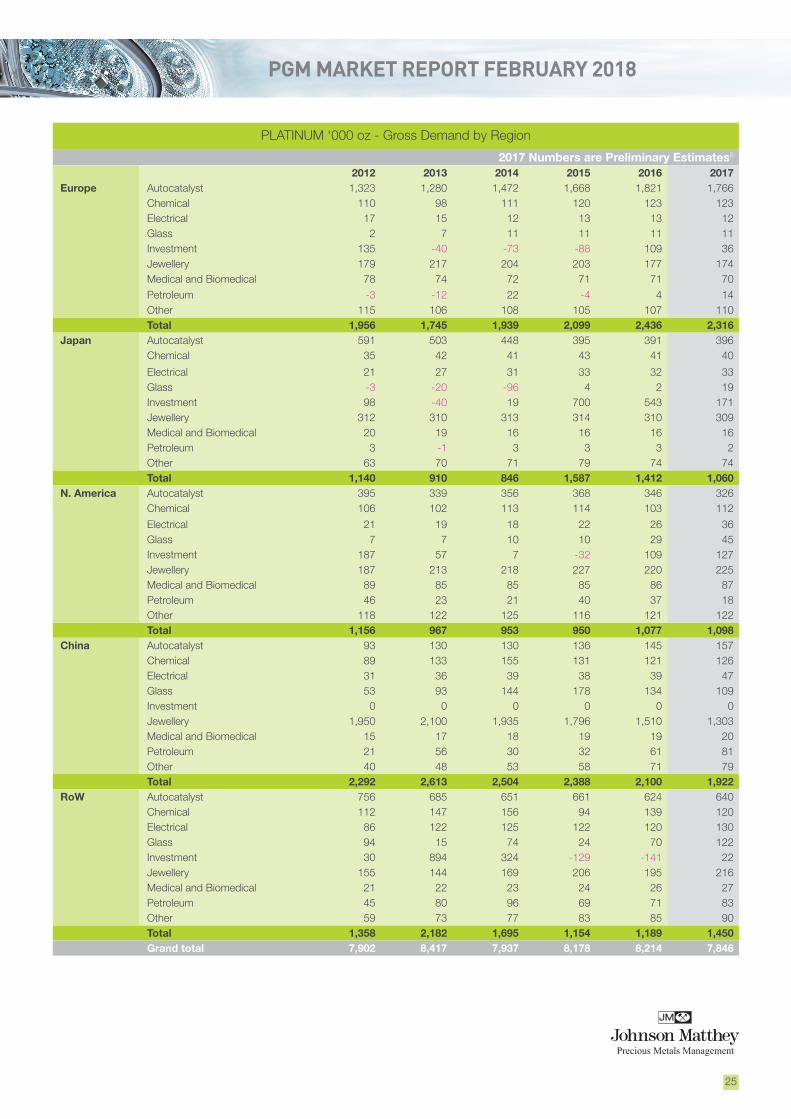
2012 2013 2014 2015 2016 2017Europe Autocatalyst 1,323 1,280 1,472 1,668 1,821 1,766
Chemical 110 98 111 120 123 123 Electrical 17 15 12 13 13 12 Glass 2 7 11 11 11 11 Investment 135 -40 -73 -88 109 36 Jewellery 179 217 204 203 177 174 Medical and Biomedical 78 74 72 71 71 70
Petroleum -3 -12 22 -4 4 14 Other 115 106 108 105 107 110 Total 1,956 1,745 1,939 2,099 2,436 2,316
Japan Autocatalyst 591 503 448 395 391 396 Chemical 35 42 41 43 41 40
Electrical 21 27 31 33 32 33 Glass -3 -20 -96 4 2 19 Investment 98 -40 19 700 543 171 Jewellery 312 310 313 314 310 309 Medical and Biomedical 20 19 16 16 16 16 Petroleum 3 -1 3 3 3 2 Other 63 70 71 79 74 74 Total 1,140 910 846 1,587 1,412 1,060
N. America Autocatalyst 395 339 356 368 346 326 Chemical 106 102 113 114 103 112
Electrical 21 19 18 22 26 36 Glass 7 7 10 10 29 45 Investment 187 57 7 -32 109 127 Jewellery 187 213 218 227 220 225 Medical and Biomedical 89 85 85 85 86 87 Petroleum 46 23 21 40 37 18 Other 118 122 125 116 121 122 Total 1,156 967 953 950 1,077 1,098
China Autocatalyst 93 130 130 136 145 157 Chemical 89 133 155 131 121 126 Electrical 31 36 39 38 39 47 Glass 53 93 144 178 134 109 Investment 0 0 0 0 0 0 Jewellery 1,950 2,100 1,935 1,796 1,510 1,303 Medical and Biomedical 15 17 18 19 19 20 Petroleum 21 56 30 32 61 81 Other 40 48 53 58 71 79 Total 2,292 2,613 2,504 2,388 2,100 1,922
RoW Autocatalyst 756 685 651 661 624 640 Chemical 112 147 156 94 139 120 Electrical 86 122 125 122 120 130 Glass 94 15 74 24 70 122 Investment 30 894 324 -129 -141 22 Jewellery 155 144 169 206 195 216 Medical and Biomedical 21 22 23 24 26 27 Petroleum 45 80 96 69 71 83 Other 59 73 77 83 85 90 Total 1,358 2,182 1,695 1,154 1,189 1,450 Grand total 7,902 8,417 7,937 8,178 8,214 7,846

PGM MARKET REPORT FEBRUARY 2018
Precious Metals Management
26
PLATINUM Tonnes - Supply and Demand
2017 Numbers are Preliminary Estimates9
2012 2013 2014 2015 2016 2017
Supply1 South Africa 127.8 130.9 110.3 142.2 136.6 135.7
Russia2 24.9 22.9 21.8 20.8 21.9 20.2
North America 9.5 9.9 10.5 9.8 10.5 9.9
Zimbabwe3 10.5 12.7 12.5 12.4 15.2 15.1
Others3 3.9 5.4 5.2 4.7 5.0 4.9
Total Supply 176.6 181.8 160.3 189.9 189.2 185.8
Demand4 Autocatalyst4 98.2 91.2 95.0 100.5 103.6 102.2
Chemical 14.1 16.3 18.0 15.5 16.4 16.1
Electrical4 5.5 6.8 7.1 7.1 7.1 8.0
Glass 4.7 3.2 4.4 6.9 7.7 9.5
Investment 13.9 27.2 8.6 14.1 19.3 11.1
Jewellery4 86.6 92.8 88.4 85.5 75.0 69.2
Medical and Biomedical5 7.0 6.7 6.6 6.6 6.8 6.8
Petroleum 3.5 4.5 5.4 4.4 5.5 6.2
Other 12.3 13.1 13.6 13.8 14.2 14.8
Total Gross Demand 245.8 261.8 247.1 254.4 255.6 243.9
Recycling6 Autocatalyst -34.9 -37.3 -39.9 -34.5 -36.1 -41.1
Electrical -0.7 -0.7 -0.8 -0.9 -1.0 -1.0
Jewellery -27.9 -24.6 -23.7 -17.9 -23.0 -19.4
Total Recycling -63.5 -62.6 -64.4 -53.3 -60.1 -61.5
Total Net Demand7 182.3 199.2 182.7 201.1 195.5 182.4
Movement in Stocks8 -5.7 -17.4 -22.4 -11.2 -6.3 3.4

PGM MARKET REPORT FEBRUARY 2018
Precious Metals Management
27
PLATINUM Tonnes - Gross Demand by Region
2017 Numbers are Preliminary Estimates9
2012 2013 2014 2015 2016 2017Europe Autocatalyst 41.1 39.8 45.8 51.9 56.7 55.0
Chemical 3.4 3.0 3.5 3.7 3.8 3.8 Electrical 0.5 0.5 0.4 0.4 0.4 0.4 Glass 0.1 0.2 0.3 0.3 0.3 0.3 Investment 4.2 -1.2 -2.3 -2.7 3.4 1.1Jewellery 5.6 6.8 6.4 6.3 5.5 5.4 Medical and Biomedical 2.4 2.3 2.2 2.2 2.2 2.2 Petroleum -0.1 -0.4 0.7 -0.1 0.1 0.4 Other 3.6 3.3 3.4 3.3 3.3 3.4 Total 60.8 54.3 60.4 65.3 75.7 72.0
Japan Autocatalyst 18.4 15.6 13.9 12.3 12.2 12.3 Chemical 1.1 1.3 1.3 1.3 1.3 1.2 Electrical 0.6 0.8 1.0 1.0 1.0 1.0 Glass -0.1 -0.6 -3.0 0.1 0.1 0.6 Investment 3.0 -1.2 0.6 21.8 16.9 5.3Jewellery 9.7 9.6 9.7 9.8 9.6 9.6 Medical and Biomedical 0.6 0.6 0.5 0.5 0.5 0.5 Petroleum 0.1 0.0 0.1 0.1 0.1 0.1 Other 2.0 2.2 2.2 2.5 2.3 2.3 Total 35.4 28.3 26.3 49.4 44.0 32.9
N. America Autocatalyst 12.3 10.5 11.1 11.5 10.8 10.1 Chemical 3.3 3.2 3.5 3.5 3.2 3.5 Electrical 0.7 0.6 0.6 0.7 0.8 1.1 Glass 0.2 0.2 0.3 0.3 0.9 1.4 Investment 5.8 1.8 0.2 -1.0 3.4 4.0Jewellery 5.8 6.6 6.8 7.1 6.8 7.0 Medical and Biomedical 2.8 2.6 2.6 2.6 2.7 2.7 Petroleum 1.4 0.7 0.7 1.2 1.2 0.6 Other 3.7 3.8 3.9 3.6 3.8 3.8 Total 36.0 30.0 29.7 29.5 33.6 34.2
China Autocatalyst 2.9 4.0 4.0 4.2 4.5 4.9 Chemical 2.8 4.2 4.8 4.1 3.8 3.9 Electrical 1.0 1.1 1.2 1.2 1.2 1.5 Glass 1.6 2.9 4.5 5.5 4.2 3.4 Investment 0.0 0.0 0.0 0.0 0.0 0.0 Jewellery 60.7 65.3 60.2 55.9 47.0 40.5 Medical and Biomedical 0.5 0.5 0.6 0.6 0.6 0.6 Petroleum 0.7 1.7 0.9 1.0 1.9 2.5 Other 1.2 1.5 1.7 1.8 2.2 2.5 Total 71.4 81.2 77.9 74.3 65.4 59.8
RoW Autocatalyst 23.5 21.3 20.2 20.6 19.4 19.9 Chemical 3.5 4.6 4.9 2.9 4.3 3.7 Electrical 2.7 3.8 3.9 3.8 3.7 4.0 Glass 2.9 0.5 2.3 0.7 2.2 3.8 Investment 0.9 27.8 10.1 -4.0 -4.4 0.7Jewellery 4.8 4.5 5.3 6.4 6.1 6.7 Medical and Biomedical 0.7 0.7 0.7 0.7 0.8 0.8 Petroleum 1.4 2.5 3.0 2.2 2.2 2.6 Other 1.8 2.3 2.4 2.6 2.6 2.8 Total 42.2 68.0 52.8 35.9 36.9 45.0Grand total 245.8 261.8 247.1 254.4 255.6 243.9

PGM MARKET REPORT FEBRUARY 2018
Precious Metals Management
28
PALLADIUM ‘000 oz - Supply and Demand
2017 Numbers are Preliminary Estimates9
2012 2013 2014 2015 2016 2017
Supply1 South Africa 2,359 2,464 2,125 2,684 2,574 2,569
Russia: Primary2 2,627 2,528 2,589 2,434 2,773 2,652
Russia: State Stock Sales2 260 100 0 0 0 0
North America 811 831 912 874 892 865
Zimbabwe3 266 322 327 319 392 381
Others3 162 152 160 144 129 130
Total Supply 6,485 6,397 6,113 6,455 6,760 6,597
Demand4 Autocatalyst4 6,673 7,069 7,515 7,622 7,948 8,424
Chemical 524 378 315 451 425 537
Dental 510 457 464 468 430 407
Electrical4 1,190 1,017 970 903 871 853
Investment 467 -8 943 -659 -646 -386
Jewellery4 442 354 272 222 191 180
Other 104 109 111 134 151 137
Total Gross Demand 9,910 9,376 10,590 9,141 9,370 10,152
Recycling6 Autocatalyst -1,675 -1,899 -2,185 -1,897 -2,001 -2,423
Electrical -443 -463 -474 -475 -481 -482
Jewellery -194 -157 -89 -46 -21 -21
Total Recycling -2,312 -2,519 -2,748 -2,418 -2,503 -2,926
Total Net Demand7 7,598 6,857 7,842 6,723 6,867 7,226
Movement in Stocks8 -1,113 -460 -1,729 -268 -107 -629

PGM MARKET REPORT FEBRUARY 2018
Precious Metals Management
29
PALLADIUM ‘000 oz - Gross Demand by Region
2017 Numbers are Preliminary Estimates9
2012 2013 2014 2015 2016 2017Europe Autocatalyst 1,427 1,502 1,583 1,613 1,640 1,665
Chemical 79 71 -23 77 80 82 Dental 81 80 77 70 66 60 Electrical 151 112 113 101 99 95 Investment 163 -14 -74 -200 -269 -287 Jewellery 64 61 60 59 58 57 Other 24 24 25 27 22 22 Total 1,989 1,836 1,761 1,747 1,696 1,694
Japan Autocatalyst 799 782 794 760 792 805 Chemical 17 18 16 15 15 15 Dental 220 184 205 227 200 191 Electrical 320 220 212 231 227 222 Investment 0 -4 -2 4 -3 -3 Jewellery 70 70 67 66 64 61 Other 9 9 9 9 9 9 Total 1,435 1,279 1,301 1,312 1,304 1,300
N. America Autocatalyst 1,803 1,770 1,963 2,032 1,956 2,121 Chemical 87 68 71 76 76 78 Dental 190 168 156 145 138 130 Electrical 163 159 140 131 128 124 Investment 304 10 -205 -181 -71 -19 Jewellery 44 43 44 41 38 34 Other 39 43 43 60 46 47 Total 2,630 2,261 2,212 2,304 2,311 2,515
China Autocatalyst 1,325 1,499 1,608 1,654 2,036 2,164 Chemical 213 144 160 208 169 265 Dental 3 8 8 8 7 7 Electrical 176 168 170 158 156 156 Investment 0 0 0 0 0 0 Jewellery 238 155 78 34 10 9 Other 14 15 16 17 41 44 Total 1,969 1,989 2,040 2,079 2,419 2,645
RoW Autocatalyst 1,319 1,516 1,567 1,563 1,524 1,669 Chemical 128 77 91 75 85 97 Dental 16 17 18 18 19 19 Electrical 380 358 335 282 261 256 Investment 0 0 1,224 -282 -303 -77 Jewellery 26 25 23 22 21 19 Other 18 18 18 21 33 15 Total 1,887 2,011 3,276 1,699 1,640 1,998Grand total 9,910 9,376 10,590 9,141 9,370 10,152
PGM MARKET REPORT FEBRUARY 2018
Precious Metals Management
30
PALLADIUM Tonnes - Supply and Demand
2017 Numbers are Preliminary Estimates9
2012 2013 2014 2015 2016 2017
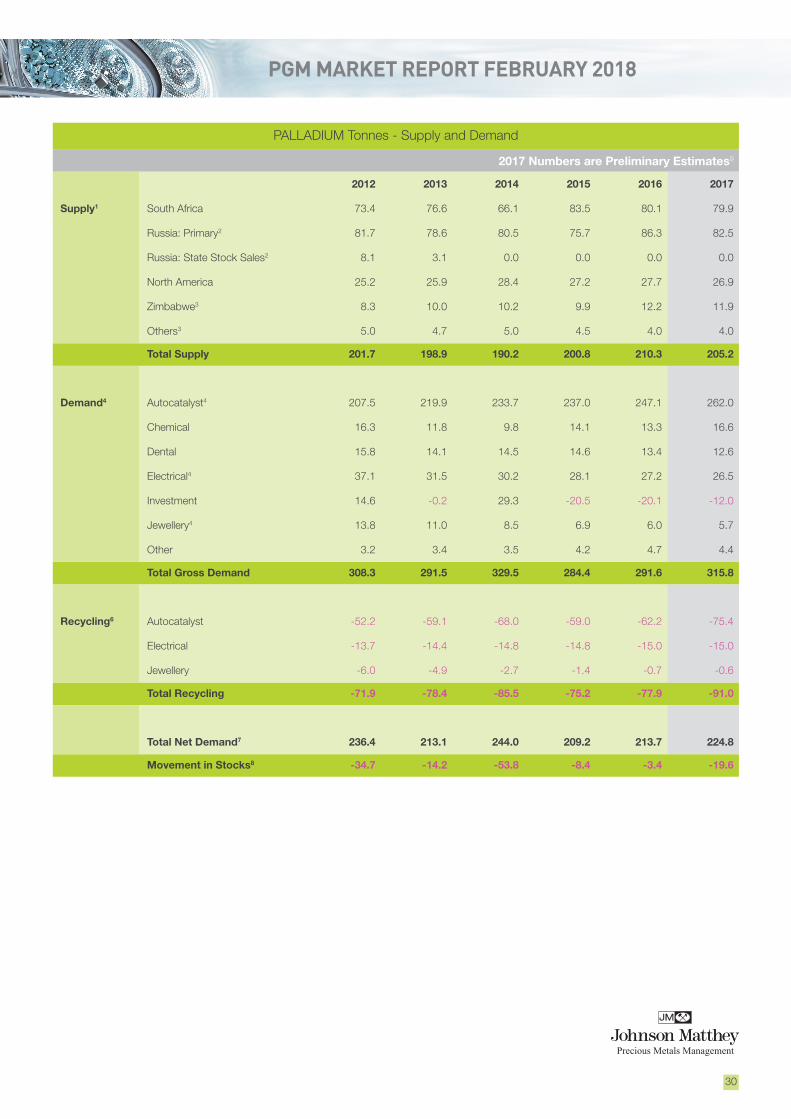
Supply1 South Africa 73.4 76.6 66.1 83.5 80.1 79.9
Russia: Primary2 81.7 78.6 80.5 75.7 86.3 82.5
Russia: State Stock Sales2 8.1 3.1 0.0 0.0 0.0 0.0
North America 25.2 25.9 28.4 27.2 27.7 26.9
Zimbabwe3 8.3 10.0 10.2 9.9 12.2 11.9
Others3 5.0 4.7 5.0 4.5 4.0 4.0
Total Supply 201.7 198.9 190.2 200.8 210.3 205.2
Demand4 Autocatalyst4 207.5 219.9 233.7 237.0 247.1 262.0
Chemical 16.3 11.8 9.8 14.1 13.3 16.6
Dental 15.8 14.1 14.5 14.6 13.4 12.6
Electrical4 37.1 31.5 30.2 28.1 27.2 26.5
Investment 14.6 -0.2 29.3 -20.5 -20.1 -12.0
Jewellery4 13.8 11.0 8.5 6.9 6.0 5.7
Other 3.2 3.4 3.5 4.2 4.7 4.4
Total Gross Demand 308.3 291.5 329.5 284.4 291.6 315.8
Recycling6 Autocatalyst -52.2 -59.1 -68.0 -59.0 -62.2 -75.4
Electrical -13.7 -14.4 -14.8 -14.8 -15.0 -15.0
Jewellery -6.0 -4.9 -2.7 -1.4 -0.7 -0.6
Total Recycling -71.9 -78.4 -85.5 -75.2 -77.9 -91.0
Total Net Demand7 236.4 213.1 244.0 209.2 213.7 224.8
Movement in Stocks8 -34.7 -14.2 -53.8 -8.4 -3.4 -19.6

PGM MARKET REPORT FEBRUARY 2018
Precious Metals Management
31
PALLADIUM Tonnes - Gross Demand by Region
2017 Numbers are Preliminary Estimates9
2012 2013 2014 2015 2016 2017Europe Autocatalyst 44.4 46.7 49.2 50.2 51.0 51.8
Chemical 2.5 2.2 -0.7 2.4 2.5 2.5 Dental 2.5 2.5 2.4 2.2 2.1 1.9 Electrical 4.7 3.5 3.5 3.1 3.1 2.9 Investment 5.1 -0.4 -2.3 -6.2 -8.4 -8.9Jewellery 2.0 1.9 1.9 1.8 1.8 1.8 Other 0.7 0.7 0.8 0.8 0.7 0.7 Total 61.9 57.1 54.8 54.3 52.8 52.7
Japan Autocatalyst 24.8 24.3 24.7 23.6 24.6 25.0 Chemical 0.5 0.6 0.5 0.5 0.5 0.5 Dental 6.8 5.7 6.4 7.1 6.2 5.9 Electrical 10.0 6.8 6.6 7.2 7.1 6.9 Investment 0.0 -0.1 -0.1 0.1 -0.1 -0.1 Jewellery 2.2 2.2 2.1 2.0 2.0 1.9 Other 0.3 0.3 0.3 0.3 0.3 0.3 Total 44.6 39.8 40.5 40.8 40.6 40.4
N. America Autocatalyst 56.1 55.1 61.1 63.2 60.8 66.0 Chemical 2.7 2.1 2.2 2.4 2.4 2.4 Dental 5.9 5.2 4.9 4.5 4.3 4.0 Electrical 5.1 4.9 4.4 4.1 4.0 3.8 Investment 9.5 0.3 -6.4 -5.6 -2.2 -0.6 Jewellery 1.4 1.3 1.4 1.3 1.2 1.1 Other 1.2 1.3 1.3 1.9 1.4 1.5 Total 81.9 70.2 68.9 71.8 71.9 78.2
China Autocatalyst 41.2 46.6 50.0 51.4 63.3 67.3 Chemical 6.6 4.5 5.0 6.5 5.3 8.2 Dental 0.1 0.2 0.2 0.2 0.2 0.2 Electrical 5.5 5.2 5.3 4.9 4.9 4.9 Investment 0.0 0.0 0.0 0.0 0.0 0.0 Jewellery 7.4 4.8 2.4 1.1 0.3 0.3 Other 0.4 0.5 0.5 0.5 1.3 1.4 Total 61.2 61.8 63.4 64.6 75.3 82.3
RoW Autocatalyst 41.0 47.2 48.7 48.6 47.4 51.9 Chemical 4.0 2.4 2.8 2.3 2.6 3.0 Dental 0.5 0.5 0.6 0.6 0.6 0.6 Electrical 11.8 11.1 10.4 8.8 8.1 8.0 Investment 0.0 0.0 38.1 -8.8 -9.4 -2.4Jewellery 0.8 0.8 0.7 0.7 0.7 0.6 Other 0.6 0.6 0.6 0.7 1.0 0.5 Total 58.7 62.6 101.9 52.9 51.0 62.2Grand total 308.3 291.5 329.5 284.4 291.6 315.8

PGM MARKET REPORT FEBRUARY 2018
Precious Metals Management
32
RHODIUM ‘000 oz - Supply and Demand
2017 Numbers are Preliminary Estimates9
2012 2013 2014 2015 2016 2017
Supply1 South Africa 577 554 470 611 615 618
Russia2 90 80 80 80 85 65
North America 22 23 24 22 24 22
Zimbabwe3 28 36 36 35 43 40
Others3 3 8 7 5 5 5
Total Supply 720 701 617 753 772 750
Demand4 Autocatalyst4 775 753 769 762 822 858
Chemical 80 79 90 73 64 74
Electrical 6 5 3 3 3 3
Glass 35 47 49 52 85 95
Other 63 87 38 30 39 18
Total Gross Demand 959 971 949 920 1,013 1,048
Recycling6 Autocatalyst -252 -281 -306 -262 -271 -324
Total Recycling -252 -281 -306 -262 -271 -324
Total Net Demand7 707 690 643 658 742 724
Movement in Stocks8 13 11 -26 95 30 26

PGM MARKET REPORT FEBRUARY 2018
Precious Metals Management
33
RHODIUM Tonnes - Supply and Demand
2017 Numbers are Preliminary Estimates9
2012 2013 2014 2015 2016 2017
Supply1 South Africa 17.9 17.2 14.6 19.0 19.1 19.2
Russia2 2.8 2.5 2.5 2.5 2.6 2.0
North America 0.7 0.7 0.7 0.7 0.7 0.7
Zimbabwe3 0.9 1.1 1.1 1.1 1.3 1.2
Others3 0.1 0.2 0.2 0.2 0.2 0.2
Total Supply 22.4 21.7 19.1 23.5 23.9 23.3
Demand4 Autocatalyst4 24.1 23.4 23.8 23.7 25.5 26.7
Chemical 2.5 2.5 2.9 2.3 2.0 2.3
Electrical 0.2 0.0 0.0 0.0 0.0 0.0
Glass 1.0 1.4 1.5 1.7 2.6 3.0
Other 2.0 2.8 1.2 1.0 1.3 0.6
Total Gross Demand 29.8 30.1 29.4 28.7 31.4 32.6
Recycling6 Autocatalyst -7.8 -8.7 -9.5 -8.2 -8.4 -10.1
Total Recycling -7.8 -8.7 -9.5 -8.2 -8.4 -10.1
Total Net Demand7 22.0 21.4 19.9 20.5 23.0 22.5
Movement in Stocks8 0.4 0.3 -0.8 3.0 0.9 0.8

PGM MARKET REPORT FEBRUARY 2018
Precious Metals Management
34
IRIDIUM ‘000 oz - Demand
2017 Numbers are Preliminary Estimates9
2012 2013 2014 2015 2016 2017
Demand Chemical 19 21 22 22 23 23
Electrical 28 35 49 89 112 88
Electrochemical 73 41 39 41 44 69
Other 75 68 71 77 81 84
Total Demand 195 166 182 228 259 264
IRIDIUM Tonnes - Demand
2017 Numbers are Preliminary Estimates9
2012 2013 2014 2015 2016 2017
Demand Chemical 0.6 0.7 0.7 0.7 0.7 0.7
Electrical 0.9 1.1 1.5 2.8 3.5 2.7
Electrochemical 2.3 1.3 1.2 1.3 1.4 2.2
Other 2.3 2.1 2.2 2.4 2.5 2.6
Total Demand 6.1 5.2 5.7 7.1 8.1 8.2
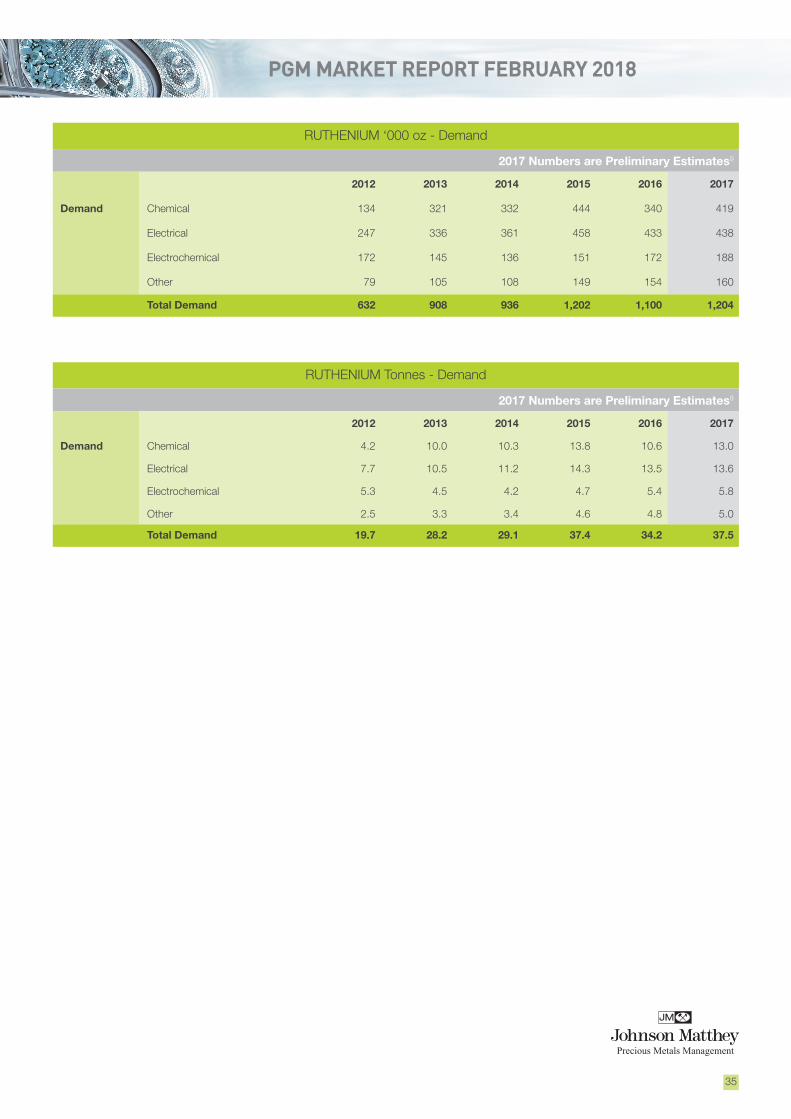
PGM MARKET REPORT FEBRUARY 2018
Precious Metals Management
35
RUTHENIUM ‘000 oz - Demand
2017 Numbers are Preliminary Estimates9
2012 2013 2014 2015 2016 2017
Demand Chemical 134 321 332 444 340 419
Electrical 247 336 361 458 433 438
Electrochemical 172 145 136 151 172 188
Other 79 105 108 149 154 160
Total Demand 632 908 936 1,202 1,100 1,204
RUTHENIUM Tonnes - Demand
2017 Numbers are Preliminary Estimates9
2012 2013 2014 2015 2016 2017
Demand Chemical 4.2 10.0 10.3 13.8 10.6 13.0
Electrical 7.7 10.5 11.2 14.3 13.5 13.6
Electrochemical 5.3 4.5 4.2 4.7 5.4 5.8
Other 2.5 3.3 3.4 4.6 4.8 5.0
Total Demand 19.7 28.2 29.1 37.4 34.2 37.5

PGM MARKET REPORT FEBRUARY 2018
Precious Metals Management
36
1Supply figures represent estimates of sales by the mines of primary pgm and are allocated to where the initial mining took place rather than the location of refining.
2Our Russian supply figures represent the total pgm sold in all regions, including Russia and the CIS. Demand in Russia and the CIS is included in the Rest of the World region. Russian supply figures for palladium have been split into sales from primary mining and sales of stocks.
3Supplies from Zimbabwe have been split from Others’ supplies. Platinum group metals mined in Zimbabwe are currently refined in South Africa, and our supply figures represent shipments of pgm in concentrate or matte, adjusted for typical refining recoveries.
4Gross demand figures for any given application represent the sum of manufacturer demand for metal in that application and any changes in unrefined metal stocks in that sector. Increases in unrefined stocks lead to additional demand, reductions in stock lead to a lower demand figure.
5Our Medical and Biomedical category represents combined metal demand in the medical, biomedical and dental sectors.
6Recycling figures represent estimates of the quantity of metal recovered from open loop recycling (i.e. where the original purchaser does not retain control of the metal throughout). For instance, autocatalyst recycling represents the weight of metal recovered from end-of-life vehicles and aftermarket scrap in an individual region, allocated to where the car was first registered, rather than where the metal is finally recovered. These figures do not include warranty or production scrap. Where no recycling figures are given, open loop recycling is negligible.
7Net demand figures are equivalent to the sum of gross demand in an application less any metal recovery from open loop scrap in that application, whether the recycled metal is reused in that industry or sold into another application. Where no recycling figure is given for an application, gross and net demand are identical.
8Movements in stocks in any given year reflect changes in stocks held by fabricators, dealers, banks and depositories but excluding stocks held by primary refiners and final consumers. A positive figure (sometimes referred to as a ‘surplus’) reflects an increase in market stocks. A negative value (or ‘deficit’) indicates a decrease in market stocks.
9Figures for 2017 are preliminary estimates.
NOTES TO TABLES

PGM MARKET REPORT FEBRUARY 2018
Precious Metals Management
37
ASC Ammonia slip catalyst
CF Conformity factor
CO Carbon monoxide
CO2
DOCCarbon dioxideDiesel oxidation catalyst
DPF Diesel particulate filter
EECELV
European Economic CommunityEnd-of-life vehicle
ETF Exchange traded fund
FCEV Fuel cell electric vehicle
GPF Gasoline particulate filter
HC Hydrocarbon
HDD Heavy duty diesel
LAB Linear alkyl benzene
LDG Light duty gasoline
LDD Light duty diesel
LEVLNT
Low emission vehicleLean NOx trap
NOx Oxides of nitrogen
NO Nitrogen monoxide
NO2 Nitrogen dioxide
NRMMNYMEX
Non-road mobile machineryNew York Mercantile Exchange
PMPNPNA
Particulate matter or sootParticle numberPassive NOx adsorber
ppmPTA
Parts per millionPurified terephthalic acid
PX Paraxylene
RDE Real driving emissions
RoW Rest of World region
SCR Selective catalytic reduction
SGE Shanghai Gold Exchange
SUV Sports utility vehicle
GLOSSARY

PGM MARKET REPORT FEBRUARY 2018
38
Prec
ious
Met
als M
anag
emen
t
EMIS
SIO
NS
LEG
ISLA
TIO
N: L
IGH
T D
UTY
Dat
es s
how
n ar
e fo
r N
ew V
ehic
le T
ype
App
rova
ls fo
r pa
ssen
ger
cars
. Chi
na d
ates
are
sub
ject
to fr
eque
nt c
hang
e; d
ates
sho
wn
repr
esen
t bes
t ava
ilabl
e cu
rren
t vie
w.
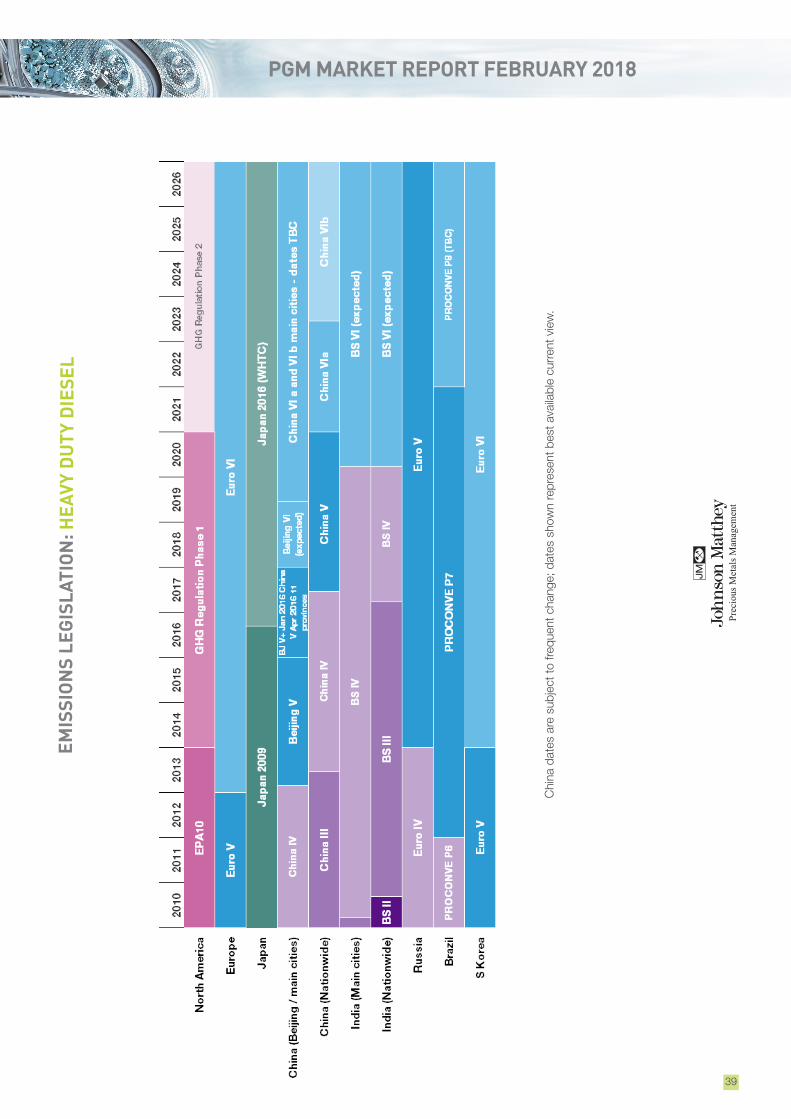
PGM MARKET REPORT FEBRUARY 2018
39
Prec
ious
Met
als M
anag
emen
t
EMIS
SIO
NS
LEG
ISLA
TIO
N: H
EAVY
DU
TY D
IESE
L
Chi
na d
ates
are
sub
ject
to fr
eque
nt c
hang
e; d
ates
sho
wn
repr
esen
t bes
t ava
ilabl
e cu
rren
t vie
w.

PGM MARKET REPORT MAY 2015
Precious Metals Management
40
PGM MARKET REPORT FEBRUARY 2018
Precious Metals Management
40
DISCLAIMER Johnson Matthey PLC endeavours to ensure the accuracy of the information and materials contained within this report, but makes no warranty as to accuracy, completeness or suitability for any particular purpose. Johnson Matthey PLC accepts no liability whatsoever in respect of reliance placed by the user on information and materials contained in this report, which are utilised expressly at the user’s own risk.
In particular, this report and the information and materials in this report are not, and should not be construed as, an offer to buy or sell, or solicitation of an offer to buy or sell, any regulated precious metal related products or any other regulated products, securities or investments, or making any recommendation or providing any investment or other advice with respect to the purchase, sale or other disposition of, any regulated precious metal related products or any other regulated products, securities or investments including, without limitation, any advice to the effect that any precious metal related transaction is appropriate or suitable for any investment objective or financial situation of a prospective investor.
A decision to invest in any regulated precious metal related products or any other regulated products, securities or investments should not be made in reliance on any of the information or materials in this report. Before making any investment decision, prospective investors should seek advice from their financial, legal, tax and accounting advisers, take into account their individual financial needs and circumstances and carefully consider the risks associated with such investment decisions. This report does not, and should not be construed as acting to, sponsor, advocate, endorse or promote any regulated precious metal related products or any other regulated products, securities or investments.