pets at home group plc: preliminary results fy15€¦ · 04-06-2015 · total dividend payable for...
TRANSCRIPT

1
FOR IMMEDIATE RELEASE, 4 JUNE 2015
Pets at Home Group Plc: Preliminary Results FY15
Building on success - Delivering across all strategic pillars
Pets at Home Group Plc, the UK’s leading specialist retailer of pet food, accessories and
services, today announces its preliminary results for the 52 week period to 26th March 2015.
Financial highlights
Total revenue growth of 9.6% to £729.1m
o Merchandise revenues grew 8.3% on the prior year; Food revenues up 9.8% and
Accessories revenues up 6.6%
o Services revenues grew 25.2% on the prior year; fee income from Joint Venture
veterinary practices up 30.7%
Like-for-like revenue growth 4.2%, driven by strength in Advanced Nutrition, Health &
Hygiene, VIP Club, Services and Omni-channel
o Merchandise like-for-like revenue growth 3.7%
o Services like-for-like revenue growth 10.7%
Gross margin 54.2%, +40bps on the prior year
Underlying EBITDA* £121.3m, up 9.6%, margin of 16.6%
Profit before tax £87.0m, basic EPS 13.5 pence
Underlying free cashflow** £92.8m, conversion 77% and leverage 1.6x net debt/underlying
EBITDA
Total dividend payable for FY15 of 5.4 pence per share, payout ratio of 40%
Operational highlights
Building customer offering and loyalty across multiple platforms
o VIP Club reached 3.2m members, up from 2.0m in FY14. Card swipe rate at store tills
represented 65% of revenues in Q4, compared with 61% during Q3 FY15
o In Advanced Nutrition, our flagship private label Wainwright’s, grew 44.1% to £40.1m
Increasing scale through new openings
o 25 stores (gross), 61 veterinary practices, 50 Groom Rooms
Evolution to a new divisional Group structure
Ian Kellett appointed CEO of newly created Retail Division
Sally Hopson appointed CEO of newly created Services Division
Nick Wood, Chief Executive Officer, commented:
“I am delighted to announce another year of progress as we continue to deliver on our targets
for growth, with strong cash flows allowing us to deliver a dividend payment at the top end of
our commitment.
We have seen excellent progress in Advanced Nutrition, a product area that benefits
2
significantly from the specialist knowledge of our highly-trained colleagues and where we have
a strong market presence through our private brand, Wainwright’s. We have also seen excellent
growth in pet services as we roll-out new vet practices and groom rooms and the existing estate
continues to mature. I am particularly proud of our colleagues whose passion for pets mirrors
that of our customers and helps to keep our focus firmly on customer engagement.
With our business growing strongly, we have decided that now is the right time to implement a
new divisional structure to drive performance further. It’s a sign of our strength that we have two
people of the calibre of Ian Kellett and Sally Hopson to take responsibility for our Retail and
Services Divisions, as we look forward to another year of expansion and profitable growth.”
Outlook
Management and the Board are confident in the Group’s prospects for the year. Looking ahead,
we believe we will continue to grow our sales, stores, vet and grooming services ahead of the
growth in the UK pet market.
Trading to date in the first quarter of FY16 has been in line with expectations.
FY16 guidance
Rollout: 20-25 Pets at Home stores, 5 Barkers stores, 50-55 vet practices, 55-60 Groom
Rooms
Depreciation and amortisation £26-27m
Underlying net interest cost £5.5-6.0m. Exceptional charge of £4.3m associated with
capitalised fees from previous finance facility
Effective tax rate 21%
Capital investment approximately £40m
Dividend policy at 40% of earnings
Results presentation
A presentation for analysts and investors will be held today at 9.30am at Goldman Sachs,
Peterborough Court, 133 Fleet Street, London EC4A 2BB, attendance is by invitation only. An
audio webcast and statement of these results will be available at
http://investors.petsathome.com
* Underlying EBITDA excludes £1.7m of IFRS2 share based payments
** Underlying free cashflow: excludes £1.7m of IFRS2 share based payment charges and £25.2m of trade payables movement related to the IPO
Investor Relations Enquiries
Pets at Home Group Plc: +44 (0)161 486 6688
Amie Gramlick, Head Of Investor Relations
Media Enquiries
Pets at Home Group Plc: +44 (0)161 486 6688
Brian Hudspith, Head Of Corporate Affairs
Maitland (Public Relations Advisors to Pets at Home): +44 (0)20 7379 5151
Neil Bennett, Emma Burdett

3
About Pets at Home
Pets at Home Group Plc is the UK’s leading specialist pet omnichannel retailer and services
provider. Pets at Home operates from 400 stores located across the UK. The Group operates
the UK’s largest small animal veterinary business with 338 practices, run principally under a
Joint Venture model using the Companion Care and Vets4Pets brand names, and a specialist
referral vet hospital. Pets at Home is the UK’s leading operator of pet grooming services offered
through its 179 Groom Room salons. The Group also owns and operates Ride-away, a
specialist equine retail business with a York superstore, website and catalogue. For more
information visit: http://investors.petsathome.com/
Disclaimer This statement of preliminary financial results does not constitute an invitation to underwrite,
subscribe for, or otherwise acquire or dispose of any Pets at Home Group Plc shares or other
securities nor should it form the basis of or be relied on in connection with any contract or
commitment whatsoever. It does not constitute a recommendation regarding any securities.
Past performance, including the price at which the Company’s securities have been bought or
sold in the past, is no guide to future performance and persons needing advice should consult
an independent financial advisor.
Certain statements in this statement of preliminary financial results constitute forward-looking
statements. Any statement in this document that is not a statement of historical fact including,
without limitation, those regarding the Company’s future expectations, operations, financial
performance, financial condition and business is a forward-looking statement. Such forward-
looking statements are subject to risks and uncertainties that may cause actual results to differ
materially. These risks and uncertainties include, among other factors, changing economic,
financial, business or other market conditions. These and other factors could adversely affect
the outcome and financial effects of the plans and events described in this statement of interim
financial results. As a result you are cautioned not to place reliance on such forward-looking
statements. Nothing in this statement should be construed as a profit forecast.
4
Chief Executive Officer’s Review
Operational Highlights
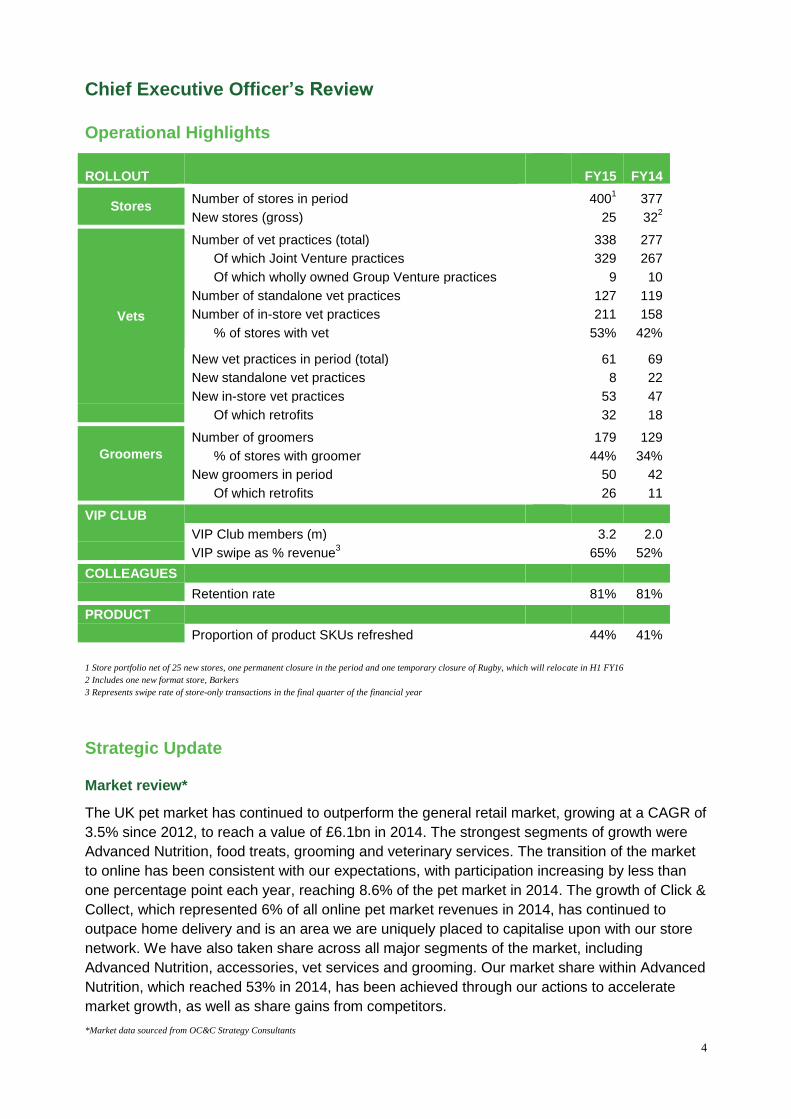
ROLLOUT
FY15 FY14
Stores Number of stores in period 400
1 377
New stores (gross) 25 322
Vets
Number of vet practices (total) 338 277
Of which Joint Venture practices 329 267
Of which wholly owned Group Venture practices 9 10
Number of standalone vet practices 127 119
Number of in-store vet practices 211 158
% of stores with vet 53% 42%
New vet practices in period (total) 61 69
New standalone vet practices 8 22
New in-store vet practices 53 47
Of which retrofits 32 18
Groomers
Number of groomers 179 129
% of stores with groomer 44% 34%
New groomers in period 50 42
Of which retrofits 26 11
VIP CLUB
VIP Club members (m) 3.2 2.0
VIP swipe as % revenue3 65% 52%
COLLEAGUES
Retention rate 81% 81% PRODUCT
Proportion of product SKUs refreshed 44% 41%
1 Store portfolio net of 25 new stores, one permanent closure in the period and one temporary closure of Rugby, which will relocate in H1 FY16
2 Includes one new format store, Barkers
3 Represents swipe rate of store-only transactions in the final quarter of the financial year
Strategic Update
Market review*
The UK pet market has continued to outperform the general retail market, growing at a CAGR of
3.5% since 2012, to reach a value of £6.1bn in 2014. The strongest segments of growth were
Advanced Nutrition, food treats, grooming and veterinary services. The transition of the market
to online has been consistent with our expectations, with participation increasing by less than
one percentage point each year, reaching 8.6% of the pet market in 2014. The growth of Click &
Collect, which represented 6% of all online pet market revenues in 2014, has continued to
outpace home delivery and is an area we are uniquely placed to capitalise upon with our store
network. We have also taken share across all major segments of the market, including
Advanced Nutrition, accessories, vet services and grooming. Our market share within Advanced
Nutrition, which reached 53% in 2014, has been achieved through our actions to accelerate
market growth, as well as share gains from competitors.
*Market data sourced from OC&C Strategy Consultants

5
Expanding like-for-like growth
VIP club Our loyalty scheme, VIP club, is a key underpin to like-for-like growth and customer
engagement. Analysing our customers’ spend, combined with our knowledge of their pet type,
breed and age, allows us to send personalised marketing offers across both Merchandise
products and Services to grow our share of spend with these customers.
VIP club reached 3.2 million members at year end, adding 1.2 million members during the year,
and has over 10.5 million pets registered. VIP card swipe rate represented 65% of revenues
captured on store tills in the final quarter of FY15, compared with 52% at the end of FY14.
Although the scheme is still immature, we are seeing that VIP members spend more with us the
longer they are a VIP member.
Encouraging VIP members’ participation in vet and grooming services is a significant
opportunity through which we can grow incremental sales. As part of this strategy, we
successfully launched the VIP Groom Room Rewards programme during the year, where new
VIPs receive a 25% discount on a full dog groom and further discount vouchers after any
subsequent grooms.
Product and pricing
Our annual customer survey continues to demonstrate that innovative and unique products are
highly valued by Pets at Home shoppers. To ensure our customers are seeing something new
and different each time they visit, we have continued to refresh our product range, changing
more than 3,100 SKUs (Stock Keeping Units) in the year, representing 44% of the total range.
Of those products refreshed, over 40% were private or own labels.
Range expansion and refreshment within Advanced Nutrition is vital for attracting new
customers, who are often very brand loyal, as well as offering innovation and choice to our
existing customers. We added new brands during the year, such as Meowing Heads, as well as
introducing new high protein products, including a private label, Evolution Naturally, and
branded alternative, Aatu. We believe there is significant capacity for further growth in
Advanced Nutrition, through stocking additional brands, widening our own brand and private
label ranges and entering new Advanced Nutrition segments.
During the year we also invested in pricing, widening our ranges to create entry price products
in wild bird food, small animal cages and large accessories. In the coming year, we will continue
to increase product breadth with lower entry price products in a number of other categories.
Omnichannel
We are on a journey to create a seamless shopping experience, giving our customers access to
a wide product range whether they wish to shop in-store, order online, receive their delivery at
home or, as is becoming increasingly popular, collect at their convenience in our stores.
During the year, the development of our exclusive online-only product range increased nearly
four-fold, taking our online product range to more than 11,500 SKUs, an uplift of more than
4,400 to those in-store. All of the extended range can be ordered for pickup in-store with no
delivery charge. Our Click & Collect and Deliver To Store services have been key contributors to
omnichannel sales, representing over 40% of online revenues in the final quarter. As part of
developing a seamless shopping experience, we implemented the JDA supply chain system in

6
both our distribution centres, which provides a unified view of product across the Group. We
also recently launched a dedicated mobile version of our website.
In the year ahead, we will invest in the omnichannel shopping experience through a number of
strategic initiatives. We will launch an App for VIP customers which, in its first phase, will give
members an electronic copy of their loyalty card and enable promotions and offers to be
scanned, removing the need to bring vouchers into store. We are rolling out Wifi across our
estate so that ordering from our extended online range can be facilitated by colleagues on
PetPads or by customers using their own devices. Ordering from the extended range whilst in-
store will also become significantly easier, as we install ‘order in store’ kiosks and develop
digital screens to showcase our extended range. We will also be investing in richer online
content and imagery, and additional colleagues and systems to support the seamless shopping
strategy.
We are actively evaluating opportunities to further develop and extend our online business
organically and through bolt-on acquisitions. Our focus remains on building the UK’s leading Pet
focussed omnichannel business whilst securing appropriate returns for shareholders.
Services
Retrofitting of veterinary practices and Groom Rooms to existing stores increases like-for-like
Merchandise sales by enhancing our overall proposition, driving store footfall and enabling
cross-selling of products. Retrofitting vet practices also offsets a portion of our store property
costs through a service charge to the practice for the space occupied. During the year, just over
half of both vet practice and Groom Room openings were retrofits into the existing store estate,
converting the equivalent square footage of more than 6 stores into services.
We also commenced a number of strategic initiatives in the Vet Group, to increase like-for-like
growth in our existing Joint Venture practice network. These included space extensions to our
more mature practices, our first trials of 24/7 opening and extended hours, and the development
of our pet care plans to increase customer loyalty and spend.
Engagement
Colleague expertise and engagement is central to the our success, creating a great shopping
experience for customers and their pets. Our specialist colleagues continue to learn and
develop with us, allowing us to maintain our industry leading retention rate of 81% (FY14: 81%).
Engagement levels, which we measure through an annual colleague survey, improved to 94%
(FY14: 93%).
During the year, customer advocacy measured by a Net Promoter Score, improved again to
86% (FY14: 84%), having risen from 75% in FY11.
Marketing
We returned to TV advertising this year, through the launch of the ‘My Pet Moments’ campaign,
which features crowd sourced clips of our customers’ pets, as well as sponsoring ‘For The Love
Of Dogs’, one of ITV’s highest rating programmes. Our Vet Group also participated in TV
advertising under the Vets4Pets brand. We we will continue to invest in our brands and new
customer acquisition in the coming year.
Space rollout and footprint development
A key part of the Group’s strategy is to increase the number of stores, in-store and standalone
veterinary practices, and Groom Room salons. We finished the year with 400 stores; opening 25
new stores, closing one end of lease store, and temporarily closing our Rugby store which will
7
relocate in the first half of FY16. We are becoming increasingly space efficient with new stores,
our FY15 openings had smaller ground floor footprints, with 60% receiving a mezzanine floor
installation.
We opened 61 vet practices in FY15, bringing the total portfolio to 338. Over half of our store
estate now has a vet practice and we remain committed to working towards our eventual target
of 90% of stores with a vet practice. Since the financial year end, we have commenced our
entry into the specialist referral veterinary care market, acquiring Northwest Surgeons based in
Cheshire. The practice specialises in orthopaedic, soft tissue and spinal surgery and internal
medicine. Northwest Surgeons will continue to operate as a stand-alone brand and business
within our practice network and we will seek to develop a shared ownership model, similar to
our joint venture model. We will look to build upon our entry into the specialist referral veterinary
market with further standalone acquisitions.
Groom Room openings progressed strongly, with 50 new salons, taking the total number of
Groom Rooms to 179.
The performance and returns of new stores, vet practices and Groom Rooms remain in line with
our expectations.
Looking forward, we plan to open at least 20-25 Pets at Home stores, 50-55 vet practices and
55-60 Groom Rooms in the coming financial year. We will also open 5 Barkers stores, moving to
a phase of trialling the concept in other locations across the UK. Barkers is our dog focused
local high street format, currently based in one location in Wilmslow, Cheshire. Barkers offers
premium and exclusive products, a high end grooming spa and has differentiated brands and
merchandising to those available in Pets at Home. In its first year of opening, Barkers of
Wilmslow has exceeded our expectations and we view the format as an important strategic
asset that reaffirms our specialist credentials in the pet market, giving us access to a valuable
customer segment.
Focus on margins
Advanced Nutrition growth and own brand participation are supportive to Merchandise gross
margin, which expanded by 19bps to 56.3% in FY15 (FY14: 56.1%).
Own brand and private label products represented 42.6% of store revenues during FY15 (FY14:
42.4%).
Advanced Nutrition revenues grew by 17.2% to £145.4m (FY14: £124.0m), with our private
label brand Wainwright’s an important contributor, growing by 44.1% to £40.1m (FY14: £27.8m).
Wainwright’s growth has been boosted by new additions such as Grain Free for dogs and
Wainwright’s for cats, which were launched in H2 FY14, alongside Grain Free for cats which
launched in FY15. Advanced Nutrition now represents 40% of total Food revenues (FY14:
38%).
Services gross margin, which was 32.6% in FY15 (FY14: 26.3%), has expanded through the
growing maturity of our veterinary practices and incremental synergies from the integration of
Vets4Pets, which was acquired in FY14. We also saw good gross margin expansion in our
grooming business through its growing maturity and measures taken to improve profitability
across the portfolio.
Looking forward, we will continue to drive Advanced Nutrition growth and participation in the
Food business. Whilst we will broaden our own brand and private label ranges to ensure we
offer great value to customers, we will not seek to increase their participation at the expense of
the brands our customers are loyal to. Within our higher operating margin Services business, as
8
our vet practices mature there is an opportunity for our revenue stream to increase without a
significant rise in our cost base, delivering margin leverage. Whilst the Groom Room business is
also maturing, the large number of new openings in the past and coming year will continue to
moderate margin improvement within Services in the short term.
Investing in the organisation
Our business has grown significantly in recent years and we are continuing to rollout our stores
and services at a fast pace. We see significant growth opportunities across the Group and have
therefore decided to implement a new management structure to drive performance across the
business. Ian Kellett will take up a new role as CEO of the Retail Division. Sally Hopson,
previously Customer and People Director and CEO of our Vet Group, will take on an enhanced
role as the CEO of the Services Division. Both will report to Nick Wood who, as Group CEO, will
continue to focus on overall Group operations and strategy.
The search for a new Group CFO is starting with immediate effect. During this process, Ian
Kellett will remain as CFO and commence the transition to his new role.
Nick Wood Chief Executive Officer 4 June 2015

9
Chief Financial Officer’s Review The FY15 accounting period represents the 52 week period from 28th March 2014 to 26th March
2015. The comparative FY14 period represents the 52 week period from 29th March 2013 to 27th
March 2014.
Financial Highlights
FINANCIALS
FY15 FY14 Change
Revenue
Revenue Split (£m)
Food 359.3 327.3 9.8%
Accessories 306.8 287.8 6.6%
Total Merchandise revenue1 666.1 615.1 8.3%
Services & Other revenue2 63.0 50.3 25.2%
Total Group revenue 729.1 665.4 9.6%
Like For Like growth3 4.2% 2.4%
Merchandise LFL growth 3.7% 2.4%
Services LFL growth 10.7% 2.1%
Revenue Mix (% of total revenues)
Food 49.3% 49.2% 10 bps
Accessories 42.1% 43.2% (118)bps
Total Merchandise 91.4% 92.4% (108)bps
Services & other 8.6% 7.6% 108 bps
Gross Margin
Merchandise Gross Margin 56.3% 56.1% 19 bps
Services & Other Gross Margin 32.6% 26.3% 630 bps
Total Gross Margin 54.2% 53.8% 40 bps
EBITDA Underlying EBITDA (£m)
4 121.3 110.7 9.6%
Underlying EBITDA margin 16.6% 16.6% 0 bps
Other Income Statement
Profit before tax (£m)5 87.0 52.2 NM
Trading profit after tax (£m)5 67.9 38.6 NM
Basic EPS (pence)5 13.5 0.5 NM
Dividend (pence) 5.4 -
Cashflow & Leverage
Underlying unlevered FCF (£m)4,6
92.8 92.4 0.4%
Conversion as % of underlying EBITDA 76.5% 83.5% (697)bps
CROIC4,6,7
22.6% 21.7% 88 bps
Leverage (Net Debt / underlying EBITDA)4 1.6x 2.3x 0.7x
1 Includes Food and Accessories revenue
2 Includes veterinary Joint Venture fees and other income, Groom Room revenue, revenue from live pet sales and insurance commission
3 ‘Like-for-Like’ sales growth comprises total sales/fee revenue in a financial period compared to revenue achieved in a prior period, post cannibalisation, for stores,
grooming salons and vets that have been trading for 52 weeks. LfL includes revenue from the Group’s online operations
4 Excludes £1.7m of IFRS2 share based payments
5 Includes IFRS2 share based payments of £1.7m
6 Excludes £25.2m of trade payables movement related to the IPO
7 CROIC excludes goodwill on KKR acquisition

10
Sales and revenue
Total revenues in FY15 grew by 9.6% to £729.1m (FY14: £665.4m), with good performance
across all three business segments; Food, Accessories and Services. Like-for-like sales grew
by 4.2%, driven by strength in Advanced Nutrition, Health & Hygiene, VIP Club, Services and
Omnichannel.
Total Merchandise revenues, which includes Food and Accessories, grew by 8.3% to £666.1m
(FY14: £615.1m).
Food revenues grew strongly by 9.8% to £359.3m (FY14: £327.3m), reflective of excellent
performance in dog and cat Advanced Nutrition, dog treats and premium wet cat food.
Advanced Nutrition revenues grew by 17.2% to £145.4m (FY14: £124.0m), with our flagship
private label Wainwright’s a key contributor, growing by 44.1% to £40.1m (FY14: £27.8m). This
compares to the Advanced Nutrition market in the UK growing at around 14%*. Grocery dog
food performance was weaker following our Autumn space re-allocation to Advanced Nutrition,
but sales densities improved post the space re-allocation.
Accessories revenues grew by 6.6% to £306.8m (FY14: £287.8m), driven by Health and
Hygiene sales, a strong Christmas range, and dog collars and leads. We saw some weakness
in Cat Litter as a result of new range changes, and in Aquatics, reflecting a weaker market and
the re-allocation of this product space when Services are retrofitted to stores. We have also
experienced weak trading and sales in our equestrian business, Ride-away, which declined
year-on-year.
Services revenues grew 25.2% to £63.0m (FY14: £50.3m), reflecting both new openings and
the growing maturity of our vet practices and Groom Rooms. Growth in our Joint Venture
veterinary practices was ahead of the UK veterinary services market, generating fee income of
£28.2m (FY14: £21.6m), growth of 30.7% on the prior year.
*Market data sourced from OC&C Strategy Consultants
Gross margin
Group gross margin expanded by 40bps to 54.2% (FY14: 53.8%), attributable to significant
expansion in our Services margin, as well as good progression in Merchandise margin.
Gross margins within Merchandise were 56.3%, an expansion of 19 bps on the prior year
(FY14: 56.1%). This has been achieved primarily through the Food business; from the strength
of our private labels such as Wainwright’s, the decreased participation of lower margin grocery
food, improved terms negotiations, and a lower level of discounting across the year as our
marketing to VIP customers becomes more targeted. Accessories margins were at a similar
level to the prior year as we continued our price investment in large accessories, increased
promotions across Aquatics and saw a changing mix in cat litter. We have also experienced
challenge to the Accessories margin from omni-channel promotional activities, as well as the
weakness in the Ride-away business.
Gross margin within the Services business expanded by 630 bps to 32.6% (H1 FY14: 26.3%).
Of the £7.3m growth in Services gross profit, the main contributors have been the maturation of
our vet practices, incremental synergies of £2.6m from the Vets4Pets integration, and a benefit
in grooming from both maturity and measures to increase profitability. Adverse movements
within Services gross margin came from our continued investment in live pet care and welfare
within stores.
In the coming year we expect to see a modest accretion in Group gross margin, reflecting the
positive impacts of our maturing vet business and higher margin product categories, whilst

11
allowing for further price investment in opening price point categories and the dilutive impact of
a high proportion of new Groom Rooms. We do not expect any further synergy benefits from the
Vets4Pets acquisition.
Operating costs
Selling and distribution expenses of £257.9m were broadly constant as a percentage of Group
revenue at 35.4% (FY14: 35.2%). Occupation costs (rent, services charges and other costs)
declined as a percentage of sales as we continue to benefit from a benign rental market and the
offset to our rental costs from the retrofitting of vet practices to stores. Income from vet practice
retrofits and sublets contributed more than £8.1m to our gross property rental costs of £66.5m in
FY15 (FY14: £61.9m). Colleague costs of £136.5m (FY14: £120.9m) increased as a result of
our new store rollout and ‘learn to earn’ Steps training programme, coupled with our industry
leading retention rate. Marketing costs also increased as we invested in our brand through TV
advertising and sponsorship.
In the year ahead we will invest further in our brand and marketing, and in the hardware and
software required to support the seamless shopping strategy. We expect colleague costs to
grow ahead of the rate in FY15 as we provide additional holiday pay, maintain retention and
ensure we maintain our reputation as one of the best companies to work for in the UK.
Administration expenses of £40.7m were 5.6% of revenue (FY14: 5.2%), reflecting an additional
£2.5m of costs associated with being a publicly listed company and £1.7m of IFRS2 share
based payment charges.
Underlying EBITDA
Underlying EBITDA of £121.3m, which excludes £1.7m of IFRS2 share based payment
charges, represented a 9.6% increase on the previous year (FY14: £110.7m). Margin was equal
to the prior year as we incorporated the first year of costs associated with being a public
company, which totalled £2.5m.
Our underlying EBITDA margin was supported by the increased participation of the Services
business, which represented 8.6% of group revenues in FY15 (FY14: 7.6%). Despite the
considerable immaturity of our vet practices and grooming salons, the Services business has a
higher EBITDA margin to that of the Group and this support will enable us to invest in the future
growth of the Group.
Going forward, IFRS2 shared based payment charges will be considered part of ongoing
operating expenses, as we move to our second year of being a public company and we will no
longer report an underlying EBITDA measure.
£m FY15 FY14
Operating profit 96.8 78.8
Depreciation and amortisation 22.8 20.0
Reported EBITDA 119.6 98.8
Related party fees - 1.2
IFRS share based payment charges 1.7 0.1
Exceptional items 10.6
Underlying EBITDA 121.3 110.7 Underlying EBITDA is calculated as Group underlying operating profit under IFRS (which includes amortisation of landlord and developer contributions received),
plus depreciation and amortisation. Excludes exceptional items, related party fees, and IFRS2 related share based payment credits and charges. FY14 exceptional
expenses of £10.6m were attributable to costs associated with the Initial Public Offering (£9.4m), and costs associated with the integration of the Vets4Pets business
(£2.3m) net of a significant VAT refund (£1.1m).

12
Finance expense
Net finance expense for FY15 was £9.8m. As a result of our declining leverage profile and
following our recent refinancing at more favourable rates, we expect net finance expense for
FY16 to be £5.5–6.0m. Capitalised fees associated with the previous facility will be reflected as
an exceptional charge to the income statement of approximately £4.3m in FY16.
Taxation, trading profit & EPS
Underlying total tax expense for the period was £19.1m, a rate of 22% on pre tax profit. Whilst
the UK corporate tax rate for the period was 21%, the principal reason for the difference relates
to items of capital expenditure for which depreciation is non deductible.
An exceptional tax credit, and cash receipt of £4.3m, related to the release of a provision made
in the prior financial year in respect of interest deductability on debt associated with the pre IPO
capital structure.
Trading profit for the period, which includes IFRS2 share based payments, was £67.9m (FY14:
£38.6m). Basic earnings per share were 13.5 pence (FY14: 0.5 pence).
Working capital
The underlying cash working capital improvement for FY15 was £5.8m (FY14: £9.6m).
An increase in inventory of £2.4m is mainly reflective of our investment in new food ranges and
new store openings. Of the increase in trade receivables of £9.5m, the majority relates to
temporary loans made to Joint Venture vet practices, whereby the Group funds initial setup
costs until commercial funding is drawn down by the practice. The trade payables* increase of
£17.7m reflects both growth across the Group and our efforts to drive a wide range of
efficiencies and improvements.
We expect a moderate working capital outflow in the coming financial year due to the additional
trading week in the period and resultant outflow of trade payables.
* Trade payables includes trade and other payables, with balances associated with fixed assets, tax and interest removed, and financial instruments. Excludes
£25.2m of IPO related payables in the FY14 balance
Borrowings and net debt
The Group’s underlying net debt position at the end of year was £192.0m, representing a
leverage ratio of 1.6x underlying EBITDA, a reduction from the FY14 position of 2.3x. Whilst the
net debt position is ahead of expectations, our underlying deleveraging plan remains
unchanged, at an average of 0.5x per annum from our prior year position of 2.3x, reflective of
the anticipated working capital outflow in FY16 and our dividend commitment.
Post year end, we announced the closing of a new financing agreement for a five year, £260m
revolving credit facility, which is currently drawn to £235m. This replaced the Group’s previous
£325m of drawn facilities, with the differential balance between the two facilities being settled
from the Group’s existing cash resources. At current leverage, the facility carries a rate of
LIBOR +1.5%.

13
£m Leverage
Gross Debt 325.0
Cash (133.0)
Net debt 192.0
Last twelve months underlying
EBITDA
121.3
Leverage 1.6x
Capital expenditure
Capital investment in the period totalled £33.2m (FY14: £30.0m), reflecting our increased
Services retrofit programme, where we incur the capital outlays for grooming salons and store
refurbishment, as well as investment in mezzanine floors across the estate which drive space
and rental efficiencies in both new and existing stores.
On a cash basis, capital expenditure in the period was £30.4m (FY14: £26.3m).
We expect capital investment for FY16 to be approximately £40m, reflecting investment in our
seamless shopping strategy, additional mezzanine floors as we optimise new store openings
and retrofit services to the existing estate, and store refurbishment as part of the services retrofit
programme.
Cash flows
Cash flow generation was once again strong. The Group generated £125.3m in underlying
operating cash flow* during the period (FY14: £108.7m). Underlying free cashflow** before
interest, tax and acquisitions was £92.8m (FY14: £92.4m), representing a cash conversion rate
of 76.5% (FY14: 83.5%).
Cash returns on invested capital*** improved to 22.6% (FY14: 21.7%) as a result of our profit
growth and working capital improvement.
*Excludes £25.2m of trade payables movement related to the IPO
** Excludes £1.7m of IFRS2 share based payments and £25.2m of trade payables movement related to the IPO
*** CROIC excludes goodwill on KKR acquisition, £1.7m of IFRS2 share based payments and £25.2m of trade payables movement related to the IPO
Dividend
The Board has recommended a final dividend of 3.6 pence per share, leading to a total dividend
of 5.4 pence per share, in respect of the 2015 financial year. The final dividend will be proposed
by the Directors at the 2015 AGM and is in addition to the interim dividend of 1.8 pence per
share, paid to shareholders on the 16th January 2015. The ex-dividend date will be 13th August
2015 and, if approved at the Company’s forthcoming AGM, will be paid to shareholders on 14th
September 2015 to those shareholders on the register at the close of business on 14th August
2015.
The Board is targeting a progressive dividend payment policy of 40% of earnings, reflective of
the positive outlook for the business.
Ian Kellett
Chief Financial Officer
4 June 2015
14
Financial Statements
Financial Information
The financial information set out in this preliminary statement of annual results has been
extracted from the Group’s financial statements, which have been approved by a resolution of
the Board of directors of the Company on 3 June 2015 and agreed with the Company’s auditor.
The financial information set out in this preliminary statement does not constitute the Company’s
statutory accounts for the year ended 26 March 2015 as defined in section 434 of the
Companies Act 2006 (the “Act”) which have not yet been delivered to the Registrar of
Companies.
The Company’s auditor has reported on the FY15 financial statements. Its reports were
unqualified and did not draw attention to any matters by way of emphasis. The reports also did
not contain statements under section 498 of the Act.

15
Consolidated Income Statement
52 week period ended 26 March 2015 52 week period ended 27 March 2014
Note 2015 2015 2015 2014 2014 2014
£000 £000 £000 £000 £000 £000
Underlying
Trading
Exceptional
Items (note 7) Total Underlying
Trading
Exceptional
Items (notes 3,6) Total
Revenue 2 729,086 - 729,086 665,395 - 665,395
Cost of sales (333,776) - (333,776) (307,271) - (307,271)
Gross profit 395,310 - 395,310 358,124 - 358,124
Selling and distribution expenses (257,853) - (257,853) (233,891) - (233,891)
Administrative expenses 3 (40,695) - (40,695) (34,817) (10,574) (45,391)
Operating profit 3 96,762 - 96,762 89,416 (10,574) 78,842
Financial income 572 - 572 368 - 368
Financial expense 6 (10,369) - (10,369) (37,547) (19,158) (56,705)
Net financing expense (9,797) - (9,797) (37,179) (19,158) (56,337)
Profit before tax 86,965 - 86,965 52,237 (29,732) 22,505
Taxation 7 (19,089) 4,295 (14,794) (13,672) 4,715 (8,957)
Profit for the period 67,876 4,295 72,171 38,565 (25,017) 13,548
All activities relate to continuing operations.
Basic and diluted earnings per share attributable to equity Shareholders of the Company: 52 week period
ended
26 March 2015
52 week period
ended
27 March 2014
Equity holders of the parent – underlying trading - basic 5 13.5p 0.5p Equity holders of the parent – after exceptional items - basic 5 14.4p (13.8p) Equity holders of the parent – underlying trading - diluted 5 13.5p 0.5p Equity holders of the parent – after exceptional items - diluted 5 14.4p (13.8p)
Dividends paid and proposed are disclosed in note 8.
16
Consolidated Statement of Comprehensive Income
52 week period
ended 26 March
2015
52 week period
ended 27 March
2014
£000 £000
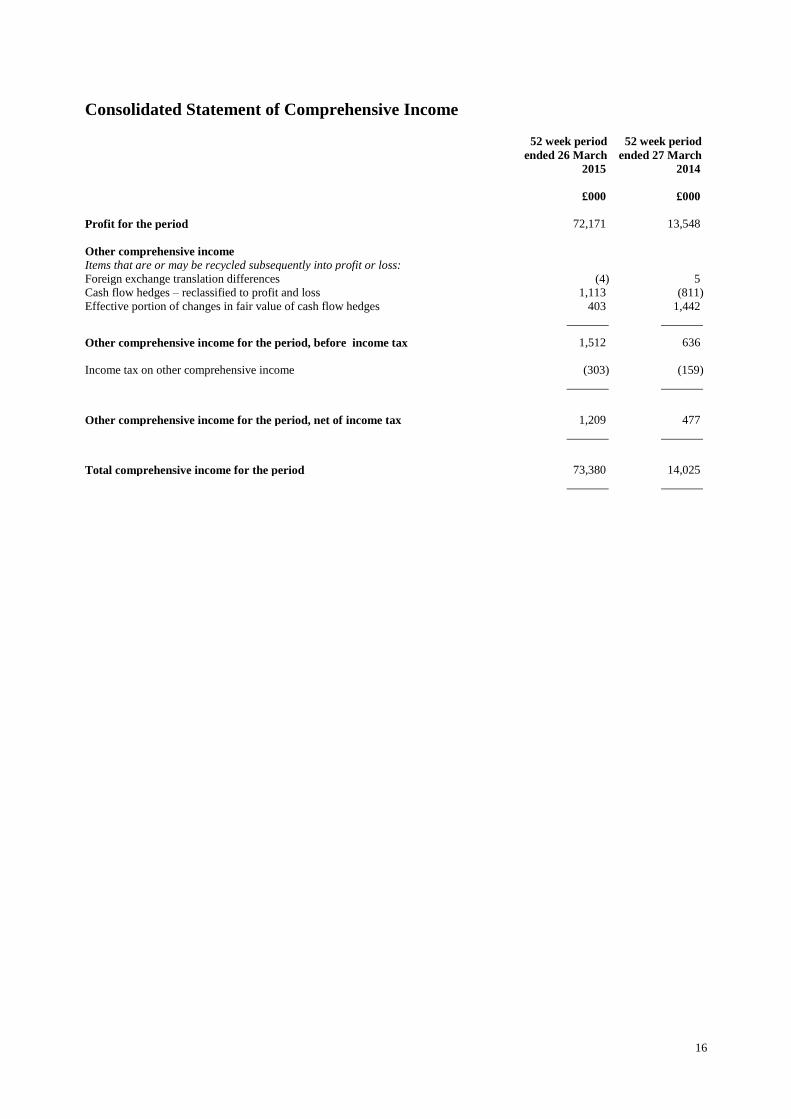
Profit for the period 72,171 13,548
Other comprehensive income
Items that are or may be recycled subsequently into profit or loss:
Foreign exchange translation differences (4) 5
Cash flow hedges – reclassified to profit and loss 1,113 (811)
Effective portion of changes in fair value of cash flow hedges 403 1,442
Other comprehensive income for the period, before income tax 1,512 636
Income tax on other comprehensive income (303) (159)
Other comprehensive income for the period, net of income tax 1,209 477
Total comprehensive income for the period 73,380 14,025

17
Consolidated Balance Sheet Note At 26 March 2015 At 27 March 2014
£000 £000
Non-current assets
Property, plant and equipment 102,890 93,628
Intangible assets 955,512 955,238
Other non-current assets 8,133 6,619
1,066,535 1,055,485
Current assets
Inventories 48,474 46,116
Deferred tax assets - 45
Other financial assets 1,697 -
Trade and other receivables 51,627 42,159
Cash and cash equivalents 132,966 90,823
234,764 179,143
Total assets 1,301,299 1,234,628
Current liabilities
Other interest-bearing loans and borrowings 9 (5,000) -
Trade and other payables (144,754) (149,547)
Provisions (365) (461)
Other financial liabilities (632) (1,113)
(150,751) (151,121)
Non-current liabilities
Other interest-bearing loans and borrowings 9 (315,674) (319,855)
Other payables (31,483) (31,068)
Provisions (1,706) (1,835)
Deferred tax liabilities (4,810) -
(353,673) (352,758)
Total liabilities (504,424) (503,879)
Net assets 796,875 730,749
Equity attributable to equity holders of the parent
Ordinary share capital 5,000 5,000
Share premium - 1,080,477
Consolidation reserve (372,026) (372,026)
Merger reserve 113,321 113,321
Translation reserve - 4
Cash flow hedging reserve 851 (362)
Retained earnings 1,049,729 (95,665)
Total equity 796,875 730,749
On behalf of the board:
Ian Kellett
Chief Financial Officer
Company number: 08885072

18
Consolidated Statement of Changes in Equity as at 31 March 2013
(i) As contemplated in the Pets at Home Group Plc IPO Prospectus dated 28 February 2014 and pursuant to a shareholder resolution passed on 27 February 2014, Pets at Home Group Plc
completed a reduction of capital, whereby £1,080,477,000 standing to the credit of the Company's share premium account was cancelled, creating distributable reserves of an equivalent amount.
The cancellation was formally approved by the High Court, and the court order was registered by the Registrar of Companies and became effective on 30 July 2014. The cancellation has no
effect on the overall net asset position of the Company and/or its group.
Share
capital
Share
premium
Consolidation
reserve
Merger
reserve
Cash flow
hedging reserve
Translation
reserve
Retained
earnings
Total
equity
£000 £000 £000 £000 £000 £000 £000 £000
Balance at 27 March 2014 5,000 1,080,477 (372,026) 113,321 (362) 4 (95,665) 730,749
Total comprehensive income for the period
Profit for the period - - - - - - 72,171 72,171
Other comprehensive income - - - - 1,213 (4) - 1,209
Total comprehensive income for the period - - - - 1,213 (4) 72,171 73,380
Transactions with owners, recorded directly in equity
Cancellation of share premium (i) - (1,080,477) - - - - 1,080,477 -
Equity dividend paid (note 8) - - (8,942) (8,942)
Share based payment transactions - - - - - - 1,688 1,688
Total contributions by and distributions to owners - (1,080,477) - - - - 1,073,223 (7,254)
Balance at 26 March 2015 5,000 - (372,026) 113,321 851 - 1,049,729 796,875
19
Consolidated Statement of Changes in Equity as at 31 Ma
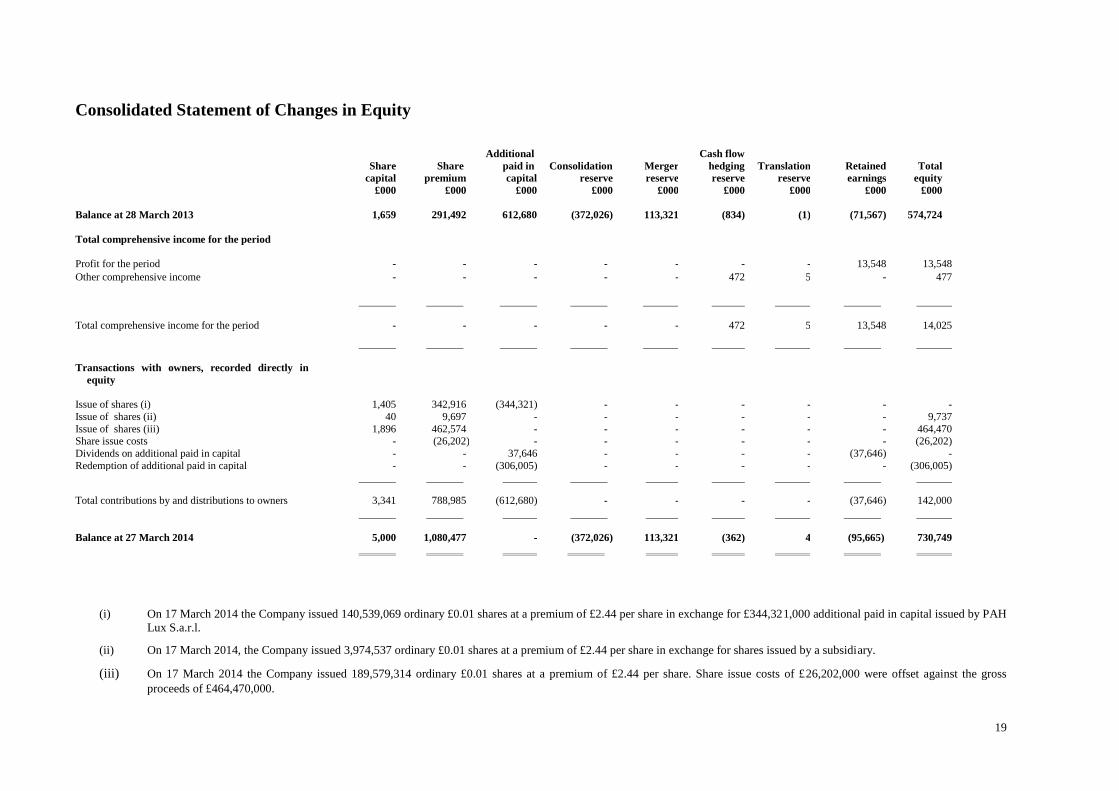
(i) On 17 March 2014 the Company issued 140,539,069 ordinary £0.01 shares at a premium of £2.44 per share in exchange for £344,321,000 additional paid in capital issued by PAH
Lux S.a.r.l.
(ii) On 17 March 2014, the Company issued 3,974,537 ordinary £0.01 shares at a premium of £2.44 per share in exchange for shares issued by a subsidiary.
(iii) On 17 March 2014 the Company issued 189,579,314 ordinary £0.01 shares at a premium of £2.44 per share. Share issue costs of £26,202,000 were offset against the gross
proceeds of £464,470,000.at 31 March 2013
Share
capital
Share
premium
Additional
paid in
capital
Consolidation
reserve
Merger
reserve
Cash flow
hedging
reserve
Translation
reserve
Retained
earnings
Total
equity
£000 £000 £000 £000 £000 £000 £000 £000 £000
Balance at 28 March 2013 1,659 291,492 612,680 (372,026) 113,321 (834) (1) (71,567) 574,724
Total comprehensive income for the period
Profit for the period - - - - - - - 13,548 13,548
Other comprehensive income - - - - - 472 5 - 477
Total comprehensive income for the period - - - - - 472 5 13,548 14,025
Transactions with owners, recorded directly in
equity
Issue of shares (i) 1,405 342,916 (344,321) - - - - - -
Issue of shares (ii) 40 9,697 - - - - - - 9,737
Issue of shares (iii) 1,896 462,574 - - - - - - 464,470 Share issue costs - (26,202) - - - - - - (26,202)
Dividends on additional paid in capital - - 37,646 - - - - (37,646) -
Redemption of additional paid in capital - - (306,005) - - - - - (306,005)
Total contributions by and distributions to owners 3,341 788,985 (612,680) - - - - (37,646) 142,000
Balance at 27 March 2014 5,000 1,080,477 - (372,026) 113,321 (362) 4 (95,665) 730,749

20
Consolidated Statement of Cash Flows 52 week period
ended 26 March 2015
52 week period
ended 27 March 2014
£000 £000
Cash flows from operating activities
Profit for the period 72,171 13,548
Adjustments for:
Depreciation and amortisation 22,838 19,990
Financial income (572) (368)
Financial expense 10,369 56,705
Loss on sale of property, plant and equipment - 77
Share based payment charges 1,657 -
Taxation 14,794 8,957
121,257 98,909
Increase in trade and other receivables (9,468) (7,969)
Increase in inventories (2,358) (4,060)
Increase in trade and other payables 16,132 21,771
(Decrease)/increase in IPO related trade and other payables (i) (25,184) 25,184
Total (decrease)/increase in trade and other payables (9,052) 46,955
(Decrease)/increase in provisions (225) 2
100,154 133,837
Tax paid – underlying (12,874) (9,192)
Tax received – exceptional 4,295 -
Net cash from operating activities 91,575 124,645
Cash flows from investing activities
Proceeds from sale of property, plant and equipment 874 -
Interest received 364 368
Investment in other financial assets (2,176) (1,753)
Acquisition of subsidiary, net of cash acquired - (2,000)
Acquisition of property, plant and equipment, and other intangible assets (30,361) (26,278)
Net cash used in investing activities (31,299) (29,663)
Cash flows from financing activities
Proceeds from the issue of ordinary share capital - 464,470
Share issue costs - (26,202)
Debt issue costs - (10,494)
Repayment of paid in capital - (306,005)
Equity dividends paid (8,942) -
Proceeds from new loan - 460,000
Repayment of borrowings - (585,260)
Interest paid (9,191) (32,261)
Net cash used in financing activities (18,133) (35,752)
Net increase in cash and cash equivalents 42,143 59,230
Cash and cash equivalents at beginning of period 90,823 31,593
Cash and cash equivalents at end of period 132,966 90,823
(i) The Initial Public Offering related payables of £25,184,000 at 27 March 2014 related to costs incurred as part of the IPO on 17 March 2014, which were included in accruals and other creditors at the period end date, and which were settled in full in the period to 26 March
2015.

21
Notes
1 Basis of Preparation
Pets at Home Group Plc (the Company) is a company incorporated in the United Kingdom and its registered office
is Epsom Avenue, Stanley Green, Handforth, Cheshire, SK9 3RN.
The company is listed on the London Stock Exchange.
The consolidated financial statements for the 52 week period ended 26 March 2015 have been prepared in
accordance with International Financial Reporting Standards as adopted by the EU (Adopted IFRS) and were
approved by the Directors of the Company on 2 June 2015 along with this preliminary announcement.
The consolidated financial statements are prepared on the historical costs basis except for derivative financial
instruments, share based payments and certain investments measured at their fair value.
The financial information included in this preliminary statement of results does not constitute statutory accounts
within the meaning of Section 435 of the Companies Act 2006 (the “Act”). The financial information for the 52
week period ended 26 March 2015 has been extracted from the statutory accounts on which an unqualified audit
opinion has been issued. Statutory accounts for the 52 week period ended 26 March 2015 will be delivered to the
Registrar of Companies following the Company’s Annual General Meeting.
The auditors have consented to the publication of the Preliminary Announcement as required by Listing Rule 9.7a
having completed their procedures under APB bulletin 2008/2.
The directors of Pets at Home Group Plc, having made appropriate enquiries, consider that adequate resources exist
for the Group to continue in operational existence for the foreseeable future and that, therefore, it is appropriate to
adopt the going concern basis in preparing the consolidated financial statements for the 52 week period ended 26
March 2015.
Summary of impact of Group restructuring and Initial Public Offering
On 17 March 2014, the entire issued share capital of the Company was admitted to the premium listing segment of
the Official List maintained by the United Kingdom Financial Conduct Authority and to trading on the London
Stock Exchange plc’s main market for listed securities (“Listing” or “IPO”). In preparation for the Company’s IPO
the Group was restructured.
For the consolidated financial statements of the Group, prepared under IFRS, the principles of reverse acquisition
accounting under IFRS 3 ”Business Combinations” have been applied for the comparative period ended 27 March
2014. The steps to restructure the Group had the effect of Pets at Home Group Plc being inserted as the new holding
company of the Group above Pets at Home Lux S.a.r.l (“PAH Lux”). Holders of shares and Preferred Equity
Certificates (PECs) in PAH Lux exchanged their PAH Lux shares and a portion of their PECs, for shares in Plc.
PAH Lux was transferred out of the Group following Listing.
By applying the principles of reverse acquisition accounting, the Group is presented as if the Company has always
owned PAH Lux and the Group’s subsidiaries. The comparative consolidated reserves of the Group are adjusted to
reflect the statutory share capital, share premium and merger reserve of Plc as if it had always existed, adjusted for
movements in the underlying PAH Lux share capital and reserves until the exchange of PAH Lux share capital and
PECs for Plc shares.
Full details of the reverse acquisition accounting applied were described in the financial statements for the 52 week
period ended 27 March 2014.

22
Notes (continued)
2 Segmental reporting
The Directors consider there to be one operating and reportable segment, being that of the sale of pet products and
services through retail outlets and the Group’s websites.
The Group’s Board receives monthly financial information at this level and uses this information to monitor the
performance of the store portfolio, allocate resources and make operational decisions. The internal reporting
received focuses on the Group as a whole and does not identify individual segments. To increase transparency, the
Group has decided to include an additional voluntary disclosure analysing revenue within the reportable segment.
Revenue
52 week period
ended
26 March 2015
52 week period
ended
27 March 2014
£000 £000
Food 359,377 327,101
Accessories 306,754 288,017
Services and other 62,955 50,277
729,086 665,395
The ‘services and other’ category includes veterinary group income, grooming revenue, insurance commissions,
and the sale of pets.

23
Notes (continued)
3 Operating profit
The performance of the operating segment is primarily based on a measure of Earnings Before Interest, Tax,
Depreciation, and Amortisation (EBITDA) before exceptional items, share based payment charges, and
management charges. This can be reconciled to statutory operating profit as follows:
52 week period
ended
26 March 2015
52 week period
ended
27 March 2014
£000 £000
Operating profit 96,762 78,842
Exceptional items - 10,574
Underlying operating profit before share based payment and management charges 96,762 89,416
Share based payment charges 1,657 31
Management charges - 1,221
Underlying operating profit after share based payment and management charges 98,419 90,668
Depreciation and amortisation 22,838 19,990
Underlying Earnings Before Interest, Tax, Depreciation, and Amortisation (EBITDA)
(before exceptional items)
121,257 110,658
Included in operating profit are the following:
52 week period
ended
26 March 2015
52 week period
ended
27 March 2014
£000 £000
Exceptional operating expenses - 10,574
Depreciation of tangible fixed assets 19,659 18,053
Amortisation of intangible assets 3,179 1,937
Rentals under operating leases:
Hire of plant and machinery 3,648 2,843
Property 66,474 61,903
Rental income from sublets (8,054) (5,952)
Loss on disposal of fixed assets - 77
There are no exceptional items included in operating profit in the 52 week period ended 26 March 2015. Exceptional
items of £10,574,000 in the 52 week period ended 27 March 2014 relate to costs associated with the Initial Public
Offering of Pets at Home Group Plc shares on the London Stock Exchange on 17 March 2014 (£9,383,000), and
costs associated with the integration of the Vets4Pets business into the group (£2,308,000), offset by a credit relating
to exceptional input VAT recovered (£1,117,000).

24
Notes (continued)
4 Colleague numbers and costs
The average number of persons employed (full time equivalents) by the group (including directors) during the
period, analysed by category, was as follows:
Number of colleagues
52 week period
ended
26 March 2015
52 week period
ended
27 March 2014
Number Number
Sales and distribution 4,863 4,414
Administration 397 345
5,260 4,759
The aggregate payroll costs of these persons were as follows:
52 week period
ended
26 March 2015
52 week period
ended
27 March
2014
£000 £000
Wages and salaries 122,510 109,549
Social security costs 10,051 8,512
Contributions to defined contribution plans 3,984 2,866
136,545 120,927

25
Notes (continued)
5 Earnings per share
Basic earnings per share is calculated by dividing the net profit for the period attributable to ordinary shareholders
by the weighted average number of ordinary shares outstanding during the period.
Diluted earnings per share is calculated by dividing the net profit for the period attributable to ordinary shareholders
by the weighted average number of ordinary shares outstanding during the period plus the weighted average number
of ordinary shares that would be issued on the conversion of all dilutive potential ordinary shares into ordinary
shares.
52 week period
ended
26 March 2015
52 week period
ended
26 March 2015
52 week period
ended
26 March 2015
52 week period
ended
27 March 2014
52 week period
ended
27 March 2014
52 week period
ended
27 March 2014
Underlying
Trading
Exceptionals After
Exceptionals
Underlying
Trading
Exceptionals After
Exceptionals
Profit attributable to equity shareholders of
the parent (£000s)
67,876 4,295 72,171 38,565 (25,017) 13,548
Less PEC dividend transferred from retained earnings
- - - (37,646) - (37,646)
67,876 4,295 72,171 919 (25,017) (24,098)
Basic weighted average number of shares 500,000,000 500,000,000 500,000,000 175,053,425 175,053,425 175,053,425
Dilutive potential ordinary shares 1,109,716 1,109,716 1,109,716 71,360 71,360 71,360
Diluted weighted average number of shares 501,109,716 501,109,716 501,109,716 175,124,785 175,124,785 175,124,785
Basic earnings per share 13.5p 0.9p 14.4p 0.5p (14.3p) (13.8p) £0.04
Diluted earnings per share 13.5p 0.9p 14.4p 0.5p (14.3p) (13.8p) £0.04

26
Notes (continued)
6 Finance expense
Recognised in the income statement
52 week period
ended
26 March 2015
52 week period
ended
27 March 2014
£000 £000
Bank loans at effective interest rate 10,367 36,176
Related party loan notes - 1,349
Other interest expense 2 22
Total underlying finance expense 10,369 37,547
Exceptional amortisation costs - 19,158
Total exceptional finance expense - 19,158
Total finance expense 10,369 56,705
Exceptional finance expenses in the 52 week period ended 27 March 2014 related to £19,158,000 of accelerated
amortisation following the repayment of the senior bank facility of £567,926,000 in that period.

27
Notes (continued)
7 Taxation
Recognised in the income statement
52 week period
ended
26 March 2015
52 week period
ended
27 March 2014
£000 £000
Current tax expense
Current period 15,307 7,840
Adjustments in respect of prior periods (5,065) 362
Current tax expense 10,242 8,202
Deferred tax expense
Origination and reversal of temporary differences 4,319 234
Reduction in tax rate - 28
Adjustments in respect of prior periods 233 493
Deferred tax expense 4,552 755
Total tax expense 14,794 8,957
The UK corporation tax standard rate for the period was 21% (2014: 23%). The March 2013 budget announced that
the UK corporation tax rate will further reduce to 20% (effective from 1st April 2015). This reduction was
substantively enacted on 2nd
July 2013. The deferred tax liability has been calculated based on the rate of 20%
substantively enacted at the balance sheet date.

28
Notes (continued)
7 Taxation (continued)
Deferred tax recognised in other comprehensive income
52 week period
ended
26 March 2015
52 week period
ended
27 March 2014
£000 £000
Effective portion of changes in fair value of cash flow hedges 303 159
Reconciliation of effective tax rate
8 52 week period
ended
26 March 2015
52 week period
ended
26 March 2015
52 week period
ended
26 March 2015
52 week period
ended
27 March 2014
Underlying Exceptional Total Total
£000 £000 £000 £000
Profit for the period 67,876 4,295 72,171 13,548
Total tax expense 19,089 (4,295) 14,794 8,957
Profit excluding taxation 86,965 - 86,965 22,505
Tax using the UK corporation tax rate for the
period of 21% (52 week period ended 27 March
2014: 23%)
18,263 - 18,263 5,177
Impact of reduction in tax rate on deferred tax
balances
(45) - (45) 28
Expenditure not eligible for tax relief 1,424 - 1,424 1,094
Non-deductible IPO costs – exceptional item - - - 2,055
Other 217 - 217 (251)
Adjustments in respect of prior periods (770) (4,295) (5,065) 854
Total tax expense 19,089 (4,295) 14,794 8,957
The UK corporation tax standard rate for the 52 week period ended 26 March 2015 was 21% (52 week period ended
27 March 2014: 23%). The effective tax rate before exceptional items for the 52 weeks to 26 March 2015 was 22%.
The principal reason for the difference in rate relates to the non-deductibility of depreciation charged on some
capital expenditure.
The exceptional tax credit of £4.3m included within the non-recurring exceptional items represents the release of a
provision following agreement with HMRC in respect of interest on debt associated with the pre IPO structure. As
part of the IPO process this debt was repaid. Overall this results in a total effective tax rate for the period of 17%.

29
Notes (continued)
8 Dividends paid and proposed
52 week period
ended
26 March 2015
52 week period
ended
27 March 2014
£000 £000
Declared and paid during the period
Interim dividend of 1.8p per share 8,942 -
Proposed for approval by shareholders at the AGM
Final dividend of 3.6p per share 17,932 -
The trustees of the following holdings of Pets at Home Group Plc shares under the Pets at Home Group Employee
Benefit Trusts have waived or otherwise foregone any and all dividends paid in FY15 and to be paid at any time in
the future (subject to the exceptions in the relevant trust deed) on its respective shares for the time being comprised
in the Trust Funds as follows: Computershare Nominees (Channel Islands) Limited (holding at 26 March 2015:
1,466,861 shares, holding at 27 March 2014: 1,472,148 shares), has waived its rights to all dividends; and, Wealth
Nominees Limited (holding at 26 March 2015: 434,056 shares, holding at 27 March 2014: 1,743,430 shares), has
waived its rights to all dividends.

30
Notes (continued)
9 Other interest-bearing loans and borrowings
At 26 March
2015
At 27 March
2014
£000 £000
Non-current liabilities
Secured bank loans 315,674 319,855
Current liabilities
Current portion of secured bank loans 5,000 -
5,000 -
Total liabilities
Secured bank loans 320,674 319,855
Terms and debt repayment schedule
Currency Nominal
interest rate
Year of
maturity
Face
value
Carrying
amount
Face
value
Carrying
amount
26 March
2015
26 March
2015
27 March
2014
27 March
2014
£000 £000 £000 £000
Senior Finance Bank Loans GBP LIBOR +2-2.25% 2019-2020 325,000 320,674 325,000 319,855
Face value represents the principal value of the Senior Finance Bank Loans.
Interest-bearing borrowings are recognised initially at fair value, being the principal value of the loan, net of
attributable transaction costs. Subsequent to initial recognition, interest-bearing borrowings are stated at a carrying
value, which represents the amortised cost of the loans using the effective interest method, less any impairment
losses.
At 26 March 2015, the Group had an undrawn revolving credit facility of £29.6m (period to 27 March 2014 £27.0m)
which was due to expire on 17 March 2019.
All bank borrowings are secured via fixed charges over the head office freehold property, the distribution centre
leasehold property, and any plant and machinery owned by the Group, and also via a floating charge over the other
assets of the Group. The senior bank loans bear interest at LIBOR plus a margin, which during the period varied
between 2.0% and 2.25%, with the margin decreasing as the group’s leverage (defined as total net debt to
consolidated EBITDA) decreases. The senior bank loans were due for repayment at various dates up to 17 March
2020.
The Pets at Home Group has entered into fixed rate interest rate swap agreements over a total of £239.8m of the
senior facility borrowings at a fixed rate of 0.74% and a further fixed rate interest rate swap over a total of £77.1m at
a fixed rate of 0.655% (at 27 March 2014: £291.8m of the senior facility borrowings at a fixed rate of 0.74% and
£25.1m at a fixed rate of 0.655%). Both swaps expire on 30 March 2016. The hedges are structured to hedge at
least 70% of the outstanding debt.
31
Notes (continued)
9 Other interest-bearing loans and borrowings (continued)
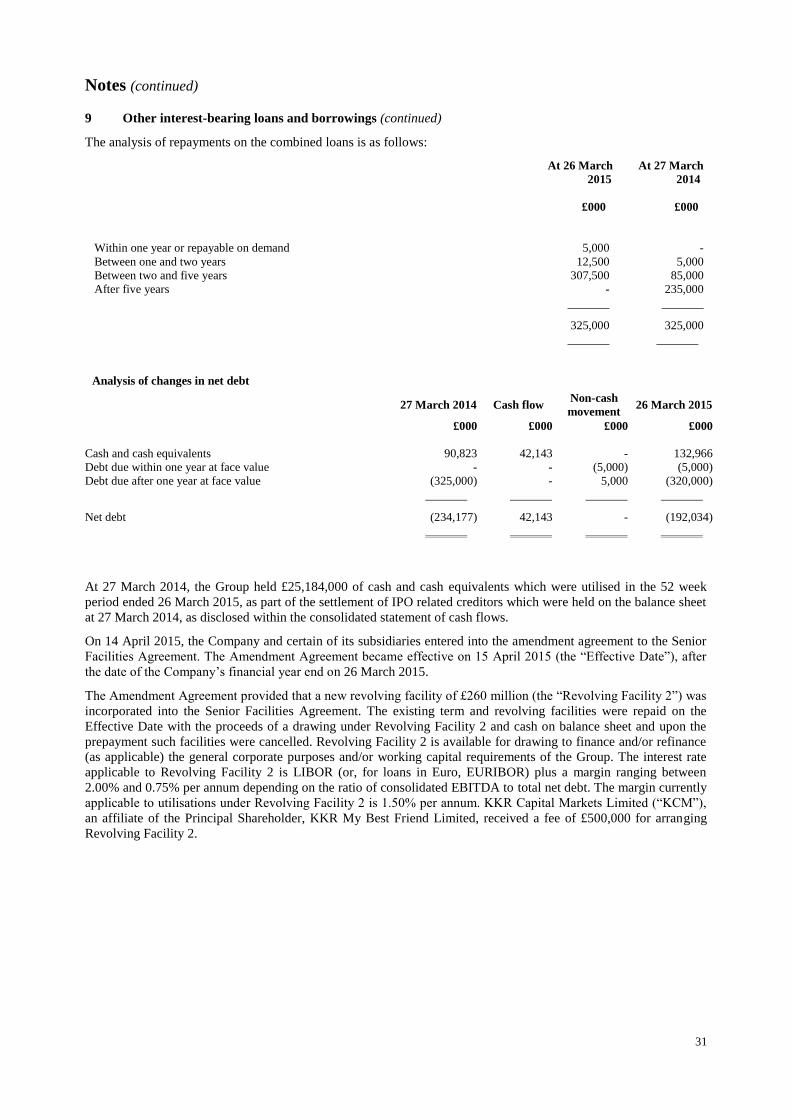
The analysis of repayments on the combined loans is as follows:
At 26 March
2015
At 27 March
2014
£000 £000
Within one year or repayable on demand 5,000 -
Between one and two years 12,500 5,000
Between two and five years 307,500 85,000
After five years - 235,000
325,000 325,000
Analysis of changes in net debt
At 27 March 2014, the Group held £25,184,000 of cash and cash equivalents which were utilised in the 52 week
period ended 26 March 2015, as part of the settlement of IPO related creditors which were held on the balance sheet
at 27 March 2014, as disclosed within the consolidated statement of cash flows.
On 14 April 2015, the Company and certain of its subsidiaries entered into the amendment agreement to the Senior
Facilities Agreement. The Amendment Agreement became effective on 15 April 2015 (the “Effective Date”), after
the date of the Company’s financial year end on 26 March 2015.
The Amendment Agreement provided that a new revolving facility of £260 million (the “Revolving Facility 2”) was
incorporated into the Senior Facilities Agreement. The existing term and revolving facilities were repaid on the
Effective Date with the proceeds of a drawing under Revolving Facility 2 and cash on balance sheet and upon the
prepayment such facilities were cancelled. Revolving Facility 2 is available for drawing to finance and/or refinance
(as applicable) the general corporate purposes and/or working capital requirements of the Group. The interest rate
applicable to Revolving Facility 2 is LIBOR (or, for loans in Euro, EURIBOR) plus a margin ranging between
2.00% and 0.75% per annum depending on the ratio of consolidated EBITDA to total net debt. The margin currently
applicable to utilisations under Revolving Facility 2 is 1.50% per annum. KKR Capital Markets Limited (“KCM”),
an affiliate of the Principal Shareholder, KKR My Best Friend Limited, received a fee of £500,000 for arranging
Revolving Facility 2.
27 March 2014 Cash flow
Non-cash
movement 26 March 2015
£000 £000 £000 £000
Cash and cash equivalents 90,823 42,143 - 132,966
Debt due within one year at face value - - (5,000) (5,000)
Debt due after one year at face value (325,000) - 5,000 (320,000)
Net debt (234,177) 42,143 - (192,034)