perspectiva económica global - marzo 2016 - franklin templeton investments - equipo de renta fija
TRANSCRIPT

For Financial Professional Use Only / Not For Public Distribution
Global Economic Perspective PERSPECTIVE FROM THE FRANKLIN TEMPLETON FIXED INCOME GROUP®
Investment Team Update March 2016
IN THIS ISSUE: • US Economic Data Reassure and Oil Prices Steady • China’s Economy Still Slowing, Though Better News for
Commodity Producers • Europe’s Central Bank Acts Boldly on Inflation but Region’s Real
Economy Holding Up
US Economic Data Reassure and Oil Prices Steady
The resilience of the US economy, as demonstrated by recent data, aligns with our previously outlined thinking that US fundamentals remain relatively solid, and that market movements at the start of 2016 may have overstated the external risks to US growth. Policymakers at the US Federal Reserve (Fed) have given a variety of indications about how much these external developments will influence future decisions, but given their consistent emphasis that any such moves will be data-dependent, it seems likely that the past month’s broadly positive economic numbers will feature prominently in their thinking.
Over the course of February and immediately following month-end, reassuring signs emerged that the US economy remained on course despite slowing global growth. In tandem with a stabilisation of oil prices, such developments helped to quell the unease seen across financial markets since the start of the year. Uncertainty about how the US economy would deal with weakness in other countries and a tightening of financial conditions peaked in
mid-February, exacerbating market volatility. As a result, 10-year US Treasury yields fell to their lowest level since 2012 amid rising risk aversion among investors, while the already significant distance between the Fed’s own forecasts for the timing of future rises in US policy rates and the far slower pace forecasted by market consensus widened even further.
However, during the second half of February, several pieces of economic data beat consensus expectations, refuting more bearish forecasts that the US economy was about to tip into recession. The positive news included an upward revision of annualised gross domestic product (GDP) growth for the fourth quarter of 2015 from 0.7% to 1.0%, even though this was largely due to a build-up of inventories, which was seen as a potential headwind for the US economy over the first three months of 2016. The strength of the US consumer was underlined by January’s acceleration of both personal income and consumer spending by 0.5% compared with the previous month, suggesting this key driver of the US economy remained intact. Income was boosted
Christopher Molumphy
Michael Materasso
Roger Bayston
John Beck
David Zahn
Has the early year unease in financial markets abated? Our Fixed Income Group sees signs of stability.
“ ”
franklintempleton.com
For Financial Professional Use Only / Not For Public Distribution
Global Economic Perspective
by a 0.6% monthly rise in wages and salaries, the third healthy gain in the last four months, underlining how the robust US labour market was likely feeding into consumer demand.
The February payroll report provided further evidence that the path for the US economy had not yet been significantly affected by external headwinds. An addition of 242,000 jobs was much higher than expected and was accompanied by upward revisions to the number of jobs added in each of the two prior months. The unemployment rate was unchanged at 4.9%, remaining at its lowest level since 2008, while the labour force participation rate continued to rebound, rising slightly to 62.9% as the strong labour market encouraged more people to start, or resume, looking for jobs. The February report, however, did contain some less encouraging news on wages, with average hourly earnings weaker than forecast, sliding 0.1% month-on-month compared with January’s 0.5% expansion, and the annual rate falling 0.3% from the previous month to 2.2%.
2
There was some more encouraging news from US manufacturers, with January’s industrial production and durable goods numbers indicating that concerns about previously weak data might have been overdone. Though the Institute for Supply Management’s (ISM’s) manufacturing purchasing managers’ index (PMI) for February remained slightly below the 50 level that would signify expansion, the trend within the survey for production and new orders was positive. Overall, the picture indicated domestic demand for most companies was holding up reasonably well, even as conditions for exporters and energy-related sectors remained difficult. The ISM’s PMI for services remained in expansionary territory in February, showing little change from the previous month except for the employment element of the survey, which marginally contracted for the first time since early 2014.
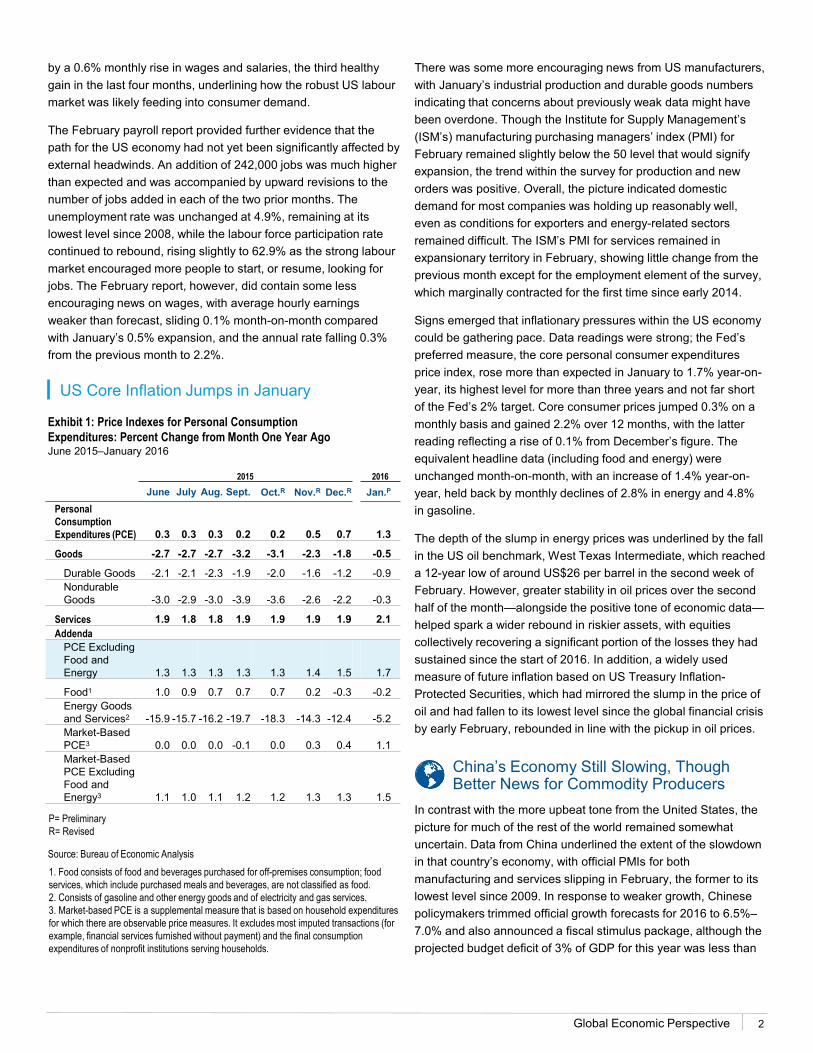
Signs emerged that inflationary pressures within the US economy could be gathering pace. Data readings were strong; the Fed’s preferred measure, the core personal consumer expenditures price index, rose more than expected in January to 1.7% year-on-year, its highest level for more than three years and not far short of the Fed’s 2% target. Core consumer prices jumped 0.3% on a monthly basis and gained 2.2% over 12 months, with the latter reading reflecting a rise of 0.1% from December’s figure. The equivalent headline data (including food and energy) were unchanged month-on-month, with an increase of 1.4% year-on-year, held back by monthly declines of 2.8% in energy and 4.8% in gasoline.
The depth of the slump in energy prices was underlined by the fall in the US oil benchmark, West Texas Intermediate, which reached a 12-year low of around US$26 per barrel in the second week of February. However, greater stability in oil prices over the second half of the month—alongside the positive tone of economic data—helped spark a wider rebound in riskier assets, with equities collectively recovering a significant portion of the losses they had sustained since the start of 2016. In addition, a widely used measure of future inflation based on US Treasury Inflation-Protected Securities, which had mirrored the slump in the price of oil and had fallen to its lowest level since the global financial crisis by early February, rebounded in line with the pickup in oil prices.
China’s Economy Still Slowing, Though Better News for Commodity Producers
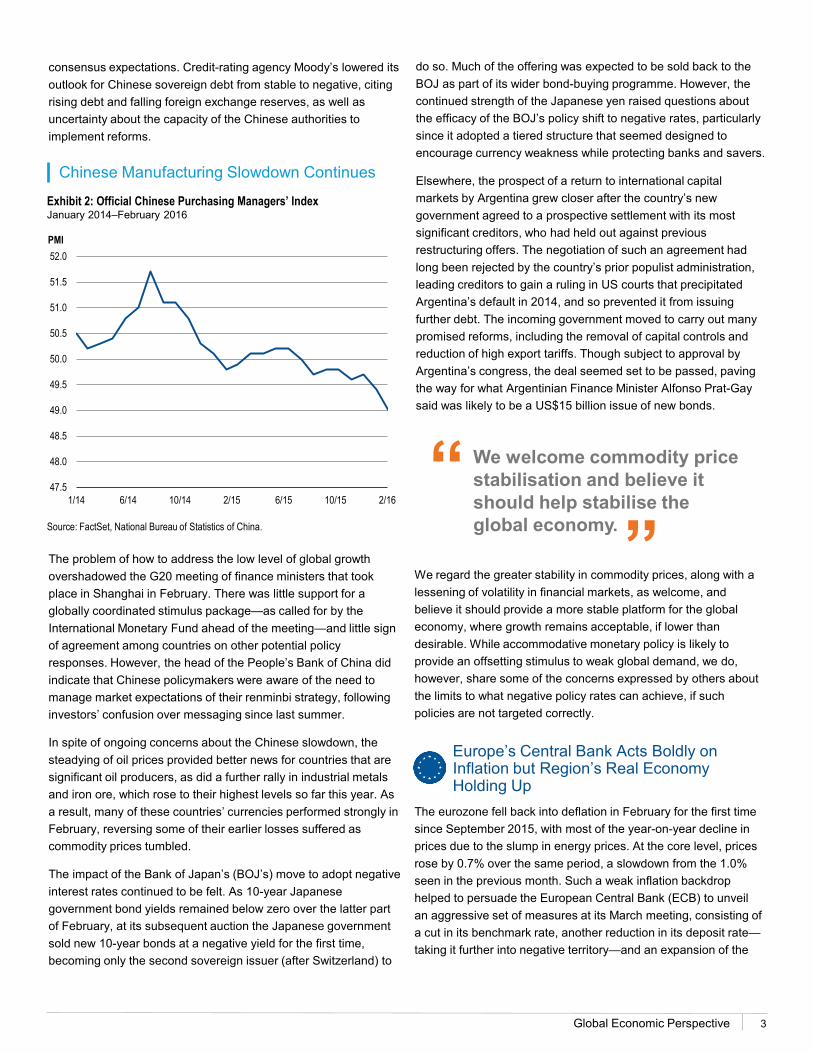
In contrast with the more upbeat tone from the United States, the picture for much of the rest of the world remained somewhat uncertain. Data from China underlined the extent of the slowdown in that country’s economy, with official PMIs for both manufacturing and services slipping in February, the former to its lowest level since 2009. In response to weaker growth, Chinese policymakers trimmed official growth forecasts for 2016 to 6.5%–7.0% and also announced a fiscal stimulus package, although the projected budget deficit of 3% of GDP for this year was less than
Exhibit 1: Price Indexes for Personal Consumption Expenditures: Percent Change from Month One Year Ago June 2015–January 2016
US Core Inflation Jumps in January
2015 2016 June July Aug. Sept. Oct.R Nov.R Dec.R Jan.P
Personal Consumption Expenditures (PCE) 0.3 0.3 0.3 0.2 0.2 0.5 0.7 1.3
Goods -2.7 -2.7 -2.7 -3.2 -3.1 -2.3 -1.8 -0.5
Durable Goods -2.1 -2.1 -2.3 -1.9 -2.0 -1.6 -1.2 -0.9 Nondurable Goods -3.0 -2.9 -3.0 -3.9 -3.6 -2.6 -2.2 -0.3
Services 1.9 1.8 1.8 1.9 1.9 1.9 1.9 2.1 Addenda
PCE Excluding Food and Energy 1.3 1.3 1.3 1.3 1.3 1.4 1.5 1.7
Food1 1.0 0.9 0.7 0.7 0.7 0.2 -0.3 -0.2 Energy Goods and Services2 -15.9 -15.7 -16.2 -19.7 -18.3 -14.3 -12.4 -5.2 Market-Based PCE3 0.0 0.0 0.0 -0.1 0.0 0.3 0.4 1.1 Market-Based PCE Excluding Food and Energy3 1.1 1.0 1.1 1.2 1.2 1.3 1.3 1.5
1. Food consists of food and beverages purchased for off-premises consumption; food services, which include purchased meals and beverages, are not classified as food. 2. Consists of gasoline and other energy goods and of electricity and gas services. 3. Market-based PCE is a supplemental measure that is based on household expenditures for which there are observable price measures. It excludes most imputed transactions (for example, financial services furnished without payment) and the final consumption expenditures of nonprofit institutions serving households.
Source: Bureau of Economic Analysis
P= Preliminary R= Revised
franklintempleton.com
For Financial Professional Use Only / Not For Public Distribution
Global Economic Perspective
The problem of how to address the low level of global growth overshadowed the G20 meeting of finance ministers that took place in Shanghai in February. There was little support for a globally coordinated stimulus package—as called for by the International Monetary Fund ahead of the meeting—and little sign of agreement among countries on other potential policy responses. However, the head of the People’s Bank of China did indicate that Chinese policymakers were aware of the need to manage market expectations of their renminbi strategy, following investors’ confusion over messaging since last summer.
In spite of ongoing concerns about the Chinese slowdown, the steadying of oil prices provided better news for countries that are significant oil producers, as did a further rally in industrial metals and iron ore, which rose to their highest levels so far this year. As a result, many of these countries’ currencies performed strongly in February, reversing some of their earlier losses suffered as commodity prices tumbled.
The impact of the Bank of Japan’s (BOJ’s) move to adopt negative interest rates continued to be felt. As 10-year Japanese government bond yields remained below zero over the latter part of February, at its subsequent auction the Japanese government sold new 10-year bonds at a negative yield for the first time, becoming only the second sovereign issuer (after Switzerland) to
3
consensus expectations. Credit-rating agency Moody’s lowered its outlook for Chinese sovereign debt from stable to negative, citing rising debt and falling foreign exchange reserves, as well as uncertainty about the capacity of the Chinese authorities to implement reforms.
We welcome commodity price stabilisation and believe it should help stabilise the global economy.
“ ”
Exhibit 2: Official Chinese Purchasing Managers’ Index January 2014–February 2016
Source: FactSet, National Bureau of Statistics of China.
Chinese Manufacturing Slowdown Continues
do so. Much of the offering was expected to be sold back to the BOJ as part of its wider bond-buying programme. However, the continued strength of the Japanese yen raised questions about the efficacy of the BOJ’s policy shift to negative rates, particularly since it adopted a tiered structure that seemed designed to encourage currency weakness while protecting banks and savers.
Elsewhere, the prospect of a return to international capital markets by Argentina grew closer after the country’s new government agreed to a prospective settlement with its most significant creditors, who had held out against previous restructuring offers. The negotiation of such an agreement had long been rejected by the country’s prior populist administration, leading creditors to gain a ruling in US courts that precipitated Argentina’s default in 2014, and so prevented it from issuing further debt. The incoming government moved to carry out many promised reforms, including the removal of capital controls and reduction of high export tariffs. Though subject to approval by Argentina’s congress, the deal seemed set to be passed, paving the way for what Argentinian Finance Minister Alfonso Prat-Gay said was likely to be a US$15 billion issue of new bonds.
47.5
48.0
48.5
49.0
49.5
50.0
50.5
51.0
51.5
52.0
1/14 6/14 10/14 2/15 6/15 10/15 2/16
PMI
We regard the greater stability in commodity prices, along with a lessening of volatility in financial markets, as welcome, and believe it should provide a more stable platform for the global economy, where growth remains acceptable, if lower than desirable. While accommodative monetary policy is likely to provide an offsetting stimulus to weak global demand, we do, however, share some of the concerns expressed by others about the limits to what negative policy rates can achieve, if such policies are not targeted correctly.
Europe’s Central Bank Acts Boldly on Inflation but Region’s Real Economy Holding Up
The eurozone fell back into deflation in February for the first time since September 2015, with most of the year-on-year decline in prices due to the slump in energy prices. At the core level, prices rose by 0.7% over the same period, a slowdown from the 1.0% seen in the previous month. Such a weak inflation backdrop helped to persuade the European Central Bank (ECB) to unveil an aggressive set of measures at its March meeting, consisting of a cut in its benchmark rate, another reduction in its deposit rate—taking it further into negative territory—and an expansion of the
franklintempleton.com
For Financial Professional Use Only / Not For Public Distribution
Global Economic Perspective 4
size and scope of its bond-buying programme. At the same time, the ECB cut its inflation forecast for 2016 from 1.0% to 0.1%.
In terms of other data, the overall tone for Europe was slightly negative, giving some weight to the argument that Europe was more exposed than the United States to the effects of weakness in emerging markets. The Ifo survey of German business expectations fell to 98.8 in February, down from 102.3 in January and to its lowest level since 2012. However, a survey of German consumers, who have made a significant contribution to driving growth in Europe’s largest economy, came in higher than consensus expectations during February, as the country’s tight labour market bolstered confidence.
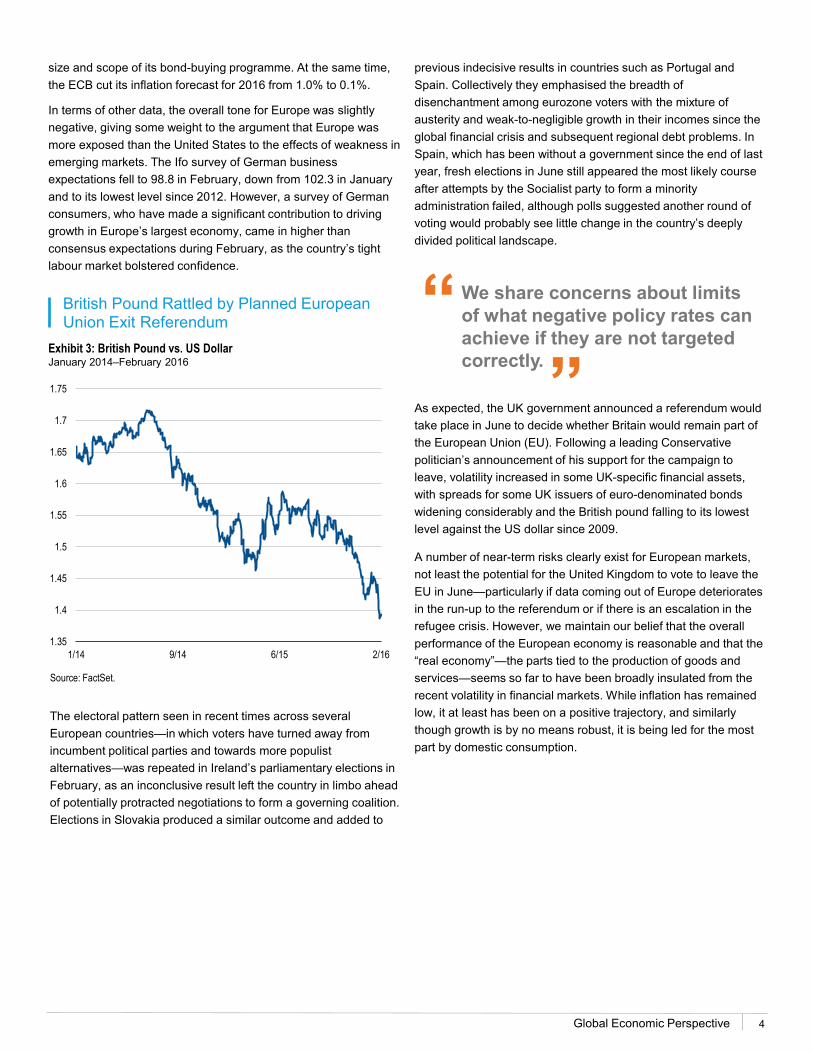
Exhibit 3: British Pound vs. US Dollar January 2014–February 2016
Source: FactSet.
British Pound Rattled by Planned European Union Exit Referendum
The electoral pattern seen in recent times across several European countries—in which voters have turned away from incumbent political parties and towards more populist alternatives—was repeated in Ireland’s parliamentary elections in February, as an inconclusive result left the country in limbo ahead of potentially protracted negotiations to form a governing coalition. Elections in Slovakia produced a similar outcome and added to
1.35
1.4
1.45
1.5
1.55
1.6
1.65
1.7
1.75
1/14 9/14 6/15 2/16
previous indecisive results in countries such as Portugal and Spain. Collectively they emphasised the breadth of disenchantment among eurozone voters with the mixture of austerity and weak-to-negligible growth in their incomes since the global financial crisis and subsequent regional debt problems. In Spain, which has been without a government since the end of last year, fresh elections in June still appeared the most likely course after attempts by the Socialist party to form a minority administration failed, although polls suggested another round of voting would probably see little change in the country’s deeply divided political landscape.
As expected, the UK government announced a referendum would take place in June to decide whether Britain would remain part of the European Union (EU). Following a leading Conservative politician’s announcement of his support for the campaign to leave, volatility increased in some UK-specific financial assets, with spreads for some UK issuers of euro-denominated bonds widening considerably and the British pound falling to its lowest level against the US dollar since 2009.
A number of near-term risks clearly exist for European markets, not least the potential for the United Kingdom to vote to leave the EU in June—particularly if data coming out of Europe deteriorates in the run-up to the referendum or if there is an escalation in the refugee crisis. However, we maintain our belief that the overall performance of the European economy is reasonable and that the “real economy”—the parts tied to the production of goods and services—seems so far to have been broadly insulated from the recent volatility in financial markets. While inflation has remained low, it at least has been on a positive trajectory, and similarly though growth is by no means robust, it is being led for the most part by domestic consumption.
We share concerns about limits of what negative policy rates can achieve if they are not targeted correctly.
“ ”
franklintempleton.com
For Financial Professional Use Only / Not For Public Distribution
Global Economic Perspective 5
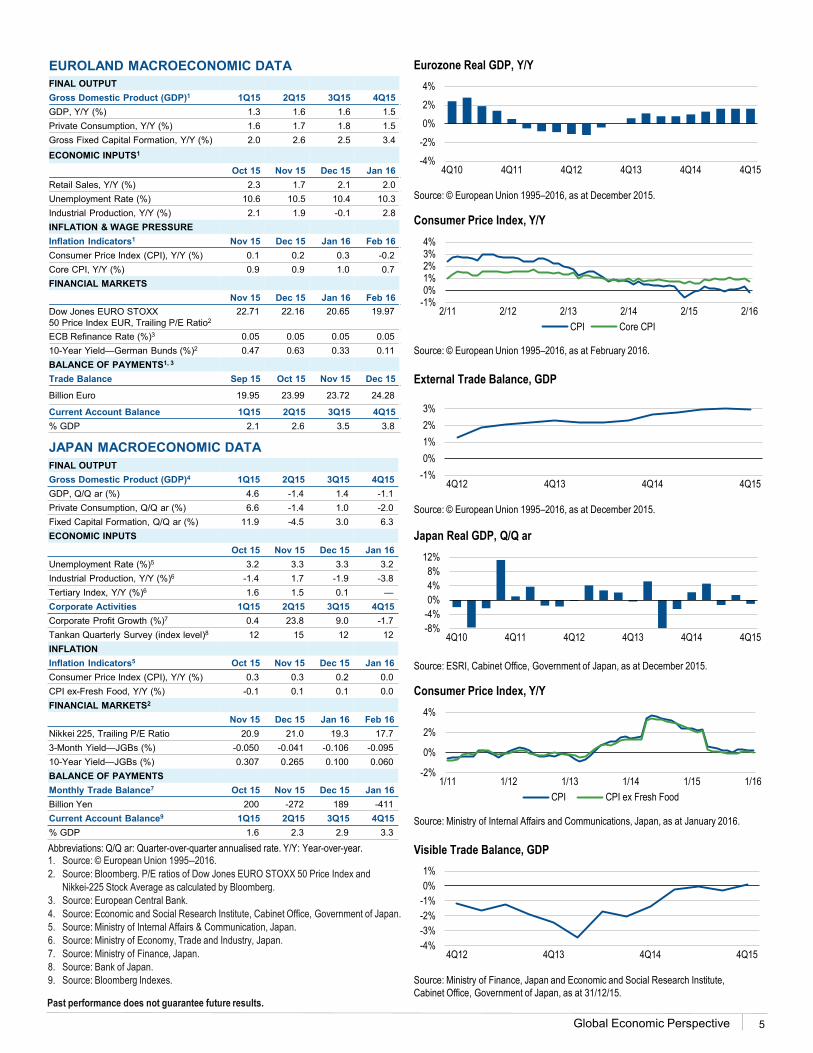
EUROLAND MACROECONOMIC DATA
Abbreviations: Q/Q ar: Quarter-over-quarter annualised rate. Y/Y: Year-over-year. 1. Source: © European Union 1995–2016. 2. Source: Bloomberg. P/E ratios of Dow Jones EURO STOXX 50 Price Index and
Nikkei-225 Stock Average as calculated by Bloomberg. 3. Source: European Central Bank. 4. Source: Economic and Social Research Institute, Cabinet Office, Government of Japan. 5. Source: Ministry of Internal Affairs & Communication, Japan. 6. Source: Ministry of Economy, Trade and Industry, Japan. 7. Source: Ministry of Finance, Japan. 8. Source: Bank of Japan. 9. Source: Bloomberg Indexes.
JAPAN MACROECONOMIC DATA
Eurozone Real GDP, Y/Y
Source: © European Union 1995–2016, as at December 2015.
Consumer Price Index, Y/Y
Source: © European Union 1995–2016, as at February 2016.
External Trade Balance, GDP
Source: © European Union 1995–2016, as at December 2015.
Japan Real GDP, Q/Q ar
Source: ESRI, Cabinet Office, Government of Japan, as at December 2015.
Consumer Price Index, Y/Y
Source: Ministry of Internal Affairs and Communications, Japan, as at January 2016.
Visible Trade Balance, GDP
Source: Ministry of Finance, Japan and Economic and Social Research Institute, Cabinet Office, Government of Japan, as at 31/12/15.
FINAL OUTPUT Gross Domestic Product (GDP)4 1Q15 2Q15 3Q15 4Q15 GDP, Q/Q ar (%) 4.6 -1.4 1.4 -1.1 Private Consumption, Q/Q ar (%) 6.6 -1.4 1.0 -2.0 Fixed Capital Formation, Q/Q ar (%) 11.9 -4.5 3.0 6.3 ECONOMIC INPUTS Oct 15 Nov 15 Dec 15 Jan 16 Unemployment Rate (%)5 3.2 3.3 3.3 3.2 Industrial Production, Y/Y (%)6 -1.4 1.7 -1.9 -3.8 Tertiary Index, Y/Y (%)6 1.6 1.5 0.1 — Corporate Activities 1Q15 2Q15 3Q15 4Q15 Corporate Profit Growth (%)7 0.4 23.8 9.0 -1.7 Tankan Quarterly Survey (index level)8 12 15 12 12 INFLATION Inflation Indicators5 Oct 15 Nov 15 Dec 15 Jan 16 Consumer Price Index (CPI), Y/Y (%) 0.3 0.3 0.2 0.0 CPI ex-Fresh Food, Y/Y (%) -0.1 0.1 0.1 0.0 FINANCIAL MARKETS2 Nov 15 Dec 15 Jan 16 Feb 16 Nikkei 225, Trailing P/E Ratio 20.9 21.0 19.3 17.7 3-Month Yield—JGBs (%) -0.050 -0.041 -0.106 -0.095 10-Year Yield—JGBs (%) 0.307 0.265 0.100 0.060 BALANCE OF PAYMENTS Monthly Trade Balance7 Oct 15 Nov 15 Dec 15 Jan 16 Billion Yen 200 -272 189 -411 Current Account Balance9 1Q15 2Q15 3Q15 4Q15 % GDP 1.6 2.3 2.9 3.3
-4%
-2%
0%
2%
4%
4Q10 4Q11 4Q12 4Q13 4Q14 4Q15
-1%0%1%2%3%4%
2/11 2/12 2/13 2/14 2/15 2/16CPI Core CPI
-1%0%1%2%3%
4Q12 4Q13 4Q14 4Q15
-8%-4%0%4%8%
12%
4Q10 4Q11 4Q12 4Q13 4Q14 4Q15
-2%
0%
2%
4%
1/11 1/12 1/13 1/14 1/15 1/16CPI CPI ex Fresh Food
-4%-3%-2%-1%0%1%
4Q12 4Q13 4Q14 4Q15
FINAL OUTPUT Gross Domestic Product (GDP)1 1Q15 2Q15 3Q15 4Q15 GDP, Y/Y (%) 1.3 1.6 1.6 1.5 Private Consumption, Y/Y (%) 1.6 1.7 1.8 1.5 Gross Fixed Capital Formation, Y/Y (%) 2.0 2.6 2.5 3.4 ECONOMIC INPUTS1 Oct 15 Nov 15 Dec 15 Jan 16 Retail Sales, Y/Y (%) 2.3 1.7 2.1 2.0 Unemployment Rate (%) 10.6 10.5 10.4 10.3 Industrial Production, Y/Y (%) 2.1 1.9 -0.1 2.8 INFLATION & WAGE PRESSURE Inflation Indicators1 Nov 15 Dec 15 Jan 16 Feb 16 Consumer Price Index (CPI), Y/Y (%) 0.1 0.2 0.3 -0.2 Core CPI, Y/Y (%) 0.9 0.9 1.0 0.7 FINANCIAL MARKETS Nov 15 Dec 15 Jan 16 Feb 16 Dow Jones EURO STOXX 50 Price Index EUR, Trailing P/E Ratio2
22.71 22.16 20.65 19.97
ECB Refinance Rate (%)3 0.05 0.05 0.05 0.05 10-Year Yield—German Bunds (%)2 0.47 0.63 0.33 0.11 BALANCE OF PAYMENTS1, 3 Trade Balance Sep 15 Oct 15 Nov 15 Dec 15
Billion Euro 19.95 23.99 23.72 24.28
Current Account Balance 1Q15 2Q15 3Q15 4Q15 % GDP 2.1 2.6 3.5 3.8
Past performance does not guarantee future results.
franklintempleton.com
For Financial Professional Use Only / Not For Public Distribution
Global Economic Perspective 6
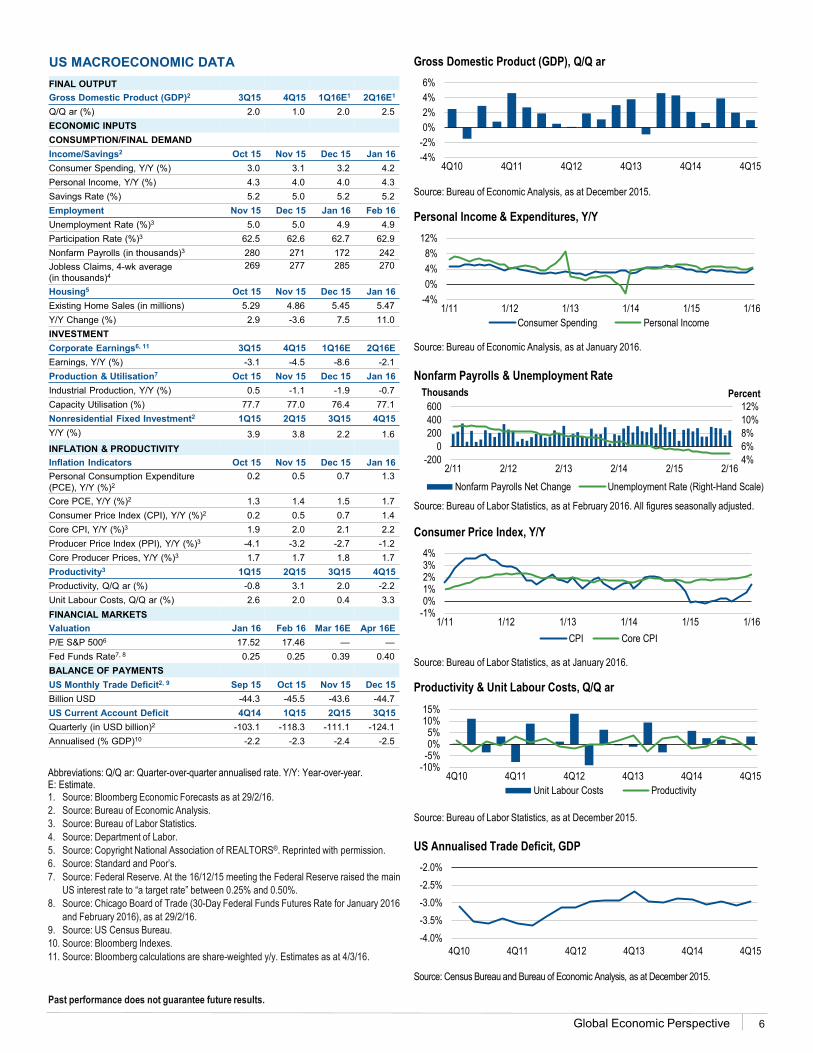
US MACROECONOMIC DATA
Abbreviations: Q/Q ar: Quarter-over-quarter annualised rate. Y/Y: Year-over-year. E: Estimate. 1. Source: Bloomberg Economic Forecasts as at 29/2/16. 2. Source: Bureau of Economic Analysis. 3. Source: Bureau of Labor Statistics. 4. Source: Department of Labor. 5. Source: Copyright National Association of REALTORS®. Reprinted with permission. 6. Source: Standard and Poor’s. 7. Source: Federal Reserve. At the 16/12/15 meeting the Federal Reserve raised the main
US interest rate to “a target rate” between 0.25% and 0.50%. 8. Source: Chicago Board of Trade (30-Day Federal Funds Futures Rate for January 2016
and February 2016), as at 29/2/16. 9. Source: US Census Bureau. 10. Source: Bloomberg Indexes. 11. Source: Bloomberg calculations are share-weighted y/y. Estimates as at 4/3/16.
FINAL OUTPUT Gross Domestic Product (GDP)2 3Q15 4Q15 1Q16E1 2Q16E1 Q/Q ar (%) 2.0 1.0 2.0 2.5 ECONOMIC INPUTS CONSUMPTION/FINAL DEMAND Income/Savings2 Oct 15 Nov 15 Dec 15 Jan 16 Consumer Spending, Y/Y (%) 3.0 3.1 3.2 4.2 Personal Income, Y/Y (%) 4.3 4.0 4.0 4.3 Savings Rate (%) 5.2 5.0 5.2 5.2 Employment Nov 15 Dec 15 Jan 16 Feb 16 Unemployment Rate (%)3 5.0 5.0 4.9 4.9 Participation Rate (%)3 62.5 62.6 62.7 62.9 Nonfarm Payrolls (in thousands)3 280 271 172 242 Jobless Claims, 4-wk average (in thousands)4
269 277 285 270
Housing5 Oct 15 Nov 15 Dec 15 Jan 16 Existing Home Sales (in millions) 5.29 4.86 5.45 5.47 Y/Y Change (%) 2.9 -3.6 7.5 11.0 INVESTMENT Corporate Earnings6, 11 3Q15 4Q15 1Q16E 2Q16E Earnings, Y/Y (%) -3.1 -4.5 -8.6 -2.1 Production & Utilisation7 Oct 15 Nov 15 Dec 15 Jan 16 Industrial Production, Y/Y (%) 0.5 -1.1 -1.9 -0.7 Capacity Utilisation (%) 77.7 77.0 76.4 77.1 Nonresidential Fixed Investment2 1Q15 2Q15 3Q15 4Q15 Y/Y (%) 3.9 3.8 2.2 1.6 INFLATION & PRODUCTIVITY Inflation Indicators Oct 15 Nov 15 Dec 15 Jan 16 Personal Consumption Expenditure (PCE), Y/Y (%)2
0.2 0.5 0.7 1.3
Core PCE, Y/Y (%)2 1.3 1.4 1.5 1.7 Consumer Price Index (CPI), Y/Y (%)2 0.2 0.5 0.7 1.4 Core CPI, Y/Y (%)3 1.9 2.0 2.1 2.2 Producer Price Index (PPI), Y/Y (%)3 -4.1 -3.2 -2.7 -1.2 Core Producer Prices, Y/Y (%)3 1.7 1.7 1.8 1.7 Productivity3 1Q15 2Q15 3Q15 4Q15 Productivity, Q/Q ar (%) -0.8 3.1 2.0 -2.2 Unit Labour Costs, Q/Q ar (%) 2.6 2.0 0.4 3.3 FINANCIAL MARKETS Valuation Jan 16 Feb 16 Mar 16E Apr 16E P/E S&P 5006 17.52 17.46 — — Fed Funds Rate7, 8 0.25 0.25 0.39 0.40 BALANCE OF PAYMENTS US Monthly Trade Deficit2, 9 Sep 15 Oct 15 Nov 15 Dec 15 Billion USD -44.3 -45.5 -43.6 -44.7 US Current Account Deficit 4Q14 1Q15 2Q15 3Q15 Quarterly (in USD billion)2 -103.1 -118.3 -111.1 -124.1 Annualised (% GDP)10 -2.2 -2.3 -2.4 -2.5
Gross Domestic Product (GDP), Q/Q ar
Source: Bureau of Economic Analysis, as at December 2015.
Personal Income & Expenditures, Y/Y
Source: Bureau of Economic Analysis, as at January 2016.
Nonfarm Payrolls & Unemployment Rate
Source: Bureau of Labor Statistics, as at February 2016. All figures seasonally adjusted.
Consumer Price Index, Y/Y
Source: Bureau of Labor Statistics, as at January 2016.
Productivity & Unit Labour Costs, Q/Q ar
Source: Bureau of Labor Statistics, as at December 2015.
US Annualised Trade Deficit, GDP
Source: Census Bureau and Bureau of Economic Analysis, as at December 2015.
-4%-2%0%2%4%6%
4Q10 4Q11 4Q12 4Q13 4Q14 4Q15
-4%0%4%8%
12%
1/11 1/12 1/13 1/14 1/15 1/16Consumer Spending Personal Income
4%6%8%10%12%
-2000
200400600
2/11 2/12 2/13 2/14 2/15 2/16
Percent Thousands
Nonfarm Payrolls Net Change Unemployment Rate (Right-Hand Scale)
-1%0%1%2%3%4%
1/11 1/12 1/13 1/14 1/15 1/16CPI Core CPI
-10%-5%0%5%
10%15%
4Q10 4Q11 4Q12 4Q13 4Q14 4Q15Unit Labour Costs Productivity
-4.0%-3.5%-3.0%-2.5%-2.0%
4Q10 4Q11 4Q12 4Q13 4Q14 4Q15
Past performance does not guarantee future results.
Copyright © 2016 Franklin Templeton Investments. All rights reserved.
Please visit www.franklinresources.com to be directed to your local Franklin Templeton website.
franklintempletoninstitutonal.com
3/16
IMPORTANT LEGAL INFORMATION This material is intended to be of general interest only and should not be construed as individual investment advice or a recommendation or solicitation to buy, sell or hold any security or to adopt any investment strategy. It does not constitute legal or tax advice.
The views expressed are those of the investment manager and the comments, opinions and analyses are rendered as at publication date and may change without notice. The information provided in this material is not intended as a complete analysis of every material fact regarding any country, region or market. All investments involve risks, including possible loss of principal.
Data from third party sources may have been used in the preparation of this material and Franklin Templeton Investments (“FTI”) has not independently verified, validated or audited such data. FTI accepts no liability whatsoever for any loss arising from use of this information and reliance upon the comments, opinions and analyses in the material is at the sole discretion of the user.
Products, services and information may not be available in all jurisdictions and are offered outside the U.S. by other FTI affiliates and/or their distributors as local laws and regulation permits. Please consult your own professional adviser for further information on availability of products and services in your jurisdiction.
Issued in the U.S. by Franklin Templeton Distributors, Inc., One Franklin Parkway, San Mateo, California 94403-1906, (800) DIAL BEN/342-5236, franklintempleton.com - Franklin Templeton Distributors, Inc. is the principal distributor of Franklin Templeton Investments’ U.S. registered products, which are available only in jurisdictions where an offer or solicitation of such products is permitted under applicable laws and regulation.
Australia: Issued by Franklin Templeton Investments Australia Limited (ABN 87 006 972 247) (Australian Financial Services License Holder No. 225328), Level 19, 101 Collins Street, Melbourne, Victoria, 3000. Austria/Germany: Issued by Franklin Templeton Investment Services GmbH, Mainzer Landstraße 16, D-60325 Frankfurt am Main, Germany. Authorised in Germany by IHK Frankfurt M., Reg. no. D-F – 125-TMX1-08. Canada: Issued by Franklin Templeton Investments Corp., 5000 Yonge Street, Suite 900 Toronto, ON, M2N 0A7, Fax: (416) 364-1163, (800) 387-0830, www.franklintempleton.ca. Dubai: Issued by Franklin Templeton Investments (ME) Limited, authorised and regulated by the Dubai Financial Services Authority. Dubai office: Franklin Templeton Investments, The Gate, East Wing, Level 2, Dubai International Financial Centre, P.O. Box 506613, Dubai, U.A.E., Tel.: +9714-4284100 Fax:+9714-4284140. France: Issued by Franklin Templeton France S.A., 20 rue de la Paix, 75002 Paris France. Hong Kong: Issued by Franklin
Templeton Investments (Asia) Limited, 17/F, Chater House, 8 Connaught Road Central, Hong Kong. Italy: Issued by Franklin Templeton Italia Sim S.p.A., Corso Italia, 1 – Milan, 20122, Italy. Japan: Issued by Franklin Templeton Investments Japan Limited. Korea: Issued by Franklin Templeton Investment Trust Management Co., Ltd., 3rd fl., CCMM Building, 12 Youido-Dong, Youngdungpo-Gu, Seoul, Korea 150-968. Luxembourg/Benelux: Issued by Franklin Templeton International Services S.à r.l. – Supervised by the Commission de Surveillance du Secteur Financier - 8A, rue Albert Borschette, L-1246 Luxembourg - Tel: +352-46 66 67-1 - Fax: +352-46 66 76. Malaysia: Issued by Franklin Templeton Asset Management (Malaysia) Sdn. Bhd. & Franklin Templeton GSC Asset Management Sdn. Bhd. Nordic regions: Issued by Franklin Templeton Investment Management Limited (FTIML), Swedish Branch, Blasieholmsgatan 5, Se-111 48 Stockholm, Sweden. FTIML is authorised and regulated in the United Kingdom by the Financial Conduct Authority and is authorised to conduct certain investment services in Denmark, Sweden, Norway & Finland. Poland: Issued by Templeton Asset Management (Poland) TFI S.A., Rondo ONZ 1; 00-124 Warsaw. Romania: Issued by the Bucharest branch of Franklin Templeton Investment Management Limited, 78-80 Buzesti Street, Premium Point, 7th-8th Floor, 011017 Bucharest 1, Romania. Registered with CNVM under no. PJM05SSAM/400001/14.09.2009, and authorised and regulated in the UK by the Financial Conduct Authority. Singapore: Issued by Templeton Asset Management Ltd. Registration No. (UEN) 199205211E. 7 Temasek Boulevard, #38-03 Suntec Tower One, 038987, Singapore. Spain: Issued by the branch of Franklin Templeton Investment Management, Professional of the Financial Sector under the Supervision of CNMV, José Ortega y Gasset 29, Madrid. South Africa: Issued by Franklin Templeton Investments SA (PTY) Ltd which is an authorised Financial Services Provider. Tel: +27 (11) 341 2300 Fax: +27 (11) 341 2301. Switzerland & Liechtenstein: Issued by Franklin Templeton Switzerland Ltd, Stockerstrasse 38, CH-8002 Zurich. UK: Issued by Franklin Templeton Investment Management Limited (FTIML), registered office: Cannon Place, 78 Cannon Street, London, EC4N 6HL. Authorised and regulated in the United Kingdom by the Financial Conduct Authority. Offshore Americas: In the U.S., this publication is made available only to financial intermediaries by Templeton/Franklin Investment Services, 100 Fountain Parkway, St. Petersburg, Florida 33716. Tel: (800) 239-3894 (USA Toll-Free), (877) 389-0076 (Canada Toll-Free), and Fax: (727) 299-8736. Investments are not FDIC insured; may lose value; and are not bank guaranteed. Distribution outside the U.S. may be made by Templeton Global Advisors Limited or other sub-distributors, intermediaries, dealers or professional investors that have been engaged by Templeton Global Advisors Limited to distribute shares of Franklin Templeton funds in certain jurisdictions. This is not an offer to sell or a solicitation of an offer to purchase securities in any jurisdiction where it would be illegal to do so.
See www.franklintempletondatasources.com for additional data provider information.