performance review 10 copies email draft to sam smith prior to meetings. all but first 4 pgs printed...
TRANSCRIPT

Performance Review10 copies
Email draft to Sam Smith prior to meetings.
All but first 4 pgs printed double sided
Quarterly Investment Update
Prepared for:
National Contract Management Association
December 11, 2010
W. Todd Ripley, CTFASVP & Senior Investment ManagerWells Fargo Private Bank – Carolinas Region864.467.2836 telephone888.251.7674 [email protected]

II. Market Overview
I. Relationship Summary
Table of Contents
III. Asset Allocation, Performance & Manager Summary
22

I. Relationship Summary & Investment Policy Statement
3

Relationship Summary
44
• Established: June 10, 2005 (NCMA Unrestricted Reserve Funds) (Wells Fargo Bank, N.A. DDA Account) May 1, 2006 (NCMA Restricted Reserve Funds) (Wells Fargo Bank, N.A. serves as Investment
Manager)• Investment Objective:
60% Equity Harbor Capital Appreciation (Lg. Cap. Growth), Davis New York Venture (Lg. Cap Value),
IShares Russell Midcap Index Fd. Boston Company Small Cap Value, IShares Russell 2000 Small Cap Growth Fd., Delaware International Equity (All Shares Institutional Class)
40% Fixed Income Western Asset Core Plus Bond Fd., Vanguard Short Term Bond Index, PIMCO High Yield
Bond Fd., PIMCO Foreign Bond Fd., and Wells Fargo Advantage Treasury Plus Institutional Money Market
Asset allocation for Unrestricted Reserve Fund (short term) accordance with current National Contract Management Association Investment Policy Guidelines. Currently 100% Institutional Depository Account for Non-Profit Organizations. Interest Calculated based upon the average 4 week 90-day Treasury Bill. Rates are set monthly. Current earnings credit .40%
• Statements/Tax Reporting: Monthly & Annual statements Sam Smith (CFO) for further distribution to AMC Annual 1099 provided
• Distributions/Spending Policy: Spending Policy as directed by Board approval (NCMA Restricted Reserve Fund)
• Investment Reporting: Quarterly Investment Performance and Market Updates Formal presentations (semi-annually)
• Fees: Wachovia Trust / Nonprofit & Philanthropic Services Institutional Fee Schedule (Equity &
Balanced): 65 basis points on the first $5MM, 45 bps on the next $10mm, 30 bps on the next $30mm,and 20 bps on balance. Equates to approx 65 bps based on market value $1,805,014 as of 9/30/2010.

II. Market Overview
November 2010
200909044 TPB-PB21074 (09/09)
Wells Fargo Private Bank provides financial services and products through Wells Fargo Bank, N.A. and its various affiliates and subsidiaries. Wells Fargo & Company does not provide tax advice. Please consult your professional tax advisor to determine how this information may apply to your own situation.

U.S. Economic Overview
0
20
40
60
80
100
120
31-Oct-07 30-Apr-08 31-Oct-08 30-Apr-09 30-Oct-09 30-Apr-10 29-Oct-10
0
2
4
6
8
10
12
Consumer Confidence
Unemployment Rate
Economic news has been more positive but confidence remains weak. Third quarter U.S. GDP rose 2.0 percent as
consumer spending and business investment increased. Trade and housing continued to detract from growth.
Non-farm payrolls rose 151,000 in October, more than twice median expectations. Private payrolls increased by 159,000. However, the unemployment rate remained at 9.6 percent for the third month in a row.
Consumer confidence remained near historic lows in October, climbing just 1.62 to 50.23. Despite consumers’ gloominess, retail sales improved 0.6 percent in September.
Factory orders climbed much higher than expected, increasing 2.1 percent in September. However, non-defense, ex-aircraft, orders declined 0.2 percent.
Durable goods orders painted a similar picture, as overall orders came in higher than expected, but declined 0.6 percent excluding aircraft.
Core consumer prices remain quite constrained, having increased by just 0.8 percent since September, 2009.
Third quarter productivity improved 1.9 percent following second quarter’s 1.8 percent decline. Unit labor costs dropped 0.1 percent.
Sources: Bloomberg Finance LLP, 11/10, FactSet, 11/10
But High Unemployment Weighs on Confidence
Net
New
Job
s R
ep
ort
ed
(O
cto
ber) Payrolls Exceed Expectations1
0
20000
40000
60000
80000
100000
120000
140000
160000
180000
Low Forecast Median High Forecast Actual Gain
Con
su
mer
Con
fid
en
ce I
nd
ex
0
125,000
151,000
1From Bloomberg’s survey of 80 economists.
60,000
Un
em
plo
ym
en
t Rate
(%)
6

U.S. Economic Outlook
30
35
40
45
50
55
60
65
Oct-07 Oct-08 Oct-09 Oct-10
Manufacturing
Service
This past summer’s soft patch may be over but challenges remain.
The Index of Leading Economic Indicators rose 0.3 percent in September, pointing to modest growth in the fourth quarter.
The Institute of Supply Management (ISM) Manufacturing survey unexpectedly rose to 56.9 in October from 54.4 in September. Strength was seen in production, orders (especially export orders) and employment.
October’s ISM Non-Manufacturing survey increased to 54.3 from 53.2 in September, as service sector employment improved and new orders rose. Respondents note a slight pickup in demand, but that customers are unwilling to pay higher prices.
Existing home sales rose 10 percent in September. However, the S&P Case-Shiller home price index fell slightly in August. Home prices may face continued pressures from heavy supply and distressed sales.
New home sales rose to an annual pace of 307,000 units for a 6.6 percent gain in September. A true recovery is unlikely until at least the spring home-buying season.
In an effort to combat the low level of inflation and the high level of unemployment, the Federal Reserve is set to enact $600 billion in bond repurchases (quantitative easing) over the next few months.
Sources: FactSet, Bloomberg Finance LLP, 11/10
Q/Q
An
nu
alized
Gro
wth
Rate
ISM Surveys Regain Some Strength
Mon
thly
% C
han
ge
Retail Sales Have Been Higher Than Expected
1.91.7
0.10.4 0.3
2.3
0.4
-1.1
-0.3
0.50.7 0.7
-1.5
-1
-0.5
0
0.5
1
1.5
2
2.5
Oct-09 Nov-09 Dec-09 Jan-10 Feb-10 Mar-10 Apr-10 May-10 Jun-10 Jul-10 Aug-10 Sep-10
Soft Patch
Soft Patch
7
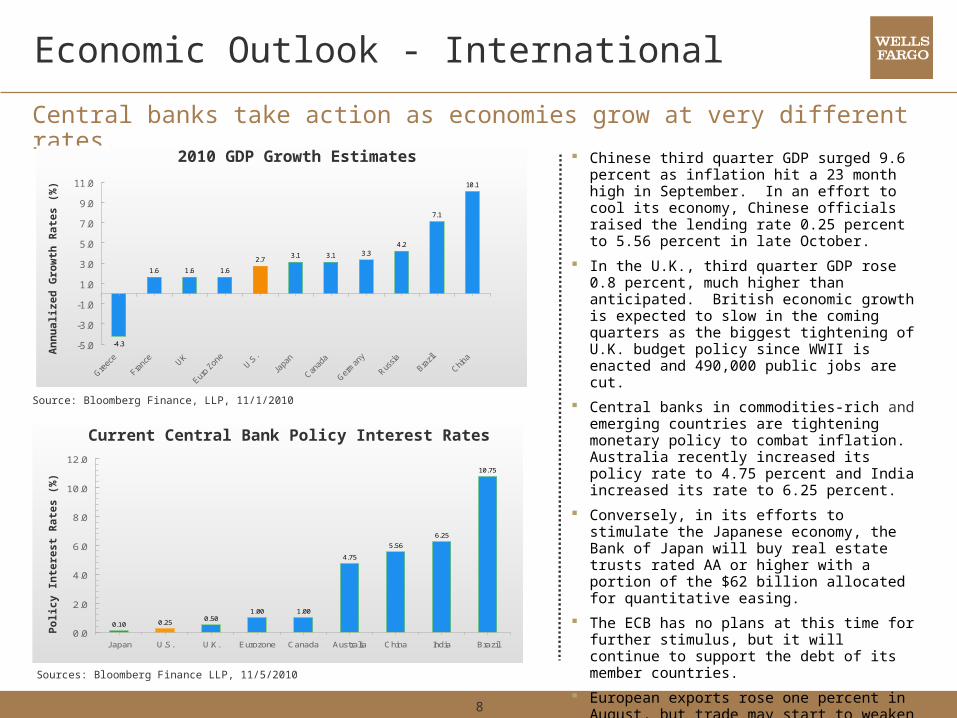
Economic Outlook - International
Central banks take action as economies grow at very different rates.
Chinese third quarter GDP surged 9.6 percent as inflation hit a 23 month high in September. In an effort to cool its economy, Chinese officials raised the lending rate 0.25 percent to 5.56 percent in late October.
In the U.K., third quarter GDP rose 0.8 percent, much higher than anticipated. British economic growth is expected to slow in the coming quarters as the biggest tightening of U.K. budget policy since WWII is enacted and 490,000 public jobs are cut.
Central banks in commodities-rich and emerging countries are tightening monetary policy to combat inflation. Australia recently increased its policy rate to 4.75 percent and India increased its rate to 6.25 percent.
Conversely, in its efforts to stimulate the Japanese economy, the Bank of Japan will buy real estate trusts rated AA or higher with a portion of the $62 billion allocated for quantitative easing.
The ECB has no plans at this time for further stimulus, but it will continue to support the debt of its member countries.
European exports rose one percent in August, but trade may start to weaken with the Euro approaching its highest level of the year.
Current Central Bank Policy Interest Rates
Sources: Bloomberg Finance LLP, 11/5/2010
Policy I
nte
rest
Rate
s (
%)
Source: Bloomberg Finance, LLP, 11/1/2010
2010 GDP Growth Estimates
An
nu
alized
Gro
wth
Rate
s (
%)
-4.3
1.6 1.6 1.6
2.73.1 3.1 3.3
4.2
7.1
10.1
-5.0
-3.0
-1.0
1.0
3.0
5.0
7.0
9.0
11.0
Greec
e
Franc
eUK
Euro
Zone
U.S.
Japa
n
Canad
a
Germ
any
Russia
Brazil
China
0.10 0.250.50
1.00 1.00
4.75
5.56
6.25
10.75
0.0
2.0
4.0
6.0
8.0
10.0
12.0
Japan U.S. U.K. Eurozone Canada Australia China India Brazil
8

Stock Market Review and Strategy
Global equities climb as the Fed prepares to add liquidity to the system. Equity markets added to third quarter gains
with the S&P 500 Index up nearly four percent in October.
The rally was aided by stabilization in economic data and strong third quarter earnings results as well as expectations for additional quantitative easing by the Federal Reserve and a greater post-election balance of power in Washington D.C.
U.S. small- and mid-cap stocks edged large-cap stocks for the month, while growth outperformed value.
All ten S&P 500 sectors were positive with Materials, Information Technology, Energy and Consumer Discretionary all surging more than five percent. Defensive sectors such as Telecom and Utilities were the weakest performers.
International equities continued to rebound in October despite Japan’s recent struggles. Weakness in the U.S. dollar boosted U.S. based investor returns.
After a strong fall rally, we have moved domestic large-cap stocks back to neutral from overweight. We remain positive on the asset class, but believe near-term consolidation is possible. We maintain an overweight to emerging markets equities based on strong fundamentals and attractive valuations.
*Annualized returns.**You cannot invest directly in an index. Index returns do not include management fees, so your actual returns may differ from those listed in the charts.Sources: Bloomberg, Factset (11/10)
Stock Market Total Returns**Period Ending October 31, 2010
Equity Indexes Oct QTD YTD 1 Year 3 Year* 5 Year*
S&P 500
Russell 1000 Growth
Russell 1000 Value
Russell Mid Cap
Russell 2000
MSCI EAFE
MSCI Emerging Markets
5.9
6.1
7.8
8.2
9.0
9.2
11.1
11.4
12.1
4.3
7.5
0.5
2.7
10.8
-0.7
-0.8
13.3
13.3
0.0
2.9Utilities
Consumer Staples
Financials
Materials
Telecom
Health Care
Energy
Consumer Discretionary
Industrials
TechnologyOctober YTD
S&P 500 Sector Returns (%)
3.8% 3.8% 7.8% 16.5% -6.5% 1.7%
4.8% 4.8% 9.3% 19.7% -3.9% 3.2%
3.0% 3.0% 7.6% 15.7% -8.5% 0.6%
3.9% 3.9% 15.3% 27.7% -3.5% 4.0%
4.1% 4.1% 13.6% 26.6% -3.9% 3.1%
3.6% 3.6% 5.1% 8.8% -9.2% 3.8%
2.9% 2.9% 14.3% 23.9% -3.7% 15.3%
9

Bond Market Review and Strategy
International bonds outpace domestic bonds on currency gains. Bonds underperformed equities in October
as investors preferred riskier assets. Long-term Treasury yields rose as economic data showed stabilization and the Fed prepared to add more liquidity to the system – potentially stoking inflation.
Treasury Inflation Protected Securities (TIPS) posted the best returns as investors expected further easing in monetary policy to eventually lead to higher prices. After starting the year around 3.80 percent, the 10-year Treasury note yield ended October at 2.61 percent.
Investment grade corporate bond prices were flat in October, while high yield outperformed most fixed income asset classes. Despite strong returns this year, “junk” bond yields remain attractive, sparking increased demand from investors. In fact, sales of high yield bonds in the U.S. set a record during the month.
International bonds continued to rebound in September, largely due to local currency strength.
We recommend a shorter duration stance due to a greater likelihood of higher rates over the next year. We continue to overweight corporate bonds and underweight U.S. Treasurys. We also favor emerging markets debt, especially shorter duration local currency bonds.
*Annualized returns.**You cannot invest directly in an index. Index returns do not include management fees,so your actual returns may differ from those listed in the charts.Sources: Bloomberg, Barclays Capital (11/10)
Bond Market Total Returns**Period Ending October 31, 2010
Bond Indexes Oct QTD YTD 1 Year 3 Year* 5 Year*
U.S. Aggregate Bond
U.S. Treasury
U.S. Corporate
U.S. Municipal
U.S. TIPS
U.S. High Yield
Foreign Bond
EM Debt
2
3
4
5
6
7
8
9
10
Oct-00 Oct-01 Oct-02 Oct-03 Oct-04 Oct-05 Oct-06 Oct-07 Oct-08 Oct-09 Oct-10
10-Year Treasury Yield vs. Investment Grade Corporate Bond Yield
Yie
ld (
%)
10 Yr Treasury Bond Yield
Investment Grade Corp Bond Yield
0.4% 0.4% 8.3% 8.0% 7.2% 6.4%
-0.2% -0.2% 8.6% 7.2% 7.1% 6.3%
0.1% 0.1% 10.9% 11.6% 8.0% 6.8%
-0.3% -0.3% 6.5% 7.8% 5.8% 5.2%
2.7% 2.7% 9.8% 10.4% 7.5% 6.3%
2.6% 2.6% 14.4% 19.4% 9.5% 9.1%
2.0% 2.0% 10.4% 8.0% 9.3% 8.6%
1.7% 1.7% 16.1% 17.7% 10.0% 9.9%
10

REIT/Commodity Indexes Oct QTD YTD 1 Year 3 Year* 5 Year*
Global REIT
U.S. REIT
International REIT
S&P GSCI Commodity
DJ-UBS Commodity
Real Assets Review and Strategy
Real Assets advance on global growth and U.S. Dollar weakness. Publicly traded global REITs advanced in
October. Domestic markets outperformed international markets on basis of potential further monetary easing in the U.S.
From a valuation perspective domestic REITs are trading at a 22 percent premium to net asset value versus their historical 1.2 percent premium since 1993.
Due to valuation concerns, we maintain our underweight position in publicly-traded REITs. We favor REIT property sectors that are the most sensitive to an economic recovery, including those sectors with the shortest lease periods.
We continue to favor U.S. REITs over International REITs.
Commodities prices increased in October on strong economic growth in emerging markets and further weakness in the U.S. dollar. Cotton and sugar surged more than 20 percent, while silver rose nearly 13 percent to a 30-year high. Gold reached a record intra-day high before settling back down toward the end of the month.
We maintain our overweight recommendation for commodities based on the rebound in the global economy and the potential for further weakness in the U.S. dollar.
*Annualized returns.**You cannot invest directly in an index. Index returns do not include management fees,so actual returns may differ from those listed in the charts.Sources: Bloomberg, National Association of Real Estate Trust (11/10)
0
20
40
60
80
100
120
140
160
Oct-01 Oct-02 Oct-03 Oct-04 Oct-05 Oct-06 Oct-07 Oct-08 Oct-09 Oct-100
200
400
600
800
1000
1200
1400
1600Crude Oil vs. Gold
Oil P
rice p
er
Barr
el (U
S$
)
Real Asset Total Returns**Period Ending October 31, 2010
Gold
Pric
e p
er O
un
ce (U
S$
) Gold
Oil
4.2% 4.2% 18.2% 24.7% -9.3% 4.1%
4.7% 4.7% 24.7% 42.8% -5.0% 3.3%
3.8% 3.8% 14.9% 16.4% -11.2% 4.4%
2.6% 2.6% -1.4% 1.0% -15.2% -7.8%
5.0% 5.0% 5.9% 11.8% -6.4% -0.1%
11

-20
-15
-10
-5
0
5
10
15
J un-00 J un-01 J un-02 J un-03 J un-04 J un-05 J un-06 J un-07 J un-08 J un-09 J un-10
Complementary Strategies Review and Strategy
The HFRX Global Hedge Fund Index returned 1.1 percent for the month of October with seven out of eight components positive.
Distressed Securities was the largest positive contributor, returning 2.4 percent. Post-bankruptcy equities and emerging market debt gained as a result of a renewed appetite for risk.
Convertible Arbitrage posted the second-largest gain of 2.0 percent. Returns were boosted by tightening credit spreads and supply constraints.
Event Driven posted the only loss, of -0.6 percent, for the month. Negative performance arose from select restructuring situations and hedges.
We remain constructive on Relative Value Arbitrage, Event Driven, Distressed Securities and Merger Arbitrage strategies as significant market dislocations still exist. Meanwhile, economic recovery and stability as well as sizeable corporate cash reserves will likely create a favorable environment for these managers.
We have a negative outlook for Equity Hedge and Equity Market Neutral strategies as returns could be muted until demand and a recovery in employment provide market support.
Complementary Strategies*** Total Returns**Period Ending October 31, 2010
Hedge funds were positive but underperformed equities.
*Annualized returns.**You cannot invest directly in an index. Index returns do not include management fees, so actual returns may differ from those listed in the charts.***Some alternative investments may be available only to pre-qualified investors. Sources: Bloomberg, Cambridge Associates (11/10)
Hedge Fund Indexes Oct QTD YTD 1 Year 3 Year* 5 Year*
Global Hedge Funds
Distressed Securities
Event Driven
Merger Arbitrage
Equity Hedge
Equity Market Neutral
Macro
Convertible Arbitrage
Relative Value Arbitrage
U.S. Private Equity Index Returns
% Q
uart
erl
y C
han
ge
1.1% 1.1% 3.0% 5.3% -4.4% 1.1%
2.4% 2.4% 7.0% 10.1% -11.4% -4.2%
-0.6% -0.6% 1.4% 3.4% -3.9% 1.8%
0.9% 0.9% 3.9% 5.5% 4.3% 6.7%
1.6% 1.6% 3.4% 6.4% -5.8% 0.5%
0.6% 0.6% 0.6% 0.9% -1.8% 0.6%
1.0% 1.0% -1.9% -2.2% -1.8% 1.7%
2.0% 2.0% 8.2% 9.7% -15.2% -6.9%
1.7% 1.7% 6.5% 10.3% -3.3% 1.5%
12

Disclosures
Wells Fargo Private Bank provides products and services through Wells Fargo Bank, N.A. and its various affiliates and subsidiaries.
The information and opinions in this report were prepared by the investment management division within Wells Fargo Private Bank. Information and opinions have been obtained or derived from sources we consider reliable, but we cannot guarantee their accuracy or completeness. Opinions represent Wells Fargo Private Bank’s opinion as of the date of this report and are for general information purposes only. Wells Fargo Private Bank does not undertake to advise you of any change in its opinions or the information contained in this report. Wells Fargo & Company affiliates may issue reports or have opinions that are inconsistent with, and reach different conclusions from, this report.
Past performance does not indicate future results. The value or income associated with a security may fluctuate. There is always the potential for loss as well as gain. The investments discussed in this presentation are not insured by the Federal Deposit Insurance Corporation and may be unsuitable for some investors depending on their specific investment objectives and financial position.
This presentation is not an offer to buy or sell, or a solicitation of an offer to buy or sell any securities mentioned. Investments discussed or recommended in this presentation may be unsuitable for some investors depending on their specific investment objectives and financial position. Additional information on any security mentioned is available on request.
Asset allocation does not guarantee better performance and cannot eliminate the risk of investment losses.
Fixed income securities are subject to availability and market fluctuation. These securities may be worth less than the original cost upon redemption. Certain high-yield/high-risk bonds carry particular market risks and may experience greater volatility in market value than investment grade corporate bonds. Government bonds and Treasury bills are guaranteed by the U.S. government and, if held to maturity, offer a fixed rate of return and fixed principal value. Interest from certain municipal bonds may be subject to state and/or local taxes and in some instances, the alternative minimum tax.
Investing in foreign securities presents certain risks that may not be present in domestic securities. For example, investments in foreign and emerging markets present special risks including currency fluctuation, the potential for diplomatic and political instability, regulatory and liquidity risks, foreign taxation and differences in auditing and other financial standards.
Real estate investment carries a certain degree of risk and may not be suitable for all investors.
S&P 500 Index is a capitalization-weighted index calculated on a total-return basis with dividends reinvested. The index includes 500 widely held U.S. market industrial, utility, transportation and financial companies.
Russell 1000® Index measures the performance of the 1,000 largest companies in the Russell 3000® Index, Russell 1000® Index represents approximately 92% of the total market capitalization of the Russell 3000® Index.
The Russell 1000® Growth Index represents the large-cap growth segment of the U.S. equity universe.
The Russell 1000® Value index represents the large cap value segment of the U.S. equity universe.
Russell 2000® Index measures the performance of the 2,000 smallest companies in the Russell 3000® Index, which represents approximately 8% of the total market capitalization of the Russell 3000®.
The Russell Midcap Index measures the performance of the 800 smallest companies in the Russell 1000 Index, which represent approximately 25% of the total market capitalization of the Russell 1000 Index.
The MSCI EAFE Index (Europe, Australasia, Far East) is a free float-adjusted market capitalization index that is designed to measure the equity market performance of developed markets, excluding the U.S. and Canada. As of June 2007 the MSCI EAFE Index consisted of 21 developed-market country indices.
Morgan Stanley Capital International (MSCI) Emerging Markets Global Index is a market capitalization-weighted benchmark index made up of equities from 29 developing countries.
13

Disclosures (cont.)
Barclays Capital U.S. Aggregate Bond Index (formerly known as Lehman Brothers U.S. Aggregate Bond Index) represents U.S. domestic, taxable and dollar-denominated securities. The index covers the U.S. investment grade fixed rate bond market, including government and corporate securities, mortgage pass-through securities and asset-backed securities between one and ten years.
Barclays Capital U.S. Corporate Bond Index (from Lehman Brothers U.S. Corporate Bond Index) includes publicly issued U.S. corporate and Yankee debentures and secured notes that meet specified maturity, liquidity, and quality requirements.
Barclays Capital U.S. Treasury Index (formerly known as Lehman Brothers U.S. Treasury Index) includes public obligations of the U.S. Treasury with a remaining maturity of one year or more.
Barclays Capital Municipal Bond Index (from Lehman Brothers Municipal Bond Index) represents municipal bonds with a minimum credit rating of at least Baa, an outstanding par value of at least $3 million, and a remaining maturity of at least one year. The Index excludes taxable municipal bonds, bonds with floating rates, derivatives, and certificates of participation.
The Barclay’s Capital U.S. TIPS Index consists of Inflation-Protection securities issued by the U.S. Treasury.
The Barclays Capital High Yield Bond Index is an unmanaged index that tracks the performance of below investment grade U.S. dollar-denominated corporate bonds publicly issued in the U.S. domestic market.
The JP Morgan Global Ex United States Index is a total return, market capitalization weighted index, rebalanced monthly consisting of the following countries: Australia, Germany, Spain, Belgium, Italy, Sweden, Canada, Japan, United Kingdom, Denmark, Netherlands, and France.
The JP Morgan Emerging Bond Index The J.P. Morgan Emerging Markets Bond Index Global (EMBI Global), which currently covers 27 emerging market countries. Included in the EMBI Global are U.S.-dollar-denominated Brady bonds, Eurobonds, traded loans, and local market debt instruments issued by sovereign and quasi-sovereign entities.
The NAREIT Index (National Association of Real Estate Investment Trusts) is an unmanaged index that reflects performance of all publicly traded equity REITs.
The NAREIT Global Real Estate Index measures the performance of listed real estate companies and REITs worldwide, the series acts as a performance measure of the overall market.
The Dow Jones Wilshire REIT Index is broad measures of the U.S. real estate securities markets and is a subset of the Dow Jones Wilshire Real Estate Securities Index and includes only REITs.
The S&P/Citigroup World Property Index ex US represents the full global universe of institutionally investable property stocks excluding the United States. The full index includes over 400 constituents from 21 developed markets.
The Dow Jones - UBS Commodity Index is designed to be a highly liquid and diversified benchmark for commodities as an asset class. The index is composed of futures contracts on 19 physical commodities. No related group of commodities (e.g., energy, precious metals, livestock and grains) may constitute more than 33% of the index as of the annual reweightings of the components. No single commodity may constitute less than 2% of the index.
The S&P Goldman Sachs Commodity Index is a composite index of commodity sector returns representing unleveraged, long-only investment in commodity futures that is broadly diversified across the spectrum of commodities. The index is includes futures contracts on 24 physical commodities of which Energy represents nearly 70%.
The HFRX Indices currently consist of eight single strategy indices, an asset-weighted Global Hedge Fund Index and HFRX Equal Weighted Strategies Index, each calculated pursuant to an index methodology. Most HFRX Indices are priced daily. All HFRX Indices are re-balanced quarterly.
The HFRX Global Hedge Fund Index is designed to be representative of the overall composition of the hedge fund universe. It is comprised of eight strategies; convertible arbitrage, distressed securities, equity hedge, equity market neutral, event driven, macro, merger arbitrage, and relative value arbitrage. The strategies are asset weighted based on the distribution of assets in the hedge fund industry.
14

Disclosures (cont.)
Convertible Arbitrage: Convertible Arbitrage includes strategies in which the investment thesis is predicated on realization of a spread between related instruments in which one or multiple components of the spread is a convertible fixed instrument.
Distressed Securities: Distressed Restructuring Strategies which employ an investment process focused on corporate fixed income instruments, primarily corporate credit instruments of companies trading at significant discounts to their value at issuance or obliged (par value) at maturity as a result of either formal bankruptcy proceeding or financial market perception of near term proceedings.
Equity Hedge: Equity Hedge strategies maintain positions both long and short in primarily equity and equity derivative securities. A wide variety of investment processes can be employed to arrive at an investment decision, including both quantitative and fundamental techniques.
Equity Market Neutral: Equity Market Neutral strategies employ sophisticated quantitative techniques of analyzing price data to ascertain information about future price movement and relationships between securities, select securities for purchase and sale.
Event Driven: Includes Investment Managers who maintain positions in companies currently or prospectively involved in corporate transactions of a wide variety including but not limited to mergers, restructurings, financial distress, tender offers, shareholder buybacks, debt exchanges, security issuance or other capital structure adjustments.
Macro: Includes Investment Managers which trade a broad range of strategies in which the investment process is predicated on movements in underlying economic variables and the impact these have on equity, fixed income, hard currency and commodity markets.
Merger Arbitrage: Merger Arbitrage strategies employ an investment process primarily focused on opportunities in equity and equity related instruments of companies which are currently engaged in a corporate transaction.
Relative Value Arbitrage: Investment Managers who maintain positions in which the investment thesis is predicated on realization of a valuation discrepancy in the relationship between multiple securities.
Yields are subject to change with economic conditions. Yield is only one factor that should be considered when making an investment decision. Treasuries are guaranteed by the U.S. government and, if held to maturity, offer a fixed rate of return and fixed principal value. Interest income from U.S. Treasury and some government agency securities is generally subject to federal income taxation, but may be exempt from some state and local taxes. Most federal agency bonds are not backed by the full faith and credit of the federal government, however, they may offer some type of guarantee by the issuing agency.
Additional information available on request.
© 2010 Wells Fargo Bank, N.A. All rights reserved.
15
III. Asset Allocation, Performance & Manager Summary
16

Current Allocation
17

Manager Performance
18
as of 9/ 30/ 10 YTD 1 Year 3 Year 5 Year
EQUITY
Harbor Capital Appreciation Fund 0.12 9.06 -3.45 1.68
Russell 1000 Growth 4.36 12.65 -4.36 2.06
Davis New York Venture Fund 1.57 8.41 -7.44 0.44
Russell 1000 Value 4.49 8.90 -9.39 -0.48
iShares Russell Mid Cap Index Fund 10.84 17.35 -4.25 2.47
Russell MidCap Index 10.97 17.54 -4.16 2.60
iShares Russell 2000 Growth Index Fund 10.25 14.80 -3.71 2.30
Russell 2000 Growth 10.23 14.79 -3.75 2.35
Dreyfus/ The Boston Company Small Cap Value Fund 6.20 11.27 -3.94 2.08
Russell 2000 Value 7.92 11.84 -4.99 0.73
Delaware Pooled International Equity -0.90 1.74 -8.90 2.45
MSCI EAFE Value Index - USD -1.48 -1.15 -10.16 1.67
FIXED INCOME
Vanguard Short Term Bond ETF 4.65 5.01 5.74 n/ a
Barclays Capital Aggregate 1-3 Year 2.59 3.08 4.80 4.79
Western Core Plus Bond Fund 12.20 16.27 8.71 6.88
Barclays Capital Aggregate 7.94 8.16 7.42 6.20
PIMCO High Yield Fund I 11.52 18.32 7.15 7.11
Barclays Capital High Yield Corporate Bond Index 11.53 18.44 8.75 8.37
PIMCO Foreign Bond I (Hedged) 11.09 13.14 9.70 6.87
J P Morgan Global ex US Index (Hedged) 5.59 5.83 5.97 4.94
CASH EQUIVALENTS
Wells Fargo Advantage Treas Plus MMkt 0.01 0.01 0.87 2.41
Lipper Money Market Index 0.02 0.03 1.12 2.35
Annualized

19

20

21
22
23

The Power of PartnershipSuperior client service, delivered through a dedicated team of specialists, is at the core of the Wells Fargo Private Bank experience. As the premier
provider of investment management and trust services, we stand ready to meet your
needs.
Evan M. Astrin, J.D.VP & Philanthropic Consultant
Wells Fargo Private Bank–Philanthropic Services336.732.6015 Telephone800.576.5135 Toll free
W. Todd Ripley, CTFASVP & Senior Investment Manager
Wells Fargo Private Bank864.467.2836 Office
888.251.7674 Toll [email protected]
Janet RobinsInvestment Management Associate
Wells Fargo Private Bank864.467.2838
Roslyn GilstrapRelationship Manager
Wells Fargo Business Banking864.467.2529 Office864.255.8357 Fax
Amy BongeBusiness Associate
Wells Fargo Business Banking864.255.8310