performance outcomes-based funding technical manual - v1.0
TRANSCRIPT

Ontario’s Postsecondary Education System Performance/Outcomes Based Funding –Technical Manual
September 2019 Version 1.0
Ministry of Training, Colleges and Universities
Performance/Outcomes-Based Funding - Technical Manual Page 1 September 2019
Ontario’s Postsecondary Education System Performance/Outcomes-Based Funding - Technical Manual
Table of Contents
1.0 INTRODUCTION AND BACKGROUND ................................................................ 3
2.0 POSTSECONDARY EDUCATION SYSTEM FUNDING MODEL OVERVIEW ..... 4
2.1 Differentiation Envelope and Performance/Outcomes-Based Funding Grant .... 5
3.0 NOTIONAL PERFORMANCE/OUTCOMES-BASED FUNDING ALLOCATIONS . 8
3.1. Allocation Methodology ...................................................................................... 9
3.2. Funding Distribution ......................................................................................... 10
4.0 IMPLEMENTATION OF PEFORMANCE/OUTCOMES-BASED FUNDING ........ 10
4.1 Strategic Mandate Agreements ........................................................................ 11
4.2 Performance/Outcomes-Based Funding Mechanism ...................................... 11
Metrics Tied to Funding ............................................................................................. 12
Differentiation Metric Weighting ................................................................................. 12
Performance Measurement ....................................................................................... 12
Outcomes Evaluation ................................................................................................. 12
5.0 TARGET-SETTING & BANDS OF TOLERANCE ................................................ 13
5.1 Target-Setting Approach .................................................................................. 14
5.2 Bands of Tolerance Approach ......................................................................... 15
5.3 Target-setting & Band of Tolerance Example ................................................. 16
5.4 Outcomes Evaluation ...................................................................................... 17
6.0 2020-25 STRATEGIC MANDATE AGREEMENTS (SMA3) ............................... 18
6.1 SMA3 Priority Areas and Metrics .................................................................... 18
6.2 Metric Weighting Parameters .......................................................................... 20
6.3 SMA3 Instrument & Institutional Data Workbooks ............................................ 20
6.4 SMA3 Annual Evaluation Process ................................................................... 21
7.0 Reallocation of Unallocated Funding ................................................................... 21
7.1 Metric-by-Metric Reallocation .......................................................................... 21
8.0 Adjustments & Continuous Improvement ............................................................ 23
9.0 APPENDICES .................................................................................................... 24

Performance/Outcomes-Based Funding - Technical Manual Page 2 September 2019
9.1 SMA3 Metric Operational Definitions and Activation Schedule ....................... 24
9.2 Metric Weightings Example ............................................................................. 27
9.3 Glossary of Key Terms .................................................................................... 29
Date Version Revisions
September 2019 1.0 Version released to sector on 09/04/2019.

Performance/Outcomes-Based Funding - Technical Manual Page 3 September 2019
1.0 INTRODUCTION AND BACKGROUND This manual describes the processes underlying implementation of the performance/outcomes-based funding grant in the Differentiation Envelope of Ontario’s University and College Funding Models. The performance/outcomes-based funding grant will be tied to performance outcomes starting in 2020-2021 as part of the third round of Strategic Mandate Agreements (SMA3). Activation of the performance/outcomes-based funding grant is aligned with the planned reforms to the university and college funding models, which previously included implementation of corridor-based enrolment funding and the establishment of the Differentiation Envelope. The focus of this manual is to provide an overview of the Ministry of Training, Colleges and Universities’ (MTCU) approach to the activation of the performance/outcomes-based funding grant portion of the college and university funding models. This manual is intended to work in conjunction with the existing College and University Funding Model Technical Manuals. Strategic Mandate Agreements and Postsecondary Education Funding Strategic Mandate Agreements (SMAs) are bilateral agreements between the ministry and the province’s 451 publicly-assisted colleges and universities. SMAs are a key component of the ministry’s accountability framework for the postsecondary education system. During the first round of Strategic Mandate Agreements in 2014 (SMA1), MTCU committed to engaging the university and college sectors on changes to their respective funding models in order to better support funding predictability and stability, as well as support differentiation and student-focused outcomes. In 2016, this engagement took place, resulting in a redesign of the college and university funding models, including the following elements: • Allocating the Core Operating Grant based on enrolment through a corridor
mechanism to help support predictable funding during a period of projected demographic change and anticipated enrolment decline for many institutions; while supporting managed enrolment planning for both institutions and the government.
• The establishment of the Differentiation Envelope and creation of the
Performance/Outcomes-Based Funding Grant, which links a portion of operating grant funding to performance outcomes and allows a greater focus on performance and outcomes over successive SMA cycles.
1 The Northern Ontario Medical School (NOSM) will have a customized Strategic Mandate Agreement for 2020-25.

Performance/Outcomes-Based Funding - Technical Manual Page 4 September 2019
The second round of Strategic Mandate Agreements (SMA2) were executed in 2017, implementing the first phase of the funding model redesign - implementation of the corridor mechanism, with universities entering enrolment corridors in 2017-18 and colleges entering enrolment corridors in 2019-20. On April 11, 2019 the government announced that performance/outcomes-based funding would be implemented through the next round of Strategic Mandate Agreements (SMA3). Starting in the first year of SMA3 (2020-21), a system-average of 25% of MTCU operating grant funding will be provided on the basis of performance outcomes and ramping up to 60% by 2024-25. At this same time, the government announced a finalized set of metrics against which institutional performance would be assessed, and the details of the mechanism that would be used to evaluate institutions’ performance and resulting funding allocation. Objectives for performance/outcomes-based funding include: • Increasing trust and accountability through transparency and improved performance
outcomes; • Reducing red tape by striking an appropriate balance between accountability and
reporting; • Incentivizing colleges and universities to redirect resources and invest in initiatives
that result in positive economic outcomes; • Encouraging alignment of postsecondary education with labour market outcomes;
and, • Incentivizing differentiation and specialization to support increased efficiencies. In order to best meet these objectives, metrics have been selected and a performance/outcomes-based funding mechanism designed that best supports ‘differentiated improvement’, recognizing important institutional differences in terms of size, mandates and institutional strengths.
2.0 POSTSECONDARY EDUCATION SYSTEM FUNDING MODEL OVERVIEW
As described further in the university and college funding technical manuals, the university and college funding models include three major components:
1. Enrolment Envelope: funding related to enrolment, which includes a Core Operating Grant (COG) under which:
• Colleges and universities are given a portion of operating funding based on a specific level of eligible enrolment (expressed in Weighted Grant Units (WGU) for universities and Weighted Funding Units (WFU) for colleges).

Performance/Outcomes-Based Funding - Technical Manual Page 5 September 2019
• The grant for each eligible student is calculated using the same amount of funding, weighted by program.
• COG funding is governed by an enrolment corridor mechanism. This provides equitable, predictable and stable funding for all institutions and provides a greater certainty for institutions and government in enrolment planning.
2. Differentiation Envelope: funding related to the Performance/Outcomes-
Based Grant, under which: • A portion of total operating grant funding for colleges and universities is
based on performance against outcomes in metrics aligned with government priority areas.
3. Special Purpose Grants / Other Institutional Grants: funding by which the government is able to address system priorities, such as initiatives to improve access for Indigenous learners, francophone students and students with disabilities. Also included are institution-specific grants, such as the Northern Grant; Small, Northern and Rural Grant; French Language/Bilingual grants.
2.1 Differentiation Envelope and Performance/Outcomes-Based Funding Grant During the SMA3 period, the Differentiation Envelope proportion of overall provincial funding will grow in the manner described in Table 1 below, to a system-average of 60% of provincial operating grants in each sector by the year 2020-25.
2020-25 Strategic Mandate Agreements
2020-21 2021-22 2022-23 2023-24 2024-25
25%
35%
45%
55%
60%
Table 1. Proportion of Provincial Operating Grants Distributed Based on Performance* *Values represent a system-average of provincial operating grants to each sector; institutional proportions will vary.
In 2016, as part of the funding model review, the ministry established initial amounts of an institution’s Differentiation Envelope, reflecting historical differences in the system, such as program mix. Expansion of institutional proportions of the Differentiation Envelope to create institutional notional performance/outcomes-based grant allocations has been accomplished as follows:
Performance/Outcomes-Based Funding - Technical Manual Page 6 September 2019
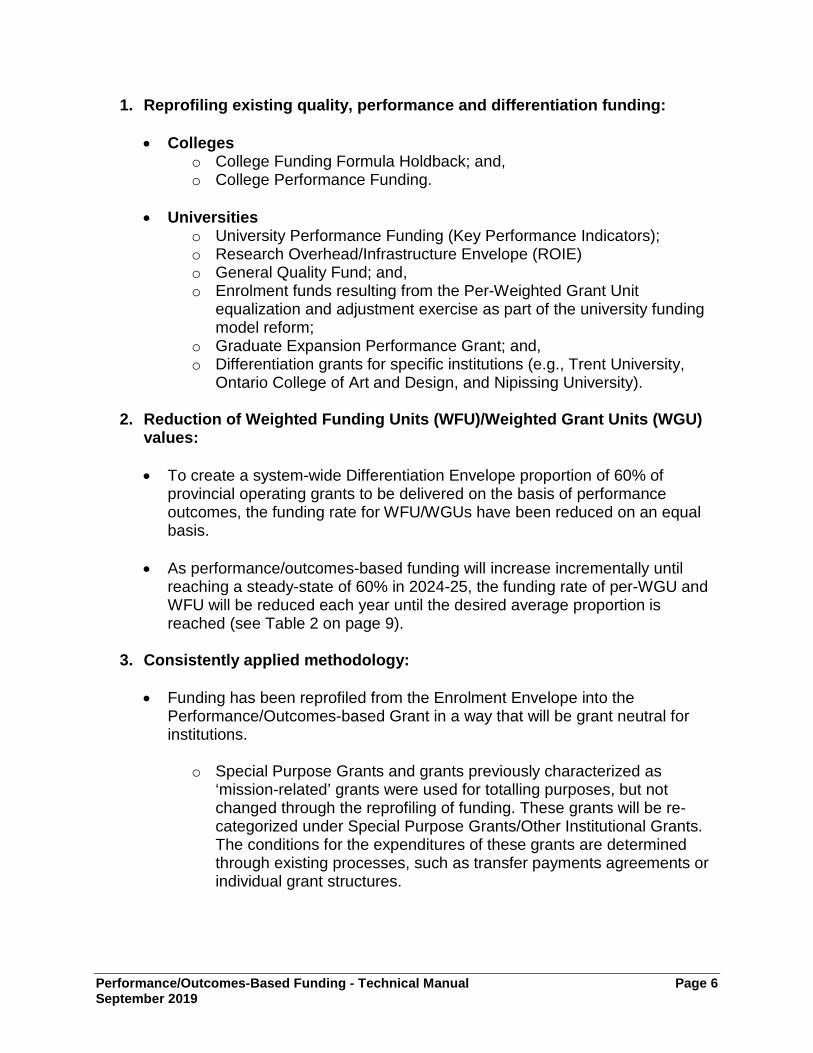
1. Reprofiling existing quality, performance and differentiation funding:
• Colleges o College Funding Formula Holdback; and, o College Performance Funding.
• Universities
o University Performance Funding (Key Performance Indicators); o Research Overhead/Infrastructure Envelope (ROIE) o General Quality Fund; and, o Enrolment funds resulting from the Per-Weighted Grant Unit
equalization and adjustment exercise as part of the university funding model reform;
o Graduate Expansion Performance Grant; and, o Differentiation grants for specific institutions (e.g., Trent University,
Ontario College of Art and Design, and Nipissing University).
2. Reduction of Weighted Funding Units (WFU)/Weighted Grant Units (WGU) values:
• To create a system-wide Differentiation Envelope proportion of 60% of
provincial operating grants to be delivered on the basis of performance outcomes, the funding rate for WFU/WGUs have been reduced on an equal basis.
• As performance/outcomes-based funding will increase incrementally until reaching a steady-state of 60% in 2024-25, the funding rate of per-WGU and WFU will be reduced each year until the desired average proportion is reached (see Table 2 on page 9).
3. Consistently applied methodology:
• Funding has been reprofiled from the Enrolment Envelope into the
Performance/Outcomes-based Grant in a way that will be grant neutral for institutions.
o Special Purpose Grants and grants previously characterized as
‘mission-related’ grants were used for totalling purposes, but not changed through the reprofiling of funding. These grants will be re-categorized under Special Purpose Grants/Other Institutional Grants. The conditions for the expenditures of these grants are determined through existing processes, such as transfer payments agreements or individual grant structures.
Performance/Outcomes-Based Funding - Technical Manual Page 7 September 2019
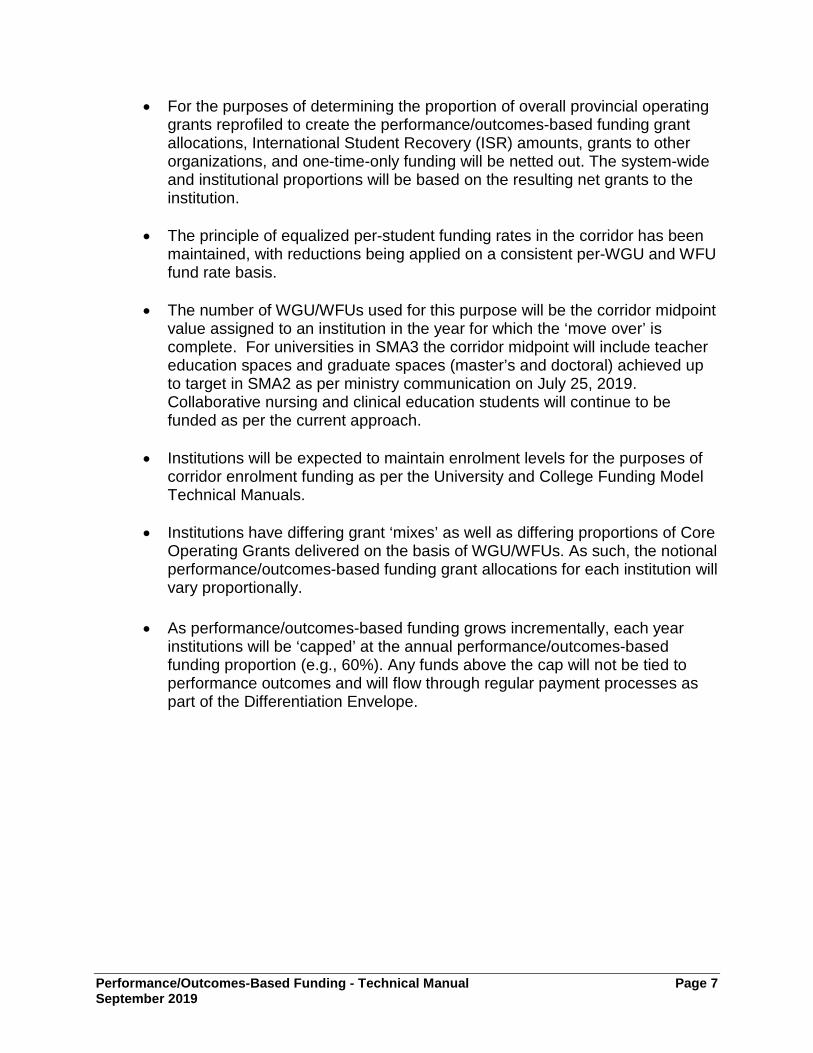
• For the purposes of determining the proportion of overall provincial operating grants reprofiled to create the performance/outcomes-based funding grant allocations, International Student Recovery (ISR) amounts, grants to other organizations, and one-time-only funding will be netted out. The system-wide and institutional proportions will be based on the resulting net grants to the institution.
• The principle of equalized per-student funding rates in the corridor has been
maintained, with reductions being applied on a consistent per-WGU and WFU fund rate basis.
• The number of WGU/WFUs used for this purpose will be the corridor midpoint
value assigned to an institution in the year for which the ‘move over’ is complete. For universities in SMA3 the corridor midpoint will include teacher education spaces and graduate spaces (master’s and doctoral) achieved up to target in SMA2 as per ministry communication on July 25, 2019. Collaborative nursing and clinical education students will continue to be funded as per the current approach.
• Institutions will be expected to maintain enrolment levels for the purposes of corridor enrolment funding as per the University and College Funding Model Technical Manuals.
• Institutions have differing grant ‘mixes’ as well as differing proportions of Core
Operating Grants delivered on the basis of WGU/WFUs. As such, the notional performance/outcomes-based funding grant allocations for each institution will vary proportionally.
• As performance/outcomes-based funding grows incrementally, each year
institutions will be ‘capped’ at the annual performance/outcomes-based funding proportion (e.g., 60%). Any funds above the cap will not be tied to performance outcomes and will flow through regular payment processes as part of the Differentiation Envelope.
Performance/Outcomes-Based Funding - Technical Manual Page 8 September 2019
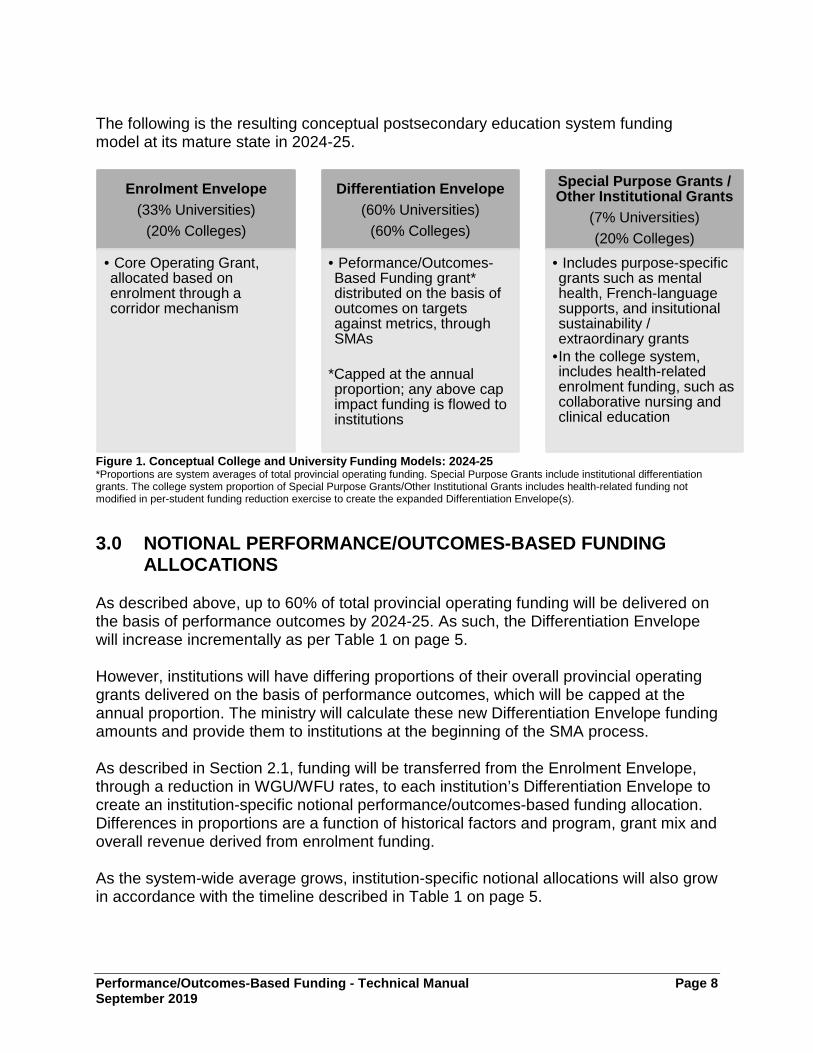
The following is the resulting conceptual postsecondary education system funding model at its mature state in 2024-25.
Figure 1. Conceptual College and University Funding Models: 2024-25 *Proportions are system averages of total provincial operating funding. Special Purpose Grants include institutional differentiation grants. The college system proportion of Special Purpose Grants/Other Institutional Grants includes health-related funding not modified in per-student funding reduction exercise to create the expanded Differentiation Envelope(s). 3.0 NOTIONAL PERFORMANCE/OUTCOMES-BASED FUNDING
ALLOCATIONS As described above, up to 60% of total provincial operating funding will be delivered on the basis of performance outcomes by 2024-25. As such, the Differentiation Envelope will increase incrementally as per Table 1 on page 5. However, institutions will have differing proportions of their overall provincial operating grants delivered on the basis of performance outcomes, which will be capped at the annual proportion. The ministry will calculate these new Differentiation Envelope funding amounts and provide them to institutions at the beginning of the SMA process. As described in Section 2.1, funding will be transferred from the Enrolment Envelope, through a reduction in WGU/WFU rates, to each institution’s Differentiation Envelope to create an institution-specific notional performance/outcomes-based funding allocation. Differences in proportions are a function of historical factors and program, grant mix and overall revenue derived from enrolment funding. As the system-wide average grows, institution-specific notional allocations will also grow in accordance with the timeline described in Table 1 on page 5.
Enrolment Envelope(33% Universities)
(20% Colleges)
• Core Operating Grant, allocated based on enrolment through a corridor mechanism
Differentiation Envelope(60% Universities)
(60% Colleges)
• Peformance/Outcomes-Based Funding grant* distributed on the basis of outcomes on targets against metrics, through SMAs
*Capped at the annual proportion; any above cap impact funding is flowed to institutions
Special Purpose Grants / Other Institutional Grants
(7% Universities)(20% Colleges)
• Includes purpose-specific grants such as mental health, French-language supports, and insitutional sustainability / extraordinary grants
•In the college system, includes health-related enrolment funding, such as collaborative nursing and clinical education
Performance/Outcomes-Based Funding - Technical Manual Page 9 September 2019
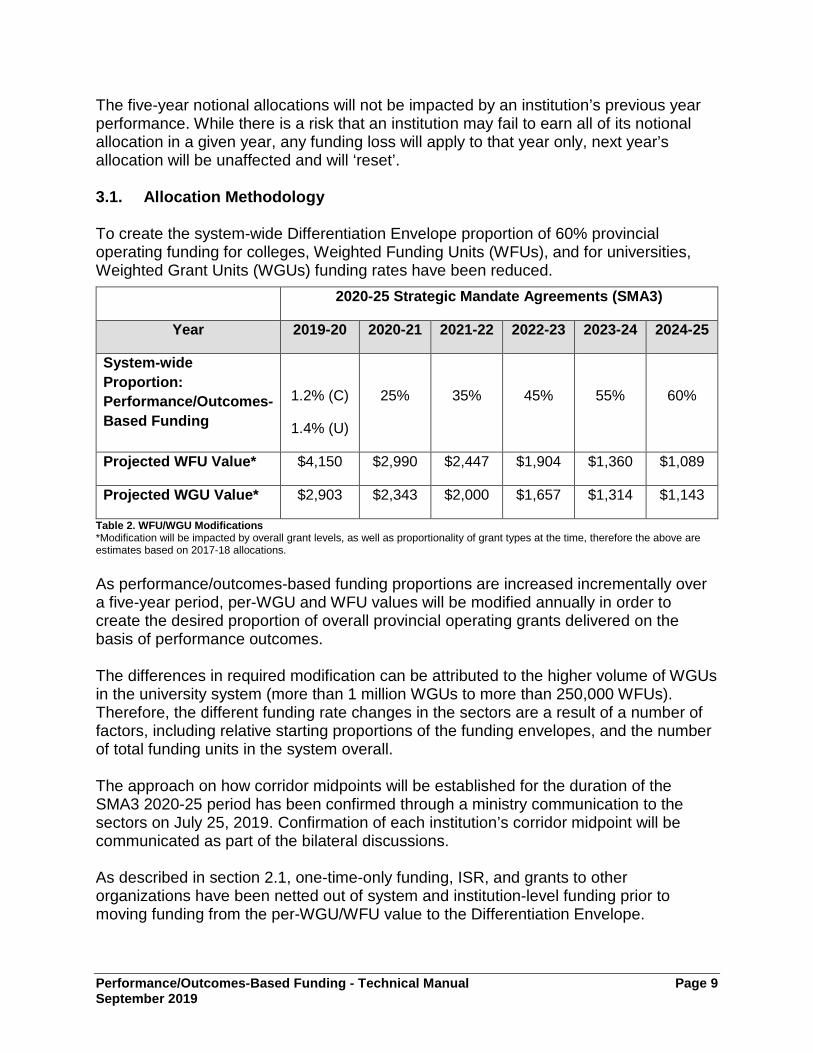
The five-year notional allocations will not be impacted by an institution’s previous year performance. While there is a risk that an institution may fail to earn all of its notional allocation in a given year, any funding loss will apply to that year only, next year’s allocation will be unaffected and will ‘reset’. 3.1. Allocation Methodology To create the system-wide Differentiation Envelope proportion of 60% provincial operating funding for colleges, Weighted Funding Units (WFUs), and for universities, Weighted Grant Units (WGUs) funding rates have been reduced.
2020-25 Strategic Mandate Agreements (SMA3)
Year 2019-20 2020-21 2021-22 2022-23 2023-24 2024-25
System-wide Proportion: Performance/Outcomes-Based Funding
1.2% (C)
1.4% (U)
25%
35%
45%
55%
60%
Projected WFU Value* $4,150 $2,990 $2,447 $1,904 $1,360 $1,089
Projected WGU Value* $2,903 $2,343 $2,000 $1,657 $1,314 $1,143
Table 2. WFU/WGU Modifications *Modification will be impacted by overall grant levels, as well as proportionality of grant types at the time, therefore the above are estimates based on 2017-18 allocations. As performance/outcomes-based funding proportions are increased incrementally over a five-year period, per-WGU and WFU values will be modified annually in order to create the desired proportion of overall provincial operating grants delivered on the basis of performance outcomes. The differences in required modification can be attributed to the higher volume of WGUs in the university system (more than 1 million WGUs to more than 250,000 WFUs). Therefore, the different funding rate changes in the sectors are a result of a number of factors, including relative starting proportions of the funding envelopes, and the number of total funding units in the system overall. The approach on how corridor midpoints will be established for the duration of the SMA3 2020-25 period has been confirmed through a ministry communication to the sectors on July 25, 2019. Confirmation of each institution’s corridor midpoint will be communicated as part of the bilateral discussions. As described in section 2.1, one-time-only funding, ISR, and grants to other organizations have been netted out of system and institution-level funding prior to moving funding from the per-WGU/WFU value to the Differentiation Envelope.

Performance/Outcomes-Based Funding - Technical Manual Page 10 September 2019
Therefore, the desired overall proportion of performance/outcomes-based funding, and the associated value, will be calculated against this net provincial operating grant total. One-time-only funding and grants to other organizations have been included for totalling purposes to determine that year’s institution-specific notional allocation but will be reconciled through the usual accounting practices for this funding. The prior year’s ISR will be deducted, at an institution by institution level, from the Core Operating Grant at each institution prior to the calculation of that year’s ‘move-over’ and WGU/WFU funding rate adjustment to create the desired proportion of performance-related funding. Using a net-of-ISR (as well as one-time-only funding and other organization grants) provincial operating total will ultimately reduce the gross amount of funding to be reallocated, avoiding a greater impact than necessary to enrolment funding in order to achieve the desired proportions. Prior year ISR will be used as a proxy for anticipated ISR in the ‘move over’ calculation in order to avoid the potentially impactful in-year adjustment to funding proportions that would be required to incorporate current-year ISR figures. Any reconciliation to total funding that normally follows the finalizing of a given year’s ISR will continue as currently in place, but it will not require any additional ‘move-over’ considerations. It is important to note that initial notional allocations remain grant neutral for institutions. 3.2. Funding Distribution Funding delivered on the basis of SMA-related outcomes will flow in-year, with an institution’s performance/outcomes-based funding grant allocation delivered using the existing semi-monthly disbursement approach. Any residual funding in the Differentiation Envelope resulting from the annual performance/outcomes-based funding cap will also be delivered through this process. As such, institutions will begin the fiscal year by receiving their Differentiation Envelope, including their notional performance/outcomes-based funding grant allocation disbursed through semi-monthly payments as per the ministry’s regular payment schedule. Performance will be assessed through a 3rd Quarter (Q3) Annual Evaluation Report. Should an institution’s performance fail to earn it 100% of its notional performance/outcomes-based funding allocation, the remainder of its semi-monthly payments in Q3 and Q4 will be adjusted based on performance results. 4.0 IMPLEMENTATION OF PEFORMANCE/OUTCOMES-BASED
FUNDING As described above, key objectives for performance/outcomes-based funding include supporting an increased institutional focus on postsecondary education alignment with labour market and economic outcomes, while demonstrating accountability and transparency through improved performance outcomes tied to government priorities.

Performance/Outcomes-Based Funding - Technical Manual Page 11 September 2019
Performance/outcomes-based funding will be operationalized through SMAs, using funding in the Differentiation Envelope (e.g., institution’s notional performance/outcomes-based funding grant allocations), and distributed through the mechanism that is later described in this manual. 4.1 Strategic Mandate Agreements SMAs are a key accountability tool for the ministry. As SMAs are iterative in nature, each cycle presents an opportunity to focus on targeted government priorities. As such, the beginning of each SMA cycle will establish the following operational considerations:
• Confirmation of government priority areas, as well as associated system-wide and/or institutional-specific performance metrics and reporting metrics;
• Institution notional funding allocations; • Confirmation of enrolment corridors; • Establishment of targets; • Metric bands of tolerance and other evaluation parameters; • Metric weighting parameters; • Annual performance evaluation processes; and, • Other items as necessary.
Details on the SMA3 cycle can be found in section 6.0. 4.2 Performance/Outcomes-Based Funding Mechanism A mechanism to implement performance/outcomes-based funding has been designed that best supports differentiated and continuous improvement and aligns with the principles and objectives for performance/outcomes-based funding. The mechanism’s key design features balance increasing the effectiveness and efficiency of institutions, while supporting institutional strengths in the postsecondary education system. Below is a visual representation of the performance/outcomes-based funding mechanism.
Figure 2. Conceptual Performance/Outcomes-based Funding Mechanism
Metrics Tied to FundingAll system-wide metrics, and a limited number of
institution-specific metrics are tied to funding.
Performance MeasurementInstitutions are measured against themselves. Targets are based on an institution’s historical
data & established criteria.
Differentiation Metric WeightingInstitutions assign proportional weightings for
each metric that is tied to funding - limited adjustments considered.
Outcomes EvaluationPerformance is evaluated using a pass/fail
approach, with bands of tolerance and scaling for underachievement.
Key Design
Elements

Performance/Outcomes-Based Funding - Technical Manual Page 12 September 2019
Metrics Tied to Funding Performance metrics tied to funding are selected from sources that allow for improvements in data quality and follow predictable and regular reporting schedules that can be validated, replicated and verified. Metrics are balanced and broad enough to recognize the individual strengths and mandates of Ontario’s postsecondary institutions in serving local communities and economies. For more details on SMA3 performance metrics and reporting schedule please see section 6.1. Differentiation Metric Weighting To support institutional strengths and recognition of contributions to their communities and postsecondary education system, institutions will assign metric weightings to the performance metrics. Metric weightings will impact the share of an institution’s notional funding that can be received for successful performance related to a particular metric. The ministry will set parameters around metric weightings. Metric weightings must total 100% and must be established for the duration of the SMA period. Institutions may be eligible to adjust weightings once during the SMA period. For more details on SMA3 metric weighting parameters please see section 6.2. Performance Measurement Institutions will be measured against individualised targets based on historical performance. During the target-setting process, the ministry will establish targets using an institution’s historical data and ministry established criteria. The ministry will prepopulate measurable and quantifiable targets which support continuous improvement consistent with the institutional performance history for finalization during the SMA bilateral discussion period. Targets will be established using consistent principles. For more details on target-setting, please see section 5.0. Outcomes Evaluation Institutions will be assessed annually by the ministry on performance against institutional-specific targets on performance metrics. The ministry will also set reasonable bands of tolerance around targets to help mitigate against small year-to-year variances in performance. Bands of tolerance will be included
Performance/Outcomes-Based Funding - Technical Manual Page 13 September 2019
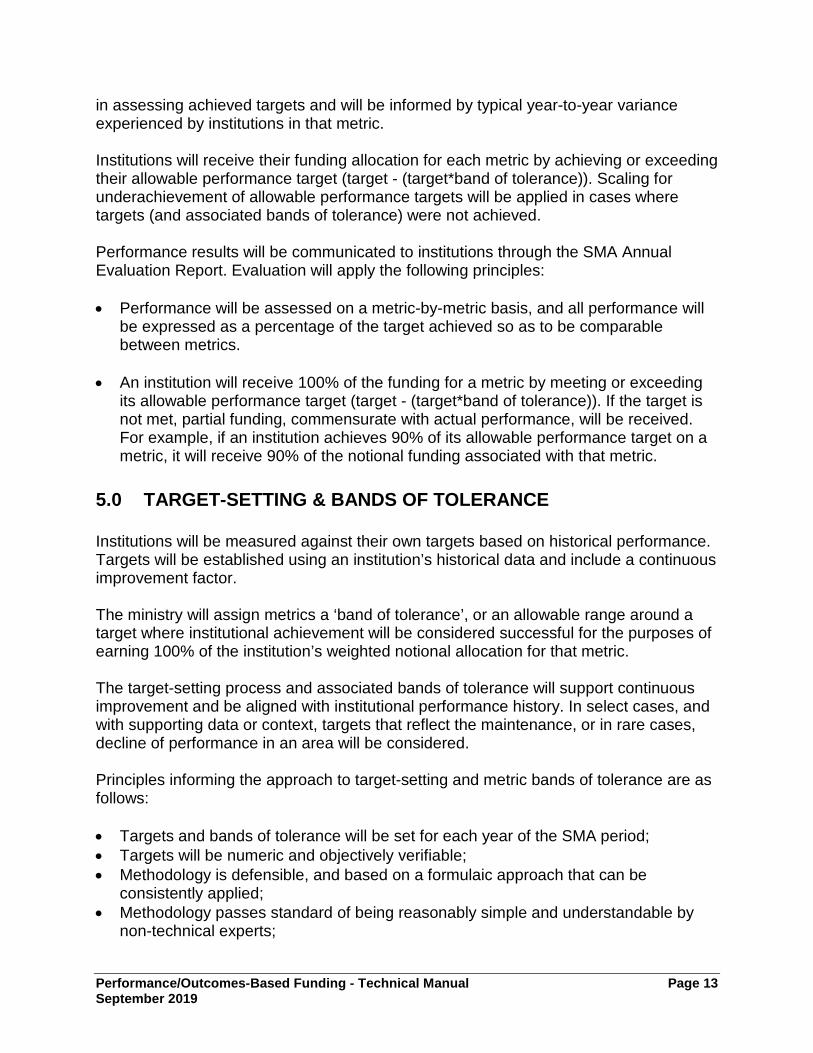
in assessing achieved targets and will be informed by typical year-to-year variance experienced by institutions in that metric. Institutions will receive their funding allocation for each metric by achieving or exceeding their allowable performance target (target - (target*band of tolerance)). Scaling for underachievement of allowable performance targets will be applied in cases where targets (and associated bands of tolerance) were not achieved. Performance results will be communicated to institutions through the SMA Annual Evaluation Report. Evaluation will apply the following principles: • Performance will be assessed on a metric-by-metric basis, and all performance will
be expressed as a percentage of the target achieved so as to be comparable between metrics.
• An institution will receive 100% of the funding for a metric by meeting or exceeding its allowable performance target (target - (target*band of tolerance)). If the target is not met, partial funding, commensurate with actual performance, will be received. For example, if an institution achieves 90% of its allowable performance target on a metric, it will receive 90% of the notional funding associated with that metric.
5.0 TARGET-SETTING & BANDS OF TOLERANCE Institutions will be measured against their own targets based on historical performance. Targets will be established using an institution’s historical data and include a continuous improvement factor. The ministry will assign metrics a ‘band of tolerance’, or an allowable range around a target where institutional achievement will be considered successful for the purposes of earning 100% of the institution’s weighted notional allocation for that metric. The target-setting process and associated bands of tolerance will support continuous improvement and be aligned with institutional performance history. In select cases, and with supporting data or context, targets that reflect the maintenance, or in rare cases, decline of performance in an area will be considered. Principles informing the approach to target-setting and metric bands of tolerance are as follows: • Targets and bands of tolerance will be set for each year of the SMA period; • Targets will be numeric and objectively verifiable; • Methodology is defensible, and based on a formulaic approach that can be
consistently applied; • Methodology passes standard of being reasonably simple and understandable by
non-technical experts;

Performance/Outcomes-Based Funding - Technical Manual Page 14 September 2019
• Informed by institutional historical performance; institutions will be asked to supply historical data for metrics where they are the ‘keepers’ of the data;
• Includes element of continuous improvement and disincentivizes ‘continuous decline’;
• Recognizes the most recent historic performance in setting annual targets; • Methodology allows for targets and bands of tolerance to be set on a metric-by-
metric and institution-by-institution basis; and, • Supports institutional strengths, including considerations for ‘best-in-class’
institutions.
5.1 Target-Setting Approach Targets will be updated annually and set using the smallest percentage point variation over historical average. The three most recent data points are averaged, and the smaller of the variations between Year 1 & Year 2 and Year 2 & Year 3 is added to the average. The direction of the variations (positive or negative) is not considered – the absolute size of the change from one year to the next will be used to determine the annual variations and to identify the smaller variation over the three-year period.
Example for Illustrative Purposes Only:
Institution A’s Graduation Rate for the three most recent years are 76%, 79%, and 77%.
• The average is 77.3%. • The smallest annual variation is 2%-points (79% - 77% = 2%-points). • Resulting in a target of 79.3% (77.3% + 2%-points = 79.3%).
Annualizing Targets & Bands of Tolerance Consistent with the approach described above, the ministry will refresh performance targets and associated bands of tolerance annually as part of the regular SMA3 Annual Evaluation process. The methodology will be applied to the most recent year of data which will also be used to inform annual performance outcomes. For specific metrics that use funding amounts2, targets and performance outcomes will be calculated using a rolling three-year average.
2 Universities: Research Funding & Capacity; Research Revenue Attracted from Private Sector Sources Colleges: Revenue Attracted from Private Sector Sources
Performance/Outcomes-Based Funding - Technical Manual Page 15 September 2019
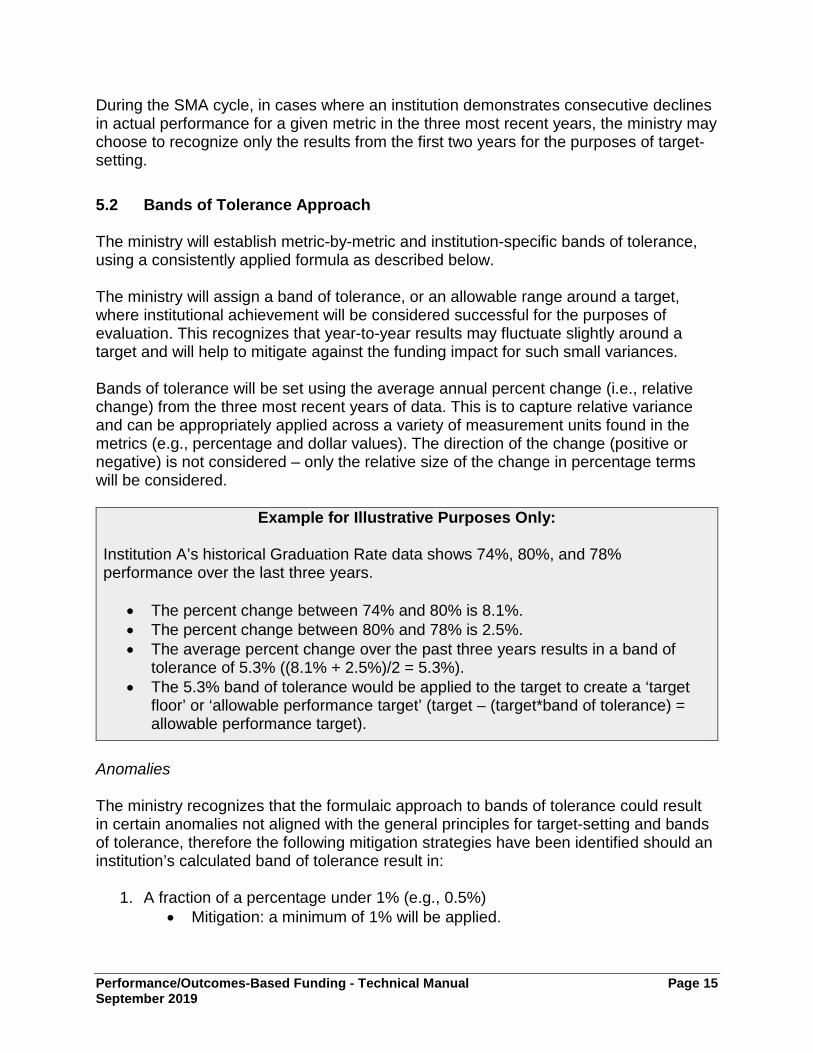
During the SMA cycle, in cases where an institution demonstrates consecutive declines in actual performance for a given metric in the three most recent years, the ministry may choose to recognize only the results from the first two years for the purposes of target-setting. 5.2 Bands of Tolerance Approach The ministry will establish metric-by-metric and institution-specific bands of tolerance, using a consistently applied formula as described below. The ministry will assign a band of tolerance, or an allowable range around a target, where institutional achievement will be considered successful for the purposes of evaluation. This recognizes that year-to-year results may fluctuate slightly around a target and will help to mitigate against the funding impact for such small variances. Bands of tolerance will be set using the average annual percent change (i.e., relative change) from the three most recent years of data. This is to capture relative variance and can be appropriately applied across a variety of measurement units found in the metrics (e.g., percentage and dollar values). The direction of the change (positive or negative) is not considered – only the relative size of the change in percentage terms will be considered.
Example for Illustrative Purposes Only:
Institution A’s historical Graduation Rate data shows 74%, 80%, and 78% performance over the last three years.
• The percent change between 74% and 80% is 8.1%. • The percent change between 80% and 78% is 2.5%. • The average percent change over the past three years results in a band of
tolerance of 5.3% ((8.1% + 2.5%)/2 = 5.3%). • The 5.3% band of tolerance would be applied to the target to create a ‘target
floor’ or ‘allowable performance target’ (target – (target*band of tolerance) = allowable performance target).
Anomalies The ministry recognizes that the formulaic approach to bands of tolerance could result in certain anomalies not aligned with the general principles for target-setting and bands of tolerance, therefore the following mitigation strategies have been identified should an institution’s calculated band of tolerance result in:
1. A fraction of a percentage under 1% (e.g., 0.5%) • Mitigation: a minimum of 1% will be applied.
Performance/Outcomes-Based Funding - Technical Manual Page 16 September 2019
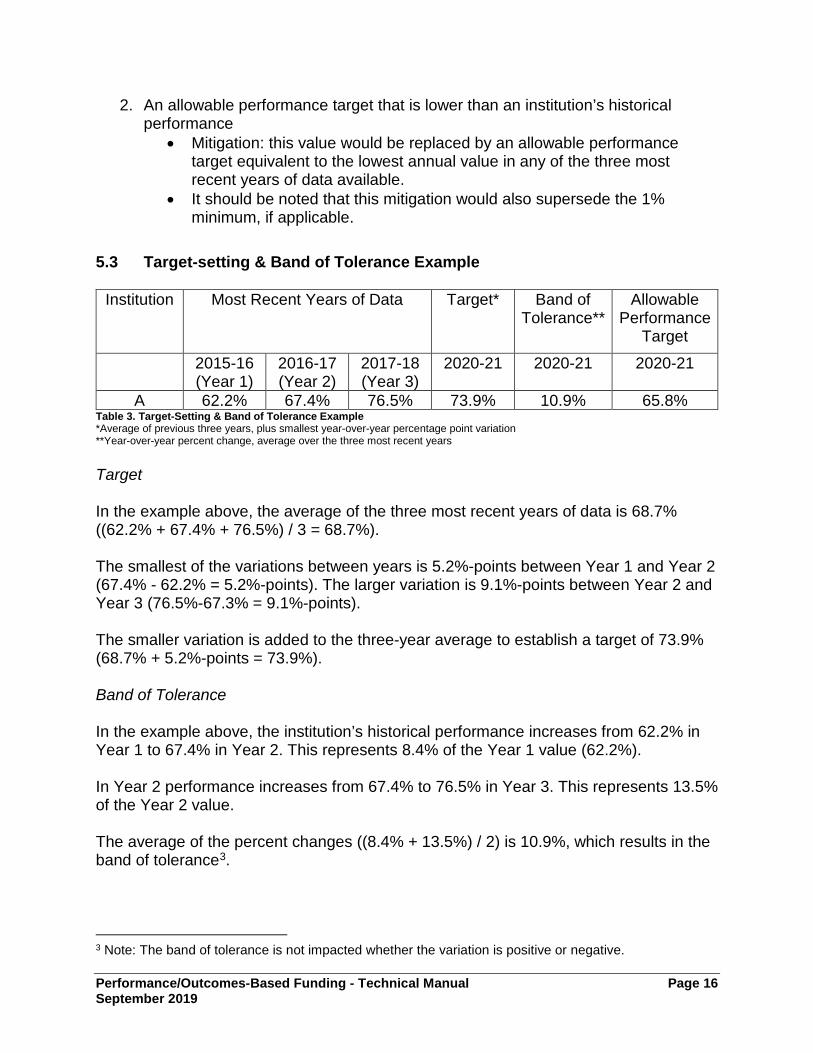
2. An allowable performance target that is lower than an institution’s historical performance
• Mitigation: this value would be replaced by an allowable performance target equivalent to the lowest annual value in any of the three most recent years of data available.
• It should be noted that this mitigation would also supersede the 1% minimum, if applicable.
5.3 Target-setting & Band of Tolerance Example
Institution Most Recent Years of Data Target* Band of Tolerance**
Allowable Performance
Target 2015-16
(Year 1) 2016-17 (Year 2)
2017-18 (Year 3)
2020-21 2020-21 2020-21
A 62.2% 67.4% 76.5% 73.9% 10.9% 65.8% Table 3. Target-Setting & Band of Tolerance Example *Average of previous three years, plus smallest year-over-year percentage point variation **Year-over-year percent change, average over the three most recent years Target In the example above, the average of the three most recent years of data is 68.7% ((62.2% + 67.4% + 76.5%) / 3 = 68.7%). The smallest of the variations between years is 5.2%-points between Year 1 and Year 2 (67.4% - 62.2% = 5.2%-points). The larger variation is 9.1%-points between Year 2 and Year 3 (76.5%-67.3% = 9.1%-points). The smaller variation is added to the three-year average to establish a target of 73.9% (68.7% + 5.2%-points = 73.9%). Band of Tolerance In the example above, the institution’s historical performance increases from 62.2% in Year 1 to 67.4% in Year 2. This represents 8.4% of the Year 1 value (62.2%). In Year 2 performance increases from 67.4% to 76.5% in Year 3. This represents 13.5% of the Year 2 value. The average of the percent changes ((8.4% + 13.5%) / 2) is 10.9%, which results in the band of tolerance3.
3 Note: The band of tolerance is not impacted whether the variation is positive or negative.
Performance/Outcomes-Based Funding - Technical Manual Page 17 September 2019
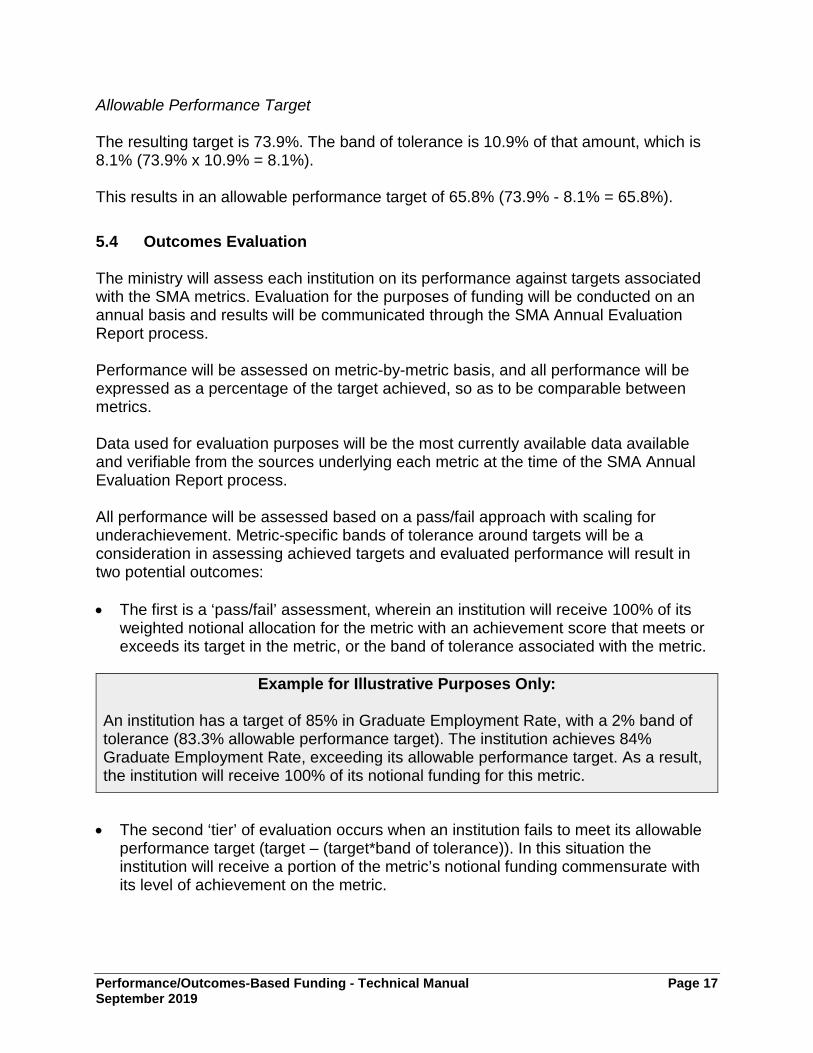
Allowable Performance Target The resulting target is 73.9%. The band of tolerance is 10.9% of that amount, which is 8.1% (73.9% x 10.9% = 8.1%). This results in an allowable performance target of 65.8% (73.9% - 8.1% = 65.8%). 5.4 Outcomes Evaluation The ministry will assess each institution on its performance against targets associated with the SMA metrics. Evaluation for the purposes of funding will be conducted on an annual basis and results will be communicated through the SMA Annual Evaluation Report process. Performance will be assessed on metric-by-metric basis, and all performance will be expressed as a percentage of the target achieved, so as to be comparable between metrics. Data used for evaluation purposes will be the most currently available data available and verifiable from the sources underlying each metric at the time of the SMA Annual Evaluation Report process. All performance will be assessed based on a pass/fail approach with scaling for underachievement. Metric-specific bands of tolerance around targets will be a consideration in assessing achieved targets and evaluated performance will result in two potential outcomes: • The first is a ‘pass/fail’ assessment, wherein an institution will receive 100% of its
weighted notional allocation for the metric with an achievement score that meets or exceeds its target in the metric, or the band of tolerance associated with the metric.
Example for Illustrative Purposes Only:
An institution has a target of 85% in Graduate Employment Rate, with a 2% band of tolerance (83.3% allowable performance target). The institution achieves 84% Graduate Employment Rate, exceeding its allowable performance target. As a result, the institution will receive 100% of its notional funding for this metric.
• The second ‘tier’ of evaluation occurs when an institution fails to meet its allowable performance target (target – (target*band of tolerance)). In this situation the institution will receive a portion of the metric’s notional funding commensurate with its level of achievement on the metric.

Performance/Outcomes-Based Funding - Technical Manual Page 18 September 2019
Example for Illustrative Purposes Only:
An institution has a target of 85% in Graduate Employment Rate, with a 2% band of tolerance. The institution achieves 77% or 92.4% of its allowable performance target. This is below the 2% band of tolerance for this metric, and so excludes the institution from receiving 100% of the notional allocation associated with this metric. Instead, it will receive a scaled amount of 92.4% of its notional funding for this metric.
6.0 2020-25 STRATEGIC MANDATE AGREEMENTS (SMA3) SMA3 will be a five-year cycle and will be significantly streamlined to support reporting burden reduction, while implementing performance/outcomes-based funding. SMA3 will deliver bilateral agreements from April 1, 2020 – March 31, 2025, executed between the ministry and Ontario’s publicly-assisted colleges and universities, with the following key focuses: • Performance Funding: the ministry will calculate and provide each institution with its
annual notional performance/outcomes-based funding allocation.
• Metric Weighting: Institutions will assign weightings to each metric in accordance with the ministry established parameters and graduated implementation plan for weighting.
• Performance Targets: the ministry will operationalize the target-setting process described in section 5.0, through the prepopulation of institution-specific historical data sets (where applicable) and finalized through discussions.
• Bands of Tolerance: the ministry will calculate metric and institution-specific bands of tolerance.
• Enrolment Funding: the ministry will confirm the enrolment corridor midpoints for the
2020-25 period. Institutions will provide five-year enrolment projections for domestic and international students.
Broad policy and system design issues will not be considered as part of SMA3 bilateral discussions and will be referred as appropriate within the ministry.
6.1 SMA3 Priority Areas and Metrics SMA3 will link 10 metrics (nine system-wide and one institution-specific (universities) and eight system-wide and two institution-specific (colleges)) to performance/outcomes-based funding through two priority areas identified to best support the priorities of government, related to:

Performance/Outcomes-Based Funding - Technical Manual Page 19 September 2019
• Skills & Job Outcomes • Economic & Community Impact A third priority area has been identified related to Productivity, Accountability & Transparency, and will include two reporting metrics related to faculty compensation and faculty workload; however, these metrics will not be tied to performance funding. Metrics will be phased in over a three-year period from 2020-21 to 2022-23, enabling data refinement and/or in some cases data development to support their use in a performance system, as well as to coincide with a phased-in approach to the system-level proportion of funding. Priority Area Colleges Universities
Skills & Job Outcomes
Graduate Employment Earnings
Experiential Learning
Skills & Competencies
Graduate Employment
Institutional Strength / Focus
Graduation Rate
Economic & Community Impact
Institution-specific (Apprenticeship-related)
Research Funding & Capacity: Tri-Agency
Funding
Innovation: Funding from Private Sector Sources
Innovation: Research Funding from Private
Sector Sources
Community / Local Impact
Institution-Specific (Economic Impact)
Productivity, Accountability & Transparency
Faculty Compensation
Faculty Workload
Table 3. SMA3 Priority Areas and Metrics See section 9.0 (Appendices, 9.1) for detailed metric operational definitions and activation for metrics phase-in.
Performance/Outcomes-Based Funding - Technical Manual Page 20 September 2019
6.2 Metric Weighting Parameters As described in section 4.2, the performance/outcomes-based funding mechanism has been designed to enable institutions to assign funding weights to the SMA metrics. Metric weightings will impact the share of an institution’s notional funding that can be received for successful performance related to a particular metric.
Ministry parameters around metric weightings will be set, which for SMA3 will be a minimum of 5% and a maximum of 25% at steady-state in 2024-25.
As metrics will be phased in over a three-year period from 2020-21 to 2022-23, and associated funding over the full five-year period, the metric weightings and ministry parameters will also be phased-in using the following minima and maxima parameters:
• 2020-21: Maximum 35%, minimum 10% • 2021-22: Maximum 30%, minimum 5% • 2022-23: Maximum 25%, minimum 5%
Institutions will be required to set metric weightings for each metric, consistent with the weighting parameters, for each year of the SMA3 period. Metrics must total 100% in any given year and weightings will be quantified by the ministry and confirmed through the SMA3 bilateral discussions.
For all institutions, the Skills & Competencies metric will be weighted at 5% starting in year 2022-23 for participation and posting of results online.
At the government’s discretion, institutions will have an opportunity to adjust metric weightings once during the SMA3 cycle. See section 9.0 (Appendices, 9.2) for metric weighting examples. 6.3 SMA3 Instrument & Institutional Data Workbooks To begin SMA3 bilateral discussions with institutions, the ministry will prepopulate and issue an institution-specific SMA3 instrument/agreement and data workbook to each institution, which will include metric definitions and sources, historical data, targets for finalization, and the associated bands of tolerance. For metrics where institutions will provide the data (e.g., Institutional Strength / Focus, Institution-Specific Economic Impact and Institution-Specific Apprenticeship-related (colleges)) institutions will complete the relevant sections of the data workbook for validation / analysis by the ministry for alignment with ministry criteria and data quality.
Performance/Outcomes-Based Funding - Technical Manual Page 21 September 2019
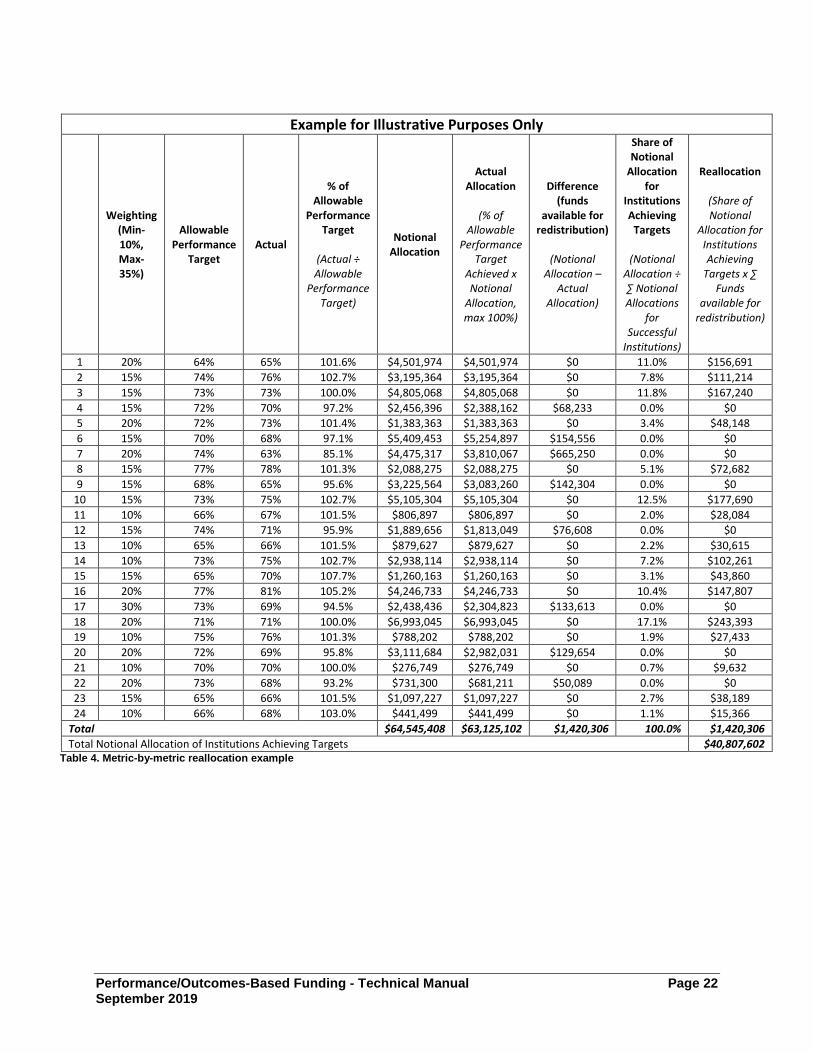
6.4 SMA3 Annual Evaluation Process An SMA Annual Evaluation Report will be produced annually. For the 2020-25 SMA period this report will be called the ‘SMA3 Annual Evaluation Report’. In the Fall of each fiscal year for which performance is being evaluated to determine performance/outcomes-based funding, this report will be produced, prepopulated and coordinated by the ministry and distributed to institutions for review and validation, as well as completion of data inputs, where necessary. 7.0 Reallocation of Unallocated Funding The performance/outcomes-based funding mechanism has been designed to enable the reallocation of unallocated funding, in any given year. When this happens, reallocation would only impact that year, and would not impact future notional allocations. 7.1 Metric-by-Metric Reallocation Unallocated funding will be reallocated on a metric-by-metric basis, with redistribution proportional to notional allocations by metric. Therefore, each year, during the SMA3 Annual Evaluation process, any funding made available through underachievement by institutions in a particular metric will be redistributed to all institutions who have earned 100% of their notional allocation in that metric (e.g., have met or exceeded its allowable performance target). The reallocation of available funding will be based on the relative proportion of institutional notional funding impacted by an institution’s performance/outcomes-based grant size and chosen weightings by metric in that year. This process will be repeated for each metric using any funds available in that metric. The amount of funding available to a successful institution is determined by an institution’s share of the total notional funding of all institutions receiving reallocated funds for the individual metric and the relative notional allocations recognizes both the level of risk an institution has in a metric through the assigned metric weighting, as well as the size of the institution.
Performance/Outcomes-Based Funding - Technical Manual Page 22 September 2019
Example for Illustrative Purposes Only
Weighting (Min- 10%, Max- 35%)
Allowable Performance
Target Actual
% of Allowable
Performance Target
(Actual ÷ Allowable
Performance Target)
Notional Allocation
Actual Allocation
(% of
Allowable Performance
Target Achieved x Notional
Allocation, max 100%)
Difference (funds
available for redistribution)
(Notional
Allocation – Actual
Allocation)
Share of Notional
Allocation for
Institutions Achieving
Targets
(Notional Allocation ÷ ∑ Notional Allocations
for Successful
Institutions)
Reallocation
(Share of Notional
Allocation for Institutions Achieving
Targets x ∑ Funds
available for redistribution)
1 20% 64% 65% 101.6% $4,501,974 $4,501,974 $0 11.0% $156,691 2 15% 74% 76% 102.7% $3,195,364 $3,195,364 $0 7.8% $111,214 3 15% 73% 73% 100.0% $4,805,068 $4,805,068 $0 11.8% $167,240 4 15% 72% 70% 97.2% $2,456,396 $2,388,162 $68,233 0.0% $0 5 20% 72% 73% 101.4% $1,383,363 $1,383,363 $0 3.4% $48,148 6 15% 70% 68% 97.1% $5,409,453 $5,254,897 $154,556 0.0% $0 7 20% 74% 63% 85.1% $4,475,317 $3,810,067 $665,250 0.0% $0 8 15% 77% 78% 101.3% $2,088,275 $2,088,275 $0 5.1% $72,682 9 15% 68% 65% 95.6% $3,225,564 $3,083,260 $142,304 0.0% $0
10 15% 73% 75% 102.7% $5,105,304 $5,105,304 $0 12.5% $177,690 11 10% 66% 67% 101.5% $806,897 $806,897 $0 2.0% $28,084 12 15% 74% 71% 95.9% $1,889,656 $1,813,049 $76,608 0.0% $0 13 10% 65% 66% 101.5% $879,627 $879,627 $0 2.2% $30,615 14 10% 73% 75% 102.7% $2,938,114 $2,938,114 $0 7.2% $102,261 15 15% 65% 70% 107.7% $1,260,163 $1,260,163 $0 3.1% $43,860 16 20% 77% 81% 105.2% $4,246,733 $4,246,733 $0 10.4% $147,807 17 30% 73% 69% 94.5% $2,438,436 $2,304,823 $133,613 0.0% $0 18 20% 71% 71% 100.0% $6,993,045 $6,993,045 $0 17.1% $243,393 19 10% 75% 76% 101.3% $788,202 $788,202 $0 1.9% $27,433 20 20% 72% 69% 95.8% $3,111,684 $2,982,031 $129,654 0.0% $0 21 10% 70% 70% 100.0% $276,749 $276,749 $0 0.7% $9,632 22 20% 73% 68% 93.2% $731,300 $681,211 $50,089 0.0% $0 23 15% 65% 66% 101.5% $1,097,227 $1,097,227 $0 2.7% $38,189 24 10% 66% 68% 103.0% $441,499 $441,499 $0 1.1% $15,366
Total $64,545,408 $63,125,102 $1,420,306 100.0% $1,420,306 Total Notional Allocation of Institutions Achieving Targets $40,807,602
Table 4. Metric-by-metric reallocation example

Performance/Outcomes-Based Funding - Technical Manual Page 23 September 2019
8.0 Adjustments & Continuous Improvement As described, the SMA cycle will allow for a limited opportunity to make changes to institutional metric weightings once during the cycle. Any requested changes would need to be supported with context on why a weighting may no longer be appropriate, such as a demonstrated change in direction or demonstrated risk arising from current weightings. The ministry maintains the ability to establish principles or limits for these changes.
The ministry will continue to monitor the implementation of performance/outcomes-based funding on an ongoing basis.
For further information on the performance/outcomes-based funding portion of the postsecondary education funding models, contact:
Strategic Mandate Agreement Secretariat, Ministry of Training, Colleges and Universities
Email: [email protected]

Performance/Outcomes-Based Funding - Technical Manual Page 24 September 2019
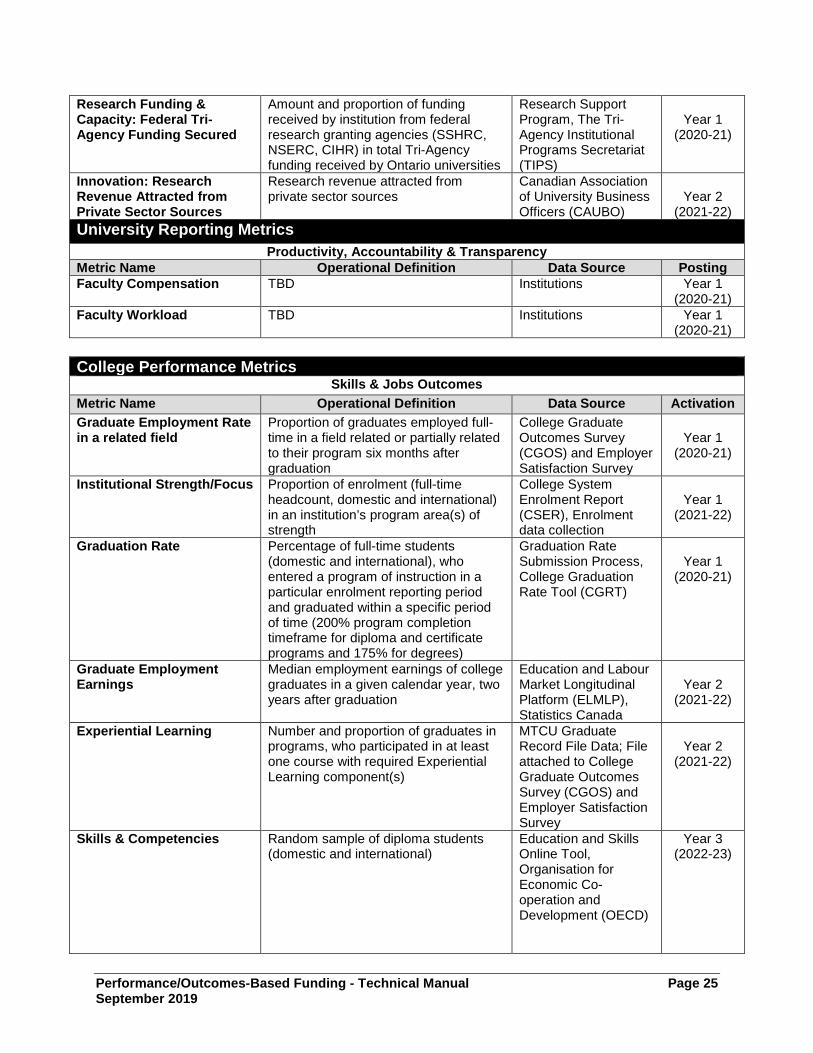
9.0 APPENDICES 9.1 SMA3 Metric Operational Definitions and Activation Schedule
University Performance Metrics Skills & Jobs Outcomes
Metric Name Operational Definition Data Source Activation Graduate Employment Rate in a related field
Proportion of graduates of bachelor or first professional degree programs employed full-time who consider their jobs either “closely” or “somewhat” related to the skills they developed in their university program, two years after graduation
MTCU Ontario University Graduate Survey (OUGS)
Year 1
(2020-21)
Institutional Strength/Focus
Proportion of enrolment (FTEs, domestic and international) in an institution’s program area(s) of strength
University Statistical Enrolment Report (USER)
Year 1
(2020-21)
Graduation Rate
Proportion of all new, full-time, year one undergraduate university students (domestic and international) of bachelors (first-entry), or first professional (second entry) degree programs who commenced their study in a given fall term and graduated from the same institution within 7 years
University Statistical Enrolment Report (USER) - Enrolment and Degrees Awarded data collections
Year 1
(2020-21)
Graduate Employment Earnings
Median employment earnings of university graduates, two years after graduation
Education and Labour Market Longitudinal Platform (ELMLP), Statistics Canada
Year 2
(2021-22)
Experiential Learning Number and proportion of graduates in undergraduate programs, who participated in at least one course with required Experiential Learning (EL) component(s)
Institutions
Year 2
(2021-22)
Skills & Competencies Random sample of undergraduate students (domestic and international)
Education and Skills Online Tool, Organisation for Economic Co-operation and Development (OECD)
Year 3 (2022-23)
Economic & Community Impact Metric Name Operational Definition Data Source Activation Community/Local Impact Institutional enrolment share in the
population of the city (cities)/town(s) in which the institution is located
University Statistical Enrolment Report (USER), Enrolment data collection; Census Data (Statistics Canada)
Year 1
(2020-21)
Institution-Specific (Economic Impact)
Definition to be provided/confirmed with institutions during SMA3 bilateral discussions, dependent on metric proposals
Institutions Year 1
(2020-21)
Performance/Outcomes-Based Funding - Technical Manual Page 25 September 2019
Research Funding & Capacity: Federal Tri-Agency Funding Secured
Amount and proportion of funding received by institution from federal research granting agencies (SSHRC, NSERC, CIHR) in total Tri-Agency funding received by Ontario universities
Research Support Program, The Tri-Agency Institutional Programs Secretariat (TIPS)
Year 1
(2020-21)
Innovation: Research Revenue Attracted from Private Sector Sources
Research revenue attracted from private sector sources
Canadian Association of University Business Officers (CAUBO)
Year 2
(2021-22) University Reporting Metrics
Productivity, Accountability & Transparency Metric Name Operational Definition Data Source Posting Faculty Compensation TBD Institutions Year 1
(2020-21) Faculty Workload TBD Institutions Year 1
(2020-21)
College Performance Metrics Skills & Jobs Outcomes
Metric Name Operational Definition Data Source Activation Graduate Employment Rate in a related field
Proportion of graduates employed full-time in a field related or partially related to their program six months after graduation
College Graduate Outcomes Survey (CGOS) and Employer Satisfaction Survey
Year 1
(2020-21)
Institutional Strength/Focus Proportion of enrolment (full-time headcount, domestic and international) in an institution’s program area(s) of strength
College System Enrolment Report (CSER), Enrolment data collection
Year 1
(2021-22)
Graduation Rate Percentage of full-time students (domestic and international), who entered a program of instruction in a particular enrolment reporting period and graduated within a specific period of time (200% program completion timeframe for diploma and certificate programs and 175% for degrees)
Graduation Rate Submission Process, College Graduation Rate Tool (CGRT)
Year 1
(2020-21)
Graduate Employment Earnings
Median employment earnings of college graduates in a given calendar year, two years after graduation
Education and Labour Market Longitudinal Platform (ELMLP), Statistics Canada
Year 2
(2021-22)
Experiential Learning Number and proportion of graduates in programs, who participated in at least one course with required Experiential Learning component(s)
MTCU Graduate Record File Data; File attached to College Graduate Outcomes Survey (CGOS) and Employer Satisfaction Survey
Year 2
(2021-22)
Skills & Competencies Random sample of diploma students (domestic and international)
Education and Skills Online Tool, Organisation for Economic Co-operation and Development (OECD)
Year 3 (2022-23)
Performance/Outcomes-Based Funding - Technical Manual Page 26 September 2019
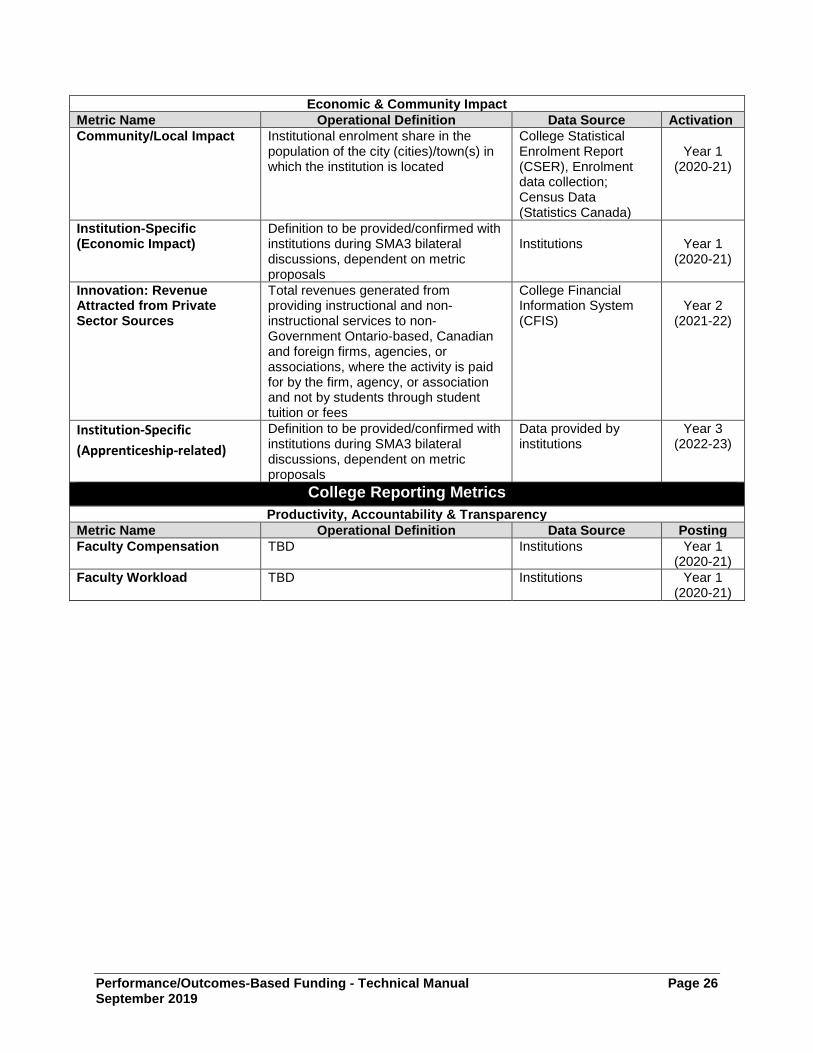
Economic & Community Impact Metric Name Operational Definition Data Source Activation Community/Local Impact
Institutional enrolment share in the population of the city (cities)/town(s) in which the institution is located
College Statistical Enrolment Report (CSER), Enrolment data collection; Census Data (Statistics Canada)
Year 1
(2020-21)
Institution-Specific (Economic Impact)
Definition to be provided/confirmed with institutions during SMA3 bilateral discussions, dependent on metric proposals
Institutions
Year 1
(2020-21)
Innovation: Revenue Attracted from Private Sector Sources
Total revenues generated from providing instructional and non-instructional services to non-Government Ontario-based, Canadian and foreign firms, agencies, or associations, where the activity is paid for by the firm, agency, or association and not by students through student tuition or fees
College Financial Information System (CFIS)
Year 2
(2021-22)
Institution-Specific (Apprenticeship-related)
Definition to be provided/confirmed with institutions during SMA3 bilateral discussions, dependent on metric proposals
Data provided by institutions
Year 3 (2022-23)
College Reporting Metrics Productivity, Accountability & Transparency
Metric Name Operational Definition Data Source Posting Faculty Compensation TBD Institutions Year 1
(2020-21) Faculty Workload TBD Institutions Year 1
(2020-21)
Performance/Outcomes-Based Funding - Technical Manual Page 27 September 2019
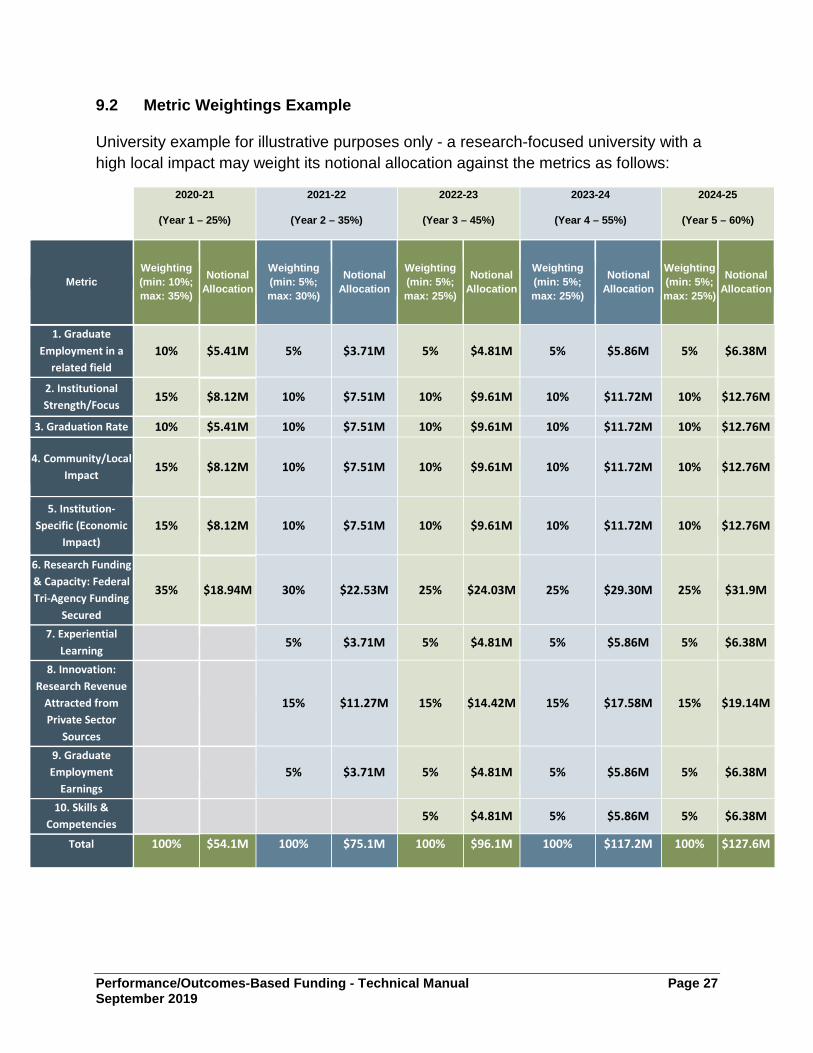
9.2 Metric Weightings Example University example for illustrative purposes only - a research-focused university with a high local impact may weight its notional allocation against the metrics as follows:
2020-21
(Year 1 – 25%)
2021-22
(Year 2 – 35%)
2022-23
(Year 3 – 45%)
2023-24
(Year 4 – 55%)
2024-25
(Year 5 – 60%)
Metric Weighting (min: 10%; max: 35%)
Notional Allocation
Weighting (min: 5%; max: 30%)
Notional Allocation
Weighting (min: 5%; max: 25%)
Notional Allocation
Weighting (min: 5%; max: 25%)
Notional Allocation
Weighting (min: 5%; max: 25%)
Notional Allocation
1. Graduate Employment in a
related field 10% $5.41M 5% $3.71M 5% $4.81M 5% $5.86M 5% $6.38M
2. Institutional Strength/Focus
15% $8.12M 10% $7.51M 10% $9.61M 10% $11.72M 10% $12.76M
3. Graduation Rate 10% $5.41M 10% $7.51M 10% $9.61M 10% $11.72M 10% $12.76M
4. Community/Local Impact
15% $8.12M 10% $7.51M 10% $9.61M 10% $11.72M 10% $12.76M
5. Institution-Specific (Economic
Impact) 15% $8.12M 10% $7.51M 10% $9.61M 10% $11.72M 10% $12.76M
6. Research Funding & Capacity: Federal Tri-Agency Funding
Secured
35% $18.94M 30% $22.53M 25% $24.03M 25% $29.30M 25% $31.9M
7. Experiential Learning
5% $3.71M 5% $4.81M 5% $5.86M 5% $6.38M
8. Innovation: Research Revenue
Attracted from Private Sector
Sources
15% $11.27M 15% $14.42M 15% $17.58M 15% $19.14M
9. Graduate Employment
Earnings 5% $3.71M 5% $4.81M 5% $5.86M 5% $6.38M
10. Skills & Competencies
5% $4.81M 5% $5.86M 5% $6.38M
Total 100% $54.1M 100% $75.1M 100% $96.1M 100% $117.2M 100% $127.6M
Performance/Outcomes-Based Funding - Technical Manual Page 28 September 2019
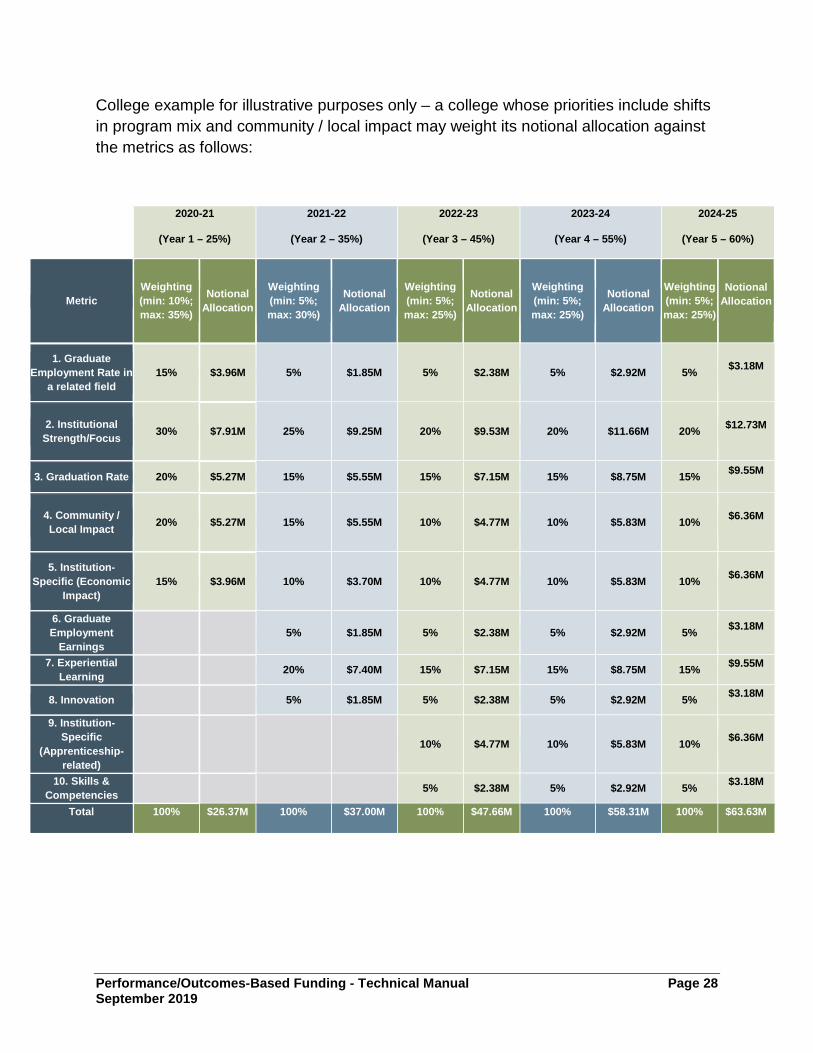
College example for illustrative purposes only – a college whose priorities include shifts in program mix and community / local impact may weight its notional allocation against the metrics as follows:
2020-21
(Year 1 – 25%)
2021-22
(Year 2 – 35%)
2022-23
(Year 3 – 45%)
2023-24
(Year 4 – 55%)
2024-25
(Year 5 – 60%)
Metric Weighting (min: 10%; max: 35%)
Notional Allocation
Weighting (min: 5%; max: 30%)
Notional Allocation
Weighting (min: 5%; max: 25%)
Notional Allocation
Weighting (min: 5%; max: 25%)
Notional Allocation
Weighting (min: 5%; max: 25%)
Notional Allocation
1. Graduate Employment Rate in
a related field 15% $3.96M 5% $1.85M 5% $2.38M 5% $2.92M 5% $3.18M
2. Institutional Strength/Focus 30% $7.91M 25% $9.25M 20% $9.53M 20% $11.66M 20% $12.73M
3. Graduation Rate 20% $5.27M 15% $5.55M 15% $7.15M 15% $8.75M 15% $9.55M
4. Community / Local Impact 20% $5.27M 15% $5.55M 10% $4.77M 10% $5.83M 10% $6.36M
5. Institution-Specific (Economic
Impact) 15% $3.96M 10% $3.70M 10% $4.77M 10% $5.83M 10% $6.36M
6. Graduate Employment
Earnings 5% $1.85M 5% $2.38M 5% $2.92M 5% $3.18M
7. Experiential Learning
20% $7.40M 15% $7.15M 15% $8.75M 15% $9.55M
8. Innovation 5% $1.85M 5% $2.38M 5% $2.92M 5% $3.18M
9. Institution-Specific
(Apprenticeship-related)
10% $4.77M 10% $5.83M 10% $6.36M
10. Skills & Competencies
5% $2.38M 5% $2.92M 5% $3.18M
Total 100% $26.37M 100% $37.00M 100% $47.66M 100% $58.31M 100% $63.63M
Performance/Outcomes-Based Funding - Technical Manual Page 29 September 2019
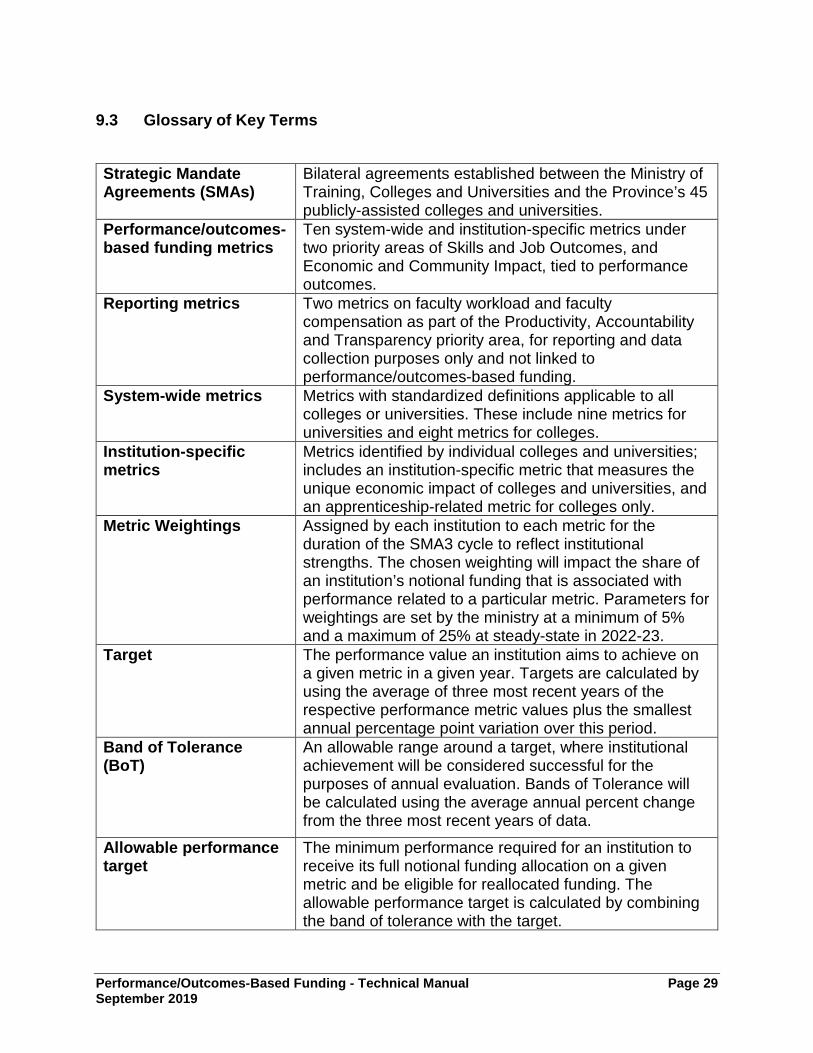
9.3 Glossary of Key Terms
Strategic Mandate Agreements (SMAs)
Bilateral agreements established between the Ministry of Training, Colleges and Universities and the Province’s 45 publicly-assisted colleges and universities.
Performance/outcomes-based funding metrics
Ten system-wide and institution-specific metrics under two priority areas of Skills and Job Outcomes, and Economic and Community Impact, tied to performance outcomes.
Reporting metrics Two metrics on faculty workload and faculty compensation as part of the Productivity, Accountability and Transparency priority area, for reporting and data collection purposes only and not linked to performance/outcomes-based funding.
System-wide metrics Metrics with standardized definitions applicable to all colleges or universities. These include nine metrics for universities and eight metrics for colleges.
Institution-specific metrics
Metrics identified by individual colleges and universities; includes an institution-specific metric that measures the unique economic impact of colleges and universities, and an apprenticeship-related metric for colleges only.
Metric Weightings Assigned by each institution to each metric for the duration of the SMA3 cycle to reflect institutional strengths. The chosen weighting will impact the share of an institution’s notional funding that is associated with performance related to a particular metric. Parameters for weightings are set by the ministry at a minimum of 5% and a maximum of 25% at steady-state in 2022-23.
Target The performance value an institution aims to achieve on a given metric in a given year. Targets are calculated by using the average of three most recent years of the respective performance metric values plus the smallest annual percentage point variation over this period.
Band of Tolerance (BoT)
An allowable range around a target, where institutional achievement will be considered successful for the purposes of annual evaluation. Bands of Tolerance will be calculated using the average annual percent change from the three most recent years of data.
Allowable performance target
The minimum performance required for an institution to receive its full notional funding allocation on a given metric and be eligible for reallocated funding. The allowable performance target is calculated by combining the band of tolerance with the target.
Performance/Outcomes-Based Funding - Technical Manual Page 30 September 2019
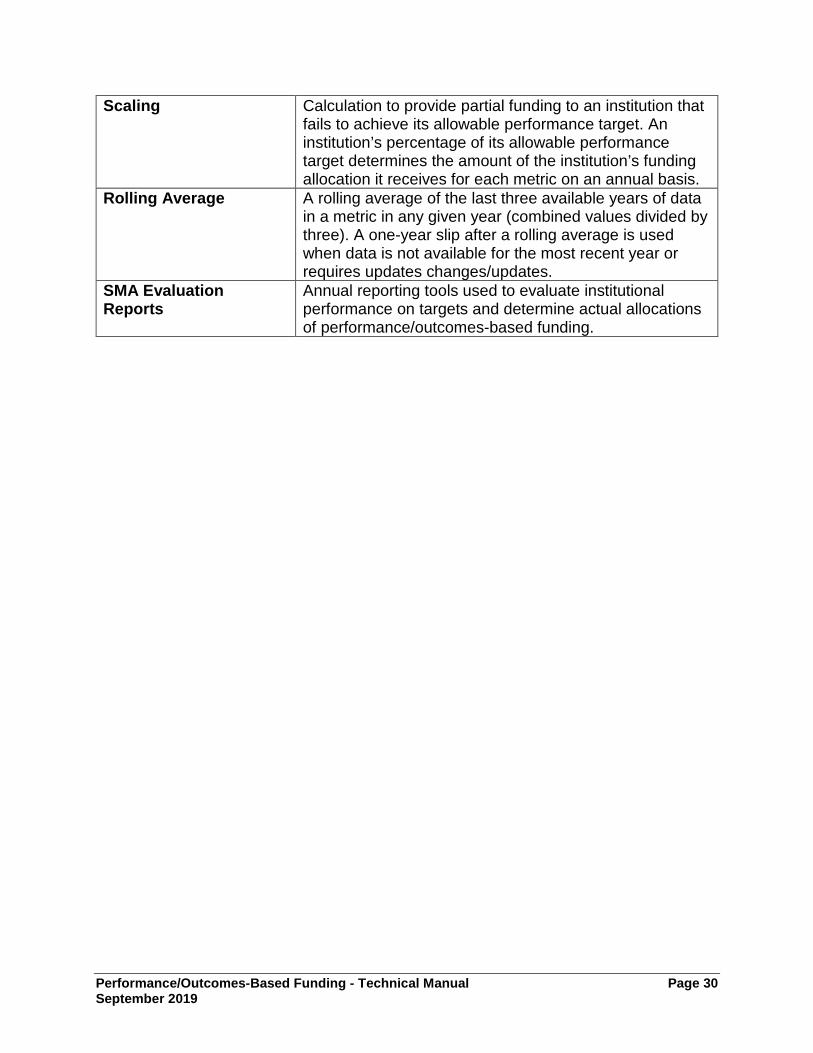
Scaling Calculation to provide partial funding to an institution that fails to achieve its allowable performance target. An institution’s percentage of its allowable performance target determines the amount of the institution’s funding allocation it receives for each metric on an annual basis.
Rolling Average A rolling average of the last three available years of data in a metric in any given year (combined values divided by three). A one-year slip after a rolling average is used when data is not available for the most recent year or requires updates changes/updates.
SMA Evaluation Reports
Annual reporting tools used to evaluate institutional performance on targets and determine actual allocations of performance/outcomes-based funding.