performance of the industries in hawaii and the...
TRANSCRIPT

PerformanceoftheManufacturingIndustriesin
HawaiiandtheU.S.
Department of Business, Economic Development and Tourism
November 2016

2|P a g e
Hawaii Department of Business, Economic Development & Tourism
November 2016

P a g e |3
TableofContents
EXECUTIVESUMMARY 4
I. INTRODUCTION 7 ResearchObjectives 8 DataSources 8 Major Industry Groups of the Manufacturing Sector 9
II. COSTSTRUCTUREOFMANUFACTURINGSECTOR 12
III. HISTORICALTRENDSOFTHEMANUFACTURINGSECTOR 14
IV. HAWAII’SMANUFACTURINGSECTORPORTFOLIO 18ManufacturingSectorJobGrowth 18NationalCompetitivenessoftheManufacturingSector 21IndustryConcentration–Hawaii’sManufacturingSpecialties 22PerformanceMapFramework:IdentifyingEmergingManufacturingIndustries23
V. MANUFACTURINGINDUSTRYPERFORMANCEBYCOUNTY 26City&CountyofHonolulu 26HawaiiCounty 27MauiCounty 29KauaiCounty 30
VI. MANUFACTURINGINDUSTRYPERFORMANCEBYMAJORGROUP 32
FoodandBeverageandTobaccoManufacturing 34MiscellaneousManufacturing 35NonmetallicMineralProductManufacturing 36ApparelandLeatherandAlliedProductManufacturing 37PrintingandRelatedSupportActivities 38OtherDurableGoodsManufacturing 39TransportationEquipmentManufacturing 40OtherNondurableGoodsManufacturing 41WoodProductManufacturing 42PetroleumandCoalProductsManufacturing 43FurnitureandRelatedProductManufacturing 44ChemicalManufacturing 45
VII. CONCLUSIONS 46

4|P a g e
EXECUTIVESUMMARY
TheNorthAmericanIndustryClassificationSystem(NAICS)defines472detailedmanufacturingindustriesatthe6‐digitlevel.Atthe3‐digitlevel,themanufacturingsectorincludes21industrygroups.Since some industry groupswere very small inHawaii, theywere combinedwith the “other” groupcategory.
ThetablebelowsummarizesjobsforeachoftherespectiveNAICS‐basedmanufacturingindustrygroupswithinthemanufacturingsector.Thetotalmanufacturingsectorhad18,767jobsand12industrygroupsin2015.
Fornondurablegoods,thefoodandbeverageandtobaccogrouphadthemostjobsin2015.The8,666jobsinthisgroupaccountedfor46.2percentofthetotalmanufacturingjobsin2015.Thetwonextlargestgroupsinthenondurablecategoryweretheapparelandleatherandalliedproductgroupandtheprintingandrelatedsupportactivities,eachofwhichhadmorethan1,100jobsin2015.Thetopgroupindurablegoodsmanufacturingismiscellaneousmanufacturing,withabout1,800jobsin2015,followedbynonmetallicmineralproductswithmorethan1,200jobsin2015.
TABLES‐1.CONDENSEDMANUFACTURINGINDUSTRYGROUPS
Hawaii’s manufacturing sector differs from the U.S. in the following ways: (1) Hawaii’smanufacturing is concentratedmore on nondurable goods,whileU.S.manufacturing is concentrated
Industry Group 2015 Jobs
% of Total
Manufacture
Jobs NAICS
2015
Earnings
Manufacturing 18,767 100.0 31 49,607
Durable Goods Manufacturing 6,014 32.0 54,913
Miscellaneous Manufacturing 1,785 9.5 339 36,432
Nonmetallic Mineral Product 1,260 6.7 327 68,057
Transportation Equipment 814 4.3 336 87,773
Wood Product 642 3.4 321 24,261
Furniture and Related Product 520 2.8 337 53,879
Other Durable Goods 993 5.3 331‐335 64,890
Nondurable Goods Manufacturing 12,753 68.0 47,112
Food and Beverage and Tobacco 8,666 46.2 311‐312 43,151
Apparel and Leather and Allied Product 1,236 6.6 315‐316 26,515
Printing and Related Support Activities 1,158 6.2 323 36,638
Petroleum and Coal Products 523 2.8 324 167,531
Chemical Manufacturing 429 2.3 325 58,852
Other Nondurable Goods 741 3.9 313‐314, 322, 326 52,318
Source: EMSI and DBEDT, READ.

P a g e |5
moreondurablegoods.68.0percentofHawaiimanufacturingworkersproducenondurablegoodsand32.0percentoftheworkersproducedurablegoods.Incontrast,amajorityofU.S.manufacturingisindurable goods, with 62.6 percent of U.S. manufacturingworkers producing durable goods and 37.4percentproducingnon‐durablegoods.(2)ManufacturingcomposesagreatershareoftheU.S.economythanthatofHawaii’seconomy. In2015,U.S.manufacturingcontributed12.2percentoftheU.S.GDP,whileHawaii’smanufacturingcontributed1.8percentof thestate’sGDP. (3)TheU.S.manufacturingindustry is more diversified than Hawaii’s manufacturing industry. The main categories for U.S.manufacturing are metal products, machinery, equipment, computers and electronic products, withthesecategoriesaccountingfor65.1percentofU.S.manufacturingrealGDP.PetroleumproductsandprocessedfoodarethemajorcategoriesforHawaii’smanufacturingindustry,accountingfor53.3percentofHawaii’smanufacturingrealGDP.(4)U.S.manufacturersarelargercompanies,withanaverageof38employees per establishment versus 20 employees per establishment for Hawaii. (5) Hawaiimanufactures pay more for materials than their U.S. counterparts. For Hawaii, 83.2 percent ofmanufacturing costs were for materials, while 71.4 percent of U.S. manufacturing costs were formaterials.(6)Onaverage,Hawaii’smanufacturingworkerswerepaidlessthanthenationalaverage.In2015, theaverageearnings forHawaii’smanufacturingworkerswas$49,607versus$76,657 forU.S.manufacturingworkers.
Between2005and2015,Hawaii’smanufacturingindustriesaddedonlyabout200jobs,whileHawaii’stotaleconomyaddedabout67,000jobs.Asaresult,themanufacturingsector’scontributiontoHawaii’semploymentdroppedfrom2.2percentin2005to2.1percentin2015.However,fiveoftheindustrygroupsshowedjobgrowthduringthepastdecade:transportationequipment,petroleumandcoalproducts,foodandbeverageandtobacco,otherdurablegoods,andnonmetallicmineralproduct.
From1998to2015,theshareofmanufacturingjobsintotaljobsdecreasedby0.5percentagepointinHawaii.Thedecreaseintheshareofmanufacturingjobswaspartiallyduetoincreasedlaborproductivity.Inotherwords,thedecreaseinthemanufacturingsector’sshareofrealGDPwaslessthantheshareofthetotaljobdecrease.ThiswastrueforbothHawaiiandthenation,especiallyforthenation.
LaborproductivityinHawaii’smanufacturingsector,especiallydurablegoods,waslowerthanthe overall productivity of all industries combined. However, the growth rate of themanufacturingsector’slaborproductivitywashigherthantheoverallproductivitygrowthrate.From1998to2015,allindustriescombined inHawaii increasedrealGDPper jobby12.0percent, from$70,266to$78,716.However,forHawaii’smanufacturingsector,realGDPperjobincreased24.2percent,from$51,935to$64,513duringthesameperiod.ForHawaii’sdurablegoodsmanufacturing,realGDPperjobincreased44.7percent,from$37,451to$54,194duringthesameperiod.
The next table shows how each of the respective NAICS‐based manufacturing groups was
classifiedonaperformancematrix.Basedonjobgrowthalone,nomanufacturingindustrygroupswerequalifiedashighperformingbase‐growth industriesor transitioning industries for the2005 to2015period. The industry groups in the emerging categorywere composedof transportationequipment,petroleumandcoalproducts(mostlypetroleum),foodandbeverageandtobacco,otherdurablegoods,and nonmetallic mineral product. These groups accounted for about 65.3 percent of the totalmanufacturingsectorjobsin2015.Thesevenmanufacturingindustrygroupsthatlostjobsinthe2005to2015periodfell intothedecliningquadrantoftheperformancemap. Thesegroupsaccountedforabout34.7percentoftotalmanufacturingsectorjobsin2015.Theearningsaverageofthemanufacturingindustrywas$49,607in2015,whichwaslowerthanthestatewideaverageof$52,156.

6|P a g e
TABLES‐2.MANUFACTURINGINDUSTRYGROUPSMAPPEDBYPERFORMANCE,2005‐2015
*NAdenotesnoindustrygroupsinthecategory
GroupChange
in Jobs
Average
EarningsGroup
Change in
Jobs
Average
Earnings
NA NA NA NA NA NA
GroupChange
in Jobs
Average
EarningsGroup
Change in
Jobs
Average
Earnings
Miscellaneous Manufacturing ‐8.5% $36,432 Transportation Equipment 41.9% $87,773
Apparel and Leather and Allied Product ‐14.0% $26,515 Petroleum and Coal Products 20.0% $167,531
Chemical Manufacturing ‐15.8% $58,852 Food and Beverage and Tobacco 17.1% $43,151
Printing and Related Support Activities ‐20.8% $36,638 Other Durable Goods 9.7% $64,890
Other Nondurable Goods ‐23.4% $52,318 Nonmetallic Mineral Product 3.3% $68,057
Wood Product ‐29.5% $24,261
Furniture and Related Product ‐30.2% $53,879
Declining Group: 34.7% of Jobs Emerging Group: 65.3% of Jobs
Total Jobs, 2015: 18,767
Average Annual Earnings, 2015: $49,607
Net Change in Jobs, 2005‐2015: 1.3%
Transitioning Group: 0.0% of Jobs Base‐Growth Group: 0.0% of Jobs

P a g e |7
I. INTRODUCTION
Themanufacturingsectorisadriverforexportactivities,thecreatorofbrandnames,thesourceforinnovation,thetestbedfortechnologyimprovement,andthecontributorforproductivitygrowth.However,manufacturinghasbeenadecliningindustryandthishasledtoeffortsaimedatrevitalizingthe manufacturing industry, both at the national and local levels. In the past few years, HawaiiLegislature introduced many bills with the goal of increasing manufacturing competitiveness andcreatingmorehighpayingjobs.
Inlookingattheglobaleconomy,alargeshareofmanufacturinghasshiftedfromthedevelopedcountriestothenewlyindustrializedcountriessuchasChina. Asaresult, themanufacturingsector’sshareof the totaleconomyhasdecreasedover timeinboththeU.S.andHawaii. ComparedwiththeoverallU.S.economy,Hawaii’smanufacturingindustryfacesadditionalchallengesincludinghighenergy,land,andmaterialcosts.AnotherchallengeforHawaii’seconomyishighshippingcostscoupledwithalimitedlocalsupplychain.Amajorityofrawmaterialsandpartsusedformanufacturingareimported,addingsubstantialcosttotheendproduct.
Inspiteofthesechallenges,thereareadvantagestodevelopingHawaii’smanufacturingindustryin certain areas. First, many of themanufacturing industry groups have above average wages andsalaries. This is especially true for thepetroleumrefining, transportationequipmentmanufacturing,chemicalmanufacturing,andnonmetallicmanufacturing.
Second,Hawaiihasavery largedefensesector. TheDepartmentofDefensespendsabout$2billion each year on prime contracts and equipment inHawaii. The proximity tomilitary bases andpersonnelisaninherentadvantagethatlocalmanufacturerscanleveragethroughcollaborations,justintimeinventory,andjointresearchanddevelopment.
Finally,perhapsHawaii’sbiggestadvantageformanufacturingisthatithasaglobalmarketof8.5millionpeoplethatvisitthestateeachyear.In2015,Hawaiivisitorsspent$15.2billiondollarsandthereistremendouspotentialforHawaiitomanufacturemoreproductstoservethetourismmarket.

8|P a g e
ResearchObjectives
This report analyzes the recent trend of Hawaii’s manufacturing sector, benchmarks theperformanceoftheindustrieswithinthesector,andidentifiespotentialchallengesandopportunitiesforthemanufacturingsectorgrowthinHawaii.Specifically,thisstudyhasfourresearchobjectives:
1)Tobenchmarkthestate’smanufacturingindustryasawhole.
2)TocompareHawaii’smanufacturing industryagainst theU.S. totalmanufacturing industryperformance. The report will compare the manufacturing’s relative productivity and coststructurebetweentheU.S.andHawaii.
3)Toexaminethemanufacturingindustryperformanceineachofthemanufacturingindustrygroups.
4)ToexaminethemanufacturingindustryperformanceineachofHawaii’sfourcounties.
DataSources
Therearethreemaindatasourcesusedinthisstudy.ThefirstistheU.S.BureauofEconomicAnalysis(BEA).TheBEAprovidesemployment,GDP,andrealGDPdatabythree‐digitNorthAmericanIndustryClassificationSystem(NAICS)codeforallU.S.states. It is importanttonotethattheperiodavailableforanalysisdependsonthetypeofdata.Forsixofthethree‐digitlevelNAICSindustries,theBEAdataareonlyavailableatthecombinedlevelofthreeindustries.TheemploymentdatafromtheBEAarecurrentlyavailablefrom1998to2015.TheGDPbyNAICSindustrydataareavailableatthetwo‐digitlevelfrom1997to2015andavailablefrom1997to2014atthethree‐digitlevel.
ThesecondsourceofdataistheEconomicModelingSpecialists,Inc.(EMSI).EMSIdataconsistprimarilyofjobsandlaborearningsthatareavailableannuallyatthesix‐digitNAICSlevel.1TheEMSIdataareavailableatboththestateandthecountylevel,butonlyavailablesince2001.
ThethirdsourceofdataistheU.S.CensusBureau.The2012EconomicCensus(EC)dataincludesdetailedstatisticsforthemanufactureindustrycosts.
1 The basic data are compiled by EconomicModeling Specialists, Inc. (EMSI) and processed byDBEDT. EMSIsupplementsdatafromtheFederalDepartmentsofLaborandCommercebyincludingestimatesofproprietorsandself‐employedjobs,andbyestimatingdataforverysmallindustriesthatarenotreportedbytheFederalagenciesduetodisclosureissues.

P a g e |9
Major Industry Groups of the Manufacturing Sector
The Manufacturing sector comprises establishments engaged in the mechanical, physical, orchemical transformation of materials, substances, or components into new products. The NorthAmericanIndustryClassificationSystem(NAICS)defines472detailedmanufacturingindustriesatthe6‐digitleveland21availableatthe3‐digitlevel:
311Foodmanufacturing
312Beverageandtobaccoproductmanufacturing
313Textilemills
314Textileproductmills
315Apparelmanufacturing
316Leatherandalliedproductmanufacturing
321Woodproductmanufacturing
322Papermanufacturing
323Printingandrelatedsupportactivities
324Petroleumandcoalproductmanufacturing
325Chemicalmanufacturing
326Plasticsandrubberproductmanufacturing
327Nonmetallicmineralproductmanufacturing
331Primarymetalmanufacturing
332Fabricatedmetalproductmanufacturing
333Machinerymanufacturing
334Computerandelectronicproductmanufacturing
335Electricalequipment,appliance,andcomponentmanufacturing
336Transportationequipmentmanufacturing
337Furnitureandrelatedproductmanufacturing
339Miscellaneousmanufacturing
Theaboveindustriesarefurtherclassifiedasdurablegoodsmanufacturingornondurablegoodsmanufacturing.Adurablegoodisagoodthatdoesnotquicklywearout,ormorespecifically,onethatcanbeusedrepeatedlyovertimeratherthanbeingcompletelyconsumedinoneuse.Nondurablegoodsmaybedefinedeitherasgoodsthatareimmediatelyconsumedinoneuseoronesthathavealifespanoflessthan3years.

10|P a g e
As shown in Table 1, the durable goodsmanufacturing includes 10 industry groups, and thenondurable goods manufacturing includes 8 industry groups. In 2015, the manufacturing sectoremployed 18,767 people in Hawaii, accounting for about 2.1 percent of total jobs. Durable goodsmanufacturinghadabout6,000jobs,accountingforabout0.7percentoftotaljobsinHawaii.Nondurablegoodsmanufacturinghadabout12,800 jobs,accountingforabout1.4percentof total jobs inHawaii.UsingEMSIdata,durableandnondurablegoodsmanufacturingcanbebrokendowninto18industrygroupslistedinTable1.
TABLE1.DETAILEDMANUFACTURINGINDUSTRYGROUPS
Industry Group 2015 Jobs
% in Total
Jobs NAICS
2015
Earnings
All Industry Total Jobs 896,608 100.00 52,156
Manufacturing 18,767 2.09 31 49,607
Durable Goods Manufacturing 6,014 0.67 54,913
Wood Product 642 0.07 321 24,261
Nonmetallic Mineral Product 1,260 0.14 327 68,057
Primary Metal 8 0.00 331 57,887
Fabricated Metal Product 511 0.06 332 66,631
Machinery 133 0.01 333 46,159
Computer and Electronic Product 286 0.03 334 75,739
Electrical Equipment and Appliance 54 0.01 335 41,318
Transportation Equipment 814 0.09 336 87,773
Furniture and Related Product 520 0.06 337 53,879
Miscellaneous Manufacturing 1,785 0.20 339 36,432
Nondurable Goods Manufacturing 12,753 1.42 47,112
Food and Beverage and Tobacco Product 8,666 0.97 311‐312 43,151
Textile Mills and Textile Product Mills 314 0.04 313‐314 41,692
Apparel and Leather and Allied Product 1,236 0.14 315‐316 26,515
Paper 84 0.01 322 68,170
Printing and Related Support Activities 1,158 0.13 323 36,638
Petroleum and Coal Products 523 0.06 324 167,531
Chemical 429 0.05 325 58,852
Plastics and Rubber Products 343 0.04 326 58,162
Source: EMSI and DBEDT, READ.

P a g e |11
Since some industry groups listed in Table 1were very small, theywere combinedwith the“other” group category. The five durable goods industry groups,withNAICS code 331 to 335werecombinedtotheotherdurablegoodsgroup.Thethreenondurablegoodsindustrygroups,withNAICScode313‐314,322,and326werecombinedtotheothernondurablegoodsgroup.AsshowninTable2,theotherdurablegoodscategoryaccountedforonly5.3percentoftotalmanufacturingjobsinHawaiiin2015,whileothernondurablegoodsaccountedforonly3.9percentoftotalmanufacturingjobsinHawaiiin2015.
TABLE2.CONDENSEDMANUFACTURINGINDUSTRYGROUPS
Industry Group 2015 Jobs
% of Total
Manufacture
Jobs NAICS
2015
Earnings
Manufacturing 18,767 100.0 31 49,607
Durable Goods Manufacturing 6,014 32.0 54,913
Miscellaneous Manufacturing 1,785 9.5 339 36,432
Nonmetallic Mineral Product 1,260 6.7 327 68,057
Transportation Equipment 814 4.3 336 87,773
Wood Product 642 3.4 321 24,261
Furniture and Related Product 520 2.8 337 53,879
Other Durable Goods 993 5.3 331‐335 64,890
Nondurable Goods Manufacturing 12,753 68.0 47,112
Food and Beverage and Tobacco 8,666 46.2 311‐312 43,151
Apparel and Leather and Allied Product 1,236 6.6 315‐316 26,515
Printing and Related Support Activities 1,158 6.2 323 36,638
Petroleum and Coal Products 523 2.8 324 167,531
Chemical Manufacturing 429 2.3 325 58,852
Other Nondurable Goods 741 3.9 313‐314, 322, 326 52,318
Source: EMSI and DBEDT, READ.

12|P a g e
II. COSTSTRUCTUREOFMANUFACTURINGSECTOR
Thissectiondescribesthecoststructureofthemanufacturingsector.RevenueandcostdataareonlyavailableeveryfiveyearsfromtheU.S.CensusBureau’sEconomicCensus.2012isthelatestyearwhendataareavailable.Duetothedatadisclosurerules,theCensusBureaudidnotreleasethedataforPetroleumindustryforHawaiisincethereareonlytworefineriesinthestate.
AccordingtoestimatebyDBEDT,about57percentofthesalesinHawaii’smanufacturingsector
in2012weregeneratedinthePetroleumindustry.Thepetroleumindustryimported$4.8billionworthofcrudeoilintothestateinthatyear.ThisbigamountofimportsalonemadeHawaii’smanufacturingsectorheavyrelianceonmaterials,comparedwiththeU.S.average.TheCensusdatarevealthattotalmanufacturingcostwascomposedof83.2percentmaterialcostsinHawaii;whileU.S.averagematerialcostwas71.4percentoftotalmanufacturingcost.
LaborcostinHawaii’smanufacturingsectorwaslowerthanthatoftheU.S.manufacturingsector.
7.4percentofthemanufacturingsector’stotalcostwasforlaborinHawaiiin2012,while16.2percentofthemanufacturingsectorcostwenttolaborfortheU.S.asawhole.ThiswasalsoanindicationthatHawaiimanufacturingworkersweregenerallypaidlessthantheirmainlandcounterparts.InvestmentinthemanufacturingsectorwasalsolowinHawaiiwithonlyabout1.3percentofthetotalmanufacturingcostforcapitalexpendituresinHawaiiversus3.5percentfortheU.S..
DespiteofHawaii’snotoriouslyhighrentalprices,percentageoftotalrentalpaymentsinHawaii’s
manufacturingsectorwasonlyslightlyhigherthanoftheU.S.manufacturingaverage(0.8percentforHawaii,0.7percentforU.S.average).

P a g e |13
TABLE3.COMPARISONOFMANUFACTURINGSECTOR’SCOSTS
HI above U.S.
HI U.S. HI U.S. Percentage Point
Total selected cost ($M) 8,102 4,740,301 100.0 100.0 0.0
Labor cost 603 769,610 7.4 16.2 ‐8.8
Total annual payroll 465 590,084 5.7 12.4 ‐6.7
Total fringe benefits 138 179,526 1.7 3.8 ‐2.1
Employer's cost for health insurance 52 71,262 0.6 1.5 ‐0.9
Employer's cost for defined benefit pension plans 16 16,106 0.2 0.3 ‐0.1
Employer's cost for defined contribution plans 13 18,825 0.2 0.4 ‐0.2
Employer's cost for other fringe benefits 56 73,333 0.7 1.5 ‐0.9
Total cost of materials 6,741 3,384,339 83.2 71.4 11.8
Materials, parts, containers, packaging, etc. used 5,975 3,076,382 73.7 64.9 8.8
Cost of resales 571 166,185 7.0 3.5 3.5
Cost of purchased fuels 121 34,556 1.5 0.7 0.8
Purchased electricity 44 50,587 0.5 1.1 ‐0.5
Contract work 30 56,628 0.4 1.2 ‐0.8
Changes in inventories 244 20,873 3.0 0.4 2.6
Total capital expenditures (new and used) 108 166,458 1.3 3.5 ‐2.2
Capital expenditures on buildings and other structures 13 33,065 0.2 0.7 ‐0.5
Capital expenditures on machinery and equipment 96 133,393 1.2 2.8 ‐1.6
On automobiles, trucks, etc. for highway use 6 3,347 0.1 0.1 0.0
On computers and peripheral data processing equ. 6 5,758 0.1 0.1 ‐0.1
On all other machinery and equipment 84 124,289 1.0 2.6 ‐1.6
Total rental payments 61 33,530 0.8 0.7 0.0
Buildings and other structures 47 23,392 0.6 0.5 0.1
Machinery and equipment 14 10,138 0.2 0.2 0.0
Total other expenses 346 365,491 4.3 7.7 ‐3.4
Temporary staff and leased employee expenses 21 30,931 0.3 0.7 ‐0.4
Expensed computer hardware and other equipment 1 3,658 0.0 0.1 ‐0.1
Expensed purchases of software 1 2,835 0.0 0.1 0.0
Data processing and other purchased computer services 6 6,288 0.1 0.1 ‐0.1
Communication services 3 4,344 0.0 0.1 ‐0.1
Repair and maintenance services of buildings & machinery 63 44,244 0.8 0.9 ‐0.2
Refuse removal (including hazardous waste) services 13 13,438 0.2 0.3 ‐0.1
Advertising and promotional services 13 13,265 0.2 0.3 ‐0.1
Purchased professional and technical services 15 29,713 0.2 0.6 ‐0.4
Taxes and license fees 28 17,129 0.3 0.4 0.0
All other expenses 182 199,645 2.2 4.2 ‐2.0
Source: U.S. Census Bureau and DBEDT, READ.
2012 % of Cost
14|P a g e
III. HISTORICALTRENDSOFTHEMANUFACTURINGSECTOR
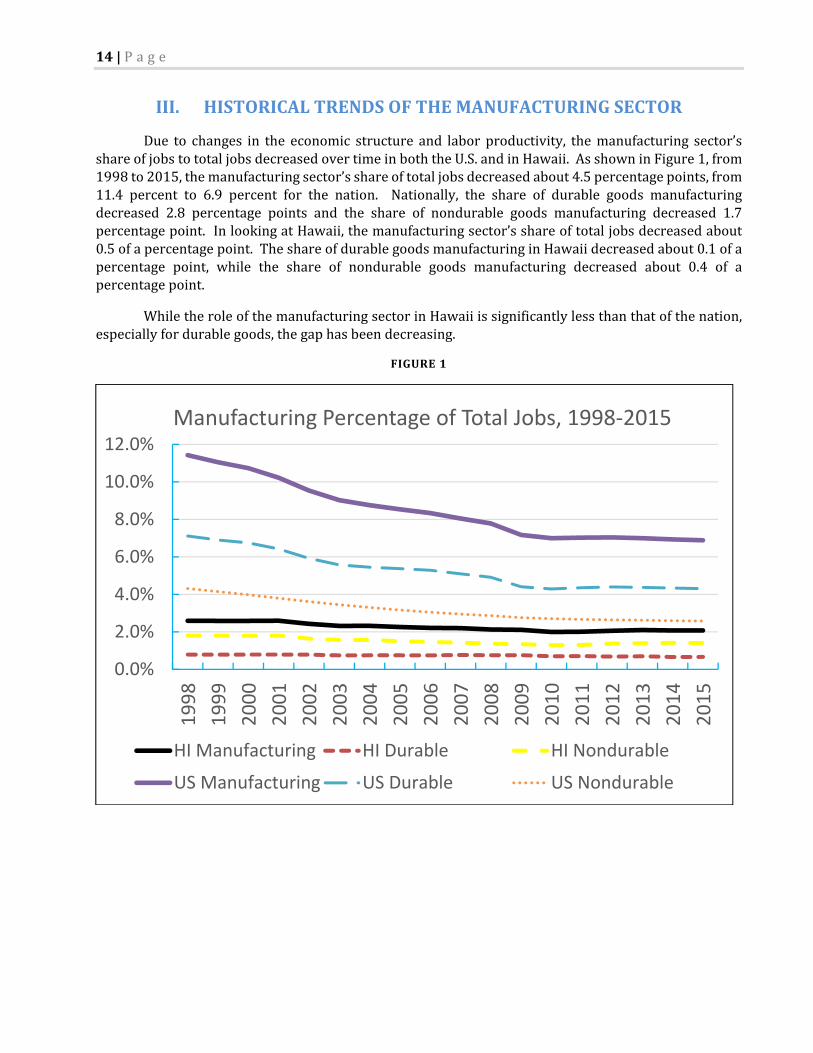
Due to changes in the economic structure and labor productivity, themanufacturing sector’sshareofjobstototaljobsdecreasedovertimeinboththeU.S.andinHawaii.AsshowninFigure1,from1998to2015,themanufacturingsector’sshareoftotaljobsdecreasedabout4.5percentagepoints,from11.4 percent to 6.9 percent for the nation. Nationally, the share of durable goods manufacturingdecreased 2.8 percentage points and the share of nondurable goods manufacturing decreased 1.7percentagepoint.InlookingatHawaii,themanufacturingsector’sshareoftotaljobsdecreasedabout0.5ofapercentagepoint.TheshareofdurablegoodsmanufacturinginHawaiidecreasedabout0.1ofapercentage point, while the share of nondurable goods manufacturing decreased about 0.4 of apercentagepoint.
WhiletheroleofthemanufacturingsectorinHawaiiissignificantlylessthanthatofthenation,especiallyfordurablegoods,thegaphasbeendecreasing.
FIGURE1
0.0%
2.0%
4.0%
6.0%
8.0%
10.0%
12.0%
1998
1999
2000
2001
2002
2003
2004
2005
2006
2007
2008
2009
2010
2011
2012
2013
2014
2015
Manufacturing Percentage of Total Jobs, 1998‐2015
HI Manufacturing HI Durable HI Nondurable
US Manufacturing US Durable US Nondurable

P a g e |15
Thedecreasedshareofmanufacturing jobswaspartiallydue to increased laborproductivity.ComparedwiththeU.S.productivity,improvementsinHawaii’smanufacturingsectorweresmaller.AsshowninFigure2,from1998to2015,themanufacturingsector’sshareofU.S.realGDPdecreased0.4ofa percentagepoint from12.3 percent to 11.9 percent; the share ofU.S. durable goods increased 1.1percentagepointsfrom5.8percentto6.9percent,andtheshareofU.S.nondurablegoodsdecreased1.7percentagepointsfrom6.8percentto5.1percent.
In looking at Hawaii, from 1998 to 2015, themanufacturing sector’s share of total real GDP
decreased0.22ofapercentagepointfrom1.9percentto1.7percent.Hawaii’sshareofdurablegoodsincreased0.04ofapercentagepointandtheshareofnondurablegoodsdecreased0.26ofapercentagepoint.
FIGURE2
0.0%
2.0%
4.0%
6.0%
8.0%
10.0%
12.0%
14.0%
1998
1999
2000
2001
2002
2003
2004
2005
2006
2007
2008
2009
2010
2011
2012
2013
2014
2015
Manufacturing Percentage of Total Real GDP, 1998‐2015
HI Manufacturing HI Durable HI Nondurable
US Manufacturing US Durable US Nondurable
16|P a g e
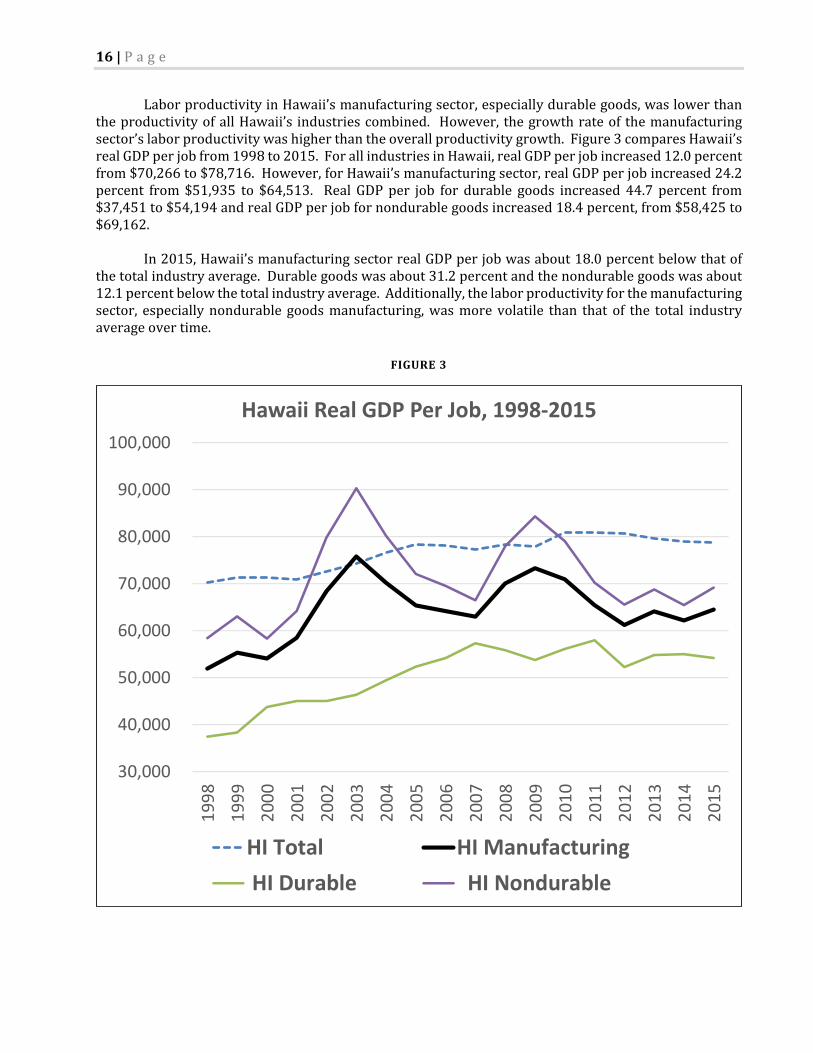
LaborproductivityinHawaii’smanufacturingsector,especiallydurablegoods,waslowerthantheproductivityofallHawaii’s industriescombined. However, thegrowthrateof themanufacturingsector’slaborproductivitywashigherthantheoverallproductivitygrowth.Figure3comparesHawaii’srealGDPperjobfrom1998to2015.ForallindustriesinHawaii,realGDPperjobincreased12.0percentfrom$70,266to$78,716.However,forHawaii’smanufacturingsector,realGDPperjobincreased24.2percent from $51,935 to $64,513. Real GDPper job for durable goods increased 44.7 percent from$37,451to$54,194andrealGDPperjobfornondurablegoodsincreased18.4percent,from$58,425to$69,162.
In2015,Hawaii’smanufacturingsectorrealGDPperjobwasabout18.0percentbelowthatof
thetotalindustryaverage.Durablegoodswasabout31.2percentandthenondurablegoodswasabout12.1percentbelowthetotalindustryaverage.Additionally,thelaborproductivityforthemanufacturingsector, especiallynondurable goodsmanufacturing,wasmore volatile than that of the total industryaverageovertime.
FIGURE3
30,000
40,000
50,000
60,000
70,000
80,000
90,000
100,000
1998
1999
2000
2001
2002
2003
2004
2005
2006
2007
2008
2009
2010
2011
2012
2013
2014
2015
Hawaii Real GDP Per Job, 1998‐2015
HI Total HI Manufacturing
HI Durable HI Nondurable
P a g e |17
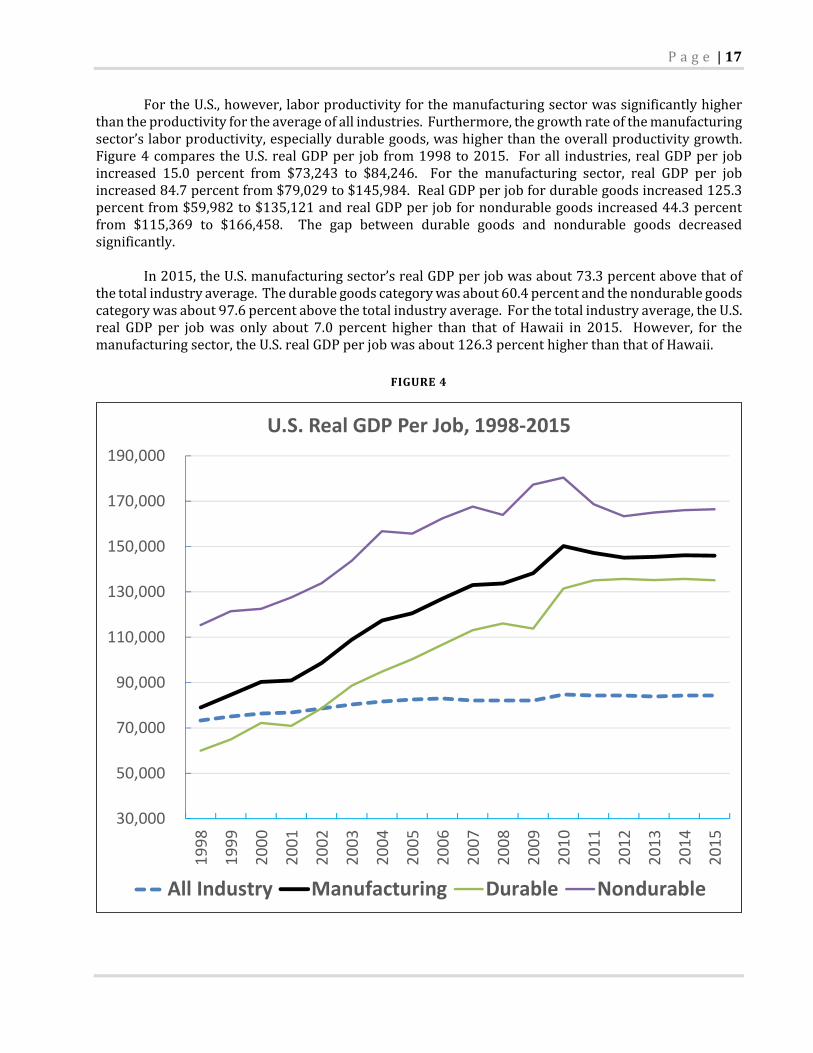
FortheU.S.,however,laborproductivityforthemanufacturingsectorwassignificantlyhigherthantheproductivityfortheaverageofallindustries.Furthermore,thegrowthrateofthemanufacturingsector’slaborproductivity,especiallydurablegoods,washigherthantheoverallproductivitygrowth.Figure4compares theU.S. realGDPper job from1998to2015. Forall industries, realGDPper jobincreased 15.0 percent from $73,243 to $84,246. For the manufacturing sector, real GDP per jobincreased84.7percentfrom$79,029to$145,984.RealGDPperjobfordurablegoodsincreased125.3percentfrom$59,982to$135,121andrealGDPperjobfornondurablegoodsincreased44.3percentfrom $115,369 to $166,458. The gap between durable goods and nondurable goods decreasedsignificantly.
In2015,theU.S.manufacturingsector’srealGDPperjobwasabout73.3percentabovethatof
thetotalindustryaverage.Thedurablegoodscategorywasabout60.4percentandthenondurablegoodscategorywasabout97.6percentabovethetotalindustryaverage.Forthetotalindustryaverage,theU.S.real GDP per jobwas only about 7.0 percent higher than that of Hawaii in 2015. However, for themanufacturingsector,theU.S.realGDPperjobwasabout126.3percenthigherthanthatofHawaii.
FIGURE4
30,000
50,000
70,000
90,000
110,000
130,000
150,000
170,000
190,000
1998
1999
2000
2001
2002
2003
2004
2005
2006
2007
2008
2009
2010
2011
2012
2013
2014
2015
U.S. Real GDP Per Job, 1998‐2015
All Industry Manufacturing Durable Nondurable

18|P a g e
IV. HAWAII’SMANUFACTURINGSECTORPORTFOLIO
As noted in the previous sections, themanufacturing sector data is categorized into durable
goodsmanufacturingandnondurablegoodsmanufacturing.Thedurablegoodsandnondurablegoodsbothinclude6industrygroups.Thissectionwillexaminetheperformanceofthe12industrygroupsinthemanufacturingsectorinHawaii.
ManufacturingSectorJobGrowth
From2005to2015,themanufacturingsector’sjobgrowthwaslowerthanthatoftheaveragejobgrowthforallHawaii’sindustriescombined(Figure5).Ofthe12manufacturingindustrygroups,sixshowednetjobgrowthovertheperiodandfourhadanaverageannualjobgrowthrateabovetheoverallstateaverageof0.8percent.Forthepurposeofthisanalysis,thegroupsthatexceededthestateaverageannual jobgrowthratewerecalledhighgrowth industrygroups. Transportationequipmenthad thehighestjobgrowth;followedbypetroleumandcoalproducts,foodandbeverageandtobacco,andotherdurablegoods.Themanufacturingsectoraddedonly0.1percentjobsperyearonaveragefrom2005to2015,durablegoodslost0.5percentperyear,butnondurablegoodsadded0.4percentperyear.
Source:DBEDTcompilationbasedonEMSIdata.
‐3.5%
‐3.4%
‐2.6%
‐2.3%
‐1.7%
‐1.5%
‐0.9%
‐0.5%
0.1%
0.3%
0.4%
0.8%
0.9%
1.6%
1.8%
3.6%
‐5.0% ‐3.0% ‐1.0% 1.0% 3.0% 5.0%
Furniture and Related Product
Wood Product
Other Nondurable Goods
Printing and Related Support Activities
Chemical Manufacturing
Apparel and Leather and Allied Product
Miscellaneous Manufacturing
Total Durable Goods
Total Manufacturing
Nonmetallic Mineral Product
Total Nondurable Goods
All Industry Total Job
Other Durable Goods
Food and Beverage and Tobacco
Petroleum and Coal Products
Transportation Equipment
MANUFACTURING SECTOR AVERAGE ANNUAL JOB GROWTH RATE, 2005‐2015
FIGURE5

P a g e |19
Whilethisstudyfocusesmoreon long‐termtrends, it is importanttoexaminehowjobs inthemanufacturing sector have been impacted by the recession. The manufacturing sector experiencedseverejoblossesfromtherecessionthatbeganinlate2007.Onlyfivemanufacturingindustrygroupshadpositivejobgrowthduringthe2007‐2015period.Thestrongestperformersduringthisperiodwerethefoodandbeverageandtobaccogroupandthetransportationequipmentgroup.
Thecategoryoffurnitureandrelatedproductexperiencedthemostsignificantjobslossduringthisperiod,followedbyothernondurablegoods,printingandrelatedsupportingactivity,woodproduct,miscellaneousmanufacturing,apparelandleatherandalliedproduct,nonmetallicmineralproduct,andchemicalmanufacturing.
Source:DBEDTcompilationbasedonEMSIdata.
‐5.1%
‐2.8%
‐2.6%
‐2.6%
‐2.4%
‐1.8%
‐1.5%
‐0.8%
‐0.8%
‐0.3%
0.3%
0.4%
0.7%
0.7%
1.4%
1.6%
‐6.5% ‐4.5% ‐2.5% ‐0.5% 1.5%
Furniture and Related Product
Other Nondurable Goods
Printing and Related Support Activities
Wood Product
Miscellaneous Manufacturing
Apparel and Leather and Allied Product
Total Durable Goods
Nonmetallic Mineral Product
Chemical Manufacturing
Total Manufacturing
All Industry Total Job
Total Nondurable Goods
Other Durable Goods
Petroleum and Coal Products
Transportation Equipment
Food and Beverage and Tobacco
MANUFACTURING SECTOR AVERAGE ANNUAL JOB GROWTH RATE, 2007‐2015
FIGURE6

20|P a g e
TABLE4.STATEOFHAWAIIMANUFACTURINGINDUSTRYJOBS
Source:DBEDTcompilationbasedonEMSIdata.
2005 2007 2014 2015 2005‐2007 2007‐2015 2014‐2015 2005‐2015
Transportation Equipment Emerging 574 731 760 814 12.9% 1.4% 7.1% 3.6%
Nonmetallic Mineral Product Emerging 1,219 1,347 1,212 1,260 5.1% ‐0.8% 4.0% 0.3%
Petroleum and Coal Products Emerging 436 494 493 523 6.4% 0.7% 6.1% 1.8%
Other Durable Goods Emerging 905 941 963 993 2.0% 0.7% 3.1% 0.9%
Food and Beverage and Tobacco Emerging 7,403 7,641 8,488 8,666 1.6% 1.6% 2.1% 1.6%
Miscellaneous Manufacturing Declining 1,951 2,170 1,830 1,785 5.5% ‐2.4% ‐2.4% ‐0.9%
Apparel and Leather and Allied Product Declining 1,437 1,431 1,209 1,236 ‐0.2% ‐1.8% 2.2% ‐1.5%
Chemical Manufacturing Declining 509 456 482 429 ‐5.4% ‐0.8% ‐11.1% ‐1.7%
Printing and Related Support Activities Declining 1,463 1,435 1,182 1,158 ‐0.9% ‐2.6% ‐2.1% ‐2.3%
Other Nondurable Goods Declining 967 929 697 741 ‐2.0% ‐2.8% 6.4% ‐2.6%
Wood Product Declining 911 792 622 642 ‐6.7% ‐2.6% 3.2% ‐3.4%
Furniture and Related Product Declining 745 791 519 520 3.1% ‐5.1% 0.1% ‐3.5%
Total Manufacturing Emerging 18,519 19,158 18,457 18,767 1.7% ‐0.3% 1.7% 0.1%
Industry GroupPerformance Class
Jobs Average Annual Job Growth (%)

P a g e |21
NationalCompetitivenessoftheManufacturingSector
Another measure that can help shed light on the manufacturing sector is the performancecomparedwiththenationalindustryaverageforeachgroup.IfaHawaiimanufacturingindustrygrouphasanaverageannualgrowthratethatishigherthanthenationalaverageforthesamegroup,thentheHawaiigroupiseffectivelyincreasingitscompetitiveshareofthetotalnationalindustry.Conversely,ifHawaii’sgrowthrateforarespectiveindustrygroupislessthanthenationalaverage,thentheHawaiigroupiseffectivelydecreasingitscompetitiveshareofthetotalnationalindustry.Figure7showshowmuchmoreorlessHawaii’smanufacturingindustriesgrewperyearonaveragecomparedwiththesameindustriesnationally.Forinstance,overthe2005to2015period,jobsinthetransportationequipmentindustrygroupgrewat anaverageannual rate thatwas4.6percenthigher inHawaii than the sameindustrynationwide.Thus,Hawaii’stransportationequipmentindustrygroupincreaseditscompetitivenationalindustryshare.Ontheotherhand,chemicalmanufacturinglostnationalindustryshareduetoanaverageannualgrowthratethatwas1.1percentbelowthenationalindustrygrowthrate.
Source:DBEDTcompilationbasedonEMSIdata.
‐1.1%
‐0.6%
‐0.1%
0.0%
0.1%
0.2%
0.6%
0.8%
1.3%
1.8%
2.0%
2.1%
2.4%
4.6%
‐2.0% ‐1.0% 0.0% 1.0% 2.0% 3.0% 4.0% 5.0% 6.0%
Chemical Manufacturing
Miscellaneous Manufacturing
All Industry Total
Other Nondurable Goods
Wood Product
Furniture and Related Product
Printing and Related Support Activities
Food and Beverage and Tobacco
Total Manufacturing
Other Durable Goods
Petroleum and Coal Products
Apparel and Leather and Allied Product
Nonmetallic Mineral Product
Transportation Equipment
GAIN OR LOSS OF NATIONAL COMPETITIVE INDUSTRY SHARE, 2005‐2015
Gaining national competitive share
Losing national competitive share
FIGURE7

22|P a g e
Of the 12 industry groups in the manufacturing sector, only three groups lost nationalcompetitive shareover the2005‐2015period. Industries thathavebothpositive jobgrowthandanincreaseincompetitivenationalindustryshare,representthebestperformingindustrygroupsoveragivenperiodoftime.Industrygroupswiththehighercompetitivesharemetricareprobablyshowingahighercomparativeadvantagecomparedwith thenational industry. InHawaii, thesegroups includetransportationequipment,nonmetallicmineralproduct,petroleummanufacturing,otherdurablegoods,andfoodandbeverageandtobacco.
IndustryConcentration–Hawaii’sManufacturingSpecialties
Athirdperformancemetricthathelpsintheevaluationofthemanufacturingindustryportfolioisindustry job concentration (Figure8). This is ameasureof the state’s levelof specialization in eachrespectiveindustryandhelpsshedlightontheindustries’exportpotential.
Source:DBEDTcompilationbasedonEMSIdata.
FIGURE8

P a g e |23
Export activity brings newmoney into the state and is a basis for long‐term industry growth.Unfortunately,estimatesofindustryexportsarenotpartofstandardindustrydataprograms.Thus,itisnotclearhowmuchoutputinagivenmanufacturingindustryisexported.
However,itispossibletoidentifyindustriesthatarelikelyexportbymeasuringtheconcentrationof their employment in the state’s economy. As explained above, an industry that employs ahigherproportionofjobsinHawaiithanthesameindustrynationally,isrelativelymoreconcentratedandismorelikelytobeexportingsomeofitsoutput.
IndustryconcentrationismeasuredbyametriccalledtheLocationQuotientorLQforshort.TheLQforanindustryatthestatelevelthatisequaltotheU.S.levelis1.0. HawaiiindustrieswithanLQmeasureofmorethan1.0aremoreconcentratedinthestateeconomythanthesameindustryfortheU.S.asawhole.Conversely,thoseindustriesthatarebelow1.0arelessconcentratedinstateeconomythantheU.S.aswhole.
Of the12 industrygroups in themanufacturingsector,only theappareland leatherandalliedproductindustrygrouphadaconcentrationlevelinHawaii’seconomythatwashigherthanthesameindustrynationally.IndustriesthatarelessconcentratedinHawaiimayalsobeexportingsomeoftheiroutput.However,amajorityoftheoutputisprobablyservinglocaldemand.
PerformanceMapFramework:IdentifyingEmergingManufacturingIndustries
Aframeworktobetterunderstandtheoverallimplicationsofthesekeyperformancemetricsisthe performance map adapted from the industry life cycle model. The performance map breaksindustriesintheeconomyintofourgeneralizedstagesoflife,startingwithanemergingphase,movingtoabase‐growthindustryphase,followedbyamatureortransitioningphaseandfinallyadecliningphase.Ofcourse,notallindustriesfitnicelyintothisnotion,especiallyovershortperiodsoftime.However,with some qualifications, this notion of development stages can help us evaluate the status of themanufacturingindustryportfolio.
UsingthethreeperformancemetricsfromFigures5,7and8,themanufacturingindustrygroupscan be placed into one of four life‐cycle quadrants according to the criteria shown in Table 5 anddescribedbelow.
TABLE5.PERFORMANCEMAPCRITERIA
TRANSITIONING BASE‐GROWTH
Positivejobgrowth Positivejobgrowth
Losingcompetitivenationalindustryshare Highlyconcentratedintheeconomy
Increasingcompetitivenationalindustryshare
DECLINING EMERGING
Positivejobgrowth
Currentlowconcentrationintheeconomy
Increasingcompetitivenationalindustryshare
Losingjobsoverperiod

24|P a g e
EmergingQuadrant:Theseareindustriesthatarepotentiallyintheearly,take‐offstage. Theyhavebeenperformingwell by showingboth job growthandan increase in their competitive shareof thenationalindustry.However,theseindustrieshaveyettoachieveaconcentrationinthestate’seconomyequaltothesameindustryfortheU.S.asawhole.Anemergingmanufacturingindustryisonethathasfoundacompetitivenicheintheeconomyandisgainingincompetitivenationalindustryshare.Atsomepoint, if the process continues, the industry’s concentration will exceed the national level and theemergingindustrywillgraduatetoabase‐growthindustryinthestate’seconomy.
Base‐GrowthQuadrant:Theseareindustriesthathavebecomepotentialeconomicdrivers.Theyaregrowingtheirjobcountsandareincreasingtheircompetitivenationalindustryshare.Moreover,theyhaveexceededthenationallevelofindustryconcentrationintheeconomyandareprobablyexportingatleastaproportionoftheiroutput.
TransitioningQuadrant:Transitioningmanufacturingindustriesarestillmaintainingorgrowingtheirworkforce,howevertheyarelosingcompetitivenationalindustryshare(growingmoreslowlythanthesameindustrynationally).Thisistypicalofmatureindustriesthatarestillimportanttotheeconomybutarehavingdifficultymaintainingnationalmarketshare.Theyareconsideredtransitioningbecausethey could either continue to lose industry share and eventually fall into decline, or reinvigoratethemselves andbegin to regain industry share and continue growing. Also in this quadrantmaybeformeremergingindustriesthatneverreachedbase‐growthstatusbeforelosingcompetitivenationalindustryshareandsomepreviouslydecliningindustriesthatarefightingbackintocompetitiveness.
DecliningQuadrant: Thedecliningquadrant contains industry groups showing job losses over theperiod. Allof thesemanufacturing industrygroupshave lost jobs tosomeextentbetween2005and2015.Mostindustriesthatarelosingjobsarealsolosingcompetitivenationalindustryshare.However,whiletheyaredeclininginjobsfortheperiod,theseindustriesarenotnecessarilydyingindustries.AnumberoftemporarycircumstancesmayhaveputsomeofHawaii’smanufacturingindustriesintothedecliningquadrantfortheperiodstudied.Theirappearanceinthedecliningquadrantisaredflagthatwarrantsmorecarefulanalysistounderstandtheproblem.
Itshouldbeemphasizedthattheperformancemapframeworkismoreofaguidetounderstandanindustry’ssituationratherthanaconclusionaboutthevalueoftheindustrytothestate.Itprovidesastartingpointforassessingthestrengthsandweaknessesoftheindustriesintheportfolio.Also,itisimportanttonotethat,withinindustriesthatareexperiencingmixedorpoorperformance,theremaybepocketsofverysuccessfulfirms.
P a g e |25
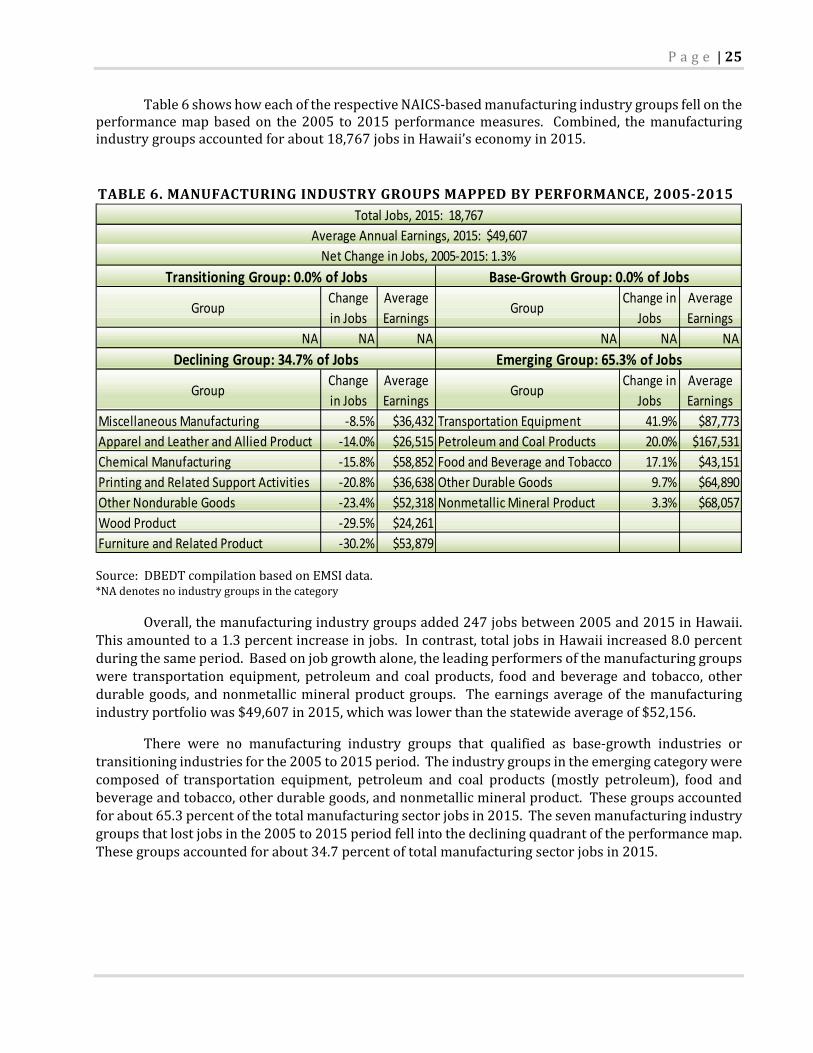
Table6showshoweachoftherespectiveNAICS‐basedmanufacturingindustrygroupsfellontheperformancemapbasedon the2005 to2015performancemeasures. Combined, themanufacturingindustrygroupsaccountedforabout18,767jobsinHawaii’seconomyin2015.
Source:DBEDTcompilationbasedonEMSIdata.*NAdenotesnoindustrygroupsinthecategory
Overall,themanufacturingindustrygroupsadded247jobsbetween2005and2015inHawaii.Thisamountedtoa1.3percentincreaseinjobs.Incontrast,totaljobsinHawaiiincreased8.0percentduringthesameperiod.Basedonjobgrowthalone,theleadingperformersofthemanufacturinggroupswere transportation equipment, petroleumand coal products, food andbeverage and tobacco, otherdurablegoods,andnonmetallicmineralproductgroups. Theearningsaverageof themanufacturingindustryportfoliowas$49,607in2015,whichwaslowerthanthestatewideaverageof$52,156.
There were no manufacturing industry groups that qualified as base‐growth industries ortransitioningindustriesforthe2005to2015period.Theindustrygroupsintheemergingcategorywerecomposed of transportation equipment, petroleum and coal products (mostly petroleum), food andbeverageandtobacco,otherdurablegoods,andnonmetallicmineralproduct.Thesegroupsaccountedforabout65.3percentofthetotalmanufacturingsectorjobsin2015.Thesevenmanufacturingindustrygroupsthatlostjobsinthe2005to2015periodfellintothedecliningquadrantoftheperformancemap.Thesegroupsaccountedforabout34.7percentoftotalmanufacturingsectorjobsin2015.
GroupChange
in Jobs
Average
EarningsGroup
Change in
Jobs
Average
Earnings
NA NA NA NA NA NA
GroupChange
in Jobs
Average
EarningsGroup
Change in
Jobs
Average
Earnings
Miscellaneous Manufacturing ‐8.5% $36,432 Transportation Equipment 41.9% $87,773
Apparel and Leather and Allied Product ‐14.0% $26,515 Petroleum and Coal Products 20.0% $167,531
Chemical Manufacturing ‐15.8% $58,852 Food and Beverage and Tobacco 17.1% $43,151
Printing and Related Support Activities ‐20.8% $36,638 Other Durable Goods 9.7% $64,890
Other Nondurable Goods ‐23.4% $52,318 Nonmetallic Mineral Product 3.3% $68,057
Wood Product ‐29.5% $24,261
Furniture and Related Product ‐30.2% $53,879
Declining Group: 34.7% of Jobs Emerging Group: 65.3% of Jobs
Total Jobs, 2015: 18,767
Average Annual Earnings, 2015: $49,607
Net Change in Jobs, 2005‐2015: 1.3%
Transitioning Group: 0.0% of Jobs Base‐Growth Group: 0.0% of Jobs
TABLE6.MANUFACTURINGINDUSTRYGROUPSMAPPEDBYPERFORMANCE,2005‐2015

26|P a g e
V. MANUFACTURINGINDUSTRYPERFORMANCEBYCOUNTYThe following tables summarize the 2005 to 2015 county performance of the statewide
manufacturing industries (paid employment and self‐employed/sole proprietors). Performance hasbeenorganizedbyBestPerformingTargets(registeringasbase‐growth&emergingindustrygroups)andOtherTargetedIndustryPerformance(thosethatfellintothetransitioninganddecliningcategories).
City&CountyofHonolulu
Honoluluaccountedfor13,870ofthestate’smanufacturingindustryjobsin2015,a0.1percentaverageannualgrowthfrom2005to2015.Theaverageannualjobgrowthratewas1.4percentfrom2005to2007,andwasnegative0.2percentfrom2007to2015.AsshowninTable7,fivemanufacturingindustry groups were in the high performing quadrant in the 2005 to 2015 period. These highperforminggroupsnotonlygrewjobsduringtheperiod,butalsoincreasedtheircompetitiveshareoftheactivitybyexceedingthenationalgrowthratefortheindustry.Theseincludedpetroleumandcoalproducts,foodandbeverageandtobacco,nonmetallicmineralproduct,transportationequipment,andotherdurablegoods.SevenmanufacturingindustrygroupslostjobsinHonoluluCountyoverthe2005to2015period. Apparelandleatherandalliedproductlostthemostjobs,followedbymiscellaneousmanufacturing,printingandrelatedsupportactivities,furnitureandrelatedproducts,othernondurablegoods,woodproduct,andchemicalmanufacturing.
TABLE7.MANUFACTURINGINDUSTRYJOBS,HONOLULU
Source:DBEDTcompilationbasedonEMSIdata.
2005 2007 2014 2015 2005‐2007 2007‐2015 2014‐2015 2005‐2015
Petroleum and Coal Products Base‐Growth 434 494 491 517 6.7% 0.6% 5.2% 1.8%
Food and Beverage and Tobacco Emerging 5,194 5,315 6,198 6,296 1.2% 2.1% 1.6% 1.9%
Nonmetallic Mineral Product Emerging 718 789 719 745 4.8% ‐0.7% 3.7% 0.4%
Transportation Equipment Emerging 537 697 746 796 13.9% 1.7% 6.8% 4.0%
Other Durable Goods Emerging 698 728 757 775 2.1% 0.8% 2.4% 1.0%
Chemical Manufacturing Declining 291 273 246 276 ‐3.2% 0.1% 12.4% ‐0.5%
Miscellaneous Manufacturing Declining 1,544 1,625 1,308 1,267 2.6% ‐3.1% ‐3.1% ‐2.0%
Apparel and Leather and Allied Product Declining 1,314 1,277 1,012 1,036 ‐1.4% ‐2.6% 2.4% ‐2.3%
Printing and Related Support Activities Declining 1,157 1,146 907 884 ‐0.5% ‐3.2% ‐2.6% ‐2.7%
Other Nondurable Goods Declining 874 842 625 663 ‐1.8% ‐2.9% 6.2% ‐2.7%
Wood Product Declining 446 425 286 294 ‐2.4% ‐4.5% 3.0% ‐4.1%
Furniture and Related Product Declining 542 533 320 319 ‐0.8% ‐6.2% ‐0.5% ‐5.2%
Total Manufacturing Emerging 13,749 14,144 13,614 13,870 1.4% ‐0.2% 1.9% 0.1%
Industry Group Performance
Class
Jobs Average Annual Job Growth (%)

P a g e |27
ThecomparisonsofHonoluluCounty’smanufacturingindustryjobsandearningsgrowthwiththestateandnationarelistedinTable8.Forjobgrowth,HonoluluCounty’s0.1percentannualgrowthratewasthesameasthestate’sgrowthratebutwasbetterthanthenationalaverageofnegative1.2percent.Foraverageearnings,HonoluluCountywashigherthanthestate,butlowerthanthenationalaverage.
TABLE8.HONOLULUCOUNTYMANUFACTURINGINDUSTRYPERFORMANCECOMPAREDWITHSTATEANDNATION,2005‐2015
Source:DBEDTcompilationbasedonEMSIdata.
HawaiiCounty
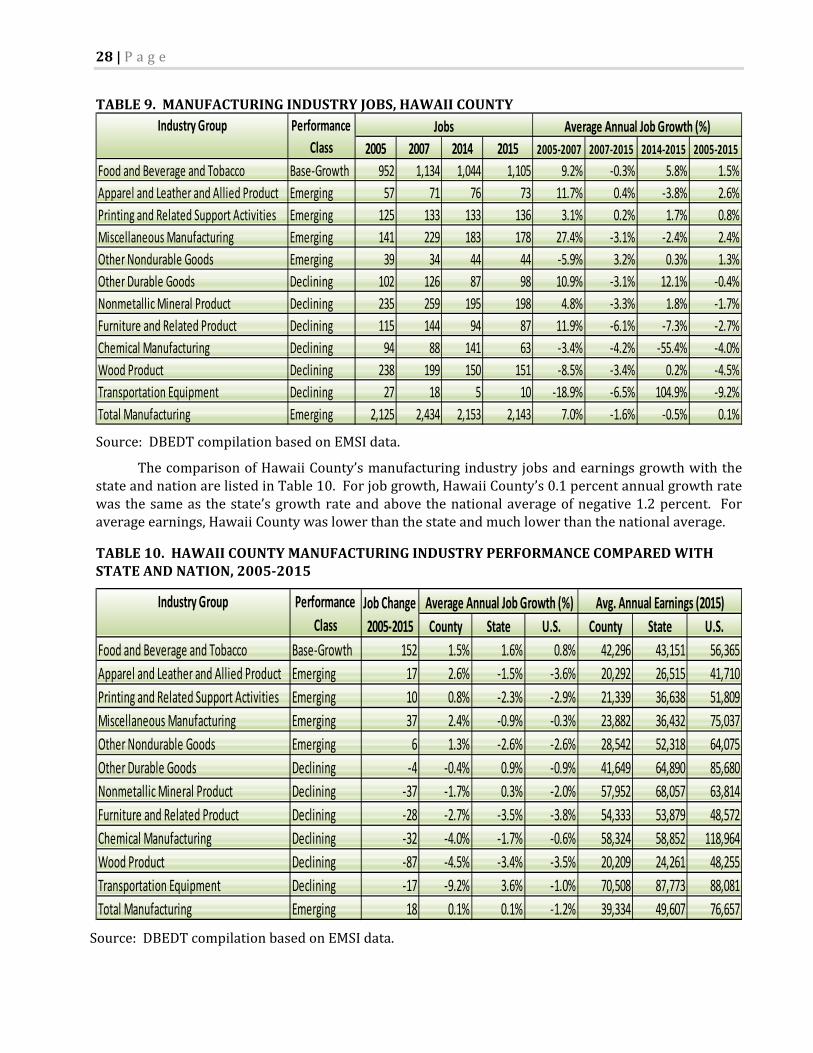
Hawaii County accounted for 2,143 of the state’smanufacturing jobs in 2015, a 0.1 percentaverageannualincreasefrom2005to2015.Theaverageannualjobgrowthratewas7.0percentfrom2005 to 2007. However, since the recession began at the end of 2007, manufacturing job growthdeclined.Ofthe12manufacturingindustrygroupsdefined,only11groupshadjobsinHawaiiCountyin2015.AsshowninTable9,fivemanufacturingindustrygroupswerehighperforminginHawaiiCountyduringthe2005to2015period.Theseincludedfoodandbeverageandtobacco,apparelandleatherandallied product, printing and related support activities, miscellaneous manufacturing, and othernondurablegoods. Sixmanufacturing industrygroups lost jobs inHawaiiCountyduringthe2005to2015period. Woodproducts lost themost jobs, followed bynonmetallicmineral product, chemicalmanufacturing,furnitureandrelatedproduct,transportationequipment,andotherdurablegoods.
Average Annual Job Growth (%)
County State U.S. County State U.S.
Petroleum and Coal Products Base‐Growth 83 1.8% 1.8% ‐0.2% 168,564 167,531 165,867
Food and Beverage and Tobacco Emerging 1,102 1.9% 1.6% 0.8% 114,937 43,151 56,365
Nonmetallic Mineral Product Emerging 27 0.4% 0.3% ‐2.0% 72,999 68,057 63,814
Transportation Equipment Emerging 259 4.0% 3.6% ‐1.0% 88,598 87,773 88,081
Other Durable Goods Emerging 76 1.0% 0.9% ‐0.9% 69,686 64,890 85,680
Chemical Manufacturing Declining ‐15 ‐0.5% ‐1.7% ‐0.6% 61,576 58,852 118,964
Miscellaneous Manufacturing Declining ‐277 ‐2.0% ‐0.9% ‐0.3% 40,217 36,432 75,037
Apparel and Leather and Allied Product Declining ‐278 ‐2.3% ‐1.5% ‐3.6% 54,686 26,515 41,710
Printing and Related Support Activities Declining ‐273 ‐2.7% ‐2.3% ‐2.9% 39,296 36,638 51,809
Other Nondurable Goods Declining ‐211 ‐2.7% ‐2.6% ‐2.6% 52,945 52,318 64,075
Wood Product Declining ‐152 ‐4.1% ‐3.4% ‐3.5% 25,085 24,261 48,255
Furniture and Related Product Declining ‐223 ‐5.2% ‐3.5% ‐3.8% 55,361 53,879 48,572
Total Manufacturing Emerging 121 0.1% 0.1% ‐1.2% 52,730 49,607 76,657
Job Change
2005‐2015
Avg. Annual Earnings (2015)Industry Group Performance
Class
28|P a g e
TABLE9.MANUFACTURINGINDUSTRYJOBS,HAWAIICOUNTY
Source:DBEDTcompilationbasedonEMSIdata.
ThecomparisonofHawaiiCounty’smanufacturingindustryjobsandearningsgrowthwiththestateandnationarelistedinTable10.Forjobgrowth,HawaiiCounty’s0.1percentannualgrowthratewasthesameas thestate’sgrowthrateandabovethenationalaverageofnegative1.2percent. Foraverageearnings,HawaiiCountywaslowerthanthestateandmuchlowerthanthenationalaverage.
TABLE10.HAWAIICOUNTYMANUFACTURINGINDUSTRYPERFORMANCECOMPAREDWITHSTATEANDNATION,2005‐2015
Source:DBEDTcompilationbasedonEMSIdata.
2005 2007 2014 2015 2005‐2007 2007‐2015 2014‐2015 2005‐2015
Food and Beverage and Tobacco Base‐Growth 952 1,134 1,044 1,105 9.2% ‐0.3% 5.8% 1.5%
Apparel and Leather and Allied Product Emerging 57 71 76 73 11.7% 0.4% ‐3.8% 2.6%
Printing and Related Support Activities Emerging 125 133 133 136 3.1% 0.2% 1.7% 0.8%
Miscellaneous Manufacturing Emerging 141 229 183 178 27.4% ‐3.1% ‐2.4% 2.4%
Other Nondurable Goods Emerging 39 34 44 44 ‐5.9% 3.2% 0.3% 1.3%
Other Durable Goods Declining 102 126 87 98 10.9% ‐3.1% 12.1% ‐0.4%
Nonmetallic Mineral Product Declining 235 259 195 198 4.8% ‐3.3% 1.8% ‐1.7%
Furniture and Related Product Declining 115 144 94 87 11.9% ‐6.1% ‐7.3% ‐2.7%
Chemical Manufacturing Declining 94 88 141 63 ‐3.4% ‐4.2% ‐55.4% ‐4.0%
Wood Product Declining 238 199 150 151 ‐8.5% ‐3.4% 0.2% ‐4.5%
Transportation Equipment Declining 27 18 5 10 ‐18.9% ‐6.5% 104.9% ‐9.2%
Total Manufacturing Emerging 2,125 2,434 2,153 2,143 7.0% ‐1.6% ‐0.5% 0.1%
Industry Group Performance
Class
Jobs Average Annual Job Growth (%)
Average Annual Job Growth (%)
County State U.S. County State U.S.
Food and Beverage and Tobacco Base‐Growth 152 1.5% 1.6% 0.8% 42,296 43,151 56,365
Apparel and Leather and Allied Product Emerging 17 2.6% ‐1.5% ‐3.6% 20,292 26,515 41,710
Printing and Related Support Activities Emerging 10 0.8% ‐2.3% ‐2.9% 21,339 36,638 51,809
Miscellaneous Manufacturing Emerging 37 2.4% ‐0.9% ‐0.3% 23,882 36,432 75,037
Other Nondurable Goods Emerging 6 1.3% ‐2.6% ‐2.6% 28,542 52,318 64,075
Other Durable Goods Declining ‐4 ‐0.4% 0.9% ‐0.9% 41,649 64,890 85,680
Nonmetallic Mineral Product Declining ‐37 ‐1.7% 0.3% ‐2.0% 57,952 68,057 63,814
Furniture and Related Product Declining ‐28 ‐2.7% ‐3.5% ‐3.8% 54,333 53,879 48,572
Chemical Manufacturing Declining ‐32 ‐4.0% ‐1.7% ‐0.6% 58,324 58,852 118,964
Wood Product Declining ‐87 ‐4.5% ‐3.4% ‐3.5% 20,209 24,261 48,255
Transportation Equipment Declining ‐17 ‐9.2% 3.6% ‐1.0% 70,508 87,773 88,081
Total Manufacturing Emerging 18 0.1% 0.1% ‐1.2% 39,334 49,607 76,657
Job Change
2005‐2015
Avg. Annual Earnings (2015)Industry Group Performance
Class
P a g e |29
MauiCounty
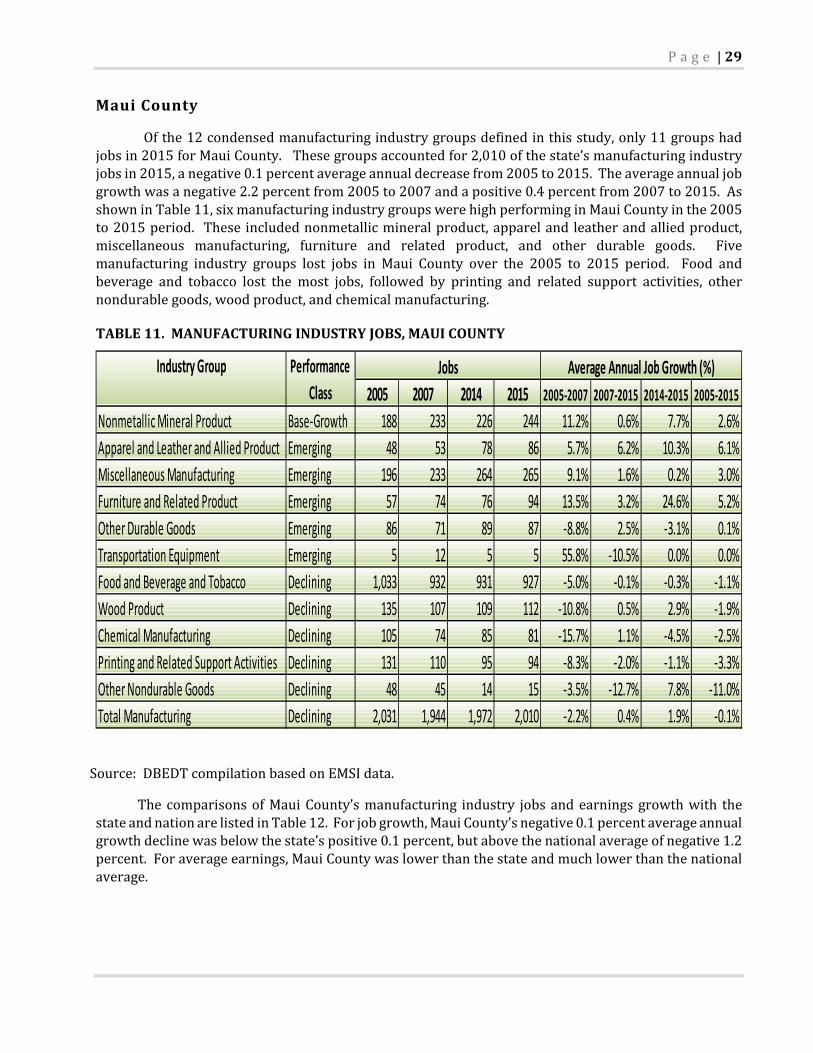
Ofthe12condensedmanufacturingindustrygroupsdefinedinthisstudy,only11groupshadjobsin2015forMauiCounty.Thesegroupsaccountedfor2,010ofthestate’smanufacturingindustryjobsin2015,anegative0.1percentaverageannualdecreasefrom2005to2015.Theaverageannualjobgrowthwasanegative2.2percentfrom2005to2007andapositive0.4percentfrom2007to2015.AsshowninTable11,sixmanufacturingindustrygroupswerehighperforminginMauiCountyinthe2005to2015period. Theseincludednonmetallicmineralproduct,apparelandleatherandalliedproduct,miscellaneous manufacturing, furniture and related product, and other durable goods. Fivemanufacturing industry groups lost jobs in Maui County over the 2005 to 2015 period. Food andbeverage and tobacco lost the most jobs, followed by printing and related support activities, othernondurablegoods,woodproduct,andchemicalmanufacturing.
TABLE11.MANUFACTURINGINDUSTRYJOBS,MAUICOUNTY
Source:DBEDTcompilationbasedonEMSIdata.
ThecomparisonsofMauiCounty’smanufacturing industry jobsandearningsgrowthwith thestateandnationarelistedinTable12.Forjobgrowth,MauiCounty’snegative0.1percentaverageannualgrowthdeclinewasbelowthestate’spositive0.1percent,butabovethenationalaverageofnegative1.2percent.Foraverageearnings,MauiCountywaslowerthanthestateandmuchlowerthanthenationalaverage.
2005 2007 2014 2015 2005‐2007 2007‐2015 2014‐2015 2005‐2015
Nonmetallic Mineral Product Base‐Growth 188 233 226 244 11.2% 0.6% 7.7% 2.6%
Apparel and Leather and Allied Product Emerging 48 53 78 86 5.7% 6.2% 10.3% 6.1%
Miscellaneous Manufacturing Emerging 196 233 264 265 9.1% 1.6% 0.2% 3.0%
Furniture and Related Product Emerging 57 74 76 94 13.5% 3.2% 24.6% 5.2%
Other Durable Goods Emerging 86 71 89 87 ‐8.8% 2.5% ‐3.1% 0.1%
Transportation Equipment Emerging 5 12 5 5 55.8% ‐10.5% 0.0% 0.0%
Food and Beverage and Tobacco Declining 1,033 932 931 927 ‐5.0% ‐0.1% ‐0.3% ‐1.1%
Wood Product Declining 135 107 109 112 ‐10.8% 0.5% 2.9% ‐1.9%
Chemical Manufacturing Declining 105 74 85 81 ‐15.7% 1.1% ‐4.5% ‐2.5%
Printing and Related Support Activities Declining 131 110 95 94 ‐8.3% ‐2.0% ‐1.1% ‐3.3%
Other Nondurable Goods Declining 48 45 14 15 ‐3.5% ‐12.7% 7.8% ‐11.0%
Total Manufacturing Declining 2,031 1,944 1,972 2,010 ‐2.2% 0.4% 1.9% ‐0.1%
Industry Group Performance
Class
Jobs Average Annual Job Growth (%)

30|P a g e
TABLE12.MAUICOUNTYMANUFACTURINGINDUSTRYPERFORMANCECOMPAREDWITHSTATEANDNATION,2005‐2015
Source:DBEDTcompilationbasedonEMSIdata.
Kauai County
Ofthe12condensedmanufacturingindustrygroupsdefinedinthisstudy,only11groupshadjobsin2015forKauaiCounty.Thesegroupsaccountedfor730ofthestate’smanufacturingindustryjobsin2015,a1.8percentaverageannualincreasefrom2005to2015.Theaverageannualjobgrowthwas1.1 percent from2005 to 2007 and1.9 percent from2007 to 2015. As shown inTable 13, sixmanufacturingindustrygroupsqualifiedashighperforminginKauaiCountyduringthe2005to2015period.Theseincludedotherdurablegoods,apparelandleatherandalliedproduct,othernondurablegoods,foodandbeverageandtobacco,andmiscellaneousmanufacturing.FivemanufacturingindustrygroupslostjobsinKauaiCountyoverthe2005to2015period.
Average Annual Job Growth (%)
County State U.S. County State U.S.
Nonmetallic Mineral Product Base‐Growth 55 2.6% 0.3% ‐2.0% 68,871 68,057 63,814
Apparel and Leather and Allied Product Emerging 39 6.1% ‐1.5% ‐3.6% 10,924 26,515 41,710
Miscellaneous Manufacturing Emerging 69 3.0% ‐0.9% ‐0.3% 26,627 36,432 75,037
Furniture and Related Product Emerging 37 5.2% ‐3.5% ‐3.8% 48,186 53,879 48,572
Other Durable Goods Emerging 1 0.1% 0.9% ‐0.9% 61,678 64,890 85,680
Transportation Equipment Emerging 0 0.0% 3.6% ‐1.0% 71,000 87,773 88,081
Food and Beverage and Tobacco Declining ‐105 ‐1.1% 1.6% 0.8% 43,933 43,151 56,365
Wood Product Declining ‐23 ‐1.9% ‐3.4% ‐3.5% 25,216 24,261 48,255
Chemical Manufacturing Declining ‐23 ‐2.5% ‐1.7% ‐0.6% 54,245 58,852 118,964
Printing and Related Support Activities Declining ‐37 ‐3.3% ‐2.3% ‐2.9% 40,801 36,638 51,809
Other Nondurable Goods Declining ‐33 ‐11.0% ‐2.6% ‐2.6% 47,490 52,318 64,075
Total Manufacturing Declining ‐21 ‐0.1% 0.1% ‐1.2% 43,478 49,607 76,657
Job Change
2005‐2015
Avg. Annual Earnings (2015)Industry Group Performance
Class

P a g e |31
TABLE13.MANUFACTURINGINDUSTRYJOBS,KAUAICOUNTY
Source:DBEDTcompilationbasedonEMSIdata.
ThecomparisonsofKauaiCounty’smanufacturing industry jobsandearningsgrowthwiththestateandnationarelistedinTable14.Forjobgrowth,KauaiCounty’s1.8percentaverageannualgrowthratewasbetterthanthestate’s0.1percentandbetterthanthenationalaverageofanegative1.2percent.Foraverageearnings,KauaiCountywaslowerthanthestateandmuchlowerthanthenationalaverage.
TABLE14.KAUAICOUNTYMANUFACTURINGINDUSTRYPERFORMANCECOMPAREDWITHSTATEANDNATION,2005‐2015
Source:DBEDTcompilationbasedonEMSIdata.
2005 2007 2014 2015 2005‐2007 2007‐2015 2014‐2015 2005‐2015
Other Durable Goods Emerging 15 14 32 38 ‐3.4% 13.2% 17.1% 9.7%
Apparel and Leather and Allied Product Emerging 22 29 40 42 13.8% 5.0% 5.2% 6.7%
Other Nondurable Goods Emerging 9 3 8 15 ‐42.3% 22.3% 87.5% 5.2%
Food and Beverage and Tobacco Emerging 224 259 306 328 7.5% 3.0% 7.5% 3.9%
Miscellaneous Manufacturing Emerging 70 83 74 74 8.9% ‐1.5% ‐0.7% 0.5%
Transportation Equipment Emerging 5 5 5 5 0.0% 0.0% 0.0% 0.0%
Nonmetallic Mineral Product Declining 77 66 72 72 ‐7.3% 1.1% 0.7% ‐0.6%
Wood Product Declining 91 60 78 86 ‐18.9% 4.5% 10.0% ‐0.7%
Printing and Related Support Activities Declining 50 46 47 45 ‐3.6% ‐0.5% ‐5.1% ‐1.2%
Furniture and Related Product Declining 32 41 29 19 14.2% ‐8.9% ‐33.2% ‐4.7%
Chemical Manufacturing Declining 18 20 10 6 3.7% ‐13.9% ‐41.5% ‐10.6%
Total Manufacturing Emerging 614 627 702 730 1.1% 1.9% 4.1% 1.8%
Industry Group Performance
Class
Jobs Average Annual Job Growth (%)
Average Annual Job Growth (%)
County State U.S. County State U.S.
Other Durable Goods Emerging 23 9.7% 0.9% ‐0.9% 34,734 64,890 85,680
Apparel and Leather and Allied Product Emerging 20 6.7% ‐1.5% ‐3.6% 19,571 26,515 41,710
Other Nondurable Goods Emerging 6 5.2% ‐2.6% ‐2.6% 24,000 52,318 64,075
Food and Beverage and Tobacco Emerging 104 3.9% 1.6% 0.8% 40,269 43,151 56,365
Miscellaneous Manufacturing Emerging 4 0.5% ‐0.9% ‐0.3% 36,757 36,432 75,037
Transportation Equipment Emerging 0 0.0% 3.6% ‐1.0% 70,000 87,773 88,081
Nonmetallic Mineral Product Declining ‐5 ‐0.6% 0.3% ‐2.0% 42,116 68,057 63,814
Wood Product Declining ‐6 ‐0.7% ‐3.4% ‐3.5% 27,308 24,261 48,255
Printing and Related Support Activities Declining ‐5 ‐1.2% ‐2.3% ‐2.9% 21,681 36,638 51,809
Furniture and Related Product Declining ‐12 ‐4.7% ‐3.5% ‐3.8% 55,195 53,879 48,572
Chemical Manufacturing Declining ‐12 ‐10.6% ‐1.7% ‐0.6% 58,000 58,852 118,964
Total Manufacturing Emerging 116 1.8% 0.1% ‐1.2% 37,481 49,607 76,657
Job Change
2005‐2015
Avg. Annual Earnings (2015)Industry Group Performance
Class

32|P a g e
VI. MANUFACTURINGINDUSTRYPERFORMANCEBYMAJORGROUPS
This section takesacloser lookat theperformance foreachrespective industrygroup in themanufacturingsector’sportfolio.Asdiscussedearlier,themanufacturingsectorincludedabout18,767jobsin12industrygroupsin2015. Intermsof jobs,these12groupswerecomposedofthetopfivegroups fordurable goods, the top five groups fornondurable goods, one group for all otherdurablegoods,andonegroupforallothernondurablegoods.Theaverageannualearningsforthemanufacturingsectorwas$49,607in2015.Table15showsthemajorindustrygroupsofthemanufacturingsectorandtheirprimaryperformancemetrics.
Amongthenondurablegoodsmanufacturinggroups,thefoodandbeverageandtobaccogrouphad the most jobs in 2015. The 8,666 jobs in this group accounted for 46.2 percent of the totalmanufacturingjobsin2015.Inthenondurablegoodsgroups,boththeapparelandleatherandalliedproductgroupandtheprintingandrelatedsupportactivitieshadmorethan1,100jobsin2015.Thetopgroupindurablegoodsmanufacturingwasmiscellaneousmanufacturing,whichhadabout1,800jobsin2015.Nonmetallicmineralproductinthedurablegoodsgroupsalsohadmorethan1,000jobsin2015.
TABLE15.EMPLOYMENTANDGROWTHINHAWAII’SMANUFACTURINGINDUSTRY
Source:DBEDTcompilationbasedonEMSIdata.
Table 16 compares the U.S. and Hawaii’s real GDP growth rates from 2005 to 2014 for themanufacturingsectorgroupsbasedonBEAdata. For the total, includingall industries, therealGDPannualgrowth rate inHawaiiwasbelow thenational averageby0.2of apercentagepoint. For themanufacturing sector,Hawaii’s negative 0.7 percent annual growth ratewas significantly below thepositive0.7percentannualgrowthforthenation. TherealGDPgrowthratesfordurablegoodsandnondurablegoodsinHawaiiwerebothbelowthenationalaverage.Amongthe12manufacturingsectorgroups,sevengroupsinHawaiiperformedbetterthanthenationintermsofrealGDPgrowthfrom2005to2014.
2005 2015 Hawaii U.S. Hawaii U.S.
Competitive
Share 2005‐
2015
Location
Quotient
(LQ), 2015
Change in
LQ, 2005‐
2015
Total Manufacturing 18,519 18,767 0.1% ‐1.2% 49,607 76,657 1.3% 0.30 0.04
Food and Beverage and Tobacco 7,403 8,666 1.6% 0.8% 43,151 56,365 0.8% 0.97 0.09
Miscellaneous Manufacturing 1,951 1,785 ‐0.9% ‐0.3% 36,432 75,037 ‐0.6% 0.53 ‐0.03
Nonmetallic Mineral Product 1,219 1,260 0.3% ‐2.0% 68,057 63,814 2.4% 0.62 0.14
Apparel and Leather and Allied Product 1,437 1,236 ‐1.5% ‐3.6% 26,515 41,710 2.1% 1.14 0.23
Printing and Related Support Activities 1,463 1,158 ‐2.3% ‐2.9% 36,638 51,809 0.6% 0.47 0.03
Other Durable Goods 905 993 0.9% ‐0.9% 64,890 85,680 1.8% 0.05 0.01
Transportation Equipment 574 814 3.6% ‐1.0% 87,773 88,081 4.6% 0.11 0.04
Other Nondurable Goods 967 741 ‐2.6% ‐2.6% 52,318 64,075 0.0% 0.12 0.00
Wood Product 911 642 ‐3.4% ‐3.5% 24,261 48,255 0.1% 0.31 0.01
Petroleum and Coal Products 436 523 1.8% ‐0.2% 167,531 165,867 2.0% 0.98 0.19
Furniture and Related Product 745 520 ‐3.5% ‐3.8% 53,879 48,572 0.2% 0.26 0.01
Chemical Manufacturing 509 429 ‐1.7% ‐0.6% 58,852 118,964 ‐1.1% 0.11 ‐0.01
Group & Industry
Hawaii Jobs
Avg. Job
Growth Rate,
2005‐2015
Annual Earnings
2015Performance Metrics

P a g e |33
Amongthenondurablegoodsmanufacturinggroups,thefoodandbeverageandtobaccogroupalsoaccountedforthelargestportionofthemanufacturingsector’srealGDPin2014.The$355millionrealGDPinthisgroupaccountedfor31.2percentofthetotalmanufacturingsector’srealGDPin2014.Although this sharewas below this group’s share of totalmanufacturing jobs (46.0 percent), itwassignificantlyhigherthanthesameshareforthenation(11.6percent).ThesecondlargestgroupforrealGDPispetroleumandcoalproducts(mostlypetroleumrefinery). Althoughitonlyaccountedfor2.7percentofthemanufacturingsectorjobsin2014,itsshareofthemanufacturingsector’srealGDPwas22.1percentin2014.Thisvaluewasalsosignificantlyhigherthanthesameshareforthenationat5.3percent.
For durable goods, the top two groupswere nonmetallicmineral product and other durablegoods. Theyaccounted forabout9.7percentand6.3percentofHawaii’smanufacturingrealGDP in2014,respectively.
TABLE16.REALGDPINHAWAIIANDU.S.MANUFACTURINGINDUSTRY
Source:DBEDTcompilationbasedonBEAdata.
Mostofthe12industrygroupsarecomposedofsmallersubgroupsandjobnumbersandaverageearnings data are available for these subgroups. However, GDP data is only available at the largerindustry level and not the subgroup level. Job numbers and average earnings data for the smallerindustrylevelareshownindetailinthefollowingsections.
2005 2014 2005 2014 Hawaii U.S.U.S. Above
HawaiiHawaii U.S.
All Industry Total 64,365 69,662 14,211,385 15,653,000 0.9% 1.1% 0.2%
Manufacturing 1,212 1,139 1,776,685 1,886,153 ‐0.7% 0.7% 1.4% 100.0% 100.0%
Durable Goods Manufacturing 323 321 930,148 1,095,908 ‐0.1% 1.8% 1.9% 28.2% 58.1%
Miscellaneous Manufacturing 44 56 68,049 77,083 2.7% 1.4% ‐1.3% 4.9% 4.1%
Nonmetallic Mineral Product 119 111 55,078 43,007 ‐0.8% ‐2.7% ‐1.9% 9.7% 2.3%
Transportation Equipment 48 56 228,151 261,531 1.7% 1.5% ‐0.2% 4.9% 13.9%
Wood Product 14 8 26,093 21,590 ‐6.0% ‐2.1% 3.9% 0.7% 1.1%
Furniture and Related Product 39 21 39,554 25,124 ‐6.6% ‐4.9% 1.7% 1.8% 1.3%
Other Durable Goods 61 72 531,784 672,264 1.9% 2.6% 0.8% 6.3% 35.6%
Nondurable Goods Manufacturing 891 817 850,561 801,934 ‐1.0% ‐0.7% 0.3% 71.7% 42.5%
Food and Beverage and Tobacco 387 355 212,102 218,906 ‐1.0% 0.4% 1.3% 31.2% 11.6%
Apparel and Leather and Allied Product 23 24 13,281 10,892 0.5% ‐2.2% ‐2.7% 2.1% 0.6%
Printing and Related Support Activities 57 70 44,588 40,720 2.3% ‐1.0% ‐3.3% 6.1% 2.2%
Petroleum and Coal Products 320 252 127,465 99,393 ‐2.6% ‐2.7% ‐0.1% 22.1% 5.3%
Chemical Manufacturing 64 87 284,749 293,876 3.5% 0.4% ‐3.1% 7.6% 15.6%
Other Nondurable Goods 57 40 163,044 137,613 ‐3.9% ‐1.9% 2.0% 3.5% 7.3%
Group & Industry
% of 2014
Manufacture Real
GDP
Hawaii Real GDP U.S. Real GDP Real GDP Annual Growth

34|P a g e
FoodandBeverageandTobaccoManufacturing
Hawaii has no tobacco manufacturing, so this group included only food and beveragemanufacturing.ItwasthelargestgroupforHawaii’smanufacturingsector,bothintermsofjobsandrealGDP.Withabout8,700employees,includingself‐employedworkers,itaccountedforabout46.2percentoftotalmanufacturingjobsin2015.However,theaverageearningsofthisgroupwasonly$43,151in2015,about13.0percentbelowtheaverageearningsforthetotalmanufacturingsectorinHawaii.Theaverageearningsfigurewasabout23.4percentbelowtheU.S.averageforthesamegroup.From2005to2015,jobsinthisgroupincreasedatanaverageannualrateof1.6percent,higherthanthe0.8percentaverageannualgrowthforthenation.
Thisgroupincludestwelvesmallerindustrysubgroups. Nineofthemarefoodmanufacturingrelatedandtheyaccountedforabout88.7percentofjobsinthefoodandbeveragegroup.Thesubgroupswiththemostjobsalsohadthelowestearnings.AsshowninTable17,thelargestsubgroupwasbakeriesandtortilla,whichhadabout2,900jobsandaccountedforabout33.5percentofthejobsinthisgroup.Thesecondlargestsubgroupwasperishablepreparedfood,withabout1,200jobs.Thesetwosubgroupsalsoaddedthemostjobs(877jobsand204jobs,respectively)from2005to2015.Withabout$33,400inannualearnings,thebakeriesandtortillasubgroupwasthelowestinthefoodandbeveragegroup.Theaverageearningsoftheperishablepreparedfoodsubgroupwas$36,166,thethirdlowestannualearningsinthisgroup.
ThesetwosubgroupsaremoreconcentratedinHawaiithanthenation,withLQvaluesin2015equalto1.79and5.07,respectively.Thisisprobablyduetothefactthatasignificantquantityoftheirproductswereeitherconsumedbyvisitorsorexported.OthermoreconcentratedsubgroupsinHawaiiincludesugarandconfectioneryproduct,coffeeandtea,snackfood,softdrink,andbottledwater.Softdrinkmanufacturing,whichhad445jobsin2015,hasthehighestaverageearnings($83,425),followedbydairyproduct($59,186),bottledwater($57,843),andotherbeverageproduct($54,676).From2005to2015,fruitandvegetablepreservingandspecialtyfoodlostthemostjobs(lost188jobs),followedbyanimalslaughteringandprocessing(lost130jobs),andsnackfood(lost45jobs).

P a g e |35
TABLE17.FOODANDBEVERAGEANDTOBACCOINDUSTRYGROUPEMPLOYMENT
Source:DBEDTcompilationbasedonEMSIdata.
MiscellaneousManufacturing
Withabout1,800jobsin2015,orabout9.5percentoftotaljobsinthemanufacturingsector,themiscellaneousmanufacturinggroupwasthelargestgroupfordurablegoodsmanufacturing.However,sincethisgroup’sGDPper jobwasrelatively low, itonlyaccountedforabout4.9percentofthetotalmanufacturingsector’srealGDPin2014,whichwasslightlyabovethe4.1percentfigureforthenation.Theaverageearningsof thisgroupwasonly$36,432 in2015,about26.6percentbelowtheaverageearningsofthetotalmanufacturingsectorinHawaiiandabout51.4percentbelowtheU.S.averageforthesamegroup.From2005to2015,jobsinthisgroupdecreased0.9percentperyearonaverageforHawaii.Incontrast,jobsinthisgroupdecreasedatanaverageannualrateof0.3percentnationally.ThisgroupwaslessconcentratedinHawaii,indicatingthatHawaiiislikelytobeanetimporterforthisgroup.
Thisgroupincludesfiveindustrysubgroups.Jewelryandsilverwaremanufacturinghadthemostjobs(604jobs),withtheotherfoursubgroupseachhavingabout200‐400jobsin2015.AsshowninTable18,medicalequipmentandsupplies,whichmainlyincludeddentallaboratories,hadthehighestaverageannualearnings ($53,487) in thisgroup, followedby sportingandathleticgoods ($44,157),other miscellaneous manufacturing ($36,892), sign manufacturing ($35,231), and jewelry andsilverware($27,177).
Twosubgroups,jewelryandsilverwareandsportingandathleticgoodsweremoreconcentratedinHawaiithanthenation,with2015LQvaluesof3.07and1.16,respectively.Thiswasprobablyduetothefactthatasignificantportionoftheirproductswereeitherconsumedbyvisitorsorexported.
From2005to2015,twoofthesubgroupsaddedjobs.Othermiscellaneousmanufacturingaddedthemost jobs (24 jobs), followedby sporting and athletic goods (18 jobs). Medical equipment andsupplieslost127jobsandjewelryandsilverwaremanufacturinglost76jobs.
2005 2015 Hawaii U.S. Hawaii U.S.
Competitive
Share 2005‐
2015
Location
Quotient
(LQ), 2015
Change in
LQ, 2005‐
2015
Food and Beverage and Tobacco Product 7,403 8,666 1.6% 0.8% 43,151 56,365 0.8% 0.97 0.09
Bakeries and Tortilla 2,025 2,901 3.7% 1.3% 33,378 43,329 2.4% 1.79 0.38
Perishable Prepared Food 988 1,192 1.9% 4.2% 36,166 41,385 ‐2.3% 5.07 ‐1.19
Sugar and Confectionery Product 875 893 0.2% ‐0.1% 49,743 56,996 0.3% 2.37 0.08
Fruit and Vegetable Preserving and Specialty Food 720 533 ‐3.0% 0.0% 35,278 56,538 ‐3.0% 0.61 ‐0.21
Coffee and Tea 407 499 2.0% 5.7% 50,852 59,794 ‐3.6% 3.97 ‐1.61
Soft Drink Manufacturing 442 445 0.1% ‐0.5% 83,425 73,766 0.6% 1.27 0.09
Animal Slaughtering and Processing 570 440 ‐2.6% ‐0.3% 49,843 45,194 ‐2.2% 0.19 ‐0.05
Other Food Manufacturing 285 415 3.8% 0.9% 36,172 75,178 2.9% 0.34 0.09
Dairy Product 356 414 1.5% 0.4% 59,186 69,695 1.1% 0.62 0.07
Snack Food 443 398 ‐1.1% 2.2% 42,124 58,417 ‐3.2% 1.43 ‐0.53
Other Beverage Product Manufacturing 146 298 7.4% 3.7% 54,676 70,808 3.7% 0.40 0.12
Bottled Water Manufacturing 146 240 5.1% ‐0.9% 57,843 69,591 6.0% 3.39 1.52
Hawaii JobsAvg. Job Growth
Rate, 2005‐2015
Annual Earnings,
2015Performance Metrics
Group & Industry

36|P a g e
TABLE18.MISCELLANEOUSMANUFACTURINGINDUSTRYGROUPEMPLOYMENT
Source:DBEDTcompilationbasedonEMSIdata.
NonmetallicMineralProductManufacturing
Thenonmetallicmineralproductmanufacturinggroupwasthesecondlargestgroupfordurablegoodsmanufacturingin2015,withmorethan1,200jobsorabout6.7percentoftotalmanufacturingjobs.Sincethisgroup’sGDPperjobwashigherthantheaverageofthemanufacturingsector,itaccountedforabout9.7percentof thetotalmanufacturingsector’srealGDPin2014. Atthenational level, thisgroupaccountedforonly3.3percentofthemanufacturingjobsand2.3percentofrealGDP.
Theaverageannualearningsinthisgroupwasrelativelyhigh,withaverageannualearningsof$68,057in2015.Theaverageearningsofthisgroupwas37.2percentabovetheaverageearningsofthewholemanufacturingsectorinHawaiiandabout6.6percentabovetheU.S.averageforthesamegroup.From2005to2015,jobsinthisgroupincreasedatanaverageannualrate0.3percentinHawaii,whichwas a sharp contrast to the 2.0 percent average annual decrease for the nation. This group is lessconcentratedinHawaiithanthenation,indicatingthatHawaiiislikelytobeanetimporterforthisgroup.
This group can be separated into four subgroups, but their products aremostly used in theconstructionsector.Cementandconcreteproductmanufacturinghadthemostjobs(773jobs)andtheotherthreesubgroupseachhadabout100‐200jobsin2015.AsshowninTable19,cementandconcreteproductmanufacturinghadthehighestaverageannualearnings($91,006)inthisgroup,followedbyother nonmetallicmineral product ($64,552), glass and glass product ($36,041). Clay product andrefractorymanufacturinghasthelowestaverageearnings($5,704).
AllsubgroupsarelessconcentratedinHawaiiwitha2015LQvaluelessthan1.0.ThisprobablywasduetothefactthatasignificantquantityofconstructionmaterialswasimportedtoHawaii.
From 2005 to 2015, the cement and concrete product subgroup lost 74 jobs, and the othernonmetallic mineral product subgroup lost 54 jobs. Jobs increased the most in clay product andrefractorymanufacturing(135jobs),followedbyglassandglassproduct(54jobs).
Three subgroups, except the other nonmetallicmineral product subgroup, outperformed thenationalaverageintermsofjobgrowthfromthe2005to2015period.TheU.S.lostjobsinallthefoursubgroups.ThejoblossinthecementandconcreteproductsubgroupwasmoresevereatthenationallevelthaninHawaii.
2005 2015 Hawaii U.S. Hawaii U.S.
Competitive
Share 2005‐
2015
Location
Quotient
(LQ),
2015
Change
in LQ,
2005‐
2015
Miscellaneous Manufacturing 1,951 1,785 ‐0.9% ‐0.3% 36,432 75,037 ‐0.6% 0.53 ‐0.03
Jewelry and Silverware 680 604 ‐1.2% ‐2.5% 27,177 51,429 1.3% 3.07 0.42
Other Miscellaneous Manufacturing 334 358 0.7% ‐1.2% 36,892 63,450 1.9% 0.42 0.08
Sign Manufacturing 324 319 ‐0.2% 0.9% 35,231 51,216 ‐1.0% 0.60 ‐0.06
Sporting and Athletic Goods 281 299 0.6% ‐1.3% 44,157 63,281 1.9% 1.16 0.22
Medical Equipment and Supplies 332 205 ‐4.7% 0.3% 53,487 94,764 ‐5.0% 0.13 ‐0.09
Performance Metrics
Group & Industry
Hawaii JobsAvg. Job Growth
Rate, 2005‐2015
Annual Earnings,
2015

P a g e |37
TABLE19.NONMETALLICMINERALPRODUCTINDUSTRYGROUPEMPLOYMENT
Source:DBEDTcompilationbasedonEMSIdata.
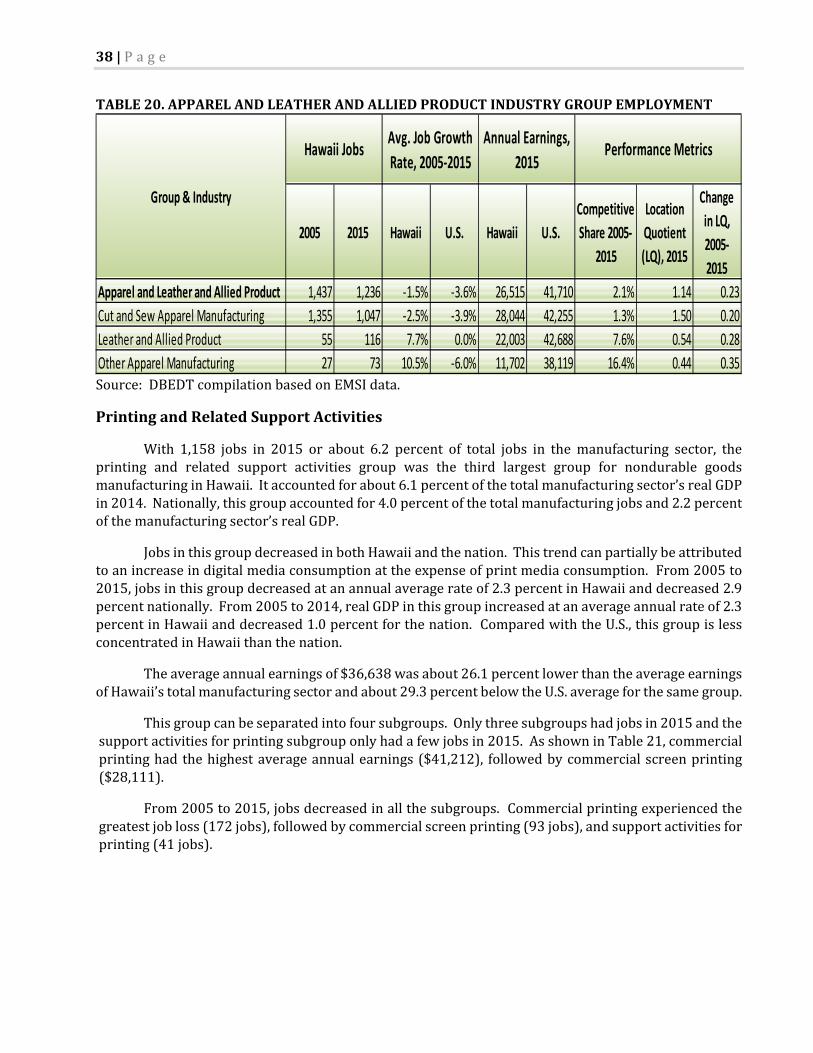
ApparelandLeatherandAlliedProductManufacturing
Withmore than1,200 jobs in2015or about6.6percentof the totalmanufacturing jobs, theapparel and leather and allied product group was the second largest group for nondurable goodsmanufacturinginHawaii.Sincethisgroup’sGDPperjobwasrelativelylow,itonlyaccountedforabout2.1percentofthemanufacturingsector’srealGDPin2014.Forthenation,thisgrouponlyaccountedfor1.7percentoftotalmanufacturingjobsand0.6percentofmanufacturingrealGDP.
Duetoincreasedinternationalcompetition,thisgroupdeclinedsignificantlyinboththeU.S.andHawaii. From2005to2015, jobsinthisgroupdecreasedatanaverageannualrateof1.5percent inHawaii,anddecreased3.6percentforthenation. ComparedwiththeU.S.,thisgroupisslightlymoreconcentratedinHawaii.
Theaverageannualearningsofthisgroupwasthesecondlowestamongall12manufacturinggroups inHawaii. Theaverageearningsof$26,515 for thisgroupwasabout46.5percentbelowtheaverage earnings of the totalmanufacturing sector inHawaii and about 36.4 percent below theU.S.averageforthesamegroup.
This group includes three industry subgroups. The cut and sew apparel manufacturingdominatedthegroupandaccountedfor1,047jobsor84.7percentofthejobsinthegroup.Leatherandalliedproducthad116jobsandotherapparelmanufacturinghad73jobsin2015.AsshowninTable20,cutandsewapparelmanufacturinghadthehighestaverageannualearnings($28,044),followedbyleather and allied product ($22,003) and other apparelmanufacturing ($11,702). The cut and sewapparelmanufacturingismoreconcentratedinHawaiithanthenation,witha2015LQvalueof1.50.
From2005to2015,thecutandsewapparelmanufacturingsubgrouplost308jobs,theleatherandalliedproductadded61jobs,andtheotherapparelmanufacturingadded46jobs.
2005 2015 Hawaii U.S. Hawaii U.S.
Competitive
Share 2005‐
2015
Location
Quotient
(LQ),
2015
Change
in LQ,
2005‐
2015
Nonmetallic Mineral Product 1,219 1,260 0.3% ‐2.0% 68,057 63,814 2.4% 0.62 0.14
Cement and Concrete Product 847 773 ‐0.9% ‐2.5% 91,006 65,831 1.6% 0.86 0.13
Clay Product and Refractory 77 211 10.7% ‐3.4% 5,704 53,796 14.1% 0.91 0.68
Other Nonmetallic Mineral Product 203 149 ‐3.1% ‐0.4% 64,552 65,002 ‐2.6% 0.33 ‐0.10
Glass and Glass Product 93 126 3.2% ‐1.9% 36,041 63,775 5.0% 0.28 0.11
Performance Metrics
Group & Industry
Hawaii JobsAvg. Job Growth
Rate, 2005‐2015
Annual Earnings,
2015
38|P a g e
TABLE20.APPARELANDLEATHERANDALLIEDPRODUCTINDUSTRYGROUPEMPLOYMENT
Source:DBEDTcompilationbasedonEMSIdata.
PrintingandRelatedSupportActivities
With 1,158 jobs in 2015 or about 6.2 percent of total jobs in themanufacturing sector, theprinting and related support activities group was the third largest group for nondurable goodsmanufacturinginHawaii.Itaccountedforabout6.1percentofthetotalmanufacturingsector’srealGDPin2014.Nationally,thisgroupaccountedfor4.0percentofthetotalmanufacturingjobsand2.2percentofthemanufacturingsector’srealGDP.
JobsinthisgroupdecreasedinbothHawaiiandthenation.Thistrendcanpartiallybeattributedtoanincreaseindigitalmediaconsumptionattheexpenseofprintmediaconsumption.From2005to2015,jobsinthisgroupdecreasedatanannualaveragerateof2.3percentinHawaiianddecreased2.9percentnationally.From2005to2014,realGDPinthisgroupincreasedatanaverageannualrateof2.3percentinHawaiianddecreased1.0percentforthenation.ComparedwiththeU.S.,thisgroupislessconcentratedinHawaiithanthenation.
Theaverageannualearningsof$36,638wasabout26.1percentlowerthantheaverageearningsofHawaii’stotalmanufacturingsectorandabout29.3percentbelowtheU.S.averageforthesamegroup.
Thisgroupcanbeseparatedintofoursubgroups.Onlythreesubgroupshadjobsin2015andthesupportactivitiesforprintingsubgrouponlyhadafewjobsin2015.AsshowninTable21,commercialprintinghadthehighestaverageannualearnings($41,212), followedbycommercialscreenprinting($28,111).
From2005to2015,jobsdecreasedinallthesubgroups.Commercialprintingexperiencedthegreatestjobloss(172jobs),followedbycommercialscreenprinting(93jobs),andsupportactivitiesforprinting(41jobs).
2005 2015 Hawaii U.S. Hawaii U.S.
Competitive
Share 2005‐
2015
Location
Quotient
(LQ), 2015
Change
in LQ,
2005‐
2015
Apparel and Leather and Allied Product 1,437 1,236 ‐1.5% ‐3.6% 26,515 41,710 2.1% 1.14 0.23
Cut and Sew Apparel Manufacturing 1,355 1,047 ‐2.5% ‐3.9% 28,044 42,255 1.3% 1.50 0.20
Leather and Allied Product 55 116 7.7% 0.0% 22,003 42,688 7.6% 0.54 0.28
Other Apparel Manufacturing 27 73 10.5% ‐6.0% 11,702 38,119 16.4% 0.44 0.35
Performance Metrics
Group & Industry
Hawaii JobsAvg. Job Growth
Rate, 2005‐2015
Annual Earnings,
2015

P a g e |39
TABLE21.PRINTINGANDRELATEDSUPPORTINDUSTRYGROUPEMPLOYMENT
Source:DBEDTcompilationbasedonEMSIdata.
OtherDurableGoodsManufacturing
Theotherdurablegoodsgroupwasthethirdlargestgroupfordurablegoodsmanufacturing,withabout1,000jobsin2015orabout5.3percentofthetotaljobsinthemanufacturingsector.Sincethisgroup’sGDPperjobwashigherthantheaverageofthemanufacturingsector,itaccountedfor6.3percentofHawaii’stotalmanufacturingsector’srealGDPin2014.Atthenationallevel,theroleofthisgroupwassignificantlyhigherthanHawaii,accountingforabout35.1percentofallmanufacturingjobsand35.6percentofthemanufacturingsector’srealGDP.
TheaverageannualearningsinthisgroupwasrelativelyhighcomparedwithothergroupsinHawaii.However,itwasrelativelylowcomparedwiththeaverageannualearningsforthenationoverall.Withanaverageearningsof$64,890in2015,thisgroupwas30.8percentabovetheaverageearningsofthetotalmanufacturingsectorinHawaii,but24.3percentbelowtheU.S.averageforthesamegroup.From2005 to2015, jobs in this group increasedat anaverageannual rateof0.9percent inHawaii,compared with the negative 0.9 percent average annual growth for the nation. This group is lessconcentratedinHawaiithanthenation,indicatingthatHawaiiislikelytobeanetimporterforthisgroup.
This group can be separated into five subgroups. As shown in Table 22, fabricated metalproducts,whichmainlyincludesarchitecturalandstructuralmetals,hadthemost2015jobs(511jobs).Thiswasfollowedbycomputerandelectronicproduct(286jobs),whichmainlyincludesnavigational,measuring, electro‐medical, and control instruments. These two subgroupsalsohadhigher averageannualearnings.
AllsubgroupsinthiscategorywerelessconcentratedinHawaiithanthenation,witha2015LQvalueoflessthan1.0.ThiswasprobablyduetothefactthatasignificantamountoftheirproductsareimportedtoHawaii.
From2005to2015,computerandelectronicproductmanufacturingaddedthemostjobs(172jobs),followedbymachinerymanufacturing(42jobs).Fabricatedmetalproductmanufacturinglost102jobs,andprimarymetallost38jobsinthesameperiod.
2005 2015 Hawaii U.S. Hawaii U.S.
Competitive
Share 2005‐
2015
Location
Quotient
(LQ),
2015
Change
in LQ,
2005‐
2015
Printing and Related Support Activities 1,463 1,158 ‐2.3% ‐2.9% 36,638 51,809 0.6% 0.47 0.03
Commercial Printing (except Screen and Books) 932 759 ‐2.0% ‐3.3% 41,212 54,377 1.2% 0.42 0.05
Commercial Screen Printing 485 392 ‐2.1% 1.6% 28,111 38,116 ‐3.7% 0.96 ‐0.42
Support Activities for Printing 46 5 ‐19.9% ‐5.9% 28,111 55,548 ‐13.9% 0.03 ‐0.13
Books Printing 5 0 ‐100.0% ‐4.3% 0 55,128 ‐95.7% 0.00 ‐0.03
Performance Metrics
Group & Industry
Hawaii JobsAvg. Job Growth
Rate, 2005‐2015
Annual Earnings,
2015

40|P a g e
TABLE22.OTHERDURABLEGOODSINDUSTRYGROUPEMPLOYMENT
Source:DBEDTcompilationbasedonEMSIdata.
TransportationEquipmentManufacturing
ThetransportationequipmentmanufacturinggroupinHawaiiwasdominatedbyshipandboatbuilding.Thisgrouphad814jobsin2015,accountingfor4.3percentoftotaljobsinthemanufacturingsector.Sincethisgroup’sGDPperjobwashigherthantheaverageoftheoverallmanufacturingsector,itsshareofthemanufacturingsector’srealGDPin2014wasabout4.9percent.TheroleofthisgroupatthenationallevelwassignificantlyhigherthanthatofHawaiiduetoagreatercomparativeadvantage.Nationally,thisgroupaccountedforabout12.4percentofmanufacturingjobsand13.9percentofthemanufacturingsector’srealGDP.
TheaverageannualearningsinthisgroupwasrelativelyhighcomparedwithothergroupsinHawaii,butclosetothenationallevel.Withaverageearningsof$87,773in2015,thisgroupwas76.9percentabovetheaverageearningsofthetotalmanufacturingsectorinHawaii.However,theearningswereonly0.3percentbelowthenationalaverageforthesamegroup.From2005to2015,jobsinthisgroupincreasedatanaverageannualrateof3.6percentinHawaii,whichwassignificantlyhigherthanthe1.0percentannualdecreaseforthenation.
Thisgroupcanbeseparatedintotwosubgroups.AsshowninTable23,shipandboatbuildingaccountedforabout96percentofthejobsinthisgroup.ThissubgroupwasalsomoreconcentratedinHawaii,indicatingthatshipandboatbuildingmaybeanetexporterforHawaii.
Althoughithashighearnings,theothertransportationequipmentmanufacturingsubgroupwassmallinHawaii.From2005to2015,shipandboatbuildingadded265jobs,whileothertransportationequipmentmanufacturinglost24jobs.
2005 2015 Hawaii U.S. Hawaii U.S.
Competitive
Share 2005‐
2015
Location
Quotient
(LQ),
2015
Change
in LQ,
2005‐
2015
Other Durable Goods Manufacturing 905 993 0.9% ‐0.9% 64,890 85,680 1.8% 0.05 0.01
Fabricated Metal Product Manufacturing 613 511 ‐1.8% ‐0.3% 66,631 64,030 ‐1.5% 0.07 ‐0.01
Computer and Electronic Product Manufacturing 115 286 9.6% ‐2.1% 75,739 125,989 11.7% 0.06 0.04
Machinery Manufacturing 91 133 3.8% ‐0.2% 46,159 80,157 4.1% 0.02 0.01
Electrical Equipment and Appliance Manufacturing 40 54 3.1% ‐1.0% 41,318 83,361 4.1% 0.03 0.01
Primary Metal Manufacturing 46 8 ‐16.0% ‐1.5% 57,887 78,677 ‐14.5% 0.00 ‐0.02
Performance Metrics
Group & Industry
Hawaii JobsAvg. Job Growth
Rate, 2005‐2015
Annual Earnings,
2015

P a g e |41
TABLE23.TRANSPORTATIONEQUIPMENTINDUSTRYGROUPEMPLOYMENT
Source:DBEDTcompilationbasedonEMSIdata.
OtherNondurableGoodsManufacturing
Othernondurablegoodsmanufacturingincludes:plasticsandrubberproducts,textilemillsandtextileproductmills,andpapermanufacturing.Withabout741jobsin2015,itaccountedfor3.9percentoftotaljobsinthemanufacturingsector.Itsshareofthemanufacturingsector’srealGDPin2014was3.5percent.TheroleofthisgroupatthenationallevelwashigherthanHawaii,accountingforabout10.1percentofmanufacturingjobsand7.3percentofmanufacturingrealGDP.
Duetoincreasedglobalcompetition,jobsinthisgroupdecreasedinHawaiiandthenation.From2005to2015,jobsinthisgroupdecreasedatanaverageannualrateof2.6percentforbothHawaiiandthenation.From2005to2014,realGDPinthisgroupdecreasedanaverageannualrateof3.9percentin Hawaii and decreased 1.9 percent for the nation. Compared with the U.S., this group was lessconcentratedinHawaii.
Theaverageearningsof$52,318forthisgroupwas5.5percentabovetheaverageearningsofthetotalmanufacturingsectorinHawaiibutabout18.3percentbelowtheU.S.averageforthesamegroup.
AsshowninTable24,boththeplasticsandrubberproductssubgroupandthetextilemillsandtextileproductmillssubgroupemployedabout300jobsin2015.Papermanufacturingonlyhad84jobsbuthadthehighestannualearnings($68,170). Plasticsandrubberproductshadthesecondhighestannualearnings($58,162),followedbythetextilemillsandtextileproductmillssubgroup($41,692).
From2005to2015,thepapermanufacturingsubgrouplost120jobs,thetextilemillsandtextileproductmillssubgrouplost99jobs,andtheplasticsandrubberproductssubgrouplost6jobs.
2005 2015 Hawaii U.S. Hawaii U.S.
Competitive
Share 2005‐
2015
Location
Quotient
(LQ),
2015
Change
in LQ,
2005‐
2015
Transportation Equipment Manufacturing 574 814 3.6% ‐1.0% 87,773 88,081 4.6% 0.11 0.04
Ship and Boat Building 516 780 4.2% ‐1.1% 87,962 76,223 5.3% 1.15 0.47
Other Transportation Equipment Manufacturing 58 34 ‐5.3% ‐1.0% 83,449 89,219 ‐4.2% 0.00 0.00
Performance Metrics
Group & Industry
Hawaii JobsAvg. Job Growth
Rate, 2005‐2015
Annual Earnings,
2015

42|P a g e
TABLE24.OTHERNONDURABLEGOODSMANUFACTURINGINDUSTRYGROUPEMPLOYMENT
Source:DBEDTcompilationbasedonEMSIdata.
WoodProductManufacturing
Woodproductmanufacturing inHawaii accounted for about 640 jobs or 3.4 percent of totalmanufacturing jobs in 2015. Since this group’s GDP per job was lower than the average of themanufacturingsector,itsshareofthemanufacturingsector’srealGDPin2014wasonly0.7percent.Atthenationallevel,thisgroup’sshareoftotalmanufacturingsectorjobsandrealGDPwere3.3percentand1.1percent,respectively.
AsshowninTable25,from2005to2015,jobsinthisgroupdecreasedinbothHawaiiandthenation.TheHawaiijobdecreaseof3.4percentperyearwasslightlybetterthanthe3.5percentdecreaseforthenation.However,duetodifferencesinthechangesofGDPperjob,Hawaii’srealGDPannualgrowthratefrom2005to2014wasanegative6.0percent,comparedtoanegative2.1percentgrowthforthenation.ThisgroupwaslessconcentratedinHawaiithantheU.S.overall.
Theaverageannualearningsofthisgroupwasthelowestamongallgroupsinthemanufacturingsector. The average earnings of $24,261 for this group was about 51.1 percent below the averageearningsofthewholemanufacturingsectorinHawaiiandabout49.7percentbelowtheU.S.averageforthesamegroup.
Thisgroupcanbeseparatedintofoursubgroups.Millworkhadthemostjobs(290jobs).Thiswas followed by other wood product (148 jobs), veneer, plywood, and engineered wood productmanufacturing (145 jobs), andsawmills andwoodpreservation (59 jobs). Averageannualearningsrangedfromabout$13,689to$54,009.From2005to2015,otherwoodproductlost129jobs,sawmillsandwoodpreservationlost89jobs,veneer,plywood,andengineeredwoodproductlost87jobs,onlymillworkadded37jobs.
2005 2015 Hawaii U.S. Hawaii U.S.
Competitive
Share 2005‐
2015
Location
Quotient
(LQ),
2015
Change
in LQ,
2005‐
2015
Other Nondurable Goods Manufacturing 967 741 ‐2.6% ‐2.6% 52,318 64,075 0.0% 0.12 0.00
Plastics and Rubber Products Manufacturing 350 343 ‐0.2% ‐1.6% 58,162 61,120 1.5% 0.10 0.02
Textile Mills and Textile Product Mills 413 314 ‐2.7% ‐4.9% 41,692 49,370 2.2% 0.27 0.06
Paper Manufacturing 204 84 ‐8.5% ‐2.6% 68,170 79,321 ‐5.9% 0.05 ‐0.04
Performance Metrics
Group & Industry
Hawaii JobsAvg. Job Growth
Rate, 2005‐2015
Annual Earnings,
2015

P a g e |43
TABLE25.WOODPRODUCTMANUFACTURINGINDUSTRYGROUPEMPLOYMENT
Source:DBEDTcompilationbasedonEMSIdata.
PetroleumandCoalProductsManufacturing
Petroleum and coal products manufacturing was the most capital intensive group in themanufacturingsector. ForHawaii, thisgroupwasmainlypetroleumrelatedand itaccounted for2.8percentofHawaii’smanufacturingsector jobs in2015. However,while the jobnumber is relativelysmall,thisgroupaccountedfor22.1percentthemanufacturingsector’srealGDPin2014.Atthenationallevel, this group accounted for only 0.9 percent of manufacturing jobs and 5.3 percent of themanufacturingsector’srealGDP.
AsshowninTable26,from2005to2015,jobsinthisgroupincreasedinHawaiibutdecreasedinthenation.However,thegrowthrateofrealGDPwasnegativeforbothHawaiiandthenationfrom2005to2014.ThenationalrealGDPannualgrowthrateofnegative2.7percentwasslightlylowerthanthenegative2.6percentforHawaii.
Theaverageannualearningsinthisgroupwasthehighestamongallmanufacturinggroups.Theaverageearningsof$167,531forthisgroupwas237.7percentabovetheaverageearningsofthewholemanufacturingsectorinHawaiiandabout1.0percentabovetheU.S.averageforthesamegroup.
Thisgroupcanbeseparatedintothreesubgroups.Petroleumrefineriesdominatedthegroupandaccountedforabout95percentofthejobsinthisgroup.ThissubgroupwasmoreconcentratedinHawaiithanthenation.From2005to2015,petroleumrefineriesadded66jobs.
TABLE26.PETROLEUMANDCOALPRODUCTSINDUSTRYGROUPEMPLOYMENT
Source:DBEDTcompilationbasedonEMSIdata.
2005 2015 Hawaii U.S. Hawaii U.S.
Competitive
Share 2005‐
2015
Location
Quotient
(LQ),
2015
Change
in LQ,
2005‐
2015
Wood Product Manufacturing 911 642 ‐3.4% ‐3.5% 24,261 48,255 0.1% 0.31 0.01
Millwork 253 290 1.4% ‐4.4% 22,178 48,644 5.8% 0.54 0.24
Other Wood Product Manufacturing 277 148 ‐6.1% ‐2.7% 13,689 42,373 ‐3.4% 0.22 ‐0.09
Veneer, Plywood, and Engineered Wood Product Manufacturing 232 145 ‐4.6% ‐4.8% 34,352 54,009 0.2% 0.39 0.01
Sawmills and Wood Preservation 148 59 ‐8.8% ‐2.4% 36,434 51,472 ‐6.4% 0.12 ‐0.11
Performance Metrics
Group & Industry
Hawaii JobsAvg. Job Growth
Rate, 2005‐2015
Annual Earnings,
2015
2005 2015 Hawaii U.S. Hawaii U.S.
Competitive
Share 2005‐
2015
Location
Quotient
(LQ),
2015
Change
in LQ,
2005‐
2015
Petroleum and Coal Products Manufacturing 436 523 1.8% ‐0.2% 167,531 165,867 2.0% 0.98 0.19
Petroleum Refineries 429 495 1.4% 0.0% 174,295 202,987 1.4% 1.51 0.21
Asphalt Paving, Roofing, and Saturated Materials Manufacturing 5 26 17.7% ‐1.6% 52,271 102,639 19.3% 0.21 0.17
Other Petroleum and Coal Products Manufacturing 0 5 NA 1.4% 53,561 112,973
Performance Metrics
Group & Industry
Hawaii JobsAvg. Job Growth
Rate, 2005‐2015
Annual Earnings,
2015

44|P a g e
FurnitureandRelatedProductManufacturing
FurnitureandrelatedproductmanufacturinginHawaiiaccountedfor520jobsor2.8percentoftotalmanufacturing jobs in2015. Since this group’sGDPper jobwas lower than theaverageof themanufacturingsector’sGDPper job, itsshareofthemanufacturingsector’srealGDPin2014was1.8percent. At thenational level, thisgroup’sshareofmanufacturingsector jobsandrealGDPwere3.2percentand1.3percent,respectively.
AsshowninTable27,from2005to2015,jobsdecreasedinbothHawaiiandtheU.S.Thenationaljobdecreaseof3.8percentperyearwashigherthanthe3.5percentdecreaseinHawaii.From2005to2014,realGDPalsodecreasedinbothHawaiiandthenation.The4.9percentdecreaseinnationalrealGDPwasbetterthanthe6.6percentdecreaseinHawaii’srealGDP.ThisgroupwaslessconcentratedinHawaiithanthenation.
TheaverageannualearningsforthisgroupwashigherthantheaverageearningsofHawaii’stotalmanufacturingsectorandtheU.S.averageannualearningsforthesamegroup.Theaverageearningsof$53,879forthisgroupwas8.6percentabovetheaverageearningsofthewholemanufacturingsectorinHawaiiandabout10.9percentabovetheU.S.averageforthesamegroup.
This group canbe separated into four subgroups. Household and institutional furniture andkitchencabinetaccountedfor409jobsor78.7percentofthejobsinthisgroup. Althoughithadthehighestaverageannualearningsof$66,610,mattressmanufacturinghadonly64jobsin2015.
From2005to2015,allthesubgroupslostjobs.Householdandinstitutionalfurnitureandkitchencabinetlostthemostjobs(160job),followedbyofficefurniture(36job),blindandsharemanufacturing(18job),andmattressmanufacturing(11jobs).
TABLE27.FURNITUREANDRELATEDPRODUCTINDUSTRYGROUPEMPLOYMENT
Source:DBEDTcompilationbasedonEMSIdata.
2005 2015 Hawaii U.S. Hawaii U.S.
Competitive
Share 2005‐
2015
Location
Quotient
(LQ),
2015
Change
in LQ,
2005‐
2015
Furniture and Related Product Manufacturing 745 520 ‐3.5% ‐3.8% 53,879 48,572 0.2% 0.26 0.01
Household and Institutional Furniture and Kitchen Cabinet Manufacturing 569 409 ‐3.3% ‐4.3% 52,421 44,286 1.1% 0.32 0.04
Mattress Manufacturing 75 64 ‐1.6% ‐2.9% 66,610 53,001 1.3% 0.57 0.08
Office Furniture (including Fixtures) Manufacturing 66 30 ‐7.6% ‐2.3% 49,893 57,878 ‐5.3% 0.06 ‐0.04
Blind and Shade Manufacturing 34 17 ‐7.0% ‐5.3% 47,889 48,918 ‐1.7% 0.27 ‐0.05
Performance Metrics
Group & Industry
Hawaii JobsAvg. Job Growth
Rate, 2005‐2015
Annual Earnings,
2015

P a g e |45
ChemicalManufacturing
ChemicalmanufacturinginHawaiiaccountedfor429jobsor2.3percentoftotalmanufacturingjobsin2015.Sincethisgroup’sGDPperjobwashigherthantheaverageofthemanufacturingsector,itsshareof themanufacturing sector’s realGDPwas7.6percent in2014. The roleof thisgroupat thenationallevelwasmuchmoreimportantthanitsroleinHawaii. Nationally,thisgroupaccountedforabout6.5percentofthemanufacturingsector’sjobsand15.6percentofthesector’srealGDP.
AsshowninTable28,from2005to2015,jobsinthisgroupdecreasedinbothHawaiiandthenation.ThenationaljobdecreasewaslessseverethanthatofHawaii.DuetoslowerproductivitygrowthintheU.S.,therealGDPgrowthratewaslowerforthenationthanforHawaii.From2005to2014,realGDPincreased0.4percentperyearforthenation,comparedwitha3.5percentgrowthforHawaii.
The average annual earnings in this group was above the average earnings of Hawaii’smanufacturingsector,butbelowtheU.S.averageannualearningsforthisgroup.Theaverageearningsof$58,852forthisgroupwas18.6percentabovetheaverageearningsofthetotalmanufacturingsectorinHawaii,butabout50.5percentbelowtheU.S.averageforthesamegroup.
Thisgroupcanbeseparatedintofivesubgroups. Basicchemicalmanufacturinghadthemostjobs (134 job), followed by soap, cleaning compound, and toilet preparation (131 jobs), andpharmaceuticalandmedicine(64jobs).Theothertwosubgroupshadabout50jobs.AllthesubgroupswerelessconcentratedinHawaiithanforthenation.
From2005to2015,pharmaceuticalandmedicinemanufacturinglostthemostjobs(lost49jobs),followedbybasic chemicalmanufacturing (lost25 jobs), andother chemicalmanufacturing (lost20jobs).Onlythesoap,cleaningcompound,andtoiletpreparationsubgroupadded23jobs.
TABLE28.CHEMICALMANUFACTURINGINDUSTRYGROUPEMPLOYMENT
Source:DBEDTcompilationbasedonEMSIdata.
2005 2015 Hawaii U.S. Hawaii U.S.
Competitive
Share 2005‐
2015
Location
Quotient
(LQ),
2015
Change
in LQ,
2005‐
2015
Chemical Manufacturing 509 429 ‐1.7% ‐0.6% 58,852 118,964 ‐1.1% 0.11 ‐0.01
Basic Chemical Manufacturing 159 134 ‐1.7% ‐0.2% 75,226 122,812 ‐1.5% 0.19 ‐0.03
Soap, Cleaning Compound, and Toilet Preparation Manufacturing 107 131 2.0% 0.2% 33,523 79,979 1.7% 0.23 0.04
Pharmaceutical and Medicine Manufacturing 112 64 ‐5.5% ‐0.2% 74,986 156,982 ‐5.3% 0.05 ‐0.03
Other Chemical manufacturing 73 52 ‐3.3% ‐1.5% 33,993 94,388 ‐1.8% 0.04 ‐0.01
Pesticide, Fertilizer, and Other Agricultural Chemical Manufacturing 57 48 ‐1.7% ‐0.8% 87,592 103,879 ‐0.9% 0.26 ‐0.02
Performance Metrics
Group & Industry
Hawaii JobsAvg. Job Growth
Rate, 2005‐2015
Annual Earnings,
2015

46|P a g e
VII. Conclusions
Manufacturing is an important sector of Hawaii’s economy. The local manufacturing sectorprovidesqualityproductsforthelocalpopulation,mitigatestheriskoftransportationdisruptions,aswellasreduceshighshippingcostsfromthemainlandandforeigncountries.
In both Hawaii and the U.S. overall, the manufacturing sector’s share of total jobs has beendecreasing.From1998to2015,themanufacturingsector’sshareoftotaljobsforthenationdecreasedabout4.5percentagepoints,from11.4percentto6.9percentandforHawaiithesharedecreasedabout0.5 of a percentage point from 2.6 percent to 2.1 percent. This decrease was due to a shift ofmanufacturingtolowerwagecountriesandalsoalaborproductivityincreaseintheU.S.
Nationally,laborproductivityincreasedsubstantiallyinthemanufacturingsector,whichpartiallycontributedtoadecreaseintheshareofmanufacturingjobs. From1998to2015,themanufacturingsector’s share of realGDP in theU.S. decreased 0.4 of a percentagepoint from12.3 percent to 11.9percent. InHawaii,themanufacturingsector’sshareofrealGDPdecreased0.2ofapercentagepoint,from 1.9 percent to 1.7 percent during this same period. Hawaii’s manufacturing sector laborproductivitywas also lowerwhen comparedwithHawaii’s total industries combined. However, thegrowth rate of the Hawaii’s manufacturing sector’s labor productivity was higher than that of allindustriescombined.
Theanalysisshowedthata68percentofHawaii’smanufacturingjobswereinnondurablegoodsversus32percentfordurablegoods.Thelargestgroupfornondurablegoodswasfoodandbeveragemanufacturing,whichaccountedforabout8,700jobsoralmosthalfofthetotalmanufacturingjobsinHawaiiin2015.Thiswasfollowedbytheapparel,leatherandalliedproductgroupandtheprintingandrelatedsupportactivitiesgroup,eachofwhichhadmorethan1,100workers.
The four‐quadrant performance map categorized each industry group by their growth,competitivenessandconcentrationintheeconomy.Theindustrygroupsintheemergingcategorywerecomposedof transportation equipment,petroleumand coal products (mostlypetroleumrefinery forHawaii),foodandbeverageandtobacco,otherdurablegoods,andnonmetallicmineralproduct.Thesegroups accounted for about 65.3 percent of the totalmanufacturing sector jobs in 2015. The sevenmanufacturingindustrygroupsthatlostjobsinthe2005to2015periodfellintothedecliningquadrantof theperformancemap. Thesegroupsaccounted for about34.7percentof the totalmanufacturingsectorjobsin2015.Therewerenomanufacturingindustrygroupthatfellintothebase‐growthindustryandtransitioningindustryforthe2005to2015period.
Inspiteofthecomparativedisadvantages,thereareseveralareaswhereHawaiihascomparativeadvantagesthatcanbeleveragedformanufacturing.Thefirstisproximitytoalargedefensemarket.Inthe2015 fiscal year, theDepartmentofDefensehad$1.8billionprime contract inHawaii. Industrygroups suchas shipandboatbuilding, foodandbeverage, andpetroleumsupplied themilitarywithlocallymanufacturedproducts.Thesecondadvantageisthetouristmarketofapproximately8.5millionvisitorsannually.Thismarketspent$15.2billiondollarsin2015andthereistremendouspotentialforapparelandtextiles, foodrelated,andothergroupsthattargetthismarket. Thethirdadvantage isastrong research and development base that includes universities, technology commercializationprograms, and private industry. The University of Hawaii has programs in engineering, computerscience, and biotechnology and this provides the research as well as the workforce required fortechnologyrelatedmanufacturing.Inlookingtowardsthefuture,Hawaiihastheresourcestoexpanditsmanufacturingbase.