performance of systems : evaluation results - eawag.ch · tn , 6 py, 2 ap, 1 nepal, 3 in-depth...
TRANSCRIPT

Presented by: Prof. Ligy Philip IIT Madras
Performance of systems : Evaluation Results


TN , 6
PY, 2
AP, 1
Nepal, 3
In-depth Sampling
Collecting Inlet sample at every 2 hours
Collection of treated sample at every 2 hours
Comparison of inlet and outlet
Complete treatment units sampling at 8pm
ABR Based Systems
Composite sampling
Grab sampling
Other treatment systems
TN , 15
MH, 1AP, 2
KA, 8
Nepal, 2
SBR, 4
MBBR, 9
ASP/EA, 7
MBR, 2
Soil Based Filter, 5
EADOX, 1

Parameter analyzed
HACH on-filed kits Factsheet
On Site
pH
Dissolved Oxygen
Temperature
Turbidity
Off Site
Organics (BOD, COD)
Solids (TSS)
Nutrients (TN, AN, TP)
Fecal Coliform
Oil and Grease

Overall Performance – Biochemical oxygen demand
5

6
Overall Performance – Total suspended solids

SBR and MBBR showed removal efficiency of 90-92% for BOD and 88-90% for COD
ABR based systems showed a removal efficiency of 60-96% for COD and 70-98% for BOD.
Suspended solids concentration in the treated water are meeting the standard limit (CPCB, 2017) for the following sites;
MBBR in commercial complexes,
MBR in commercial complex,
SIBF in institute
ABR based systems in institutes and residential_2
.
Removal of Organics and Suspended solids
7

8
Overall Performance – Ammoniacal Nitrogen

Nutrients removal from wastewater takes place by two processes; namely assimilation and dissimilation i.e., nitrification and denitrification
It was seen that amongst the 40 treatment systems evaluated, the maximum nutrients removal and meeting the standard limit (<5 mg/L – CPCB 2015) was seen for the
• MBBR in commercial_2
• MBBR-CAACO in commercial and institute building,
• MBR in commercial complex and
• SIBF in Institute
The least removal of AN was seen for the ABR based unit operated in public toilet_1.
Removal of Ammoniacal Nitrogen
9

10
Overall Performance – Fecal Coliform

4 to 5 log reduction of the fecal coliform in the SBR and MBBR system
MBBR systems where the operation and maintenance was not proper, a low FC removal was observed.
Amongst the ABR based units, better performance was observed for the unit operated in Institute_2 with 5 log reduction.
Higher coliform reduction was observed in places where chlorination was proper.
None of the treatment systems was able to meet the CPCB, 2017 standard limit (1000 MPN/ 100 mL).
Removal of Fecal coliform
11

Performance of Biological unit – BOD

Performance of Biological unit – AN

Performance of Biological unit – FC

Performance of tertiary unit – BOD
Effluent concentration after Biological Unit Effluent concentration after tertiary unit

Performance of tertiary unit – AN
Effluent concentration after Biological Unit Effluent concentration after tertiary unit

SBR-
d-Re
s_1
SBR-
fd-R
es_2
SBR-
f-Com
_1SB
R-f-I
nst_
1
MBB
R-fd
-Res
_1M
BBR-
d-Re
s_2
MBB
R-f-I
nst_
1M
BBR-
fd-C
om_1
MBB
R-fd
-Com
_2M
BBR(
CAAC
O)-fd
-Com
_3M
BBR(
CAAC
O)-f-
Inst_
2FA
B(M
BBR)
-fd-C
om_4
FBBR
(MBB
R)-f-
Com
_5
EA
-f-Re
s_1
EA-fd
-Res
_2EA
(ASP
)-f-In
st_1
EA(A
SP)-f
d-Re
s_3
EA(A
SP)-f
-Res
_4EA
(ASP
)-f-R
es_5
Oxida
tion
Ditch
-Inst_
1
M
BR-f-
Com
_1M
BR-f-
Res_
1
SI
BF-f-
Inst_
1SP
ISF-
Low_
Res_
1SB
T-In
st_1
CW -
Inst_
1CW
- M
un_1
AB
R ba
sed-
Inst_
1AB
R ba
sed-
Inst_
2AB
R ba
sed-
Inst_
3AB
R ba
sed-
PT_1
ABR
base
d-PT
_2AB
R ba
sed-
f-Com
_1AB
R ba
sed-
Com
_2AB
R ba
sed-
Com
_3AB
R ba
sed-
Com
_4AB
R ba
sed-
Low_
Res_
1AB
R ba
sed-
Low_
Res_
2AB
R ba
sed-
Mun
_1
EA
DOX-
fd-R
es_1
10
100
1000
10000
100000
1000000
1E7
1E8
1E9
Feca
l Col
iform
Con
cent
ratio
n (M
PN/10
0 mL)
Biological Outlet Tertiary Outlet
CPCB, 2017
Performance of tertiary unit – FC

ABR
base
d-Ins
t_1
ABR
base
d-Ins
t_2
ABR
base
d-Ins
t_3
ABR
base
d-PT
_1
ABR
base
d-PT
_2
ABR
base
d-f-C
om_1
ABR
base
d-Co
m_2
ABR
base
d-Co
m_3
ABR
base
d-Co
m_4
ABR
base
d-Lo
w_Re
s_1
ABR
base
d-Lo
w_Re
s_2
ABR
base
d-Mu
n_1
0
20
40
60
80
100
Design Flow Minimum Observed Flow Maximum Observed Flow
Flow
Rate
(cu.
m/ d
ay)
Treatment Capacities – ABR based Over loaded

SBR-
d-Re
s_1
SBR-
fd-Re
s_2
SBR-
f-Com
_1SB
R-f-I
nst_1
MB
BR-fd
-Res
_1MB
BR-d
-Res
_2MB
BR-f-
Inst_1
MBBR
-fd-C
om_1
MBBR
-fd-C
om_2
MBBR
(CAA
CO)-f
d-Co
m_3
MBBR
(CAA
CO)-f
-Inst_
2FA
B(MB
BR)-f
d-Co
m_4
FBBR
(MBB
R)-f-
Com_
5
EA-f-
Res_
1EA
-fd-R
es_2
EA(A
SP)-f
-Inst_
1EA
(ASP
)-fd-
Res_
3EA
(ASP
)-f-R
es_4
EA(A
SP)-f
-Res
_5Ox
idatio
n Ditc
h-Ins
t_1
MBR-
f-Com
_1MB
R-f-R
es_1
SI
BF-f-
Inst_1
SPIS
F-Lo
w_Re
s_1
SBT-
Inst_1
CW -
Inst_1
CW -
Mun_
1
EADO
X-fd-
Res_
1
050
100150200250300350400450500550600
Design Flow Minimum Observed Flow Maximum Observed Flow
Flow
Rate
(cu. m
/ day
)Treatment Capacities – Other SSTs
Over loaded

DESIGN CRITERIA – ABR Based system
01
23
45
6
20
40
60
80
100
0.00.2
0.40.6
0.81.0
1.21.4
Percentage Reduction
Per
cent
age
Red
uctio
n
OLR (kg
/ cu. m
/ day)
HRT (days)
Major Findings
• ABR showed better removal at HRT of 2 – 4 days and at OLR of 0.4-1.2 kg/cu. m/ day.
•HRT and OLR increases – Showed better removal

DESIGN CRITERIA – SBR Based system
02
46
810
1214
16
20
40
60
80
100
0.00.5
1.01.5
2.02.5
3.03.5
Percentage Reduction
Per
cent
age
Red
uctio
n
OLR (kg
/ cu. m
/ day)
HRT (hours)
Major Findings
• SBR showed better removal at HRT of 4-6 hours and at OLR of 1.4-3.0 kg/cu. m/ day.
•At same HRT as OLR increases – SBR showed slightly better removal

DESIGN CRITERIA – MBBR Based system
02
46
810
1214
16
20
40
60
80
100
02
46
810
1214
Percentage Reduction
Per
cent
age
Red
uctio
n
OLR (kg
/ cu. m
/ day)
HRT (hours)
Major Findings
• MBBR showed better removal at HRT of 4-6 hours and at OLR of 1.0-3.0 kg/cu. m/ day.
•At same HRT as OLR increases – MBBR showed slightly better removal

Design criteria – EA/ASP based system
0 48
1216
2024
2832
20
40
60
80
100
01
23
45
67
Percentage Reduction
Per
cent
age
Red
uctio
n
OLR (kg
/ cu. m
/ day)
HRT (hours)
Major Findings
• EA/ASP showed better removal at HRT of 15-22 hours and at OLR of <1.0 kg/cu. m/ day.
•At same HRT as OLR increases – EA/ASP showed lesser removal

SBR-
d-Res
_1SB
R-fd-
Res_
2MB
BR-fd
-Res
_1MB
BR-d-
Res_
2MB
BR-fd
-Com
_1MB
BR-fd
-Com
_2MB
BR(C
AACO
)-fd-C
om_3
FAB(
MBBR
)-fd-C
om_4
EA-fd
-Res
_2EA
(ASP
)-fd-R
es_3
EADO
X-fd-
Res_
1
SB
R-f-C
om_1
SBR-
f-Inst_
1MB
BR-f-
Inst_1
MBBR
(CAA
CO)-f
-Inst_
2FB
BR(M
BBR)
-f-Co
m_5
EA-f-
Res_
1EA
(ASP
)-f-In
st_1
EA(A
SP)-f
-Res
_4EA
(ASP
)-f-R
es_5
MBR-
f-Com
_1MB
R-f-R
es_1
Oxida
tion D
itch-I
nst_1
SIBF
-f-Ins
t_1SP
ISF-
Low_
Res_
1SB
T-Ins
t_1AB
R ba
sed-I
nst_1
ABR
base
d-Ins
t_2AB
R ba
sed-I
nst_3
ABR
base
d-PT_
1AB
R ba
sed-P
T_2
ABR
base
d-f-C
om_1
ABR
base
d-Com
_2AB
R ba
sed-C
om_3
ABR
base
d-Com
_4AB
R ba
sed-L
ow_R
es_1
ABR
base
d-Low
_Res
_2AB
R ba
sed-M
un_1
CW - I
nst_1
CW - M
un_1
10
100
1000
10000
100000
1000000
1E7
1E8
1E9
1E10 Raw(f) Treated (f) Raw(d) Treated (d)
Feca
l coli
form
conc
entra
tion (
MPN/
100 m
L)Comparison of FC removal with / without
disinfection steps
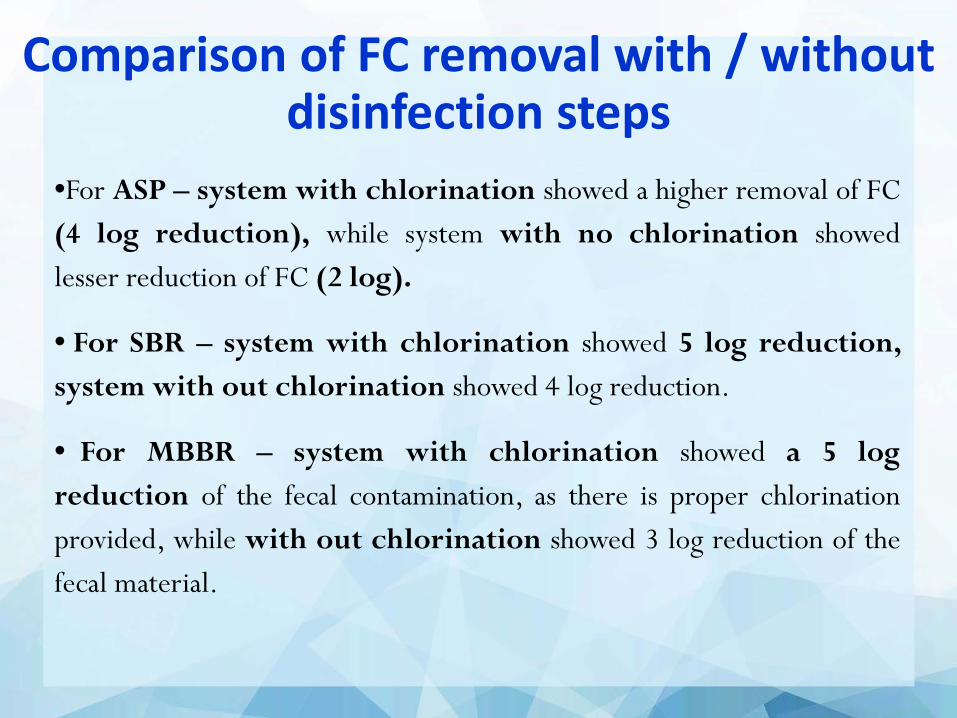
•For ASP – system with chlorination showed a higher removal of FC (4 log reduction), while system with no chlorination showed lesser reduction of FC (2 log).
• For SBR – system with chlorination showed 5 log reduction, system with out chlorination showed 4 log reduction.
• For MBBR – system with chlorination showed a 5 log reduction of the fecal contamination, as there is proper chlorination provided, while with out chlorination showed 3 log reduction of the fecal material.
Comparison of FC removal with / without disinfection steps

Performance of various technologies - BOD
EA-f-
Res_
1
EA-fd
-Res
_2
EA(A
SP)-f
-Inst_
1
EA(A
SP)-f
d-Re
s_3
EA(A
SP)-f
-Res
_4
EA(A
SP)-f
-Res
_5
Oxida
tion D
itch-
Inst_1
0
20
40
60
80
100
Perc
enta
ge R
edut
ion
Round 1 Round 2 Round 3Biochemical Oxygen Demand
ABR
base
d-Ins
t_1
ABR
base
d-Ins
t_2
ABR
base
d-Ins
t_3
ABR
base
d-PT
_1
ABR
base
d-PT
_2
ABR
base
d-f-C
om_1
ABR
base
d-Co
m_2
ABR
base
d-Co
m_3
ABR
base
d-Co
m_4
ABR
base
d-Lo
w_Re
s_1
ABR
base
d-Lo
w_Re
s_2
ABR
base
d-Mu
n_1
0
20
40
60
80
100
Perc
enta
ge R
edut
ion
Round 1 Round 2 Round 3Biochemical Oxygen Demand
SBR-d-Res_1 SBR-fd-Res_2 SBR-f-Com_1 SBR-f-Inst_10
20
40
60
80
100
Perc
enta
ge R
edut
ion
Round 1 Round 2 Round 3Biochemical Oxygen DemandMB
BR-fd
-Res
_1
MBBR
-d-Re
s_2
MBBR
-f-Ins
t_1
MBBR
-fd-C
om_1
MBBR
-fd-C
om_2
MBBR
(CAA
CO)-f
d-Com
_3
MBBR
(CAA
CO)-f
-Inst_
2
FAB(
MBBR
)-fd-C
om_4
FBBR
(MBB
R)-f-
Com_
5
0
20
40
60
80
100
Perc
entag
e Red
ution
Round 1 Round 2 Round 3Biochemical Oxygen Demand

Performance of various technologies - AN AB
R ba
sed-
Inst_1
ABR
base
d-Ins
t_2
ABR
base
d-Ins
t_3
ABR
base
d-PT
_1
ABR
base
d-PT
_2
ABR
base
d-f-C
om_1
ABR
base
d-Co
m_2
ABR
base
d-Co
m_3
ABR
base
d-Co
m_4
ABR
base
d-Lo
w_Re
s_1
ABR
base
d-Lo
w_Re
s_2
ABR
base
d-Mu
n_1
0
20
40
60
80
100Ammoniacal Nitrogen
Perc
enta
ge R
educ
tion
Round 1 Round 2 Round 3
SBR-d-Res_1 SBR-fd-Res_2 SBR-f-Com_1 SBR-f-Inst_10
20
40
60
80
100Ammoniacal Nitrogen
Perc
enta
ge R
educ
tion
Round 1 Round 2 Round 3MB
BR-fd
-Res
_1
MBBR
-d-Re
s_2
MBBR
-f-Ins
t_1
MBBR
-fd-C
om_1
MBBR
-fd-C
om_2
MBBR
(CAA
CO)-f
d-Com
_3
MBBR
(CAA
CO)-f
-Inst_
2
FAB(
MBBR
)-fd-C
om_4
FBBR
(MBB
R)-f-
Com_
50
20
40
60
80
100Ammoniacal Nitrogen
Perc
entag
e Red
uctio
n
Round 1 Round 2 Round 3
EA-f-
Res_
1
EA-fd
-Res
_2
EA(A
SP)-f
-Inst
_1
EA(A
SP)-f
d-Re
s_3
EA(A
SP)-f
-Res
_4
EA(A
SP)-f
-Res
_5
Oxid
atio
n Di
tch-
Inst
_1
0
20
40
60
80
100Ammoniacal Nitrogen
Perc
enta
ge R
educ
tion
Round 1 Round 2 Round 3

Performance of various technologies - FC AB
R ba
sed-
Inst_1
ABR
base
d-Ins
t_2
ABR
base
d-Ins
t_3
ABR
base
d-PT
_1
ABR
base
d-PT
_2
ABR
base
d-f-C
om_1
ABR
base
d-Co
m_2
ABR
base
d-Co
m_3
ABR
base
d-Co
m_4
ABR
base
d-Lo
w_Re
s_1
ABR
base
d-Lo
w_Re
s_2
ABR
base
d-Mu
n_110
100
1000
10000
100000
1000000
1E7
1E8
1E9
Feca
l Col
iform
(MPN
/ 100
mL)
Round 1 Raw Round 1 Treated Round 2 Raw Round 2 Treated Round 3 Raw Round 3 Treated
SBR-d-Res_1 SBR-fd-Res_2 SBR-f-Com_1 SBR-f-Inst_110
100
1000
10000
100000
1000000
1E7
1E8
1E9
Feca
l Col
iform
(MPN
/ 100
mL)
Round 1 Raw Round 1 Treated Round 2 Raw Round 2 Treated Round 3 Raw Round 3 Treated
MBBR
-fd-R
es_1
MBBR
-d-Re
s_2
MBBR
-f-Ins
t_1
MBBR
-fd-C
om_1
MBBR
-fd-C
om_2
MBBR
(CAA
CO)-f
d-Com
_3
MBBR
(CAA
CO)-f
-Inst_
2
FAB(
MBBR
)-fd-C
om_4
FBBR
(MBB
R)-f-
Com_
510
100
1000
10000
100000
1000000
1E7
1E8
1E9
1E10
Feca
l Coli
form
(MPN
/ 100
mL)
Round 1 Raw Round 1 Treated Round 2 Raw Round 2 Treated Round 3 Raw Round 3 Treated
EA-f-
Res_
1
EA-fd
-Res
_2
EA(A
SP)-f
-Inst
_1
EA(A
SP)-f
d-Re
s_3
EA(A
SP)-f
-Res
_4
EA(A
SP)-f
-Res
_5
Oxid
atio
n Di
tch-
Inst
_1
10
100
1000
10000
100000
1000000
1E7
1E8
1E9
1E10
Feca
l Col
iform
(MPN
/ 10
0 m
L)
Round 1 Raw Round 1 Treated Round 2 Raw Round 2 Treated Round 3 Raw Round 3 Treated

Institute in Bengaluru Commercial Complex in Bengaluru
Commercial Complex in Hosur, TN
Concerns and Observation
29
• Plastic materials Floating
• Clogged with plastic and scraps
• Man-hole are fixed and no opening – have to break open
• Few are corroded and brittle

Institute in Bengaluru Public toilet in Trichy Residential Area in
Nagpur
Commercial Complex -Bengaluru-KA
Institute Complex -Bengaluru-KA
Residentail Area, Kanchipuram
Issues in ABR
30
Problems Faced in PGF

• The plants which were maintained properly with the designed load performed better.
• Proper operation, maintenance with skilled operator are the most important aspects which decide the performance of a system, irrespective of the technology.
• Wastewater from SSTPs can be reclamation and reused.
• Nutrient removal in ABR based system are meager.
• Sludge management is another challenge faced by SSTPs.
• In urban dwellings, there is no separate space provided for SSTPs.
Major Findings from 4S project
31

Conclusion •Amongst the technologies evaluated
• SBR , MBR systems performed the best followed by MBBR system, and EA treatment units.
•ABR based systems (Settler-ABR-PGF) were also able to provide good quality treated effluents.
•For the areas with no land constraint whereas availability of uninterrupted power supply is a major problem, ABR based system with PGF seems to be a good option.
•Proper operation, maintenance of adequately designed plant and the availability of skilled operator is the mantra for success of any decentralized wastewater management system.

33