performance of private equity funds in central and eastern europe
TRANSCRIPT

© EBRD 2007, all rights reserved
Performance of Private Equity Performance of Private Equity Funds in Central and Eastern Funds in Central and Eastern
Europe and the CISEurope and the CIS
Data to 31 December 2006Data to 31 December 2006
© EBRD 2007, all rights reserved
EBRD’s portfolio of funds: 15 years of investing in the asset class
– Investment in 100+ funds
– 62 fund managers
– USD 2.3 billion in commitments (EUR 2 billion ) to funds with capital
of USD 10.3 billion (EUR 8.8 billion)
– 917 underlying investments; 632 exited
Largest PE Fund investment programme dedicated to the region
EBRD in Private EquityEBRD in Private Equity
Note: EBRD tracked portfolio only, excludes real estate funds, includes write-offs
1

© EBRD 2007, all rights reserved
EBRD DatabaseEBRD Database
Best available sample of PE performance in central and south east Europe (CSE) and Russia and CIS
Tracks all “gross” investments made by all EBRD invested funds as well as “net” returns to EBRD
Measured in both USD and EUR
Obligatory reporting by fund managers, scrutinised by EBRD
– reflects comprehensive performance
– no survivor bias resulting from only best fund managers reporting
2

© EBRD 2007, all rights reserved
DefinitionsDefinitions
EBRD Sponsored Funds or Donor Funds – funds established at EBRD's initiative in countries where no private sector funding was available for private equity funds. These funds are supported with significant donor grants, and EBRD investment represents usually over 90% of fund capital.
Institutional Quality Funds (IQs) – identified based on criteria established by Cambridge Associates. These include thecharacteristics of the investors in the fund, fund size relative to peers, and availability of data.
Survivor Funds – funds managed by managers who have or are expected to raise a follow-on fund.
3

© EBRD 2007, all rights reserved
RegionRegion
CSE countries – Albania, Bosnia & Herzegovina, Bulgaria, Croatia, Czech Republic, Estonia, Hungary, Latvia, Lithuania, FYR Macedonia, Poland, Romania, Serbia (including Kosovo), Montenegro, Slovak Republic and Slovenia
CIS Countries – Armenia*, Azerbaijan, Belarus*, Georgia, Kazakhstan, Kyrgyz Republic*, Moldova, Mongolia*, Russia, Tajikistan*, Turkmenistan, Uzbekistan*, and Ukraine
* There are currently no sub-investments in these countries.
4
© EBRD 2007, all rights reserved
Overview and Market EstimatesOverview and Market Estimates

© EBRD 2007, all rights reserved
2006 PE Investment as a % of GDP2006 PE Investment as a % of GDP
Source: EVCA and EBRD estimates
0.0%
0.2%
0.4%
0.6%
0.8%
1.0%
1.2%
1.4%
1.6%
Sweden
United K
ingdom
The Neth
erlan
dsFran
ceHungary
Europe
Czech
Rep
ublicBelg
iumIre
land
SpainDen
markItaly
German
ySwitz
erlan
dNorw
ayFinlan
dEsto
niaPolan
dKaz
akhsta
nBulgari
aPortu
galRoman
iaRuss
iaAustr
iaCro
atia
Ukraine
MoldovaSlove
niaGree
ce5
© EBRD 2007, all rights reserved
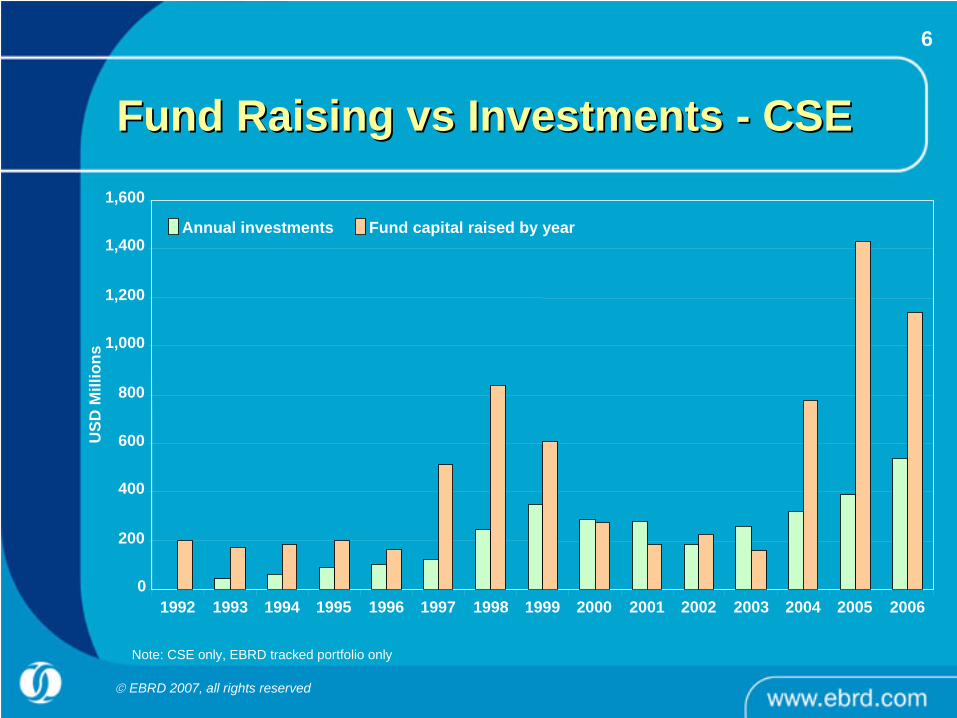
Fund Raising Fund Raising vsvs Investments Investments -- CSECSE
Note: CSE only, EBRD tracked portfolio only
0
200
400
600
800
1,000
1,200
1,400
1,600
1992 1993 1994 1995 1996 1997 1998 1999 2000 2001 2002 2003 2004 2005 2006
USD
Mill
ions
Annual investments Fund capital raised by year
6

© EBRD 2007, all rights reserved
Fund Raising Fund Raising vsvs Investments Investments -- CISCIS
0
100
200
300
400
500
600
700
800
1992 1993 1994 1995 1996 1997 1998 1999 2000 2001 2002 2003 2004 2005 2006
USD
Mill
ions
Annual Investments
Fund capital raised by year
7
Note: CIS only, EBRD tracked portfolio only

© EBRD 2007, all rights reserved
EBRD Net Portfolio at a GlanceEBRD Net Portfolio at a Glance
Note: CSE and CIS, EBRD tracked portfolio only
0
250
500
750
1,000
1,250
1,500
1,750
2,000
2,250
2,500
2,750
Funds Committed Paid-In NAV + Returned
USD
Mill
ions
NAV
Returned
8

© EBRD 2007, all rights reserved
EBRD Commitments Over TimeEBRD Commitments Over Time
0
50
100
150
200
250
300
1992 1993 1994 1995 1996 1997 1998 1999 2000 2001 2002 2003 2004 2005 2006
USD
Mill
ions
CSE Donor / EBRD Sponsored FundCSE Private Fund
Russia/CIS Donor / EBRD Sponsored FundRussia/CIS Private Fund
9

© EBRD 2007, all rights reserved
Net Returns DataNet Returns Data

© EBRD 2007, all rights reserved
EBRD Horizon Returns: All FundsEBRD Horizon Returns: All Funds
Returns as at 31 December 2006 One Year
Three Years
Five Years
Ten Years
Since Inception
USD EBRD Private Equity Portfolio* 46.9% 46.5% 28.8% 13.8% 13.2%
Cambridge Emerging Markets Venture Capital & Private Equity Index** 26.8% 24.6% 12.8% 6.1% N/A
S&P 500*** 12.3% 8.6% 6.8% 4.9% 5. 6%
EUR EBRD Private Equity Portfolio* 31.5% 45.5% 18.1% 11.3% 11.1%
EVCA All private Equity** 36.1% 13.0% 5.4% 11.0% 10.8%
FTSE Emerging Markets Eastern Europe*** 12.2% 39.8% 28.9% 19.9% N/A
Source: Cambridge Associates, EVCA, Bloomberg and EBRD* EBRD portfolio pooled end-to-end return, net of fees, expenses and carried interest. Excludes property funds, and includes liquidated partnerships** Pooled end-to-end return, net of fees, expenses, and carried interest.*** Calculated assuming the same investment (cash flow) pattern as EBRD's portfolio of private equity funds since the relevant horizon.
10

© EBRD 2007, all rights reserved
EBRD Horizon Returns EBRD Horizon Returns –– BreakdownBreakdown
Returns as at 31 December 2006 One Year
Three Years
Five Years
Ten Years
Since Inception
USD EBRD Private Equity Portfolio 46.9% 46.5% 28.8% 13.8% 13.2%
CSE 34.4% 36.9% 24.7% 11.4% 11.2%
Russia/CIS 60.5% 58.8% 33.4% 16.6% 15.8%
CSE Survivors 27.1% 36.2% 26.2% 15.4% 15.1%
Russia/CIS Survivors 43.4% 56.6% 36.70% 23.9% 23.1%
EUR EBRD Private Equity Portfolio 31.5% 45.5% 18.1% 11.3% 11.1%
CSE 20.3% 36.2% 14.9% 9.6% 9.6%
Russia/CIS 43.5% 57.5% 21.7% 13.4% 12.9%
CSE Survivors 13.8% 35.4% 16.4% 13.8% 13.7%
Russia/CIS Survivors 28.7% 54.7% 25.5% 19.8% 19.5%
11

© EBRD 2007, all rights reserved
EBRD Net Cash Flows from Funds EBRD Net Cash Flows from Funds
0
50
100
150
200
250
300
350
400
450
500
1992 1993 1994 1995 1996 1997 1998 1999 2000 2001 2002 2003 2004 2005 2006
USD
Mill
ions
Disbursements
Receipts
12

© EBRD 2007, all rights reserved
Net Vintage GroupsNet Vintage Groups
0.0
0.5
1.0
1.5
2.0
2.5
3.0
3.5
1992 1993 1994 1995 1996 1997 1998 1999 2000 2001 2002 2003 2004 2005 2006
TVPI
0%
5%
10%
15%
20%
25%
30%
35%
40%
IRR
TVPIDPIIRR
Note: TVPI = Total Value to Paid In, DPI = Distributions to Paid InNote: CSE and CIS
13

© EBRD 2007, all rights reserved
Gross Returns DataGross Returns Data

© EBRD 2007, all rights reserved
Snapshot: All Funds Snapshot: All Funds
$2,784m $2,009m
$305m
$1,348m
$5,187m
$2,281m
0
1,000
2,000
3,000
4,000
5,000
6,000
7,000
8,000
9,000
10,000
USD
Mill
ions
Fully Realised (FR Including WO)Partially Realised (PR)Unrealised (UR)
Overall 2.03x, 21.1%
FR 2.27x, 20.4%
PR 4.42x, 32.8%
UR 1.39x, 16.0%
Investments at Cost $4,595m
Total Value $9,319m
Excluding underlying investments of funds in which the EBRD sold on its interest
14

© EBRD 2007, all rights reserved
Snapshot: CSESnapshot: CSE
1,943m $1,386m
$174m
$439m
$3,599m
$1,654m
0
500
1,000
1,500
2,000
2,500
3,000
USD
Mill
ions
Fully Realised (FR Including WO)Partially Realised (PR)Unrealised (UR)
Overall 1.86x, 18.9%
FR 2.18x, 19.6%
PR 2.52x, 22.0%
UR 1.40x, 14.8%
Investments at Cost $3,214m
Total Value $5,981m
15
Excluding underlying investments of funds in which the EBRD sold on its interest

© EBRD 2007, all rights reserved
Snapshot: CIS Snapshot: CIS
$841m $ 624m
$130m
$909m
$1,588m
$627m
0
500
1,000
1,500
2,000
2,500
3,000
USD
Mill
ions
Fully Realised (FR Including WO)Partially Realised (PR)Unrealised (UR)
Overall 2.42x, 25.1%
FR 2.53x, 22.1%
PR 6.98x, 39.9%
UR 1.35x, 20.4%
Investments at Cost $1,381m
Total Value $3,338m
16
Excluding underlying investments of funds in which the EBRD sold on its interest

© EBRD 2007, all rights reserved
Snapshot: SurvivorsSnapshot: Survivors
$2,641m $1,882m
$271m
$1,186m
$4,270m
$1,608m
0
1,000
2,000
3,000
4,000
5,000
6,000
7,000
8,000
9,000
USD
Mill
ions
Fully Realised (FR Including WO)Partially Realised (PR)Unrealised (UR)
Overall 2.15x, 25.6%
FR 2.66x, 25.7%
PR 4.38x, 35.2%
UR 1.40x, 18.3%
Investments at Cost $3,761m
Total Value $8,097m
17
Excluding underlying investments of funds in which the EBRD sold on its interest

© EBRD 2007, all rights reserved
Snapshot: CSE SurvivorsSnapshot: CSE Survivors
$1,821m $1,271m
$151m
$360m
$3,104m
$1,246m
0
1,000
2,000
3,000
4,000
5,000
USD
Mill
ions
Fully Realised (FR Including WO)Partially Realised (PR)Unrealised (UR)
Overall 1.98x, 22.8%
FR 2.49x, 23.9%
PR 2.38x, 22.0%
UR 1.43x, 17.3%
Investments at Cost $2,668m
Total Value $5,285m
18
Excluding underlying investments of funds in which the EBRD sold on its interest

© EBRD 2007, all rights reserved
Snapshot: CIS Survivors Snapshot: CIS Survivors
$820m $611m
$120m
$826m
$1,165m
$362m
0
500
1,000
1,500
2,000
2,500
3,000
USD
Mill
ions
Fully Realised (FR Including WO)Partially Realised (PR)Unrealised (UR)
Investments at Cost $1,093m
Total Value $2,811m
Overall 2.57x, 32.2%
FR 3.22x, 30.6%
PR 6.90x, 43.5%
UR 1.34x, 21.5%
19
Excluding underlying investments of funds in which the EBRD sold on its interest

© EBRD 2007, all rights reserved
Aggregate USD Gross Results: CSEAggregate USD Gross Results: CSE
All Survivors IQ Private
TVPI IRR TVPI IRR TVPI IRR TVPI IRR
Fully Realised 2.18 19.6% 2.49 23.9% 2.24 20.4% 2.2 19.9%
Fully Realised and Partly Realised
2.21 19.8% 2.48 23.8% 2.27 20.5% 2.24 20.1%
All (including Unrealised) 1.86 18.9% 1.98 22.8% 1.89 19.7% 1.86 19.2%
20

© EBRD 2007, all rights reserved
Aggregate USD Gross Results: CISAggregate USD Gross Results: CIS
All Survivors IQ Private
TVPI IRR TVPI IRR TVPI IRR TVPI IRR
Fully Realised 2.53 22.1% 3.22 30.6% 3.06 27.4% 2.82 24.3%
Fully Realised and Partly Realised
3.3 25.5% 4.14 33.2% 4.01 30.7% 3.83 28.0%
All (including Unrealised) 2.42 25.1% 2.57 32.2% 2.5 30.4% 2.48 27.7%
21

© EBRD 2007, all rights reserved
Gross Cash Flow Gross Cash Flow -- CSECSEU
SD M
illio
ns
0
200
400
600
800
1,000
1,200
1,400
1,600
1993 1994 1995 1996 1997 1998 1999 2000 2001 2002 2003 2004 2005 2006
Annual Investments by funds (cash out)
Annual Proceeds to funds (cash in)
22

© EBRD 2007, all rights reserved
Gross Cash Flow Gross Cash Flow -- CISCIS
0
100
200
300
400
500
600
1992 1993 1994 1995 1996 1997 1998 1999 2000 2001 2002 2003 2004 2005 2006
USD
Mill
ions
Annual Investments by funds (cash out)
Annual Proceeds to funds (cash in)
23

© EBRD 2007, all rights reserved
Investments by Country Investments by Country –– to end 2006to end 2006
Central Asia4%
Western CIS andCaucasus**
2%
Bulgaria4%
Other*2%
Baltics4%
Hungary10%
Czech Republic andSlovakia
12%
Russia24%
Romania8%
Poland30%
* Other includes: Albania, Bosnia, Croatia, FYR Macedonia, Kosovo, Serbia and Montenegro, Slovenia** Western CIS and Caucasus includes: Azerbaijan, Georgia, Moldova and Ukraine*** Central Asia includes: Kazakhstan and TurkmenistanNote: CSE and CIS, since inception
24

© EBRD 2007, all rights reserved
Investments by Country Investments by Country -- 20062006
25
Ukraine5%
Russia30%
Poland27%
Romania5%
Kazakhstan8%
Other2%
Czech Republic17%
Bulgaria3%
Croatia3%
Other includes: Estonia, Hungary, Moldova, Slovenia
Note: CSE and CIS, vintage year 2006 only

© EBRD 2007, all rights reserved
Investments by Stage Over TimeInvestments by Stage Over Time
26
0
100
200
300
400
500
600
700
1992 1993 1994 1995 1996 1997 1998 1999 2000 2001 2002 2003 2004 2005 2006
Inve
stm
ent C
ost
USD
Mill
ions
ExpansionOther
Sec. Purchase / BuyoutSeed/Early Stage

© EBRD 2007, all rights reserved
Investments by Stage Over Time: CSEInvestments by Stage Over Time: CSEIn
vest
men
t Cos
t U
SD M
illio
ns
0
50
100
150
200
250
300
350
400
1993 1994 1995 1996 1997 1998 1999 2000 2001 2002 2003 2004 2005 2006
Expansion
OtherSec. Purchase / BuyoutSeed/Early Stage
27

© EBRD 2007, all rights reserved
Investments by Stage Over Time: CISInvestments by Stage Over Time: CISIn
vest
men
t Cos
t USD
Mill
ions
0
50
100
150
200
250
300
1993 1994 1995 1996 1997 1998 1999 2000 2001 2002 2003 2004 2005 2006
Expansion
Other
Sec. Purchase / Buyout
Seed/Early Stage
28

© EBRD 2007, all rights reserved
2006 Investment Stage 2006 Investment Stage vsvs EVCAEVCA
0%
10%
20%
30%
40%
50%
60%
70%
80%
90%
100%
CIS (EBRD) CSE (EBRD) EVCA
% o
f Inv
estm
ent C
ost
OtherSeed/Early StageSec. Purchase / BuyoutExpansion
29

© EBRD 2007, all rights reserved
2006 Investment Sectors 2006 Investment Sectors vsvs EVCAEVCA
0%
10%
20%
30%
40%
50%
60%
70%
80%
90%
100%
CIS (EBRD) CSE (EBRD) EVCA
% o
f Inv
estm
ent C
ost TIM
ServicesPrimary & EnergyPharma & MedicalManufacturingConsumer/RetailConstructionAgriculture & Forestry
30

© EBRD 2007, all rights reserved
Investments by Sector Investments by Sector –– to end 2006to end 2006
Note: CSE and CIS, since inception
Services22%
TIM29%
Wholesale & Retail11%
Agriculture & Forestry1%
Construction5% Consumer
14%
Pharma & Medical3%
Manufacturing10%
Primary & Energy5%
31

© EBRD 2007, all rights reserved
Investments by Sector Investments by Sector –– 20062006
Services40%
TIM40%
Wholesale & Retail5%
Construction6%
Primary & Energy3%
Manufacturing2%
Consumer4%
Note: CSE and CIS, vintage year 2006 only
32

© EBRD 2007, all rights reserved
Exits by Sector Exits by Sector –– to end 2006to end 2006
33
Note: fully realised investments, including partial realisations, excluding write offs, CSE and CIS
0
500
1000
1500
2000
2500
3000
Agriculture &Forestry
Construction Consumer Manufacturing Pharma &Medical
Primary &Energy
Services TIM Wholesale &Retail
Investment ProfitabilityInvestment Cost
USD
Mill
ions

© EBRD 2007, all rights reserved
Exits by Sector 2006 Exits by Sector 2006 -- CSECSE
34
0
50
100
150
200
250
300
350
400
450
Agriculture& Forestry
Construction Consumer Manufacturing Pharma& Medical
Primary & Energy
Services TIM Wholesale & Retail
USD
Mill
ions
Investment Profitability
Investment Cost
Note: fully realised investments, including partial realisations, excluding write offs, CSE only
© EBRD 2007, all rights reserved
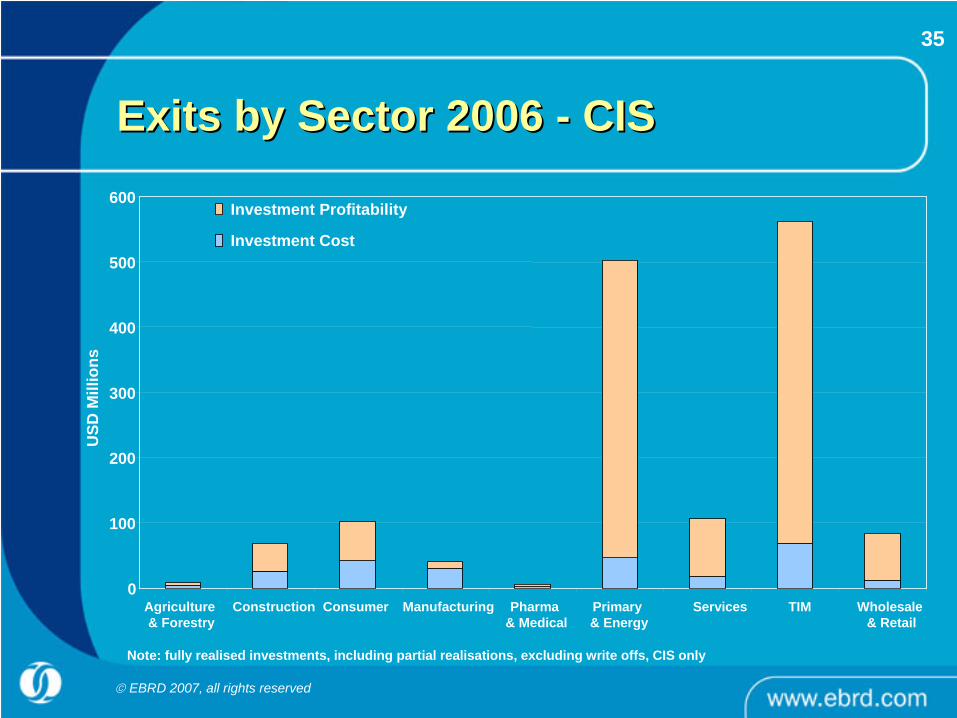
Exits by Sector 2006 Exits by Sector 2006 -- CISCIS
35
0
100
200
300
400
500
600
Agriculture & Forestry
Construction Consumer Manufacturing Pharma& Medical
Primary & Energy
Services TIM Wholesale & Retail
USD
Mill
ions
Investment Profitability
Investment Cost
Note: fully realised investments, including partial realisations, excluding write offs, CIS only

© EBRD 2007, all rights reserved
Exits by CountryExits by Country
0
200
400
600
800
1,000
1,200
1,400
1,600
1,800
Russia
Poland
Roman
iaCen
tral A
sia***
Czech
Rep
ublic
Hunga
ry
Slovak
ia
Bulgari
a
Other C
SE*
Estonia
Lithu
ania
Ukraine
Other C
IS**
USD
Mill
ions
Investment Profitability
Investment Cost
*Other CSE includes: Albania, Bosnia, Croatia, Kosovo, FYR Macedonia, Slovenia and Latvia**Other CIS includes: Azerbaijan, Moldova and Georgia***Central Asia includes: Kazakhstan and Turkmenistan All exits since inception (including fully realised, partially realised and write-offs)
36

© EBRD 2007, all rights reserved
Exit by Country Exit by Country -- 20062006
37
0
100
200
300
400
500
600
700
800
900
1,000
Russia CentralAsia*
Poland Bulgaria Romania Baltics** CzechRepublic
& Slovakia
Ukraine Hungary Other***
USD
Mill
ions
Investment Profitability
Investment Cost
***Other includes: Albania, Bosnia, Croatia, Kosovo, FYR Macedonia, Slovenia**Central Asia includes : Kazakhstan and Turkmenistan * Baltics includes; Estonia, Latvia, and Lithuania,Exits in 2006 for fully realised and partially realised deals (including write-offs)

© EBRD 2007, all rights reserved
Exits Over Time by Investment Stage Exits Over Time by Investment Stage -- CSECSE
0
100
200
300
400
500
600
700
800
900
1,000
1993 1994 1995 1996 1997 1998 1999 2000 2001 2002 2003 2004 2005 2006Exit Year
Exit
Proc
eeds
(USD
Mill
ions
)
ExpansionOtherSec. Purchase / BuyoutSeed/Early Stage
Note: Fully realised and partially realised investments (excludes write-offs)
38

© EBRD 2007, all rights reserved
Exits Over Time by Investment Stage Exits Over Time by Investment Stage -- CISCIS
0
100
200
300
400
500
600
700
800
900
1000
1997 1998 1999 2000 2001 2002 2003 2004 2005 2006
Exit Year
Exit
Proc
eeds
(USD
Mill
ions
)
Expansion
Sec. Purchase / Buyout
Seed/Early Stage
39
Note: fully realised and partially realised investments (excludes write-offs)

© EBRD 2007, all rights reserved
Type of Exits Over Time Type of Exits Over Time -- CSECSE
0
200
400
600
800
1000
1200
1400
1996 1997 1998 1999 2000 2001 2002 2003 2004 2005 2006
USD
Mill
ions
MBO
Other
Public Market
Trade Sale
Note: fully realised investments, including partial realisations, excluding write-offs
40

© EBRD 2007, all rights reserved
Type of Exits Over Time Type of Exits Over Time -- CISCIS
0
100
200
300
400
500
600
1997 1998 1999 2000 2001 2002 2003 2004 2005 2006
USD
Mill
ions
MBO
Other
Public Market
Trade Sale
Note: fully realised investments, including partial realisations, excluding write-offs
41

© EBRD 2007, all rights reserved
Performance by Exit TypePerformance by Exit Type
42
Note: CSE and CIS fully realised deals, including write-offs
0
500
1,000
1,500
2,000
2,500
3,000
3,500
Write Off MBO OTHER Public Market Trade Sale0.00
0.50
1.00
1.50
2.00
2.50
3.00
3.50
4.00
4.50
Investment Cost
Exit Proceeds & Cash Returns
Multiple
USD
Mill
ions

© EBRD 2007, all rights reserved
Performance by Investment Stage and Performance by Investment Stage and Exit TypeExit Type
43
Note: all fully realised and partially realised deals, excluding write-offs
Investment Stage
Exit TypeExpansion Sec Purchase
BuyoutSeed/Early
Stage
Sale to Management 1.75x 0.87x 0.71x
Flotation/SS 4.37x 2.88x 3.23x
Trade Sale 3.13x 3.30x 1.49x
Other 2.00x 2.41x 1.98x

© EBRD 2007, all rights reserved
Gross Vintages and Money MultiplesGross Vintages and Money Multiples
0
200
400
600
800
1000
1200
1992 1993 1994 1995 1996 1997 1998 1999 2000 2001 2002 2003 2004 2005 2006
USD
Mill
ions
Vintage Year
0
0.5
1
1.5
2
2.5
3
3.5
4
4.5
5Investment Cost All Total Investment Value AllTVPI All TVPI FR only
Note: Includes write-offs
44

© EBRD 2007, all rights reserved
Gross Vintages and Money Multiples: Gross Vintages and Money Multiples: CSECSE
45
0
100
200
300
400
500
600
700
800
900
1,000
1993 1994 1995 1996 1997 1998 1999 2000 2001 2002 2003 2004 2005 2006
USD
Mill
ions
Vintage Year
0.00
0.50
1.00
1.50
2.00
2.50
3.00
3.50
4.00Investment Cost All
Total Investment Value AllTVPI All
TVPI FR only
Note: Includes write-offs

© EBRD 2007, all rights reserved
Gross Vintages and Money Multiples: Gross Vintages and Money Multiples: CISCIS
46
0
100
200
300
400
500
600
1992 1993 1994 1995 1996 1997 1998 1999 2000 2001 2002 2003 2004 2005 2006
USD
Mill
ions
Vintage Year
0.00
1.00
2.00
3.00
4.00
5.00
6.00
7.00
8.00
9.00Investment Cost All Total Investment Value AllTVPI All TVPI FR only
Note: Includes write-offs

© EBRD 2007, all rights reserved
2006 Exits by Vintage2006 Exits by Vintage
47
0
100
200
300
400
500
600
700
800
900
1000
1993 1994 1995 1996 1997 1998 1999 2000 2001 2002 2003 2004 2005 2006
USD
Mill
ions
UR FR exited in 2006
FR 2006 4.06x
FR 2006 2.18x
FR 2006 3.07x
Note: CSE and CIS, all fully realised deals in 2006 (including write-offs)
© EBRD 2007, all rights reserved
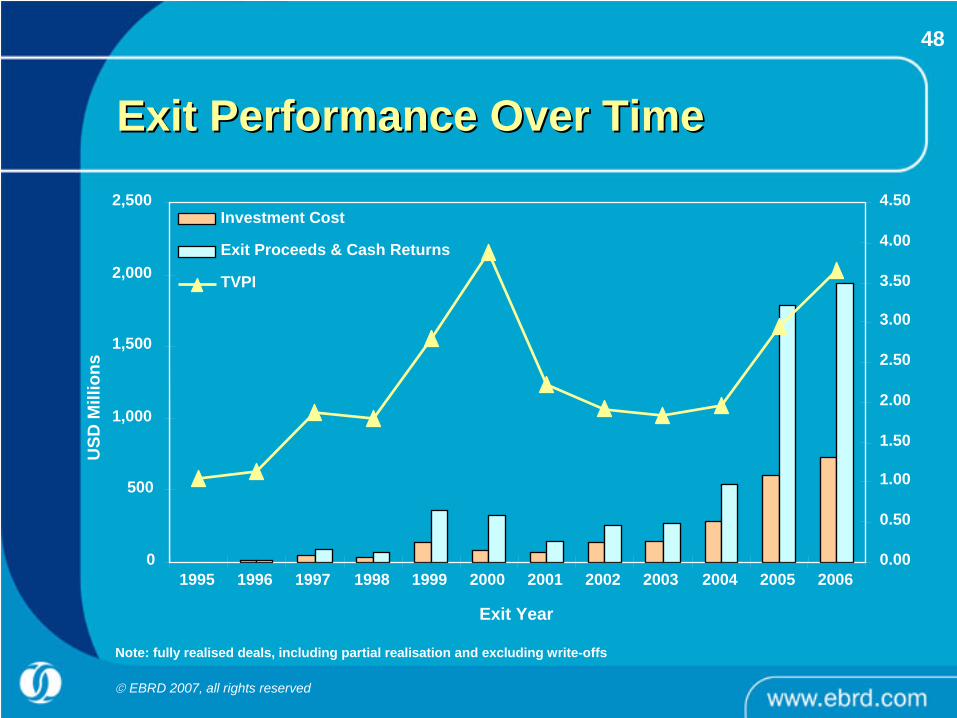
Exit Performance Over TimeExit Performance Over Time
48
USD
Mill
ions
0
500
1,000
1,500
2,000
2,500
1995 1996 1997 1998 1999 2000 2001 2002 2003 2004 2005 2006
Exit Year
0.00
0.50
1.00
1.50
2.00
2.50
3.00
3.50
4.00
4.50Investment Cost
Exit Proceeds & Cash Returns
TVPI
Note: fully realised deals, including partial realisation and excluding write-offs

© EBRD 2007, all rights reserved
Exit Performance Over Time: CSEExit Performance Over Time: CSE
49
0
200
400
600
800
1,000
1,200
1,400
1,600
1997 1998 1999 2000 2001 2002 2003 2004 2005 2006
USD
Mill
ions
Exit Year
0.00
1.00
2.00
3.00
4.00
5.00
6.00Investment CostExit Proceeds & Cash ReturnsTVPI
Note: fully realised deals, including partial realisation and excluding write-offs

© EBRD 2007, all rights reserved
Exit Performance Over Time: CISExit Performance Over Time: CIS
50
USD
Mill
ions
0
200
400
600
800
1,000
1,200
1999 2000 2001 2002 2003 2004 2005 2006Exit Years
0.00
1.00
2.00
3.00
4.00
5.00
6.00
7.00Investment CostExit Proceeds & Cash ReturnsTVPI
Note: fully realised deals, including partial realisation and excluding write-offs

© EBRD 2007, all rights reserved
Unrealised ValuesUnrealised Values
0
200
400
600
800
1000
1200
1400
Expansion Sec. Purchase / Buyout Seed/Early Stage
USD
Mill
ions
Investment Cost
Total Investment Value
CSE and CIS
51

© EBRD 2007, all rights reserved
Unrealised Values Unrealised Values -- CSECSE
100
200
300
400
500
600
1996 1997 1998 1999 2000 2001 2002 2003 2004 2005 2006Vintage Year
Inve
stm
ent C
ost U
SD M
illio
ns
Sum of Investment Cost
Sum of Total Investment Value
0
52

© EBRD 2007, all rights reserved
Unrealised Values Unrealised Values -- CISCISIn
vest
men
t Cos
t USD
Mill
ions
50
100
150
200
250
300
350
400
450
500
1998 1999 2000 2001 2002 2003 2004 2005 2006
Vintage Year
Sum of Investment Cost
Sum of Total Investment Value
53

© EBRD 2007, all rights reserved
Investor DataInvestor Data

© EBRD 2007, all rights reserved
Investors By Type Investors By Type -- TrendsTrends
0%
10%
20%
30%
40%
50%
60%
70%
80%
90%
100%
1992-2005 2006
Banks & Insurance
IFI and Gvt
Funds of Funds
Pension Funds
Corporate Investors
Other
54

© EBRD 2007, all rights reserved
Investors By Type By Region Investors By Type By Region -- 20062006
0
50
100
150
200
250
300
Other Banks CorporateInvestors
Fund of Funds
IFI & Govt Insurance PensionFunds
Private Investors
USD
Mill
ions
CSE FundsCIS Funds
Note: includes EBRD (in IFI/Govt)
55

© EBRD 2007, all rights reserved
Investors By Origin Over TimeInvestors By Origin Over Time
0
200
400
600
800
1000
1992 1993 1994 1995 1996 1997 1998 1999 2000 2001 2002 2003 2004 2005 2006
USD
Mill
ions
Other USA Europe
Note: Excludes EBRD (from Europe)
56

© EBRD 2007, all rights reserved
Copyright 2007 EBRD. All rights reservedCopyright 2007 EBRD. All rights reserved
This material is for the recipient’s private information. No part of this document may be reproduced or transmitted in any form or by any means, including photocopying and recording, without the written permission of the Bank. Such written permission must also be obtained before any part of this publication is stored in a retrieval system of any nature. While the information contained herein was compiled by the EBRD, we do not guarantee its accuracy or completeness. We accept no liability in relation to use of this information. Copyright 2007 European
Bank for Reconstruction and Development. All rights reserved.